
Abstract
Background. Robots designed for rehabilitation of the upper extremity after stroke facilitate high rates of repetition during practice of movements and record precise kinematic data, providing a method to investigate motor recovery profiles over time. Objective. To determine how motor recovery profiles during robotic interventions provide insight into improving clinical gains. Methods. A convenience sample (n = 22), from a larger randomized control trial, was taken of chronic stroke participants completing 12 sessions of arm therapy. One group received 60 minutes of robotic therapy (Robot only) and the other group received 45 minutes on the robot plus 15 minutes of translation-to-task practice (Robot + TTT). Movement time was assessed using the robot without powered assistance. Analyses (ANOVA, random coefficient modeling [RCM] with 2-term exponential function) were completed to investigate changes across the intervention, between sessions, and within a session. Results. Significant improvement (P < .05) in movement time across the intervention (pre vs post) was similar between the groups but there were group differences for changes between and within sessions (P < .05). The 2-term exponential function revealed a fast and slow component of learning that described performance across consecutive blocks. The RCM identified individuals who were above or below the marginal model. Conclusions. The expanded analyses indicated that changes across time can occur in different ways but achieve similar goals and may be influenced by individual factors such as initial movement time. These findings will guide decisions regarding treatment planning based on rates of motor relearning during upper extremity stroke robotic interventions.
Introduction
Analyzing the effects of a stroke rehabilitation intervention is typically achieved through comparing post- to pretraining values on outcome variables, but are there other clinically relevant analyses? Motor learning research has provided additional methods of interest. One relatively new method involves the continuous tracking of recovery profiles that can provide insight into rates of change of motor performance during an intervention.1-5 Here we investigate the continuous tracking of recovery using upper extremity robotic training as the intervention.
Robotic interventions have generally been classified as having beneficial effects for survivors of stroke, particularly for the arm.6-8 While some of these studies have demonstrated similar outcomes to concentrated conventional therapy,9-11 robots offer an unparalleled ability to deliver repetitive movements at high rates compared to conventional therapy. One such robot is the MIT-MANUS, which, in addition to providing a progressive target reaching training paradigm, also generates kinematic data through digital movement encoders that may provide insight into how the quantity of this robotic intervention affects motor recovery during the course of robot-aided therapy. It does this by requiring robot-unassisted evaluations periodically during the training that can be used to investigate the continuous time-course of the unassisted kinematic data generated by the MIT-MANUS across training. 5 By examining changes during an intervention, we can assess when the maximum benefit from robot training is gained and related questions regarding dosage and individual differences in recovery profiles.
The purpose of the study was to investigate how the kinematic data, specifically movement time, obtained during a MIT-MANUS robotic intervention, could characterize motor performance changes. Given our study sample, a parallel, but secondary, purpose was to assess whether a within-session regimen of 45 minutes of repetitive reaching training followed by 15 minutes of transition-to-task practice produced the same timeline of kinematic changes as a regimen of 60 minutes of repetitive robotic training. For both groups, we explored whether changes occurred within versus between sessions, and also when the progress of movement times changed, that is, reached a plateau. Better understanding of the time-course of improvements during an intervention will help guide clinical practice and prescription of robotic interventions for stroke survivors, as well as future clinical trials.
Methods
Participants
A convenience sample of 22 consecutively enrolled participants in a study of chronic stroke rehabilitation were included in this exploratory study. Participant demographics are included in Table 1. Participants met inclusion criteria if they were at least 6 months poststroke, had a Fugl-Meyer score between 7 and 38, and had adequate arm mobility to move a robotic manipulandum to target locations. The Joint University of Maryland/Baltimore Veterans Affairs Medical Center Institutional Review Board and the MIT Committee on the Use of Human Subjects as Experimental Subjects approved study procedures. All participants provided written informed consent.
Demographics.
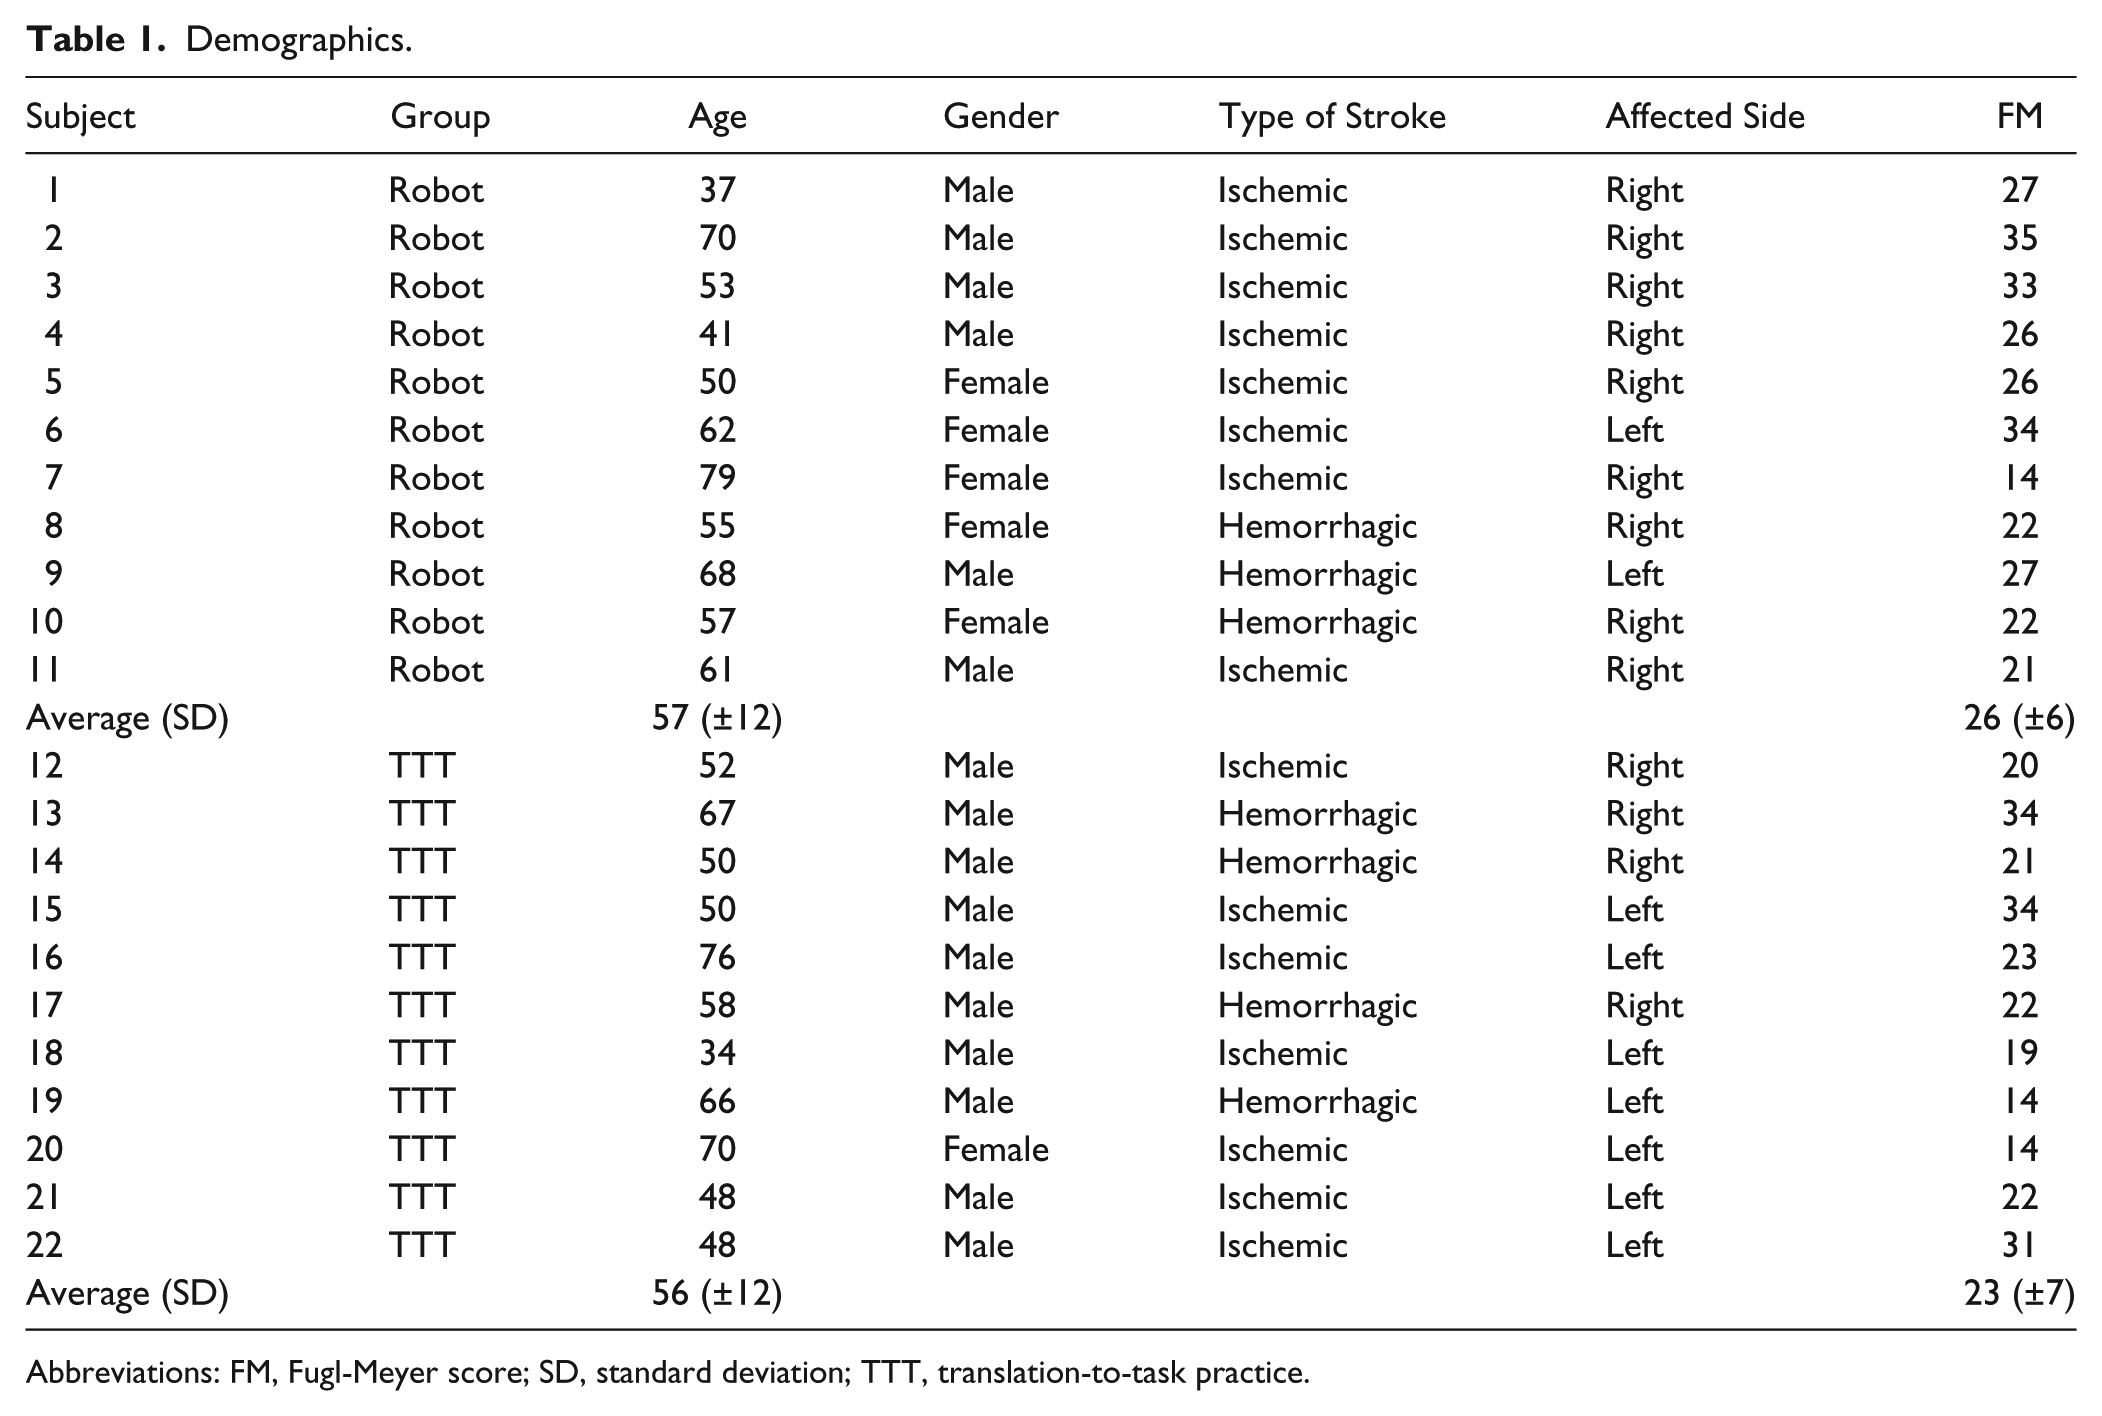
Abbreviations: FM, Fugl-Meyer score; SD, standard deviation; TTT, translation-to-task practice.
Procedure
As part of a larger 12-week randomized-control trial, participants completed 3 days of therapy per week for 4 weeks. Each session consisted of 60 minutes of therapy; one group (n = 11) received 60 minutes of robotic training (Robot only) and the other group (n = 11) received 45 minutes of robotic training followed by 15 minutes of transition-to-task practice (Robot + TTT). All of the robotic therapy was on the InMotion2 Arm robot (Interactive Motion Technologies, Cambridge, MA). Participants sat comfortably at a table with their stroke-affected arm resting in a molded cradle with the hand around the manipulandum handle. Participants moved the handle across a horizontal plane to control the position of a cursor in a 2D workspace to hit 8 equidistantly spaced targets around a circle. During the therapy, the robots were in the “active-assist” mode such that the robot provided assistance as necessary if the participant was unable to reach a target. The therapy consisted of 320 movement repetitions per block, and the robot graded the task difficulty by changing the time allocated to complete the reaching movement and the movement guidance by altering the amount of wall-stiffness during the treatment.
The TTT practice consisted of 15 minutes of therapist-guided practice of patient-specific tasks that involved use of the whole arm in 3D space. These functionally based activities were performed in a sitting position and included weight bearing activities to promote stabilization and tabletop activities to promote bilateral and unilateral dexterity. Examples of tasks included lifting a cup, reaching with a brush, and wiping a countertop. Activity progression was based on objective measures such as independence with lifting, distance of reach, and number of repetitions completed in the set activity time. A stop watch was used to time each of the 2 prescribed TTT activities for 7.5 minutes of task training; manual assistance was provided as necessary. The same therapist provided all of the robotic and the TTT sessions.
Data Analysis
Before the start of the initial training block and after each block of 320 movements, an evaluation was completed without robot assistance in the center-out task to 8 targets. The robot recorded the position of the cursor at a sampling frequency of 200 Hz, and a customized MATLAB program was used to process the data offline. Data were filtered with a Butterworth low pass filter (7 Hz cutoff). Movement time was defined as the amount of time elapsed to reach within 1 cm of the target. An average movement time for completed reaches at each evaluation was calculated. The number of blocks varied individually since time, not repetition, was held constant, which resulted in some instances when a participant did not conclude the intervention time with an evaluation. In these cases, the previous evaluation was used as the last block. The number of blocks also varied across groups given the 45- versus 60-minute schedule on the robot. For all participants, a minimum of 2 evaluations per session were completed, which indicates a minimum of at least 320 repetitions per session.
A repeated measures 2 × 2 ANOVA (time [pre, post] by group [Robot only, Robot + TTT]) was used to determine pre-post changes and differences between groups. To look more closely at when and how the kinematic performance changes were occurring, we employed 2 strategies. First, we assessed whether changes tended to occur during a treatment session (online gains) or between sessions (offline gains).12,13 Online gains were calculated as the rate of change within a session, and offline gains were calculated as the absolute change between sessions. Online and offline gains were compared using a one-way ANOVA to determine differences between groups. Second, we assessed the recovery profiles across blocks with random coefficient modeling (RCM). This analysis focused on evaluating the overall time spent on the robot such that the blocks of completed intervention on the robot were numbered sequentially for each participant over the entire study of 12 sessions. Our initial visual inspection revealed that there was a rapid reduction in movement time followed by a gradual improvement in movement time at a slower rate. The RCM facilitates the analysis of repeated measures in which the degree of change may not be linear;
14
motor learning literature suggests that such a learning process is best fitted by a 2-term exponential function.1-4 As such, we used a 2-term exponential function with random effects. The RCM statistically identifies both individuals that have different learning rates and whether group differences exist between the marginal models. This step accounts for between-subject variability by representing the performance trajectory when all individuals are identical, that is, when R(i,j) = 0.15,16 As part of the model development, a likelihood ratio test confirmed that the 2-term exponential function with random effects (ie, RCM on a 2-term exponential function) fit the data better compared to the 1-term exponential function with random effects (
The model is as follows:
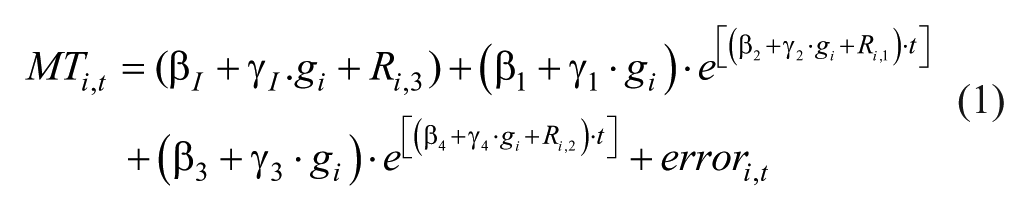
where
Results
The 2 groups were similar at the start of the intervention for age (P = .8) and level of impairment (P = .3). See Table 1. Movement times significantly decreased over the course of the intervention, F = 35.4, P < .001, and this was not different between groups (Robot only and Robot + TTT), F = 1.9, P = .18, as depicted in Figure 1A. The average movement time per block over the course of the intervention is illustrated in Figure 1B with the size of the data point indicating the number of individuals within the average. The Robot only group typically completed more blocks of robotic training compared to the Robot + TTT group. The groups were then compared to determine if changes within a session (online gains) or between sessions (offline gains) were different. The groups had significantly different rates of change within a session, which was quantified as the slope of change. The Robot + TTT group had a significantly greater rate of movement time improvement during the treatment session (average slope = 0.05) compared to the Robot only group (average slope = 0.004, P = .002). The absolute changes between sessions were significantly different (P = .001) with the Robot only group having a small improvement in movement time between sessions (0.08 seconds), whereas the Robot + TTT group had on average 0.2 seconds slower movement times at the start of the following session.
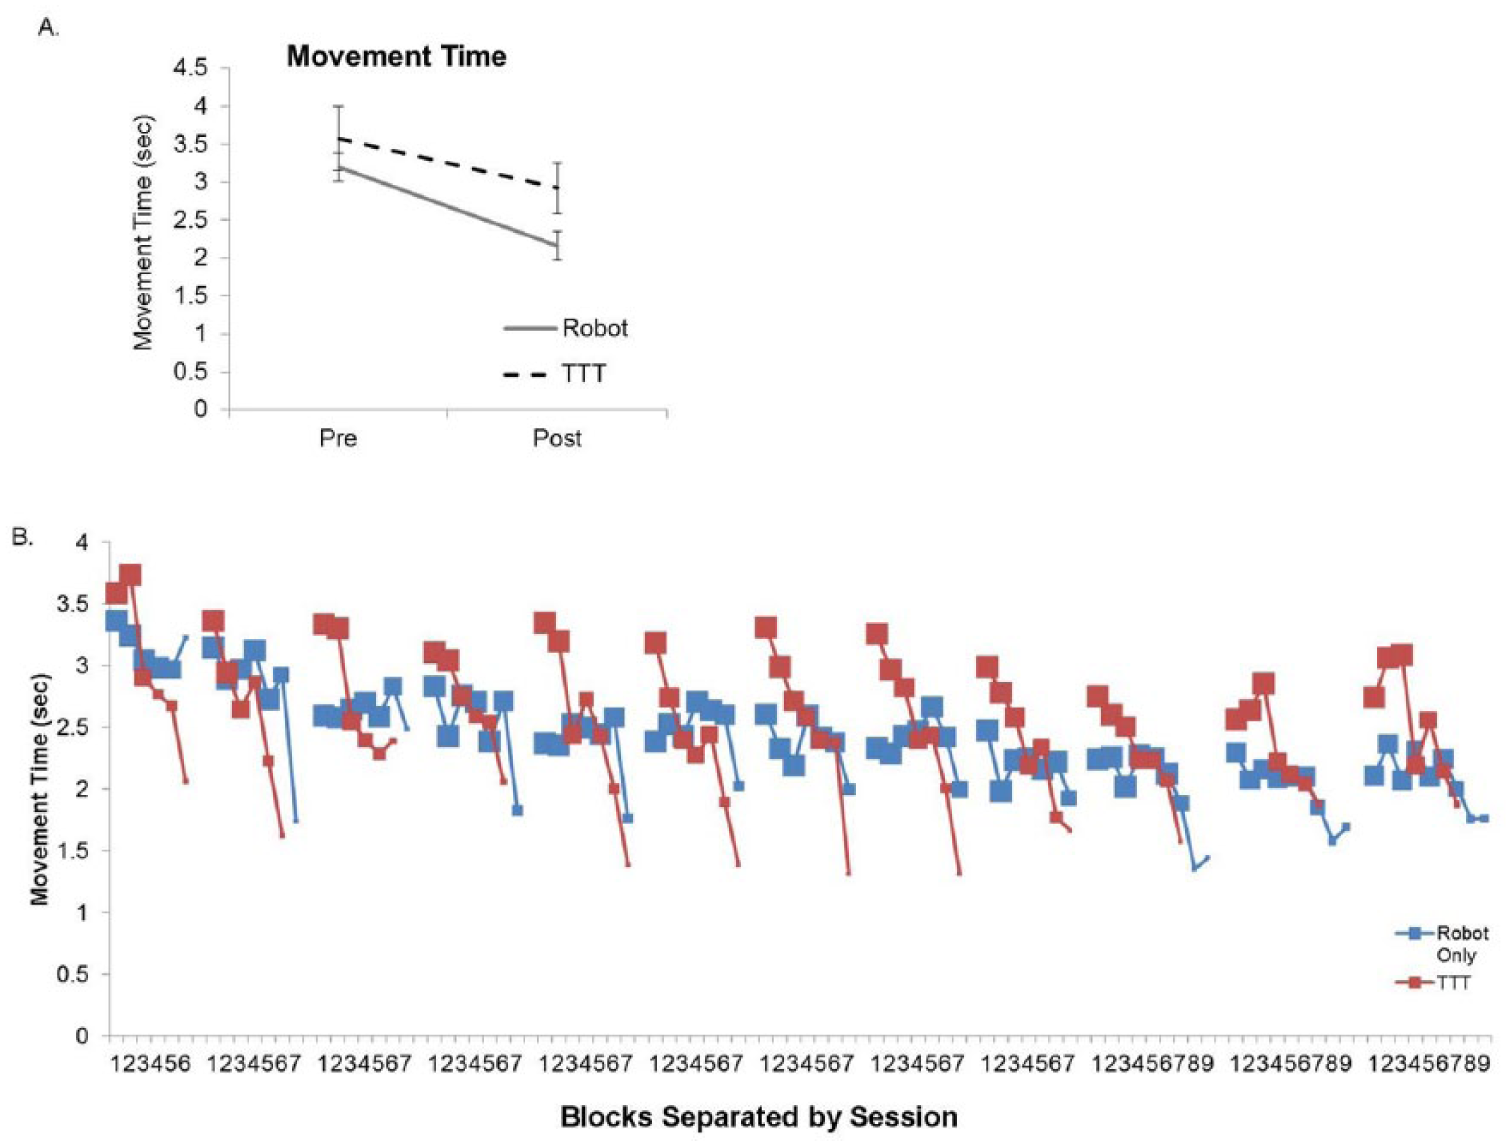
(A) Changes in movement time were similar between the 2 groups between the start and end of the 4-week intervention. (B) The average for each block on training separated by sessions over the course of the intervention.
The results of the RCM are depicted in Figures 2 and 3. The variances
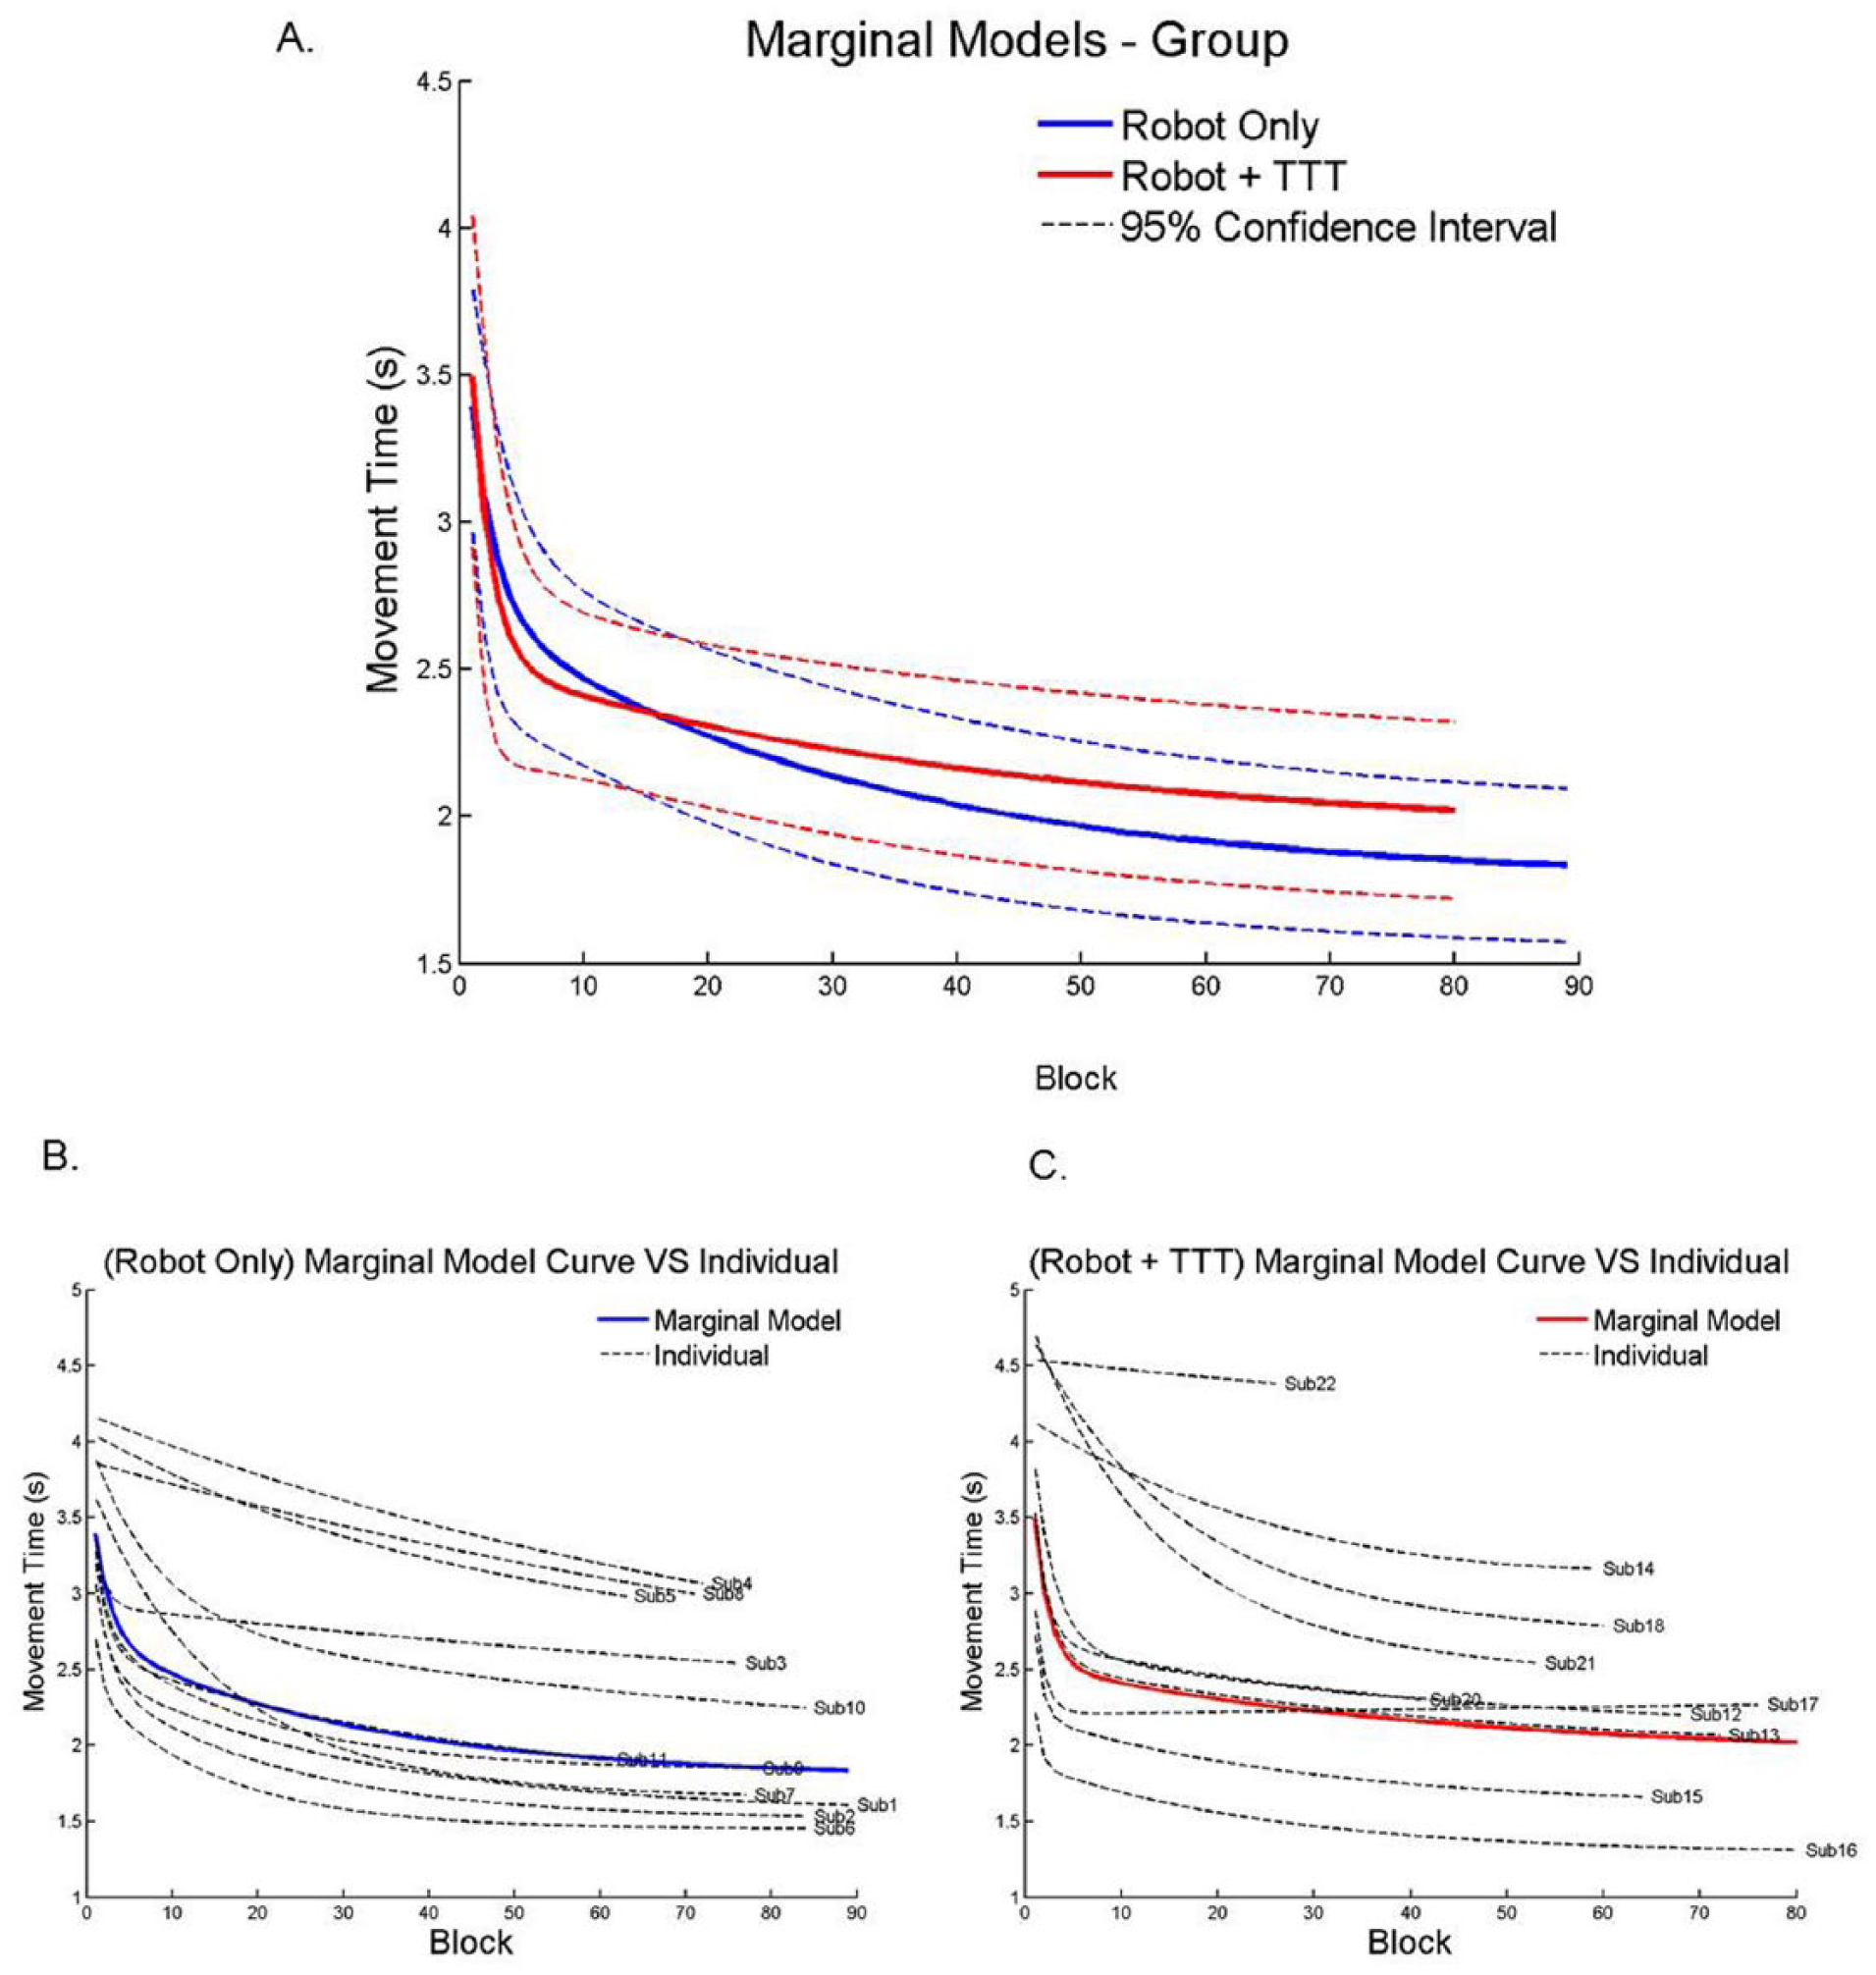
(A) Group effects of the exponential analysis and random coefficient modeling prediction curves. There was a significant difference between groups in the fast component of learning but the slow component was similar. (B) Individual predictive curves for the Robot only group. (C) Individual curves for the Robot + TTT group. TTT, translation-to-task practice.
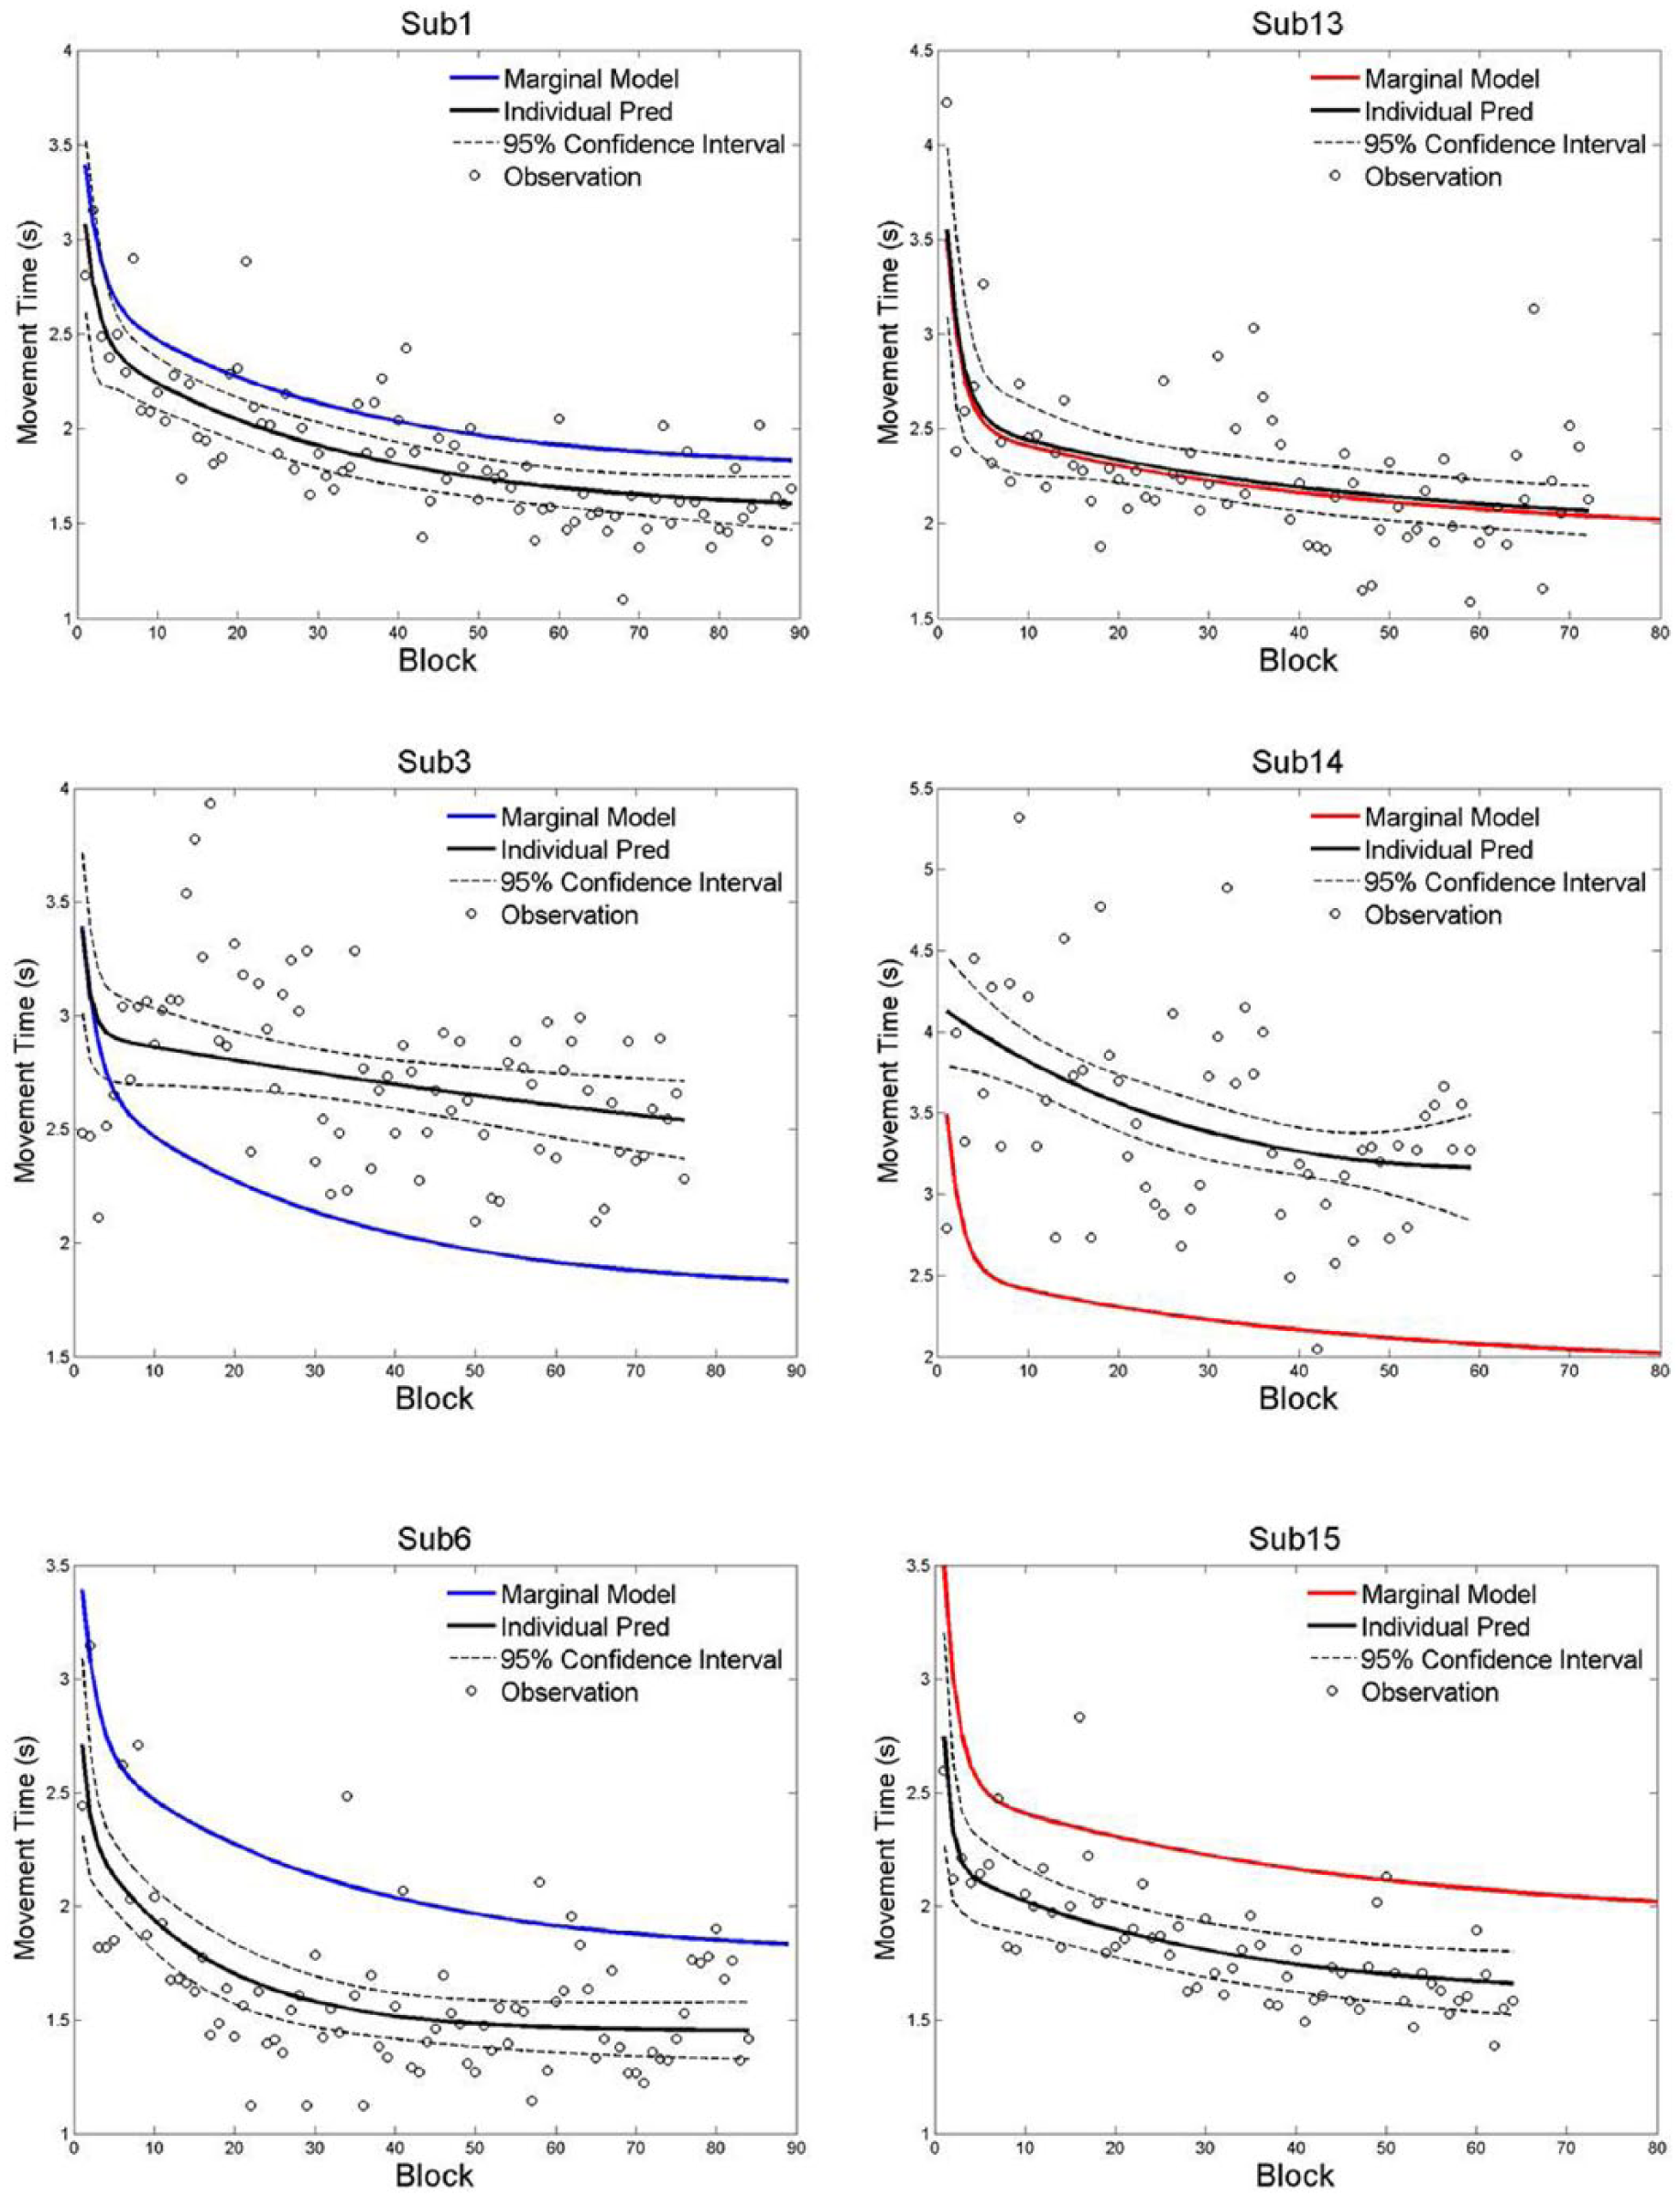
Exemplar data from both groups illustrating the individual data points that were used for the analysis and how the prediction curves are similar or different than the group prediction.
Parameter Estimates for the Nonlinear Model a .
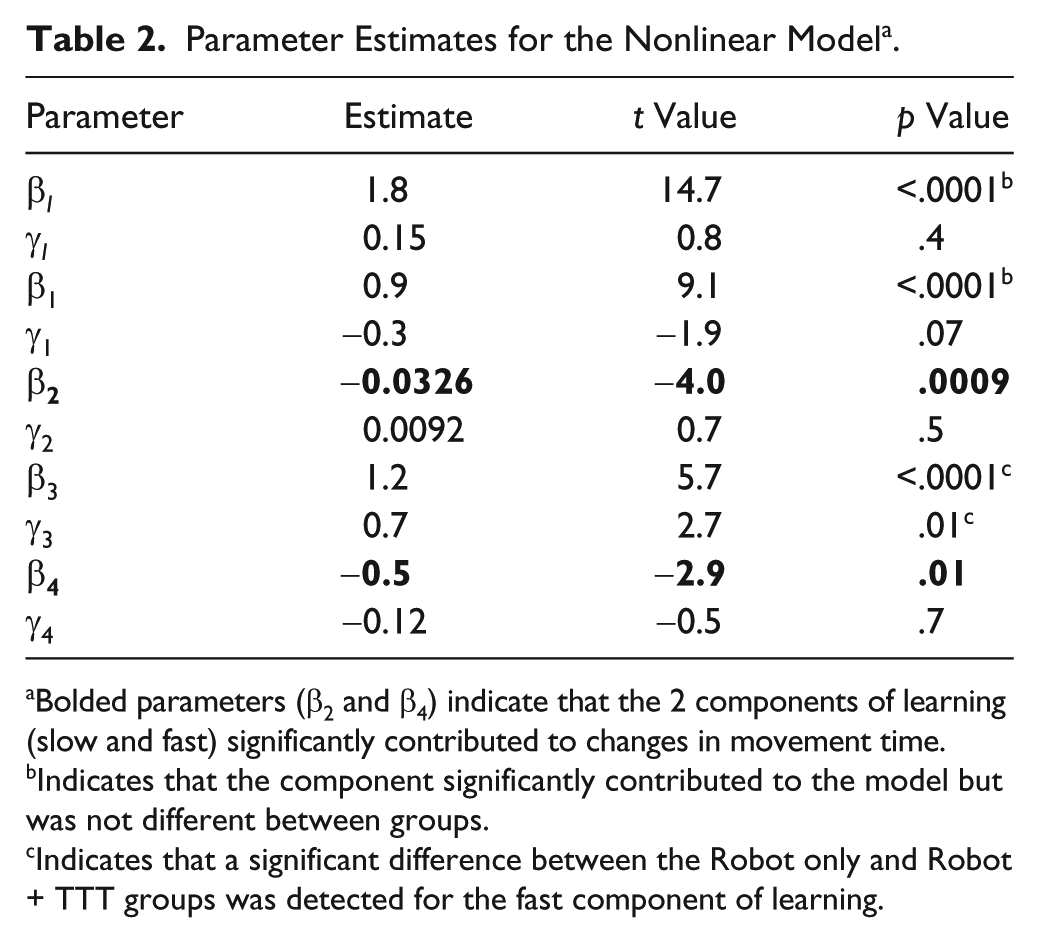
Bolded parameters (β2 and β4) indicate that the 2 components of learning (slow and fast) significantly contributed to changes in movement time.
Indicates that the component significantly contributed to the model but was not different between groups.
Indicates that a significant difference between the Robot only and Robot + TTT groups was detected for the fast component of learning.
One unique feature of the RCM is that it can control for high intersubject variability and identify individual subjects who are significantly different from the group. These results are provided in Table 3 for the 3 random coefficients that were included in the model including slow component, fast component, and initial movement time. Four subjects had significant deviations for the slow component of learning, whereas 9 subjects had deviations for the fast component of learning. Three subjects had significantly faster initial movement times (2.4, 2.5, and 1.7), whereas 1 subject had a significantly slower initial movement time (5.9 seconds), which were taken into account by the model. Figure 2B and C illustrates the variance in individual learning curves for each subject in relation to the group marginal models. The fast component and the initial MT coefficients positively correlated to the movement time (both were r = .7, P < .01). All other correlations were not significant (P > .05).
Individual Differences a .
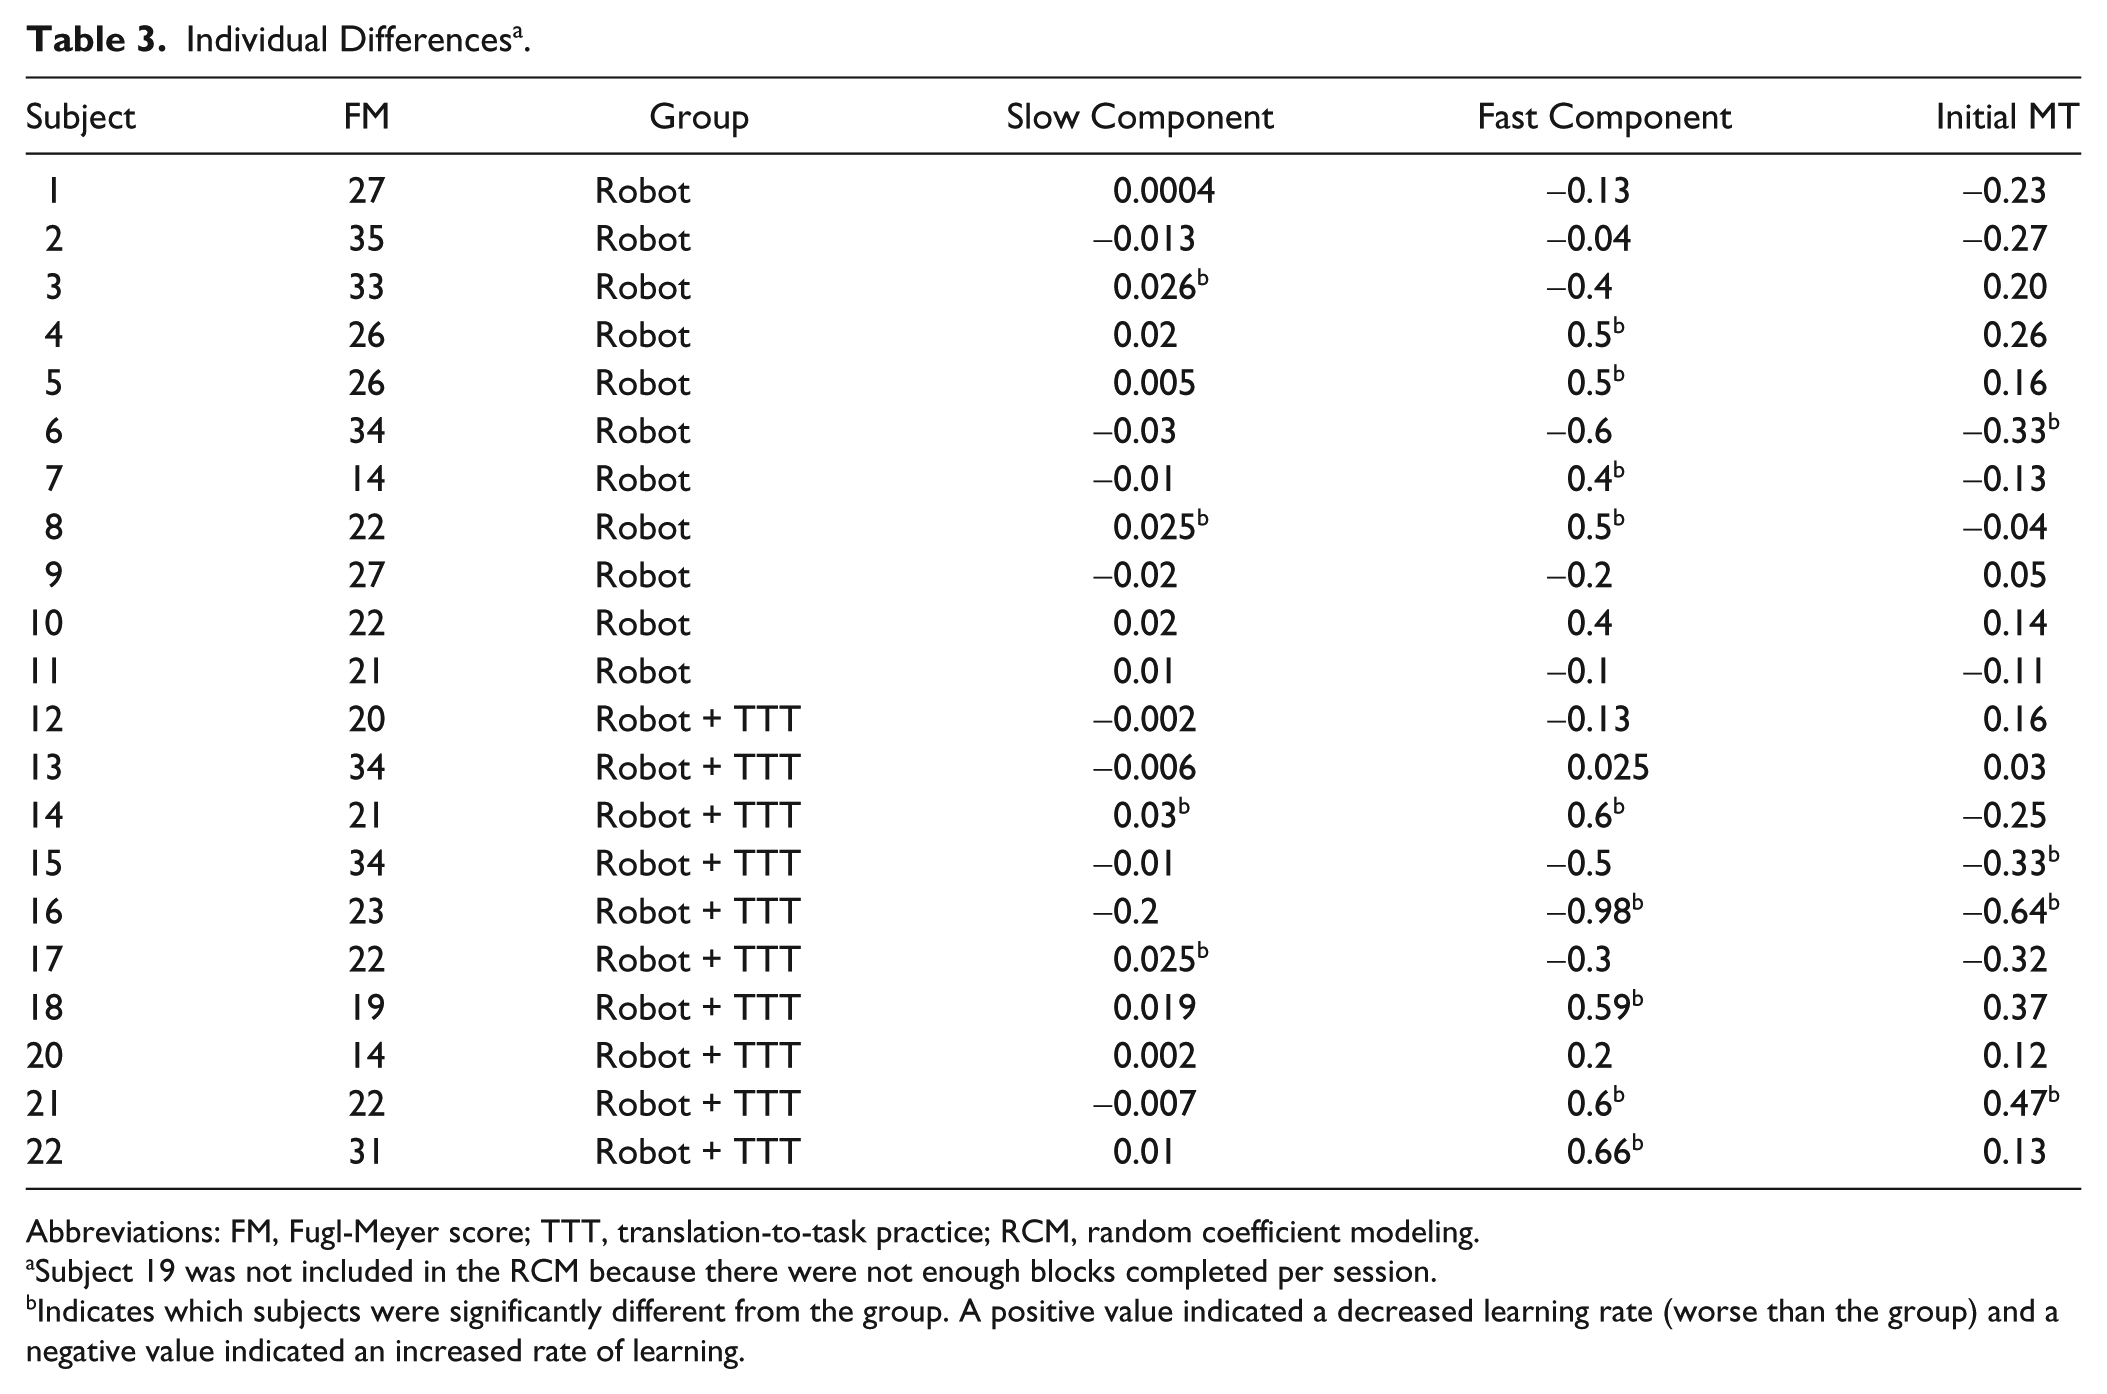
Abbreviations: FM, Fugl-Meyer score; TTT, translation-to-task practice; RCM, random coefficient modeling.
Subject 19 was not included in the RCM because there were not enough blocks completed per session.
Indicates which subjects were significantly different from the group. A positive value indicated a decreased learning rate (worse than the group) and a negative value indicated an increased rate of learning.
Figure 3 depicts individual prediction curves plotted against the marginal model. The top 2 plots illustrate 2 subjects whose individual curve does not differ from the marginal model. The middle 2 plots depict smaller fast learning components compared to the marginal model. The bottom 2 plots depict how a faster initial movement time generally just shifted the prediction curve lower, yet these 2 subjects did not have different fast or slow learning components, that is, the lines have the same shape.
Discussion
Profiles of movement time during unassisted multidirectional reaching, recorded by a robotic device, were investigated during a 4-week intervention on a shoulder-elbow robot with chronic stroke survivors. Improvements in movement times were similar after 12 sessions for both groups; the expanded analysis, however, determined that these gains were achieved differently. Generally, the Robot + TTT group had a greater rate of improvement during the session, which was not maintained between sessions, whereas the Robot only group had smaller gains within a session, but had a small gain in performance between sessions. Across all blocks an RCM with a 2-term exponential model demonstrated that 2 components of learning (fast and slow components) significantly contributed to the learning profiles. The RCM analysis also identified participants who were significantly different from the group, and the coefficients of the fast component were related to initial movement time. Taken together, these are important considerations for future rehabilitation studies because of the implications for dosing studies and opportunities to employ sophisticated statistical analyses in rehabilitation interventions.
The results of the initial pre-post analysis suggested that changes in movement time were not different between groups. These changes are similar to previous pre-post kinematic reports. 17 However, a premature conclusion would be that gains were achieved similarly across all participants. The between- and within-session analysis provided an approach to investigate when changes were occurring and may provide an opportunity to investigate characteristics related to an intervention. In this proof-of-concept analysis, the between-session data suggested that the Robot only group may have an advantage in consolidating their gains between sessions. This advantage could be because the longer session on the robot led to fatigue, causing slower movement times at the end of the session. Alternatively, the TTT component of the intervention could have interfered with consolidation between sessions for the combination group because more complex, integrated movements were practiced. The latter explanation is more likely since it explains the greater within-session learning by the Robot + TTT group such that they start each session slower than their last performance but quickly regain and slightly exceed their previous session’s last value.
We wanted to obtain a detailed picture of the changes in movement time over the intervention by investigating the rates of performance changes with the RCM analysis. This analysis demonstrated that 2 components were significantly contributing to changes in movement time over the course of the intervention. There was a significant fast component of learning that occurred early during the intervention, which was followed by a slower component of learning. This phenomenon of rapid learning tapering off has been previously demonstrated, 3 yet the current study applied this contemporary approach to data collected within an extended intervention. The clinical implication from this analysis revealed a critical period where performance changes were slower. This effect was apparent in both intervention groups, and was slightly more pronounced in the Robot + TTT group. Most of the gains were attained during the first 20 blocks of robot training (each block includes 320 movements) with a subsequent diminished rate of gain. Each participant would have completed 20 blocks of training during different sessions given that the time in the robot therapy was held constant rather than number of repetitions. Clinically, this suggests that the first 20 blocks of cumulative training (about 5-6 sessions) promotes a faster rate of gain, which is followed by slower improvements over the additional sessions. This result is similar to Volpe and colleagues who observed the biggest improvement in the first 9 sessions. 18 However, it is in contrast to those of Kahn and colleagues, 19 who suggested improvements of speed from robotic training were gradual and continuous over the course of the intervention. The difference in our results may be due to the type of robotic training used, the fact that they had a very low number of movements per session (80 movements vs a range of 320 to 960 in ours), the fact that they did not use a combination training but tested robot alone versus task-practice alone, the density of their assessments (less than ours), and the overall time frame (longer than ours). It may also be due to our use of the RCM analysis. We observed a change in the rate of improvement that would not be detected with a linear model. This highlights the importance of using different statistical approaches and the potential limitations of using a linear model over repeated sessions. The results from the current study suggest that this shift in fast to slow gains is an opportunity to explore and study different dosing strategies with robotic interventions and highlights the importance of continuous monitoring of performance. For example, the robot could require greater challenges as changes in motor performance slowed. The decreased rate of gains and differences in learning between subjects over the course of the intervention may be possible explanations for why clinical gains from robot studies are often limited. Analyses like the RCM, with a 2-term exponential function, offer rehabilitation scientists new avenues for analyzing data from studies that have measures that are repeatedly collected (eg, movement time on a certain task).
One clear advantage to the RCM approach is that it allows for the detection of individuals whose pattern of performance over time differs from that of the group. As such, this analysis controls for intersubject variability, which is critical for populations such as stroke that have inherent variability. The traditional option to control for variability in clinical trials is to have strict inclusion/exclusion criteria, but this is statistically inefficient, increases recruitment burden, and decreases external validity.20,21 More novel approaches implement appropriate statistical analyses that can control for inherent variability, as was done in the current study. The RCM identified a number of participants in each group who exhibited similar profiles over time whereas a few had different patterns (see Tables 2 and 3). The individual curves suggest that robotic treatment should be evaluated during the first 20 blocks of training to establish if patients are following the typical trajectory, as some patients may have a slow or no response at all to treatment (example participant 22 in Figure 2C) or are responding more quickly (see Figure 2). Statistical identification of subjects is a significant step for clinical research and generates new avenues for determining the factors that influence response to treatment. Further developing these performance profiles provides clinicians with better options to modify treatment plans, which should increase effectiveness of robotic treatments.
Finally, we explored the relationships between the generated coefficients from the RCM and individual initial motor severity (FM scores and movement time). The fast phase and initial MT coefficients were significantly related to the movement time (seconds). This analysis suggests that an individual with a slower movement times at the start of the intervention had decreased fast learning rates without achieving a strong plateau. For example, see Subjects 4, 5, and 8 in Figure 2B. These relationships and relationships with functional change and final performance need to be explored more fully with a robotic dosing related study.
Conclusions
By using sophisticated statistical analyses to more fully understand how performance changes over time, we demonstrated different rates of learning during the intervention (fast and slow components) that were not apparent with a more traditional pre-post statistical approach. The RCM highlighted a critical period within the intervention where motor performance appeared to reach a plateau and potential differences between groups in terms of when improvements become consolidated. The RCM approach also allowed for analysis at the individual level, which can assist to identify individuals who may not be responding to the intervention like other participants. These areas of discussion provide avenues for implementation with future robotic intervention studies and have implications for the clinical use of robotic training.
Footnotes
Acknowledgements
The authors would like to thank the participants involved with this study. They would also like to thank Patti McCarthy, OTR, Jaime Lush, Brooke David, and Harrison Segall, who assisted with data collection and analysis.
Declaration of Conflicting Interests
The authors declared no potential conflicts of interest with respect to the research, authorship, and/or publication of this article.
Funding
The authors disclosed receipt of the following financial support for the research, authorship, and/or publication of this article: This study was supported by the Veterans Affairs Merit Award (B6935R) to CTB. CLM was supported by NIDRR, UMANRRT program (H133P100014), and American Heart Association (14CRP18150008).