
Abstract
Background. Recovery of upper limb function post-stroke can be partly predicted by initial motor function, but the mechanisms underpinning these improvements have yet to be determined. Here, we sought to identify neural correlates of post-stroke recovery using longitudinal magnetoencephalography (MEG) assessments in subacute stroke survivors. Methods. First-ever, subcortical ischemic stroke survivors with unilateral mild to moderate hand paresis were evaluated at 3, 5, and 12 weeks after stroke using a finger-lifting task in the MEG. Cortical activity patterns in the β-band (16-30 Hz) were compared with matched healthy controls. Results. All stroke survivors (n=22; 17 males) had improvements in action research arm test (ARAT) and Fugl-Meyer upper extremity (FM-UE) scores between 3 and 12 weeks. At 3 weeks post-stroke the peak amplitudes of the movement-related ipsilesional β-band event-related desynchronization (β-ERD) and synchronization (β-ERS) in primary motor cortex (M1) were significantly lower than the healthy controls (p<0.001) and were correlated with both the FM-UE and ARAT scores (r=0.51-0.69, p<0.017). The decreased β-ERS peak amplitudes were observed both in paretic and non-paretic hand movement particularly at 3 weeks post-stroke, suggesting a generalized disinhibition status. The peak amplitudes of ipsilesional β-ERS at week 3 post-stroke correlated with the FM-UE score at 12 weeks (r=0.54, p=0.03) but no longer significant when controlling for the FM-UE score at 3 weeks post-stroke.Conclusions. Although early β-band activity does not independently predict outcome at 3 months after stroke, it mirrors functional changes, giving a potential insight into the mechanisms underpinning recovery of motor function in subacute stroke.
Keywords
Introduction
Only 40% to 55% of stroke survivors achieve independence in daily activities 1 ; most are limited by residual limb paresis. 2 Two critical questions surrounding the recovery of motor behavior poststroke remain to be answered: (1) Can outcome be accurately predicted early after stroke for an individual patient, and (2) can the mechanisms underpinning recovery be elucidated, so that we can optimize that recovery?
Function in the paretic upper limb at 3 to 6 months after stroke can partly be predicted using the proportional recovery rule based on the baseline Fugl-Meyer upper-extremity (FM-UE) score.3-5 Although this rule has recently been questioned because of mathematical coupling between the baseline and change score,6,7 there is convergent evidence that the integrity of the ipsilesional corticospinal pathway early after stroke is of central importance for motor outcome, 8 which has been used to stratify stroke survivors in terms of recovery of motor function. 9
Functional magnetic resonance imaging (fMRI) and positron emission tomography (PET) studies have consistently demonstrated that cortical remodeling in both the ipsilesional and contralesional hemispheres 10 also plays a key role in functional recovery after stroke,11-14 especially in the subacute stroke stage. 15 However, fMRI and PET measure blood oxygenation level and regional blood flow, raising the potential confound of concurrent impairments of cerebrovascular reactivity and hemodynamic insufficiency. 16
Magnetoencephalography (MEG) directly quantifies neural activity and, therefore, is unaffected by potential changes in neurovascular coupling. In addition, MEG can be used to detect activity within cortical microcircuits, which comprise reciprocal activity in both glutamatergic and GABAergic neurons and, hence, might be difficult to quantify using fMRI or PET. Oscillations, particularly in the β-band (16-30 Hz), reflect this reciprocal activity, and hence are sensitive to changes in the excitatory/inhibitory balance within local microcircuits, although the precise relationship remains to be elucidated. β-band activity within the primary motor cortex (M1) is of particular interest because it is known to be central to voluntary movements in humans 17 and is likely, therefore, to play a critical role in motor recovery. A prominent event-related desynchronization (β-ERD) occurs during movement preparation and movement, and an event-related synchronization (β-ERS) occurs after cessation of movement, 18 both of which have been shown to be specifically altered after stroke.19-23 The β-ERD and β-ERS reflect distinct physiological processes, though both have previously been shown to be altered by changes in GABAergic signaling,24,25 which is central to poststroke recovery.26,27
The β-ERD starts prior to movement in the contralateral postcentral gyrus, spreading immediately to the bilateral sensorimotor cortices, and has been associated with motor preparation, execution, and imagery.18,28,29 Previous electroencephalography/MEG studies have shown that the ipsilesional amplitude is reduced after stroke, and such reduction correlates with motor impairment poststroke.19,20
The β-ERS appears at the cessation of movement. It has been suggested to reflect motor cortical deactivation or an increase in intracortical inhibition.24,30-32 The role of β-ERS in motor recovery is less clear than that of β-ERD. An MEG study in chronic stroke patients reported a positive correlation between ipsilesional β-ERS and concurrent motor scores, 20 but another study revealed a decrease in β-ERS in bilateral M1s after 2 weeks of rehabilitation. 33 Somatosensory stimulation studies in acute stroke demonstrated decreased β-band rebound in either paretic or nonparetic hand stimulation, with subsequent increase during recovery.22,23,34
However, most of these were cross-sectional studies providing inconsistent evidence influenced by the heterogeneity in stroke survivor enrolment (poststroke time, stroke severity, mixed ischemic and hemorrhagic stroke, mixed arterial territories, mixed subcortical and cortex involvement).9,33,35-37
Here, we have studied longitudinal MEG changes in a relatively homogeneous cohort of first-time subcortical ischemic stroke in the middle cerebral artery (MCA) territory at weeks 3, 5, and 12 after stroke to test a number of hypotheses. We predicted that the amplitudes of β-ERD and β-ERS in the ipsilesional M1 would be decreased at 3 weeks poststroke and, on a subject-by-subject basis, would relate to function. Furthermore, we hypothesized that β-ERD and β-ERS at week 3 poststroke would correlate with functional outcome at 12 weeks poststroke. Finally, the pattern of longitudinal β-ERD/ERS changes over bilateral hemispheres would reflect cortical plasticity during poststroke motor recovery.
Methods
A total of 22 patients aged 20 to 80 years with first-ever, unilateral, subcortical ischemic stroke in the MCA territory, with mild to moderate hand weakness (finger extensor strength ≥ 3/5 Medical Research Council grade), ensuring that the finger-lifting task could be adequately performed, were recruited at 2 to 4 weeks after stroke onset and hospitalized at the Taipei Veterans General Hospital for 2 weeks of intensive rehabilitation, which included 2 daily sessions of 90-minute physiotherapy except on weekends (30 hours, 10 days). The exclusion criteria included a modified Rankin Score (mRS) of 4 to 5, concomitant major neurological diseases, or severe medical diseases. Another 25 age- and sex-matched healthy individuals were enrolled as controls. All participants in this study were right-handed as determined by the Edinburgh Handedness Inventory. 38 Written informed consent was obtained from each participant in advance. The study was approved by the ethics committee of the Taipei Veterans General Hospital.
Stroke survivors were followed at 3 time points: T1, as the baseline, at about the 3rd week after stroke; T2, immediately after 2 weeks of intensive rehabilitation, at about the 5th week after stroke; and T3, at the 12th week after stroke (followed up at an outpatient clinic). Each evaluation consisted of the FM-UE score, 39 the Action Research Arm Test (ARAT) score, 40 and task-related MEG (see below). The same MEG protocol was performed once in healthy controls.
Transcranial Magnetic Stimulation (TMS)
Corticospinal excitability was measured at enrolment in stroke survivors alone using single-pulse TMS generated by a Magstim Rapid 2 simulator (Magstim Co, Whitland, UK) applied to the ipsilesional M1 and recorded with surface electromyography (EMG) on the paretic extensor carpi radialis muscle. The motor-evoked potential (MEP) peak-to-peak amplitude was averaged from 12 successive MEPs evoked every 5 s for 1 minute at an intensity of 120% baseline resting motor threshold (rMT). 41 Corticospinal excitability was measured by an experienced technician, at least 2 to 3 days before the MEG measurement.
Brain Magnetic Resonance Imaging
To produce a group lesion map, ischemic stroke lesions delineated from individual diffusion-weighted images were overlaid on a standard brain template using MRIcron software. 42 All participants also received 3-T MRI scans (Discovery MR750, General Electric Company) to obtain high-resolution 3-dimentional T1 images for MEG source coregistration. Individual MRI cortical surfaces were reconstruction by FreeSurfer software 43 followed by downsampling to 8000 vertices.
MEG Acquisition
MEG was recorded in a magnetically shielded room using a whole-head array Neuromag Vectorview MEG system (Elekta, Helsinki, Finland) with a 500-Hz sampling rate. Only the planar gradiometer signals (204 channels) were analyzed in this study. Electrooculography (EOG) channels over the right upper and left lower orbital regions and electrocardiography (ECG) channels over bilateral arms were used to detect blink, ocular, and cardiac artefacts. Surface EMG channels on bilateral extensor digitorum communis muscles were used to monitor motor task performance. The EMG signals were processed with a 20-Hz high-pass filter, then rectified to determine the duration of EMG activity following the methods in previous literature. 44
The MEG paradigm comprised a self-paced unilateral index finger-lifting task every 7 s, for both sides consecutively. A total of 100 trials for each side were collected with a short break after the first 50 trials (total about 20 minutes). Before signal acquisition, all participants were instructed to perform steady finger lifting (20°-40°) while relaxing other parts of the body. The movement onset of finger lifting was detected by an optic detection pad.
MEG Analysis
MEG data were analyzed using Brainstorm software. 45 The continuous MEG raw data were epoched into the −3 s to 3-s segments relative to movement onset. Epochs were discarded if visual inspection revealed noisy segments, concurrent EOG signals were larger than 200 µV, or MEG signals were larger than 4000 fT. EOG and ECG artefacts were removed by signal-space projectors built in Brainstorm software. MEG artefact-free data were filtered into the β-band (16-30 Hz), squared, and averaged to yield β-band–specific power, then projected into the individual MRI cortical surface by minimum norm estimate, and normalized to the Colin27 template cortex. ERD/ERS were quantified by calculating frequency-specific power change relative to reference period (−3 to −2 s relative to movement onset) with the following expression: ERD (or ERS) percentage = A − R/(R × 100). Here, A is the power within the frequency band of interest during the active period of the event and R, the mean power of the reference period. 18 The peak amplitudes of ERD and ERS were determined during the period of −2 to 2 s and 0 to 3 s, respectively, from the maximal response vertices for each individual. To ensure that the findings in this study were not simply the result of a slowing of β-activity in stroke survivors, we performed a fast Fourier transform from −3 to 3 s relative to movement onset and characterized the peak frequency. This did not differ significantly either between stroke survivors and controls [t(45) = −0.030; P = .76] or across time in the stroke survivors [F(2, 20) = 3.04; P = .071]; see Supplementary Table S1.
Statistical Analysis
All analyses were performed using the SPSS software (version 15.0, Chicago, IL). When comparing demographic characteristics between the stroke and control groups, χ2 tests were used for categorical data and Mann-Whiney U tests were used for continuous data. Multivariate analyses of variance (ANOVAs) were performed to compare the difference between control and stroke groups in the ERD/ERS parameters (amplitude) and EMG parameters (duration). One-way repeated-measures ANOVAs were performed to evaluate the changes over time in motor scores, electrophysiological measurements, and ERD/ERS parameters among the 3 poststroke time points, followed by post hoc t-test with Bonferroni correction. The relationship between motor scores and MEG parameters was examined using Spearman’s rank correlation to minimize the ceiling effects of maximum motor scores. To validate any association of MEG parameters with motor outcomes at T3, a partial correlation analysis controlling motor scores at T1 was performed.
Results
A total of 22 (17 male) stroke survivors and 25 age- and sex-matched healthy controls were enrolled in this study (Table 1). Stroke survivors had a median age of 60 years (55-62), were a median of 21 days (16-25) after stroke onset, with median National Institutes of Health Stroke Scale of 3 (2-4), ARAT, 36 (18-54), and FM-UE, 51 (43-60) at enrolment, belonging to mild to moderate stroke severity. Twelve stroke survivors had right hemispheric stroke. The group lesion map (Figure 1) showed overlapped infarctions in the corona radiata and basal ganglia within the MCA territory without cortical involvement. The infarction size (mean ± standard error) was 2.53 ± 0.43 cm2 (range 0.55-8.4 cm2). All our stroke survivors had a quantifiable MEP at enrollment, with median MEP amplitude at 120% baseline rMT of 0.172 mV (range 0.10-0.26).
Stroke Survivor Characteristics. a
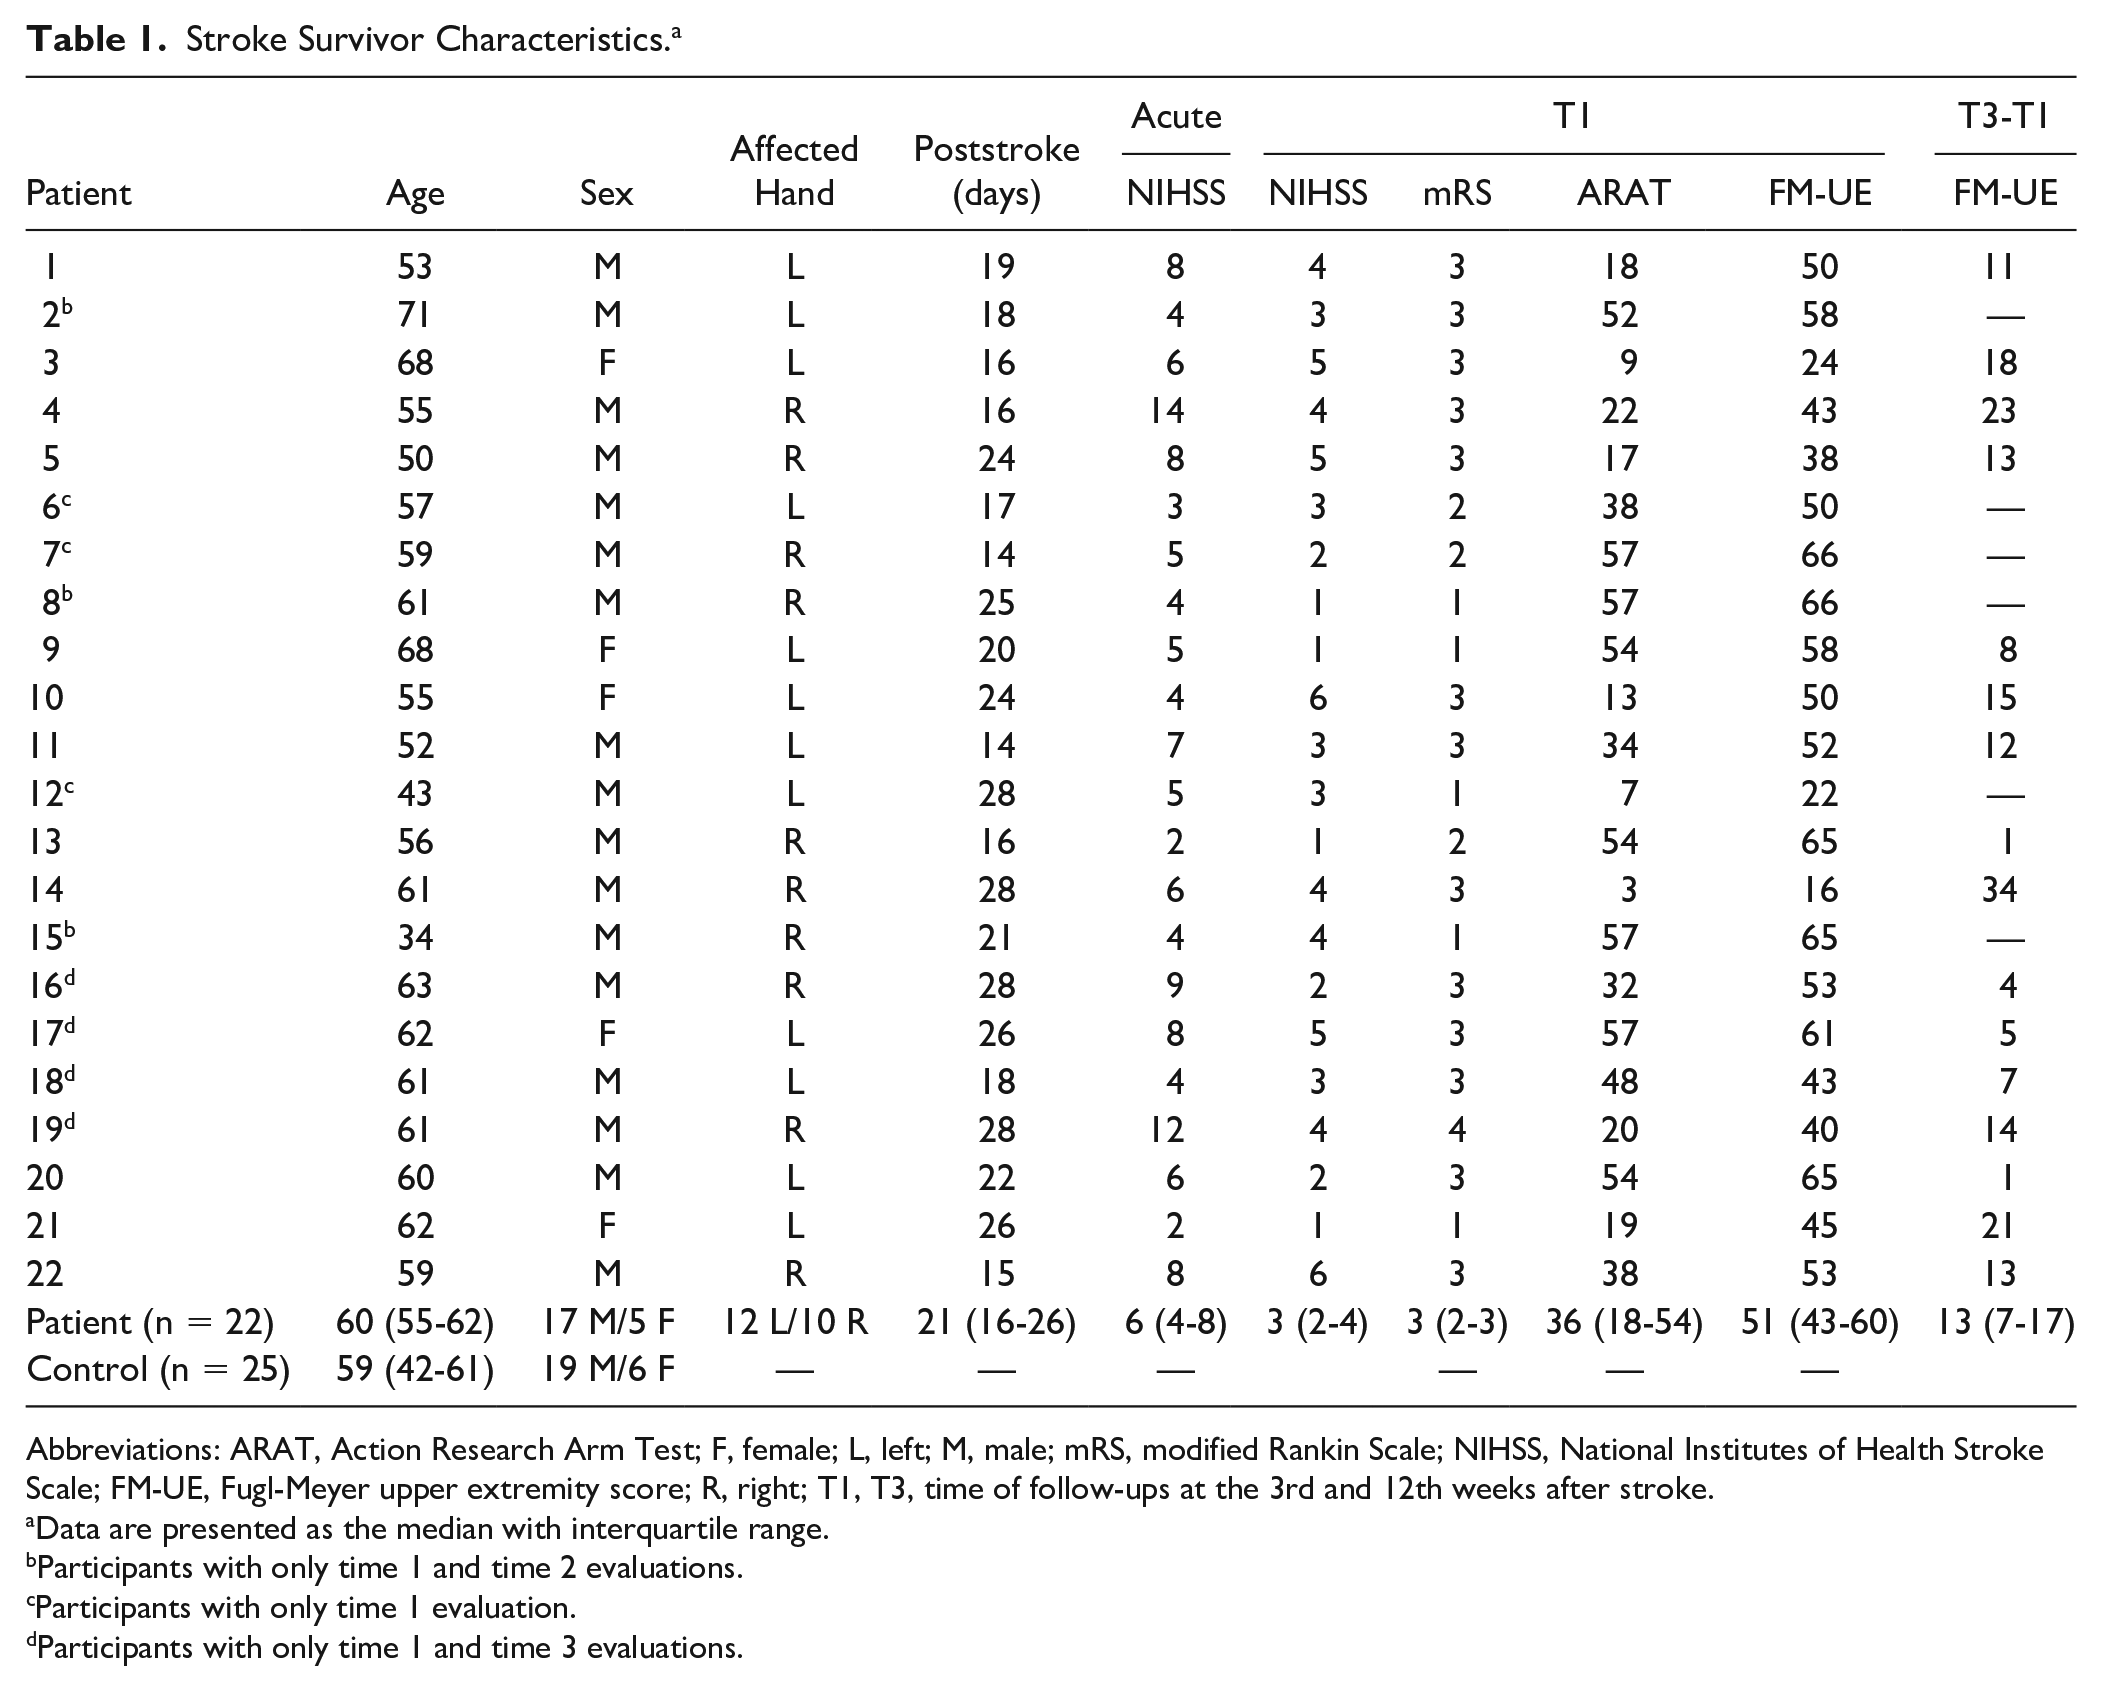
Abbreviations: ARAT, Action Research Arm Test; F, female; L, left; M, male; mRS, modified Rankin Scale; NIHSS, National Institutes of Health Stroke Scale; FM-UE, Fugl-Meyer upper extremity score; R, right; T1, T3, time of follow-ups at the 3rd and 12th weeks after stroke.
Data are presented as the median with interquartile range.
Participants with only time 1 and time 2 evaluations.
Participants with only time 1 evaluation.
Participants with only time 1 and time 3 evaluations.
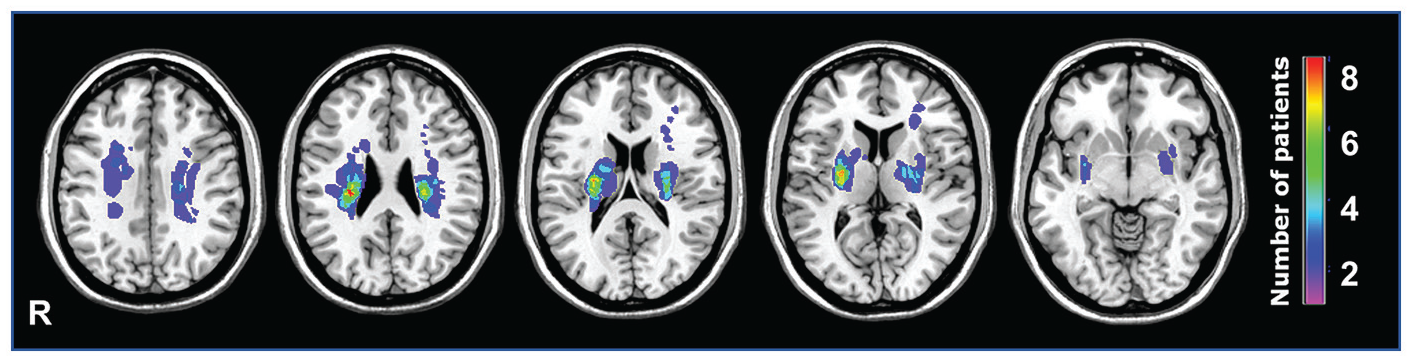
Stroke lesion map: Infarct lesions from 22 stroke survivors overlaid on a standardized template (MRIcron). The color spectrum represented the number of stroke survivors with overlapping stroke location. All locations were subcortical regions in the middle cerebral artery territory, mostly at the corona radiata and basal ganglia.
A total of 22 stroke survivors took part at T1. Of these, data from 15 stroke survivors were recorded at T2, and 16 at T3. Three stroke survivors were excluded from T2 and T3 because they did not undertake hospitalization rehabilitation after the T1 evaluation. Four stroke survivors at T2 and 3 at T3 declined follow-up.
Stroke Survivors Showed Significant Functional Improvements Between Week 3 and Week 12
As would be expected, stroke survivors’ behavior improved after stroke. Both the FM-UE and ARAT scores showed significant increases after 2 weeks of rehabilitation (T2) and at 3 months after stroke (T3) compared with baseline (T1). FM-UE: F(1.25, 13.74) = 25.13, P < .0005; ARAT: F(2, 22) = 21.92, P < .0005 (Figures 2A and 2B). Post hoc Bonferroni-corrected paired-samples t tests demonstrated significant differences between all 3 time points (FM-UE: T2-T1 P = .002, T3-T1 P = .001, T3-T2 P = .003; ARAT: T2-T1 P = .002, T3-T1 P = .001, T3-T2 P = .019).
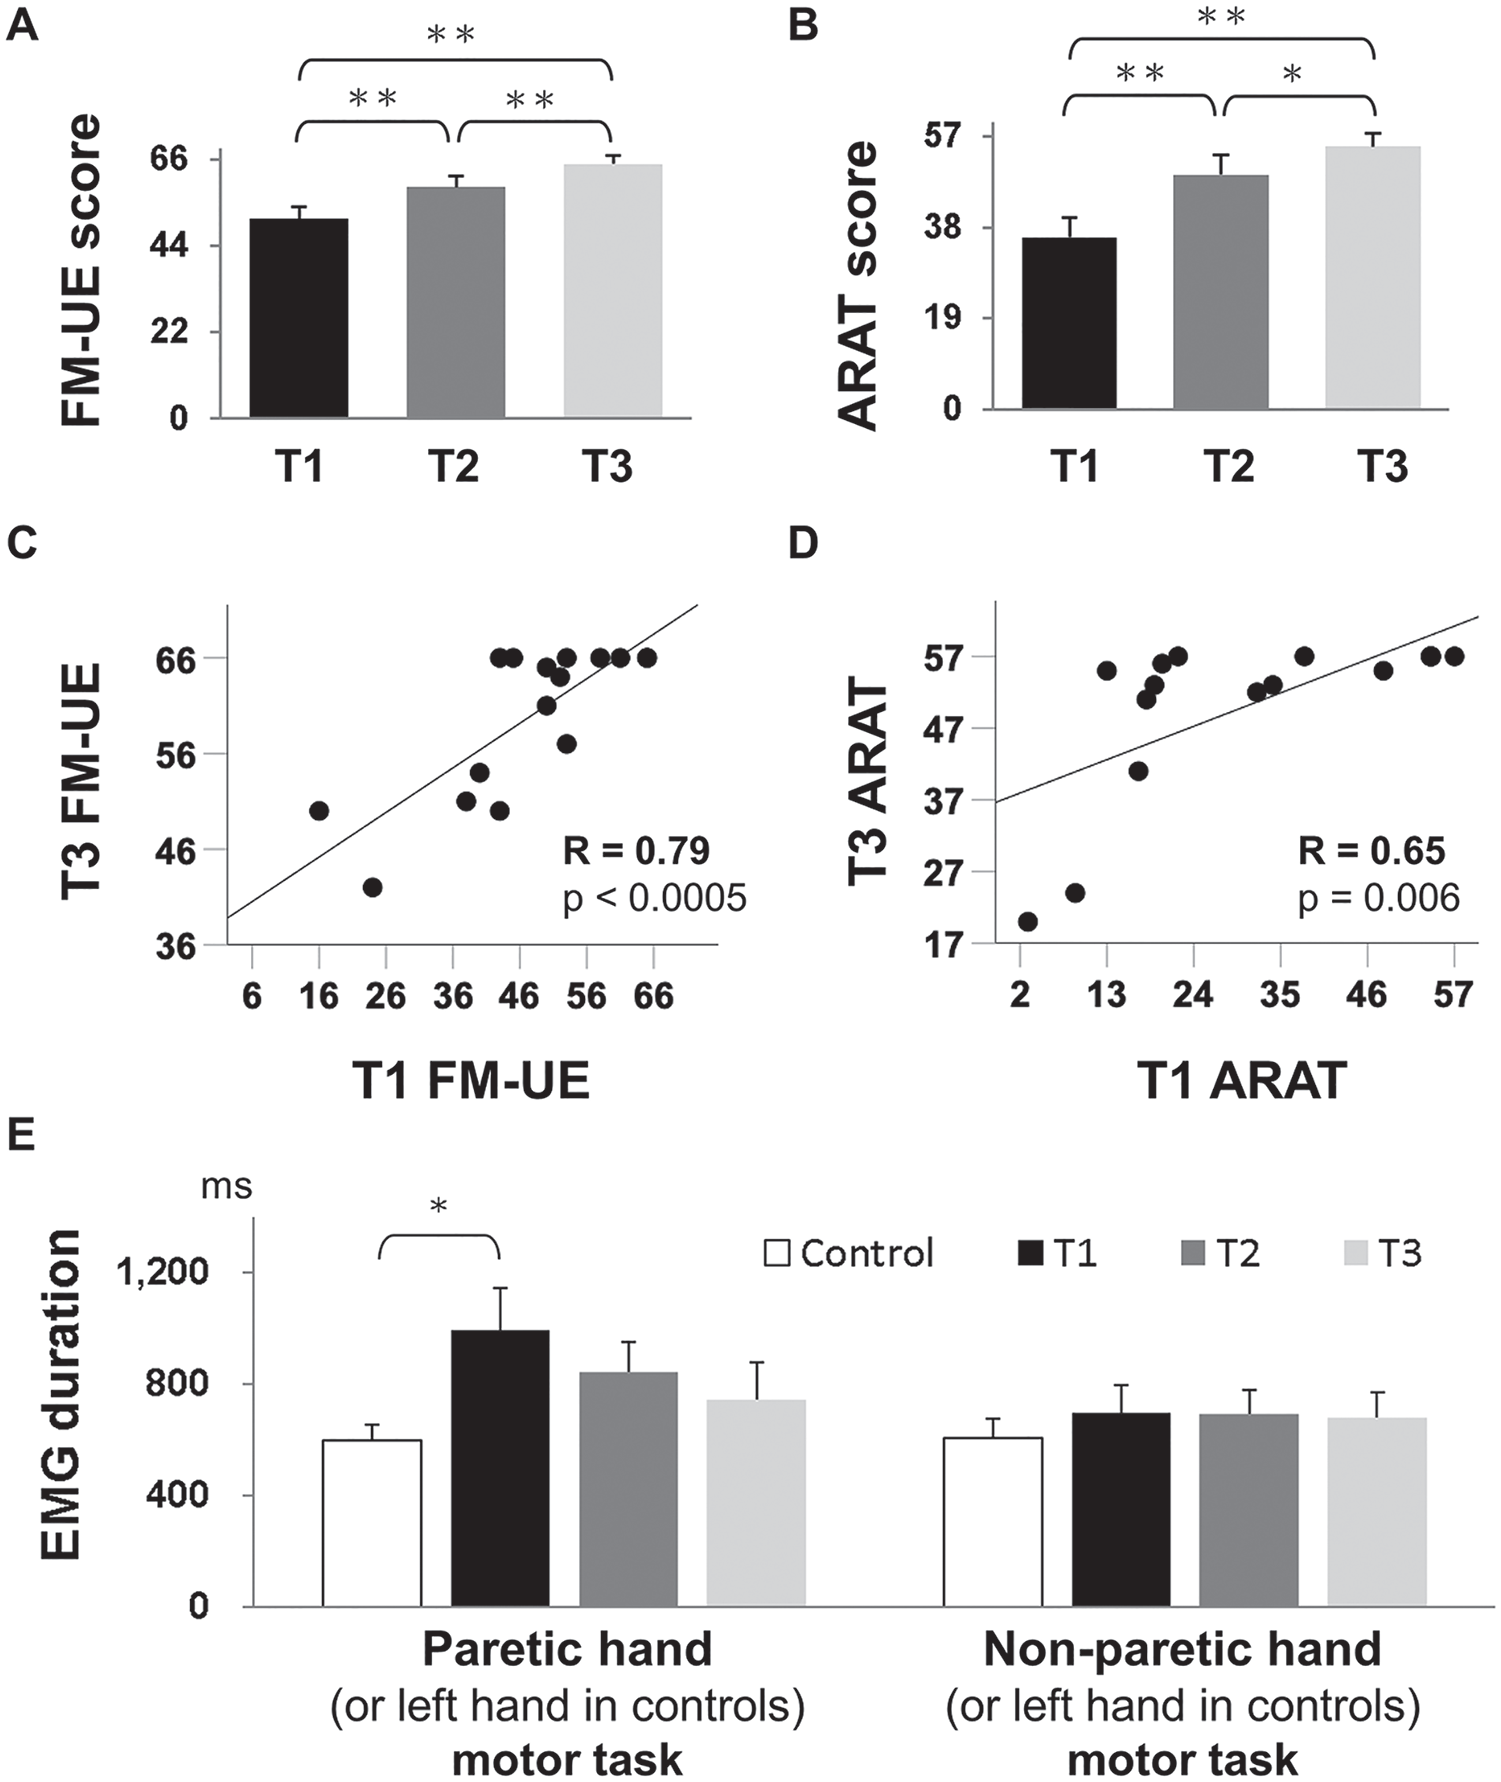
Motor scores and task performance measurements. (A) Fugl-Meyer upper extremity (FM-UE) score and (B) Action Research Arm Test (ARAT) score showed significantly progressive improvements between the 3rd (T1) and 5th (T2), and between T2 and 12th (T3) weeks after stroke onset. (C) FM-UE and (D) ARAT score at T1 positively correlated with the corresponding motor score at T3. (E) Quantification of surface electromyography (EMG) signals during unilateral finger lifting. The EMG duration was prolonged at stroke T1 compared with the control (P = .017) in paretic hand movement, but there was no significant difference among the 3 stages after stroke or in nonparetic hand motor tasks.
It has previously been shown that behavioral measures early in stroke correlate with subsequent behavioral outcomes. 5 In line with this, the FM-UE (or ARAT) score at T1 significantly correlated with the FM-UE (or ARAT) score at T3 in our stroke cohort (FM-UE: r = 0.79, P < .0005; ARAT: r = 0.65, P = .006; Figures 2C and 2D).
Stroke Survivors Showed an Initial Mild Slowing of Movement, Which Normalized by 5 Weeks Poststroke
We then went on to investigate the duration of movement in finger lifting. The surface EMG signals of the extensor digitorum communis muscle during paretic (nondoominant left hand in controls) finger lifting revealed a group difference in EMG movement duration [F(3, 74) = 3.34; P = .024]. Post hoc t tests with Bonferroni correction revealed that the EMG duration was significantly prolonged in stroke survivors at T1 (992 ± 151 ms) as compared with controls (594 ± 151 ms, P = .017) but normalized after T2 (Figure 2E). However, there was no significant correlation between the EMG duration and β-ERD or β-ERD peak amplitudes in either healthy controls or stroke survivors (all P > .1; Supplementary Table S2). The EMG movement duration in nonparetic (right in controls) hand finger-lifting task showed no group difference [F(3, 68) = 0.46, P = .71; Figure 2E].
Stroke Survivors Showed Changes in Timings in β-ERD and β-ERS Compared With Healthy Controls
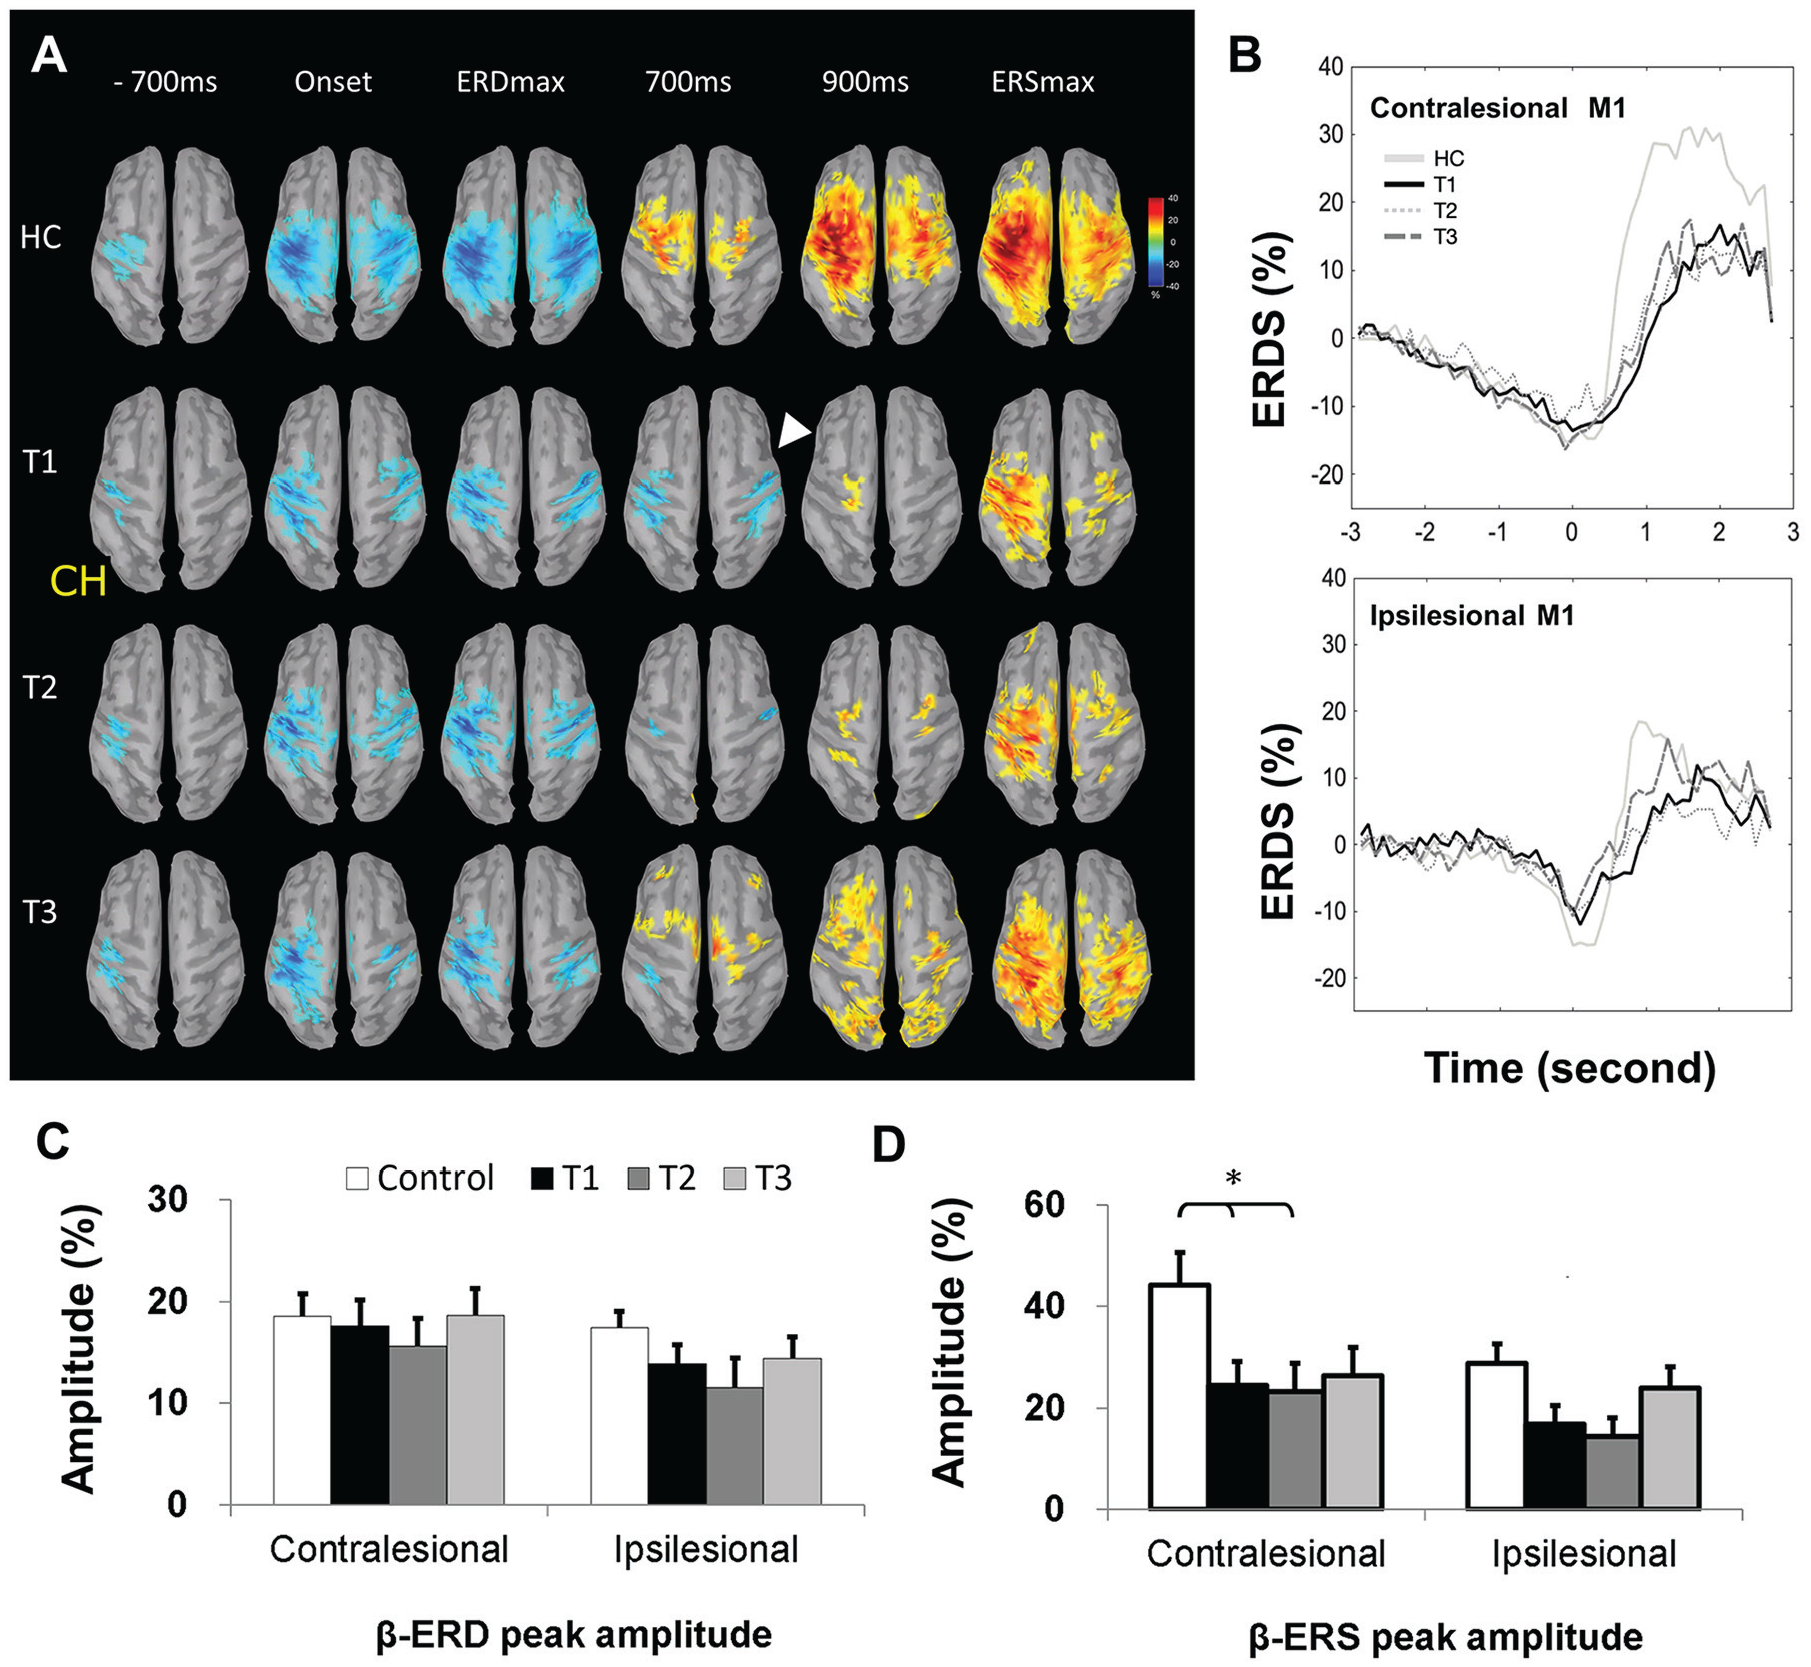
We next wished to investigate the neural correlates of the paretic finger movement. Activity in the β-band at key temporal phases, including (1) motor preparation (−700 ms), (2) movement onset (0 ms), (3) maximal ERD, (4) 700 ms, and (5) 900 ms postmovement and (6) maximal ERS, were shown (Figure 3A) in both controls (nondominant left hand, n = 25) and right hemispheric stroke survivors (left paretic hand) at T1 (n = 12), T2 (n = 7), and T3 (n = 8). The topography threshold was set at ±10% across all figures to enable visual comparisons of all key phases among all groups.
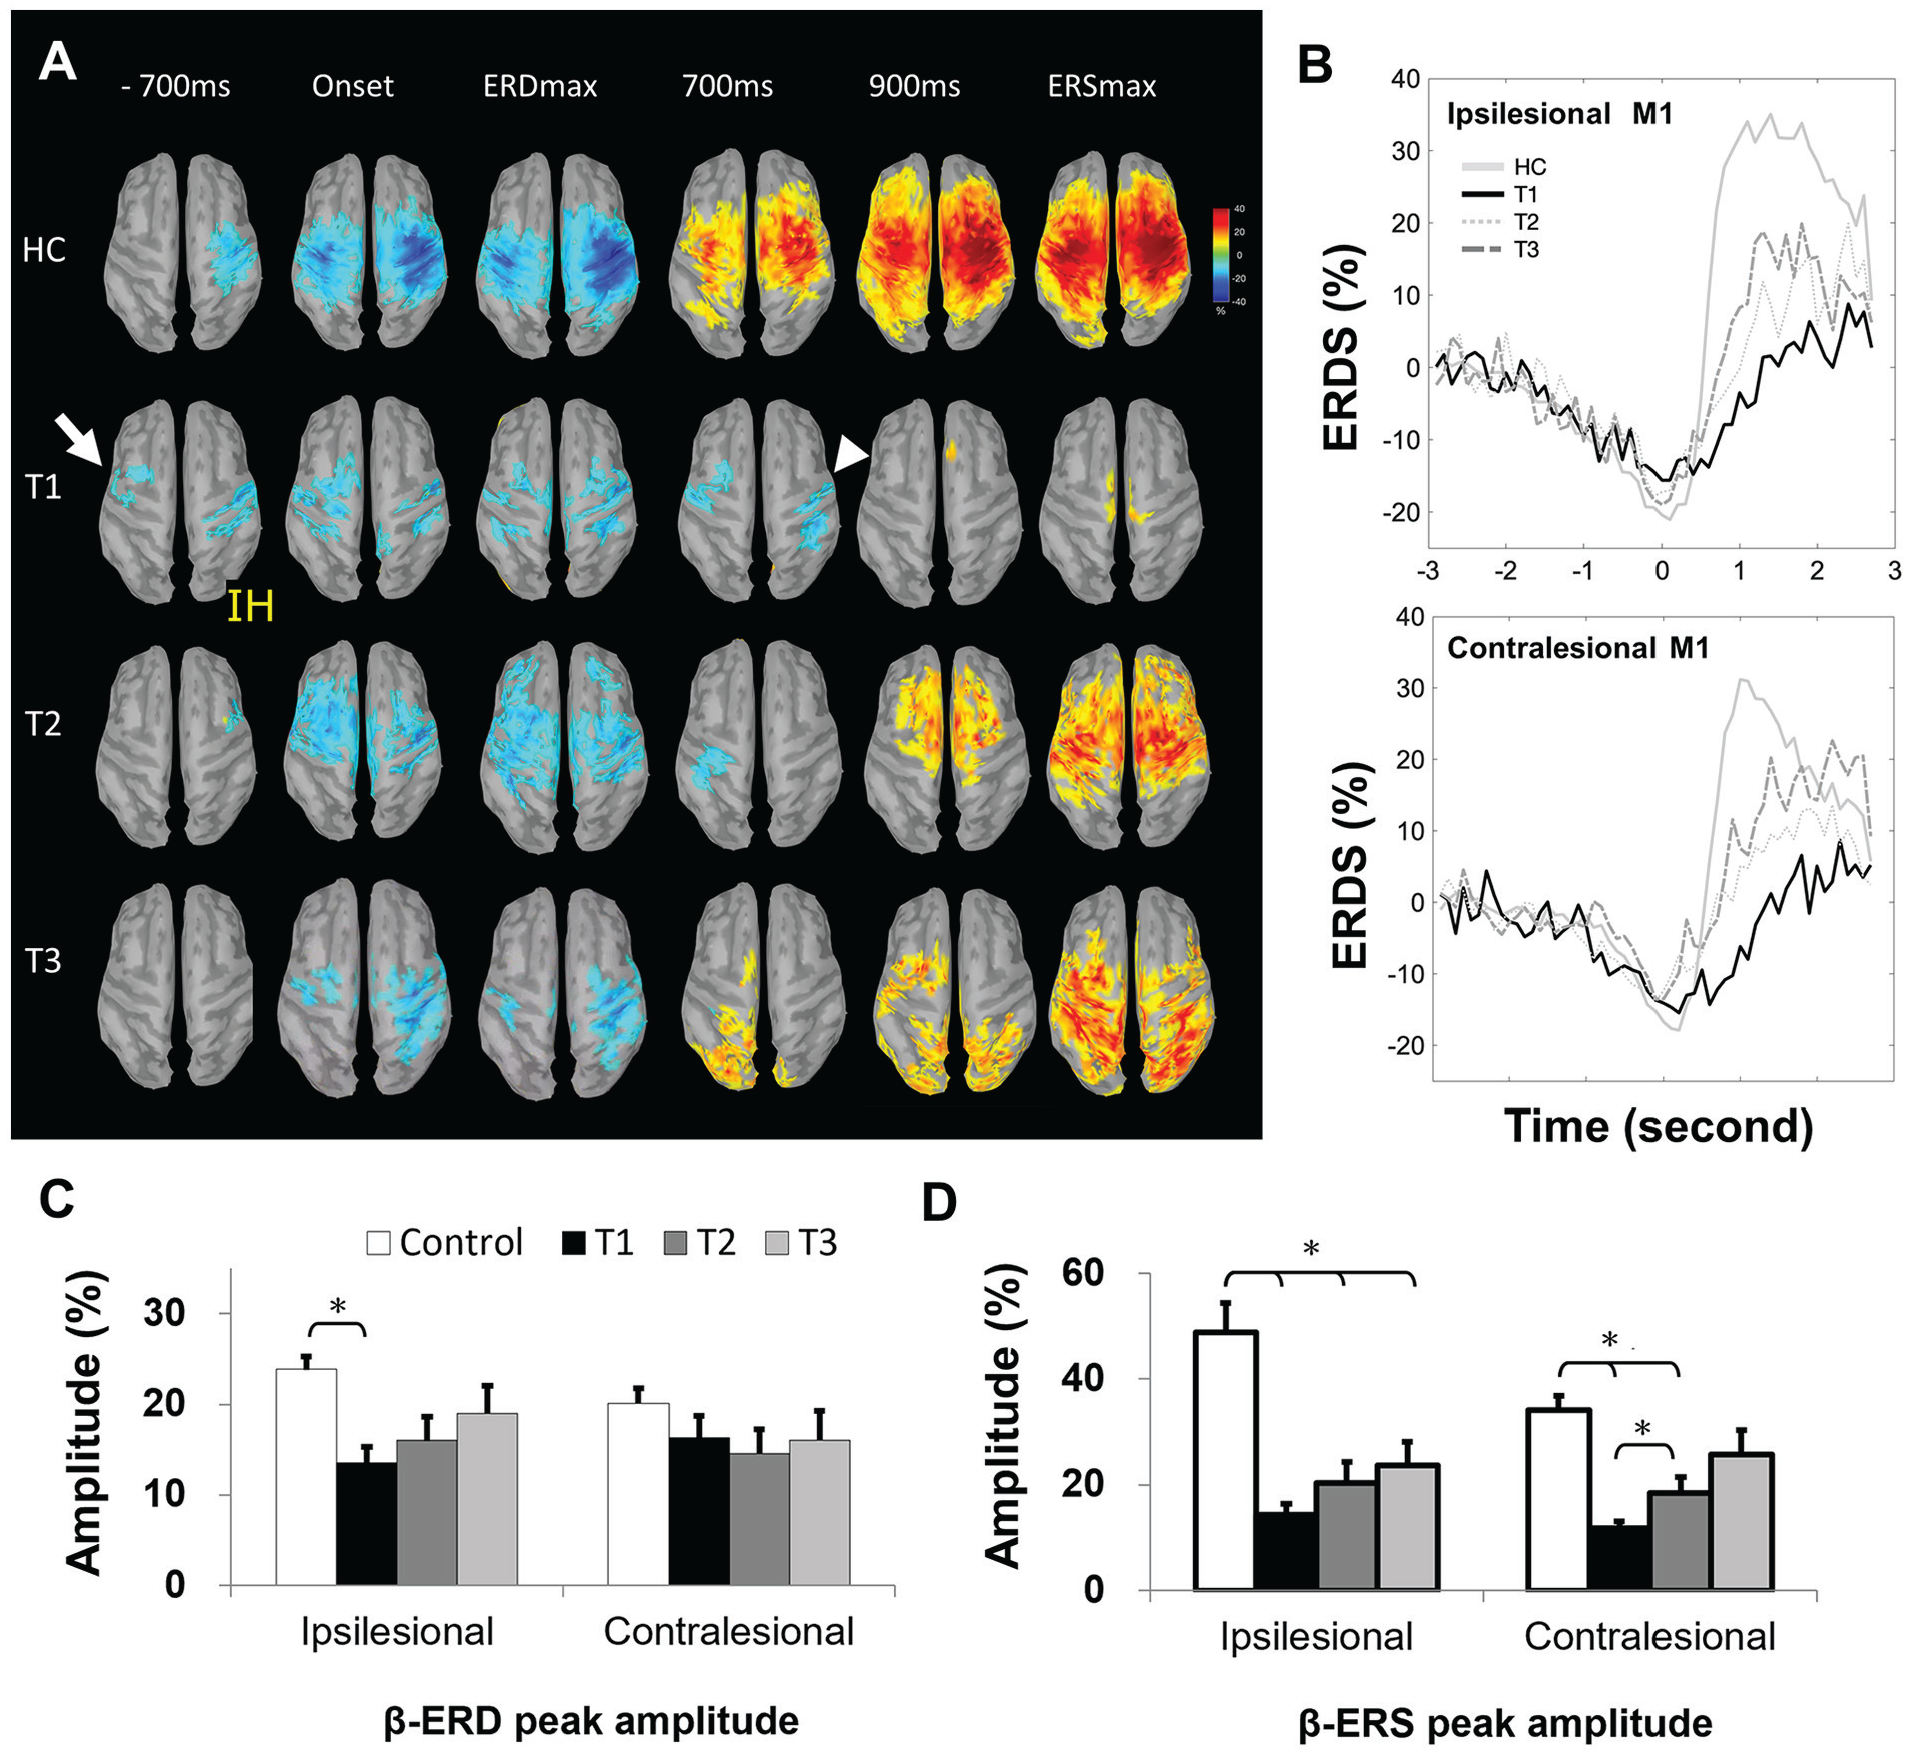
Motor task–dependent β-oscillations during stroke recovery (paretic hand). (A) Topographic features of β-rhythm, event-related desynchronization (β-ERD, blue), and event-related synchroinzation (β-ERS, yellow-red) in sequential movement phases from HCs (nondominant left finger lifting, n = 25) and right hemispheric stroke survivors (paretic left finger lifting; n = 12 at T1, n = 8 at T2, n = 9 at T3). Topography threshold was set at ±10% to display all key phases among all groups. The arrow indicated early contralesional premotor cortex activation; arrowhead represented delayed ERS appearance. See Results section for details. (B) Illustration of the group-level maximal ERD and ERS changes (power percentage) in the bilateral M1 from HCs (n = 25) and all stroke survivors (n = 22 at T1, n = 15 at T2, n = 16 at T3). (C) The ERD and (D) ERS peak amplitudes of HCs and stroke survivors at T1, T2, and T3 in ipsilesional (right in HCs) and contralesional (left in HCs) M1.
At the motor preparation phase (−700 ms, with movement onset at 0 ms), stroke survivors at T1 showed early ERD activation over the contralesional premotor cortex as compared with healthy controls (arrow in Figure 3A). During stroke recovery (T2 and T3), this contralesional early activation mostly subsided. At the postmovement phase of approximately 900 ms, stroke survivors at T1 showed prolonged ERD activation in both hemispheres (ie, delayed appearance of ERS response, arrowhead in Figure 3A), and such ERD prolongation was shortened to approximately 700 ms at stroke T3. The group-level ERD and ERS curves in the bilateral M1 reflected similar ERD duration changes (Figure 3B).
β-ERD/ERS Amplitudes Were Decreased at Baseline in Stroke Survivors and Increased During Recovery
To investigate poststroke-specific changes in β-band activity, in line with our a priori hypotheses, we went on to investigate the peak amplitudes of the β-ERD and the β-ERS between healthy controls and stroke survivors at T1 (Figures 3C and 3D). The β-ERD peak amplitudes (%) of healthy controls and stroke survivors at T1, T2, and T3 (Figure 3C) were 24 ± 1.5, 14 ± 1.8, 16 ± 2.6, and 19 ± 3.0 in the ipsilesional (right in healthy controls) M1 and 20 ± 1.7, 16 ± 2.5, 15 ± 2.8, and 16 ± 3.2 in the contralesional (left in healthy controls) M1. The β-ERS peak amplitudes of healthy controls and stroke survivors at T1, T2, and T3 (Figure 3D) were 49 ± 5.7, 14 ± 2.0, 20 ± 4.0, and 24 ± 4.4 in the ipsilesional (right in healthy controls) M1 and 34 ± 2.7, 12 ± 1.4, 18 ± 2.9, and 26 ± 4.5 in the contralesional (left in healthy controls) M1. A 2 × 2 × 2 mixed-model ANOVA was run with β-band metric (β-ERD, β-ERS) and hemisphere (ipsilesional [right for controls], contralesional [left for controls]) as within-subject factors, group (control, stoke T1) as between-subject factor, and peak amplitudes of the β-band metric as the dependent variables. There was a significant difference between stroke survivors and controls [F(1, 45) = 24.8; P < .001] as well as the main effect of metric [F(1, 45) = 15.44; P < .001] but not hemisphere [F(1, 45) = 2.44; P = .125]. There was also a significant Metric × Group interaction [F(1, 45) = 5.75; P = .001], in line with our hypothesis that specific aspects of β-band activity may be differently affected in subacute stroke. Post hoc testing revealed significant differences between control and stroke T1 [t(45) = 4.21; P < .001] in ipsilesional β-ERD (Figure 3C) and between control and stroke T1 in both ipsilesional β-ERS [t(45) = 4.17; P < .0005] and contralesional β-ERS [t(45) = 3.83, P < .001; α = .025 (corrected for multiple comparisons); Figure 3D].
We then went on to look at the change in these metrics during recovery. We ran a 2 × 2 × 3 repeated-measures ANOVA for stroke survivors who had completed all 3 sessions, with hemisphere (ipsilesional, contralesional), β-band metric (β-ERD, β-ERS), and timepoint (T1, T2, T3) as within-subject factors. This demonstrated a main effect of time [F(2, 22) = 5.39; P = .012] but no main effect of hemisphere [F(1, 11) = 0.071; P = .79] or β-band metric [F(1, 11) = 2.81; P = .12]. There were no significant interaction terms. Post hoc testing in ipsilesional M1 β-ERD peak amplitude showed significant changes over time [F(2, 22) = 3.78, P = .039; Figures 3C and 3D], although Bonferroni post hoc tests revealed only a trend of increase from T1 to T2 (P = .11) and T1 to T3 (P = .16). Contralesional M1 β-ERD showed no changes over time. The ipsilesional M1 β-ERS amplitude showed no changes over time [F(2, 22) = 1.73; P = .20], but the contralesional M1 β-ERS amplitude significantly changed over time [F(1.17, 12.8) = 4.71; P = .045]. Bonferroni post hoc tests revealed a significant increase from T1 to T2 (P = .04) and a trend of increase from T1 to T3 (P = .15).
To determine whether these metrics were still significantly different from controls at T2 or T3, we ran the same analyses that was performed at T1. There was still a significant difference between controls and stroke survivors at T2 in both the ipsilesional β-ERS amplitude (P = .006) and the contralateral β-ERS amplitude (P = .013), but only in the ipsilesional β-ERS amplitude at T3 (P = .016; Figures 3C and 3D).
β-ERD/ERS Amplitude in Stroke Recovery Related to Motor Function
We next wanted to investigate whether any of our β-band metrics were related to behavior. We used 2 measures of behavior: the FM-UE and the ARAT. The ipsilesional M1 β-ERD peak amplitudes were significantly positively correlated with both the concurrent FM-UE at stroke T1 and ARAT at stroke T1, T2, and T3 (r = 0.51, P = .016 for T1 β-ERD and T1 FM-UE; r = 0.61, P = .003 for T1 β-ERD and T1 ARAT; r = 0.66, P = .008 for T2 β-ERD and T2 ARAT; r = 0.60, P = .015 for T3 β-ERD and T3 ARAT, α [adjusted for multiple comparisons—3 time points] = .017; Figure 4A), such that stroke survivors with greater ipsilesional β-ERD peak amplitude had better motor function.
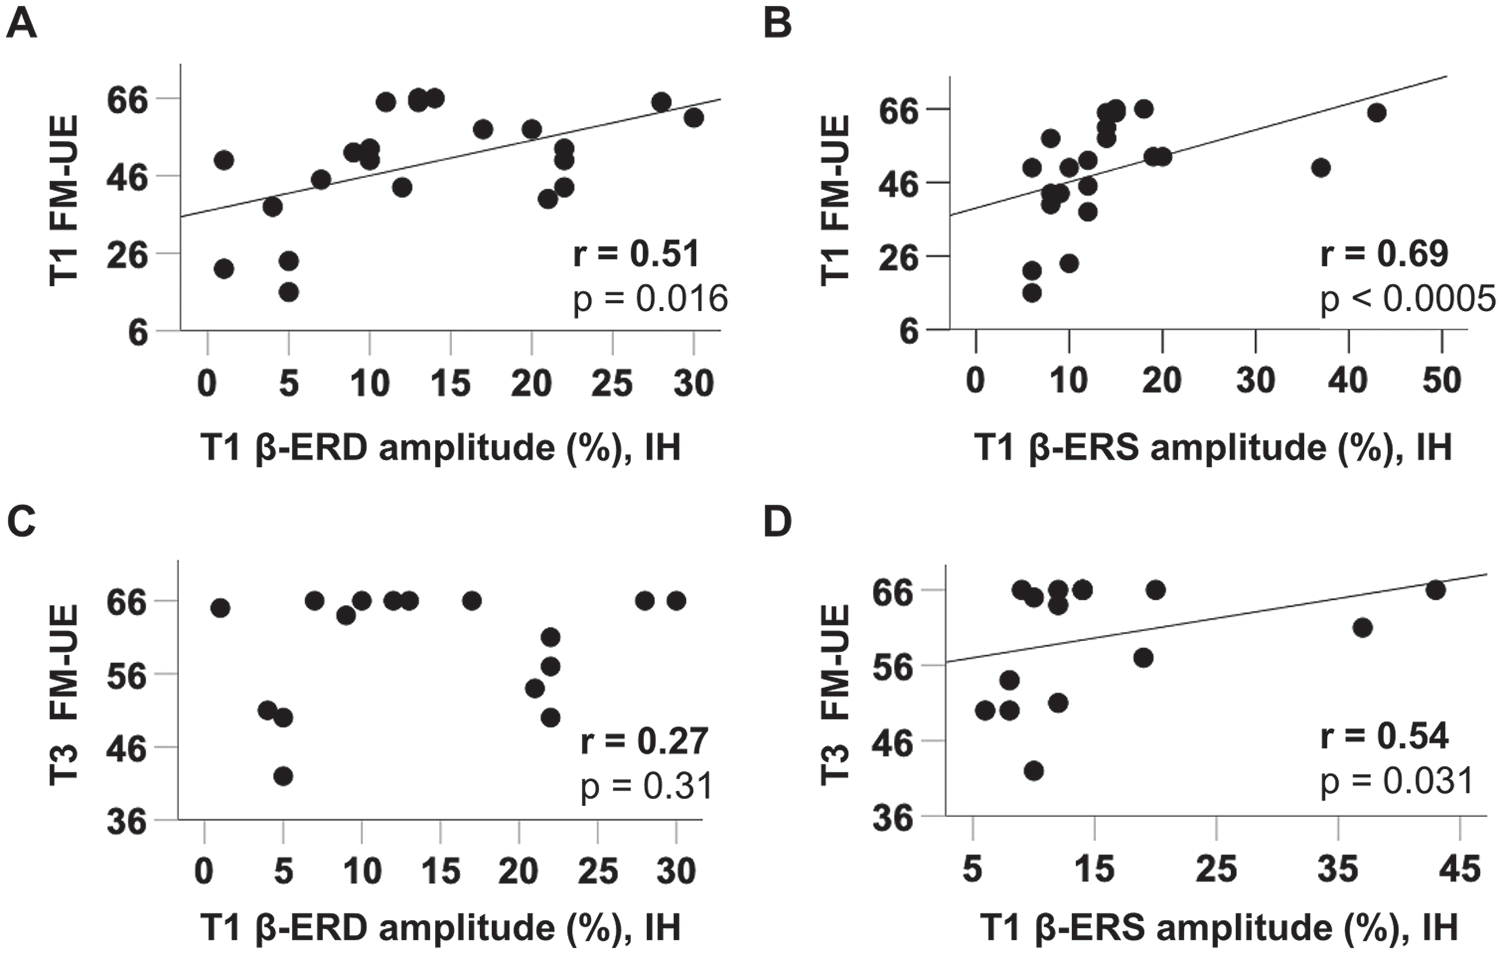
Functionally correlated β-oscillations in subacute stroke. A. In subacute stroke (T1), ipsilesional primary motor cortex (M1) β-event-related desynchronization (β-ERD) amplitudes positively correlated with concurrent Fugl-Meyer upper extremity (FM-UE) score. Similar correlations were also seen in Action Research Arm Test (ARAT, not shown) B. In stroke T1, ipsilesional M1 β-event-related synchronization (β-ERS) peak amplitudes positively correlated with concurrent FM-UE score. Similar correlations were also seen in ARAT (not shown). C. Ipsilesional M1 β-ERD peak amplitudes at T1 showed no significant correlation with FM-UE at T3, partly related to the ceiling effect. D. Ipsilesional M1 β-ERS peak amplitudes at T1 positively correlated with FM-UE score at T3.
The ipsilesional β-ERS peak amplitudes were significantly positively correlated with concurrent FM-UE and ARAT at stroke T1 (r = 0.69, P < .0005 for T1 β-ERS and T1 FM-UE; r = 0.49, P = .02 for T1 β-ERS and T1 ARAT; α [adjusted for multiple comparisons—3 time points] = .017; Figure 4B). Contralesional β-ERD and β-ERS showed no significant functional correlations with concurrent motor scores.
Association of Early β-ERD/ERS With Functional Outcome at 3 Months
We were interested in whether outcome at 3 months (T3) correlated with either the β-ERD or β-ERS in subacute stroke (T1). The ipsilesional β-ERD amplitude at T1 showed no significant correlation with T3 FM-UE (r = 0.27; P = .31) or T3 ARAT (r = 0.47; P = .07), partly related to ceiling effect of motor scores at T3 (Figure 4C). As for the ipsilesional β-ERS peak amplitude at T1, it was positively correlated with T3 FM-UE (r = 0.54, P = .031; Figure 4D).
We then wished to know whether the ipsilesional β-ERS amplitude shared common effects in correlation with the T1 FM-UE, possibly suggesting a common mechanism, or whether ipsilesional β-ERS amplitude could independently predict behavioral recovery. We performed a partial correlation analysis between ipsilesional β-ERS amplitude at T1 and FM-UE at T3, controlling for FM-UE at T1 and demonstrated that the relationship was no longer significant.
Motor Task–Dependent β-Oscillations During Nonparetic Hand Movement
Finally, we applied the equivalent analyses in nonparetic (right in controls) hand movement to explore if these β-ERD/ERS changes were specific to paretic hand movement or were a general poststroke phenomenon. The MEG data of the nonparetic (right in controls) hand were measured immediately after the paretic hand (left in controls) in the same MEG session, available in 19 (T1), 13 (T2), and 16 (T3) of our stroke survivors and in 25 controls. The EMG duration of nonparetic hand movement after stroke showed no difference when compared with controls (right hand) or during poststroke recovery (Figure 2E). As seen in Figure 5, there was no early ERD at stroke T1, unlike in the paretic hand, but similar delayed appearance of ERS response was noted (arrowhead in Figure 5A) when compared with controls. The ERD prolongation also shortened to approximately 700 ms at stroke T3 (Figures 5A and 5B). The β-ERD peak amplitudes (%) of healthy controls and stroke survivors at T1, T2, and T3 (Figure 5C) were 17 ± 1.6, 14 ± 1.9, 12 ± 2.9, and 14 ± 2.1 in the ipsilesional (right in healthy controls) M1 and 19 ± 2.3, 18 ± 2.6, 16 ± 2.7, and 19 ± 2.6 in the contralesional (left in healthy controls) M1. The β-ERS peak amplitudes of healthy controls and stroke survivors at T1, T2, and T3 (Figure 5D) were 29 ± 3.9, 17 ± 3.6, 14 ± 3.6, and 24 ± 4.2 in the ipsilesional (right in healthy controls) M1 and 44 ± 6.4, 25 ± 4.7, 23 ± 5.6, and 26 ± 4.2 in the contralesional (left in healthy controls) M1. There was a significant decrease of β-ERS at stroke T1 and T2 [F(1, 42) = 6.33, P = .016 for T1; F(1, 42) = 6.50, P = .015 for T2] when compared with controls but not in β-ERD (full statistics in Supplementary Table S3). Post hoc testing revealed a significant decrease of contralesional β-ERS [t(42) = 2.32, P = .025 for T1; t(36) = 2.35, P = .024 for T2] and a trend of decrease of ipsilesional β-ERS [t(42) = 2.16, P = .037 for T1; t(36) = 2.13, P = .04 for T2; α = .025 for multiple comparisons]. The peak amplitudes of β-ERD or β-ERS showed no significant difference between T1, T2, and T3 (all P > .1; full statistics in Supplementary Table S3). There was no significant behavioral correlation with the β-ERD/ERS metrics of nonparetic hand movement (all P > .1; Supplementary Table S4).
Motor task–dependent β-oscillations during stroke recovery (nonparetic hand). The equivalent analyses of Figure 3 in nonparetic (right in healthy controls) hand movement. (A) Topographic features of β-rhythm, from healthy controls (n = 25) and right hemispheric stroke participants (n = 11 at T1, n = 7 at T2, n = 9 at T3). The arrowhead represented delayed ERS appearance. (B) Illustration of the group-level maximal ERD and ERS changes (power percentage) in the bilateral M1 from healthy controls (n = 25) and all stroke participants (n = 19 at T1, n = 13 at T2, n = 16 at T3). (C) The ERD and (D) ERS peak amplitudes of healthy controls and stroke survivors at T1, T2, and T3.
Discussion
We performed this study to characterize how β-band activity changes during motor recovery poststroke. The homogeneous stroke profile in our stroke survivors (mild to moderate unilateral MCA subcortical infarctions) enabled us to extract reliable information in this common clinical stroke syndrome. As expected, the motor outcome could be predicted by early motor scores at the subacute time point, whereas the neuroplastic mechanisms underlying motor recovery were reflected by MEG markers, including the ipsilesional β-ERD and β-ERS peak amplitudes. Our results were in line with earlier studies by Parkkonen et al,22,34 who utilized both tactile stimulation and passive movement in acute stroke survivors, with longitudinal follow-up.
Changes in Ipsilesional, Not Contralesional, β-Band Metrics Reflect Behavioral Improvements
Our data demonstrate clear relationships at every time point between the ipsilateral β-ERD/ERS amplitude and both the ARAT and FM-UE. However, there were no relationships observed between β-band metrics in the contralesional hemisphere. The contralesional hemisphere was proposed to have different roles in subacute and chronic stroke,46,47 and our findings highlighted the importance of ipsilesional hemisphere reorganization in subacute stroke. It may well be that contralesional hemisphere reorganization plays an important role later in the recovery process.
β-Band Metrics at T1 Hint Mechanisms Underlying Functional Recovery
We showed that ipsilesional M1 β-band metrics correlated with the 3-month FM-UE motor outcome, though these relationships were no longer significant when the T1 FM-UE score was included. This suggests that the β-band metrics and FM-UE share common variance, as would be suggested by their relationship at each time point in the study, highlighting perhaps that β-band metrics can elucidate the mechanisms underpinning functional recovery poststroke.
β-ERD Amplitude Is Thought to Reflect Neural Activation in M1
In line with previous studies,19,20,48 we found that the ipsilesional β-ERD peak amplitudes decreased after stroke and correlated with concurrent motor scores. In this longitudinal study, we also demonstrated that ipsilesional β-ERD peak amplitudes increased during motor recovery and correlated with behavioral improvements. The β-ERD appears to be a reflection of overall cortical excitability49,50 and decreased in poststroke ipsilesional M1. A decrease in β-ERD peak amplitude in M1 also occurs in the slowing of movement in movement disorders such as Parkinson disease, 51 leading to the suggestion that an abnormally low β-ERD peak amplitude is pathological and may lead to the decrease in the precise and tractable control of movements. 52
β-ERS Amplitude Is Thought to Reflect Changes in Intracortical Inhibition in M1
After stroke, the β-ERS peak amplitudes significantly decreased in both hemispheres and remained low during stroke recovery, particularly in the ipsilesional hemisphere. At stroke T3, the ipsilesional β-ERS peak amplitudes were still significantly lower than that in healthy controls (Figure 3D).
β-ERS is thought to reflect intracortical inhibition and has been related to cortical GABA concentrations. 53 Therefore, decreased β-ERS peak amplitudes in acute/subacute stroke may reflect reduced intracortical inhibition, which is known to occur early after stroke. 26 Consistent with this, the TMS metric of short-interval cortical inhibition (SICI) has also revealed decreased intracortical inhibition in both hemispheres after acute stroke, especially in the ipsilesional hemisphere. 54 Low β-ERS peak amplitudes at T1 in the ipsilesional hemisphere correlated with functional outcome at T3 (Figure 4D), suggesting that a decreased β-ERS may be beneficial for promoting motor recovery. One previous MEG study revealed decreased β-ERS amplitudes in the bilateral M1 following 2 weeks of rehabilitation in chronic stroke survivors, 33 supporting the inference regarding low β-ERS status.
β-ERS Changes in Nonparetic Hand Movement Reflect Generalized Disinhibition Status in Subacute Stroke
The delay in onset and decreased peak amplitude of β-ERS was observed in both paretic and nonparetic hand motor tasks in subacute stroke (Figures 3A and 5A), although the changes were more prominent and correlated with behavior only in paretic hand movement. A similar phenomenon was observed in the TMS study that the SICI also decreased in contralesional M1 particularly in subacute stroke.54,55 Parkkonen et al22,34 also discovered that the β-rebound decreased after somatosensory stimulation in both paretic and nonparetic hands when compared with healthy controls, and only the β-rebound of the paretic hand correlated with concurrent motor scores. Subacute stroke constitutes a unique, highly sensitive period for motor recovery, 10 and the bihemispheric changes in β-ERS featured the global disinhibition status in this period.
Many factors may affect ERD and ERS responses during motor tasks, including the length of sustained movement, 56 the number of activated muscles, 32 and the rate of force during isometric contraction. 57 Therefore, we chose a relatively effortless, simple finger-lifting task in this study. The index finger lifted at around a 30° angle off the optic detection pad and then went back to the original neutral position without sustained movements, or complex or isometric muscle contractions. Although we cannot rule out that the differences we observed between stroke survivors and controls in terms of the ERD and ERS were driven by changes in kinematics, no significant correlations were observed between β-ERD and β-ERS amplitudes and the EMG duration (Supplementary Table S2); also, the nonparetic hand movement disclosed a similar pattern of changes in β-ERD/ERS duration.
There are limitations in this MEG study. The ceiling effects of motor scores in the 12th (T3) week after stroke onset may underestimate the correlation with baseline β-ERD/ERS. The effect of handedness may exist, but it is unlikely to change our main findings because the topographical patterns and quantification results were similar in our stroke survivors with either the left (n = 12) or right (n = 10) paretic hand. In this study, we cannot draw definitive conclusions about the effects of intensive rehabilitation because the scores of stroke survivors at T2 were between those at T1 and T3. It is, therefore, not possible to disentangle the effects of intensive rehabilitation from those of the simple passage of time.
Conclusions
Our work revealed dynamic features of β-oscillations during motor recovery from the subacute to the chronic stage in stroke survivors with mild to moderate hand paresis. Ipsilesional β-ERD and β-ERS peak amplitudes in subacute stroke were functional MEG markers synchronized with the changes in clinical motor scores. β-ERS peak amplitude decrease in either paretic or nonparetic hand movement in subacute stroke reflected the generalized disinhibition status. These neural features hinted that the integrity of M1 activities and the maintenance of intracortical disinhibition were involved in cortical remodeling mechanisms during motor recovery, particularly in subacute stroke.
Supplemental Material
Supplementary – Supplemental material for β-Oscillations Reflect Recovery of the Paretic Upper Limb in Subacute Stroke
Supplemental material, Supplementary for β-Oscillations Reflect Recovery of the Paretic Upper Limb in Subacute Stroke by Chih-Wei Tang, Fu-Jung Hsiao, Po-Lei Lee, Yun-An Tsai, Ya-Fang Hsu, Wei-Ta Chen, Yung-Yang Lin, Charlotte J. Stagg and I-Hui Lee in Neurorehabilitation and Neural Repair
Footnotes
Acknowledgements
We thank the Pervasive Artificial Intelligence Research Lab, and the staff in the Clinical Research Core Laboratory and the Stroke Registry of the Taipei Veterans General Hospital for providing experimental facilities and registry data, respectively.
Supplementary material for this article is available on the Neurorehabilitation & Neural Repair website along with the online version of the article.
Declaration of Conflicting Interests
The author(s) declared no potential conflicts of interest with respect to the research, authorship, and/or publication of this article.
Funding
The author(s) disclosed receipt of the following financial support for the research, authorship, and/or publication of this article: This work was supported by the Taiwan Ministry of Science and Technology (MOST, 106-2314-B-075-019-MY3, 107-2634-F-008-003, 108-2634-F-008-003), the Taipei Veterans General Hospital (V107C-064, V108C-052, V109C-034), the Far Eastern Memorial Hospital (FEMH-2014-C-018, FEMH-2015-C-025), the Taiwan Ministry of Education (Academic Strategic Alliance Project between Taiwan and Oxford University), and the National Yang-Ming University (Brain Research Center, from The Featured Areas Research Center Program within the framework of the Higher Education Sprout Project by the Taiwan Ministry of Education). CJS holds a Sir Henry Dale Fellowship, funded by the Wellcome Trust and the Royal Society (102584/Z/13/Z).
References
Supplementary Material
Please find the following supplemental material available below.
For Open Access articles published under a Creative Commons License, all supplemental material carries the same license as the article it is associated with.
For non-Open Access articles published, all supplemental material carries a non-exclusive license, and permission requests for re-use of supplemental material or any part of supplemental material shall be sent directly to the copyright owner as specified in the copyright notice associated with the article.