
Abstract
Background. The time course of cortical activation and its relation with clinical measures may elucidate mechanisms underlying spontaneous neurobiological recovery after stroke. Objective. We aimed to investigate (1) the time course of cortical activation as revealed by EEG-based spectral characteristics during awake rest and (2) the development of these spectral characteristics in relation to global neurological and upper-limb motor recovery in the first 6 months poststroke. Methods. Resting-state EEG was measured serially in 41 patients after a first-ever ischemic stroke, within 3 and at 5, 12, and 26 weeks poststroke. We computed the brain symmetry index (BSI) and directional BSI (BSIdir) over different frequency bands (1-25 Hz, delta, theta) and delta/alpha ratio (DAR). The National Institutes of Health Stroke Scale (NIHSS) and Fugl-Meyer motor assessment of the upper extremity (FM-UE) were determined as clinical reflections of spontaneous neurobiological recovery. Longitudinal changes in spectral characteristics and within- and between-subject associations with NIHSS and FM-UE were analyzed with linear mixed models. Results. Spectral characteristics showed a gradual normalization over time, within and beyond 12 weeks poststroke. Significant within- and between-subject associations with NIHSS were found for DAR of the affected hemisphere (DARAH) and BSIdirdelta. BSIdirdelta also demonstrated significant within- and between-subject associations with FM-UE. Conclusions. Changes in spectral characteristics are not restricted to the time window of recovery of clinical neurological impairments. The present study suggests that decreasing DARAH and BSIdirdelta reflect improvement of global neurological impairments, whereas BSIdirdelta was also specifically associated with upper-limb motor recovery early poststroke.
Introduction
Most stroke survivors suffer from upper limb paresis in the acute phase after stroke. 1 About 70% to 80% of them will show some level of spontaneous neurobiological recovery (ie, “recoverers”), whereas 20% to 30% of patients do not recover at all (ie, “nonrecoverers”). 2 Spontaneous motor recovery takes place predominantly within the first 3 months poststroke, after which most patients reach a plateau. 3 The mechanisms that drive spontaneous neurobiological recovery are mainly the salvation of penumbral tissue 4 and spontaneous regenerative processes enhanced by an upregulation of growth-promoting factors, angiogenesis, and resolution of diaschisis.4,5
The main improvements in terms of the National Institutes of Health Stroke Scale (NIHSS) and Fugl-Meyer motor assessment of the upper extremity (FM-UE) take place in the time window of spontaneous neurobiological recovery, which may extend up to 10 weeks after stroke onset. 6 A return of brain function toward its normal neural state is associated with better behavioral outcomes after stroke.7-9 The longitudinal association between clinical improvements and changes in cortical activation, and whether these changes occur within the time window of spontaneous neurobiological recovery, have hardly been investigated.10,11
Neuronal oscillations, measured with magneto- or electroencephalography (MEG/EEG), have been suggested to serve as a measurement tool for potential biomarkers that can be used to study the association with behavioral recovery. 11 In particular, stroke is associated with increased low-frequency brain oscillations in the delta (0.5-4 Hz) and theta bands (4-8 Hz),12-14 as well as decreased alpha (8-12 Hz) activity.15,16 A spectral characteristic quantifying this phenomenon is the delta/alpha ratio (DAR). Since stroke may lead to increased delta activity with or without decreased alpha activity, a ratio between these components may be more sensitive compared with the individual components for reflecting severity of neurological deficit, and normalization of the underlying neurological deficits due to spontaneous neurological recovery after stroke. DAR appears to correlate with the severity of global neurological impairments measured with the NIHSS 17 in the acute phase (<1 week) poststroke. However, in a recent study performed in the chronic poststroke phase (>6 months), we could not find significant differences in DAR between patients and age- and gender-matched healthy individuals, nor did we find a significant association between DAR and motor impairment as measured with the FM-UE. 14 Above results suggest a decrease in DAR over time across stroke patients toward normal values, regardless of global neurological impairment or motor impairment.
The pairwise derived brain symmetry index (BSI) captures brain activity lateralization, and seems to be associated with stroke severity.13,17,18 Several studies have shown that BSI is increased in the early subacute phase (between 1 week and 3 months)17,19 and in the chronic phase 14 poststroke, when compared with healthy individuals. The extended directional version of the BSI showed that increased low-frequency power in the affected hemisphere relative to the unaffected hemisphere (ie, asymmetry toward the affected side), is highly associated with decreased motor function of the upper extremity in patients with chronic stroke. 14 We argue that directional asymmetry measures based on low-frequency oscillations can be useful in the assessment of the asymmetry of hemispheric activity early poststroke, which normalization is associated with neurological recovery.
In the present observational cohort study with repeated measurements performed at fixed times poststroke, we investigated the time course of EEG-based spectral characteristics during awake rest as a representation of neuronal deficits. We simultaneously measured the time course of global neurological recovery and upper limb motor function early poststroke, enabling us to investigate the longitudinal associations.
We addressed the following research questions:
What is the time course of the spectral characteristics DAR, BSI, and BSIdir within the first 6 months poststroke?
Are DAR, BSI, and BSIdir longitudinally associated with clinically observed improvements of the NIHSS and FM-UE?
As regards research question 1, we hypothesized that the spectral characteristics would change in the direction of values seen in healthy individuals. 14 These changes might be caused by decreasing delta activity in the affected hemisphere, and hence might be mainly reflected by the DARAH, and the BSI and BSIdir when estimated over the delta band. In addition, we hypothesized that changes would occur within the time window of spontaneous neurobiological recovery (ie, 3 months poststroke).
We previously found a significant association for FM-UE with BSI and BSIdir but not for DAR in the chronic phase poststroke. 14 Regarding the NIHSS, literature showed a significant association in the acute phase with BSI and DAR. 17 Therefore, as regards research question 2, we hypothesized that recovery of global neurological impairment as measured with NIHSS would be positively associated with a gradual decrement (ie, normalization) in DAR. In addition, we hypothesized that a decrease in BSI (ie, normalization) would be associated with improvement of NIHSS and FM-UE scores within the first 3 months poststroke.
Methods
Participants
In our multicenter longitudinal cohort study, patients admitted to the stroke units of 6 participating hospitals from June 2015 till June 2017 were eligible for participation. Fifty-five out of 2095 screened patients were included within 3 weeks poststroke. The inclusion criteria were (1) first-ever ischemic stroke according to computed tomography or magnetic resonance imaging (MRI) scan, (2) <3 weeks poststroke, (3) upper limb paresis (NIHSS 5a/b > 0), (4) ≥18 years of age, and (5) providing written informed consent. Exclusion criteria were (1) upper extremity orthopedic limitations present prior to stroke onset, (2) recurrent stroke, and (3) severe cognitive problems, that is, Mini Mental State Examination score <18. 20 The present study (registered at the Netherlands Trial Register as NTR4221) was approved by the Medical Ethics Committee of the VU University Medical Center, Amsterdam, The Netherlands (4D-EEG: NL47079.029.14) and carried out in accordance with the Code of Ethics of the World Medical Association (Declaration of Helsinki, 2013). 21
Procedures
High-density EEG measurements and clinical assessments were performed within the first 3 weeks and at weeks 5, 12, and 26 poststroke. The first measurement was conducted as soon as feasible. To optimize the feasibility of assessing early subacute patients at fixed times poststroke, a specially equipped van (Figure 1) was used to perform clinical and EEG measurements, irrespective of the patient’s place of residence, such as a hospital, rehabilitation center, nursing home or their own home. With that, the burden of traveling for the patients was reduced. The measurement van was customized to allow EEG acquisition of the same quality as in our hospital setting. 22 The resting-state EEG measurement analyzed in the current study was part of a larger study protocol. The duration of the full EEG protocol was dependent on patient’s ability to perform tasks. Including preparation of the patient this took between 45 minutes, in case only resting-state EEG was measured, and 2 hours, in case all tasks were performed.
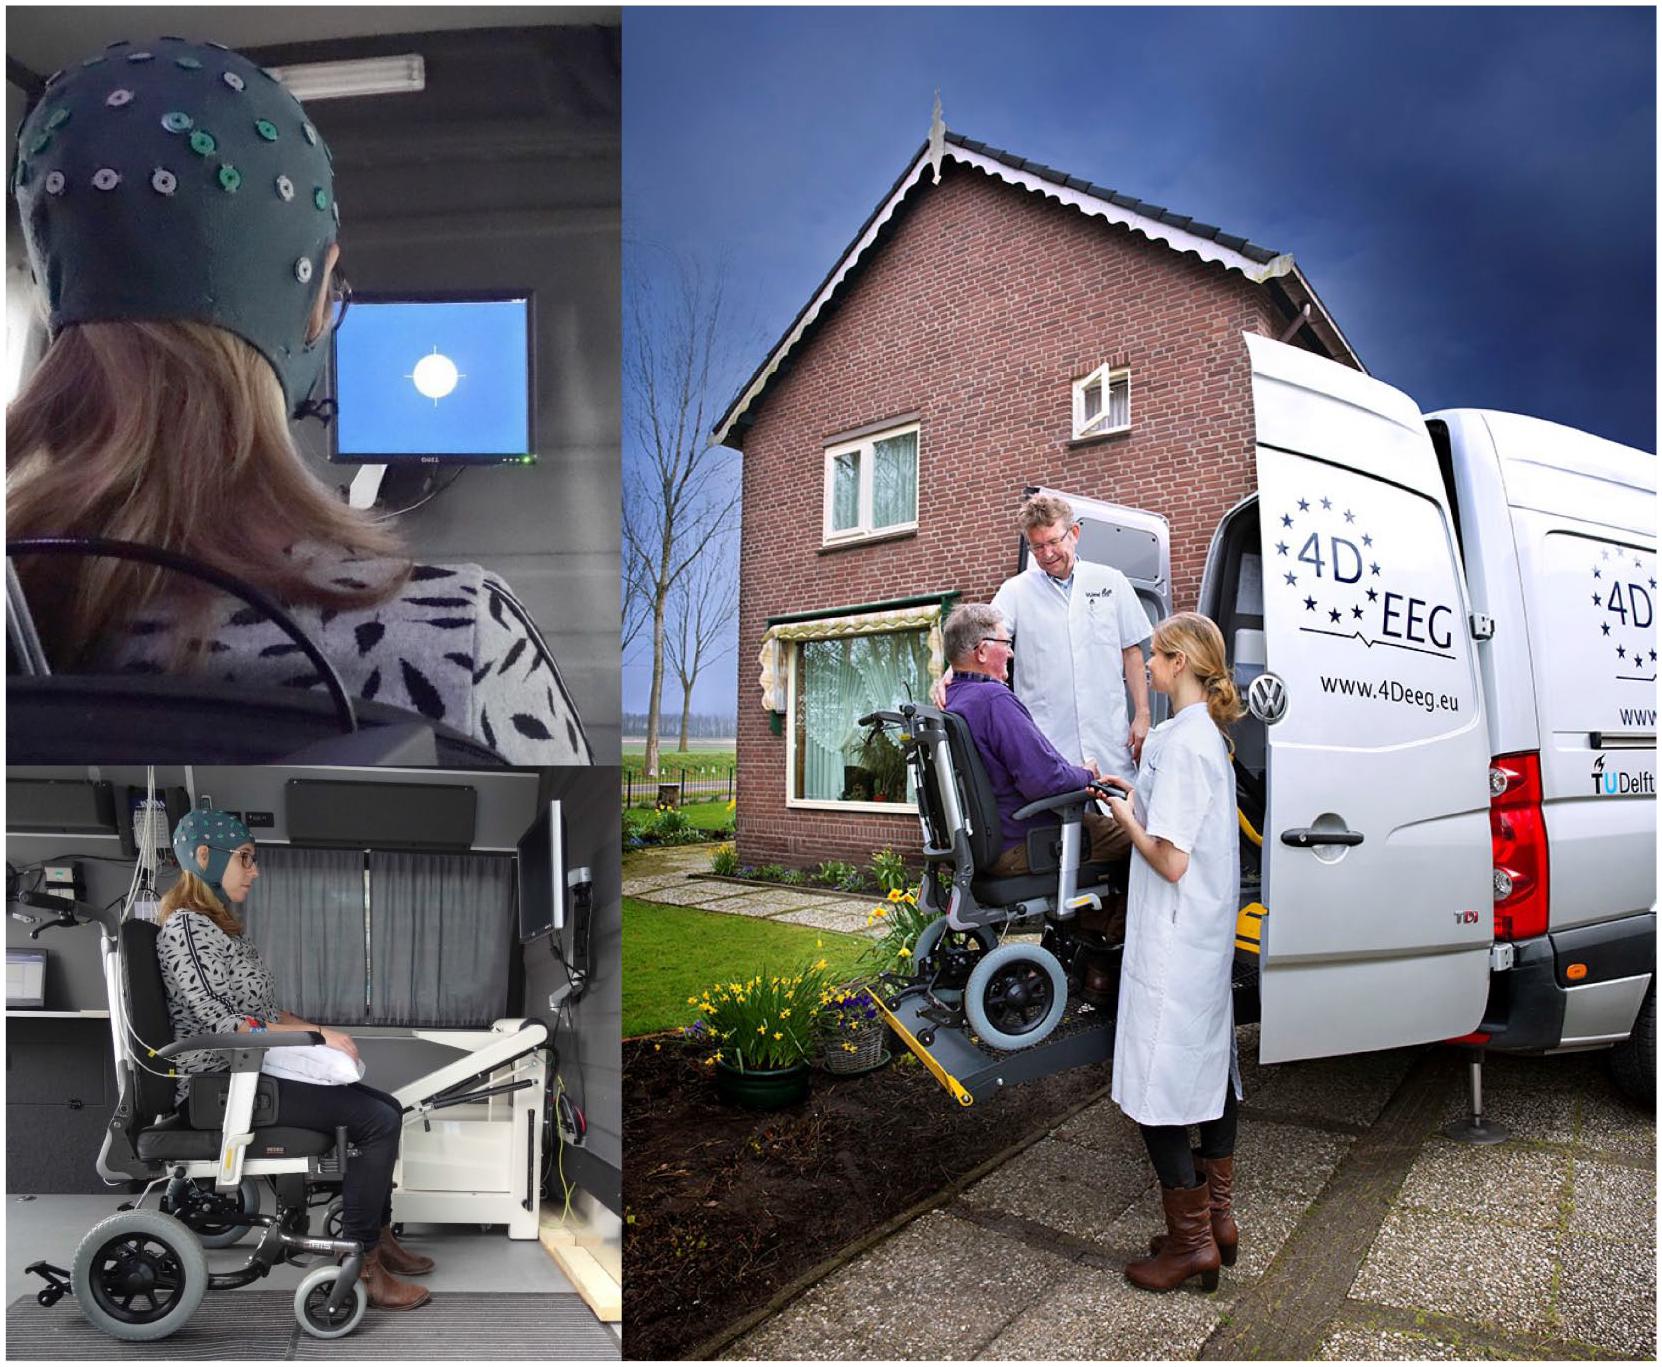
Measurement set-up in a specially equipped van. (Right photo: Anita Edridge)
Electroencephalography
During the EEG measurement, patients were seated in a wheelchair and were asked to focus their eyes on a dot displayed on a flat screen. Five consecutive trials of 1-minute resting-state EEG data were collected. High-density 62-channel EEG was recorded using an actively shielded EEG cap with electrode placement according to the international 10-20 system (Ag/AgCl electrodes and REFA multichannel amplifier, TMSi, Oldenzaal, The Netherlands, with ASA acquisition software, ANT software BV, The Netherlands). Electrode impedances were kept below 20 kohm. EEG signals were online referenced to average. In addition, bipolar Ag/AgCl electrodes served to monitor the muscle activity of the m. extensor carpi radialis and m. flexor carpi radialis of both arms. All signals were sampled at a rate of 2048 Hz.
Clinical Assessments
Clinical assessments encompassed the NIHSS (0-42) and FM-UE (0-66). NIHSS is a measure of the severity of global neurological impairment to classify stroke severity. 23 FM-UE measures the synergy-dependent motor recovery of the upper limb. Both are recommended as outcome measure in stroke research,23-25 and the time window of their change is assumed to reflect the period of spontaneous neurobiological recovery.
Data Analysis
Preprocessing
Offline analysis was conducted using Matlab (R2012a, The Mathworks, Natick, MA) with the FieldTrip toolbox for EEG/MEG analysis. 26 EEG data were filtered with a fourth-order bidirectional high-pass Butterworth filter (cutoff at 0.5 Hz). Power-line artifacts were reduced using notch filters around 50, 100, and 150 Hz (fourth-order bidirectional Butterworth, band-width 1 Hz). Channels without data or very poor data quality were interpolated as the weighted average of the surrounding electrodes, followed by re-referencing to the remaining average. For each measurement, an average of 0.17 electrodes were interpolated. Further artifact removal consisted of the exclusion of eye-blinks and muscle activity using independent component analysis based on visual inspection of the components’ waveforms, power spectrum, and topographic distributions. For each measurement, an average of 2.9 components were removed. The resulting signals were again visually inspected and segments of the data which showed remaining artifacts were removed. Analyzed epochs were as large as possible, with a maximum of 1 minute. Modified periodograms with a Hanning window with size equal to the epoch length served as proxies of the spectral power density per channel.
Spectral Characteristics
Delta/Alpha Ratio
DAR was defined as the ratio of the delta power to the alpha power. For every channel

The ratios were averaged over all N EEG channels yielding the global DAR as

In addition to the assessment over all available channels, the DAR was also calculated over the affected (DARAH) and unaffected hemisphere (DARUH), in which the electrodes covering the midline were not included.
Brain Symmetry Index
The BSI was defined as the absolute pairwise normalized difference in spectral power between the homologous channels

These values were averaged over all channel pairs

BSI values range from 0 to 1, indicating maximal symmetry and asymmetry, respectively. In our earlier cross-sectional study performed in the chronic phase poststroke (N = 21), we showed the importance of the lower frequency bands. 14 Therefore, next to the assessment over the 1- to 25-Hz range, BSI was also determined separately for the delta (1-4 Hz) and theta (4-8 Hz) frequency bands.
We supplemented the BSI by a directed version (BSIdir) to account for the direction of the asymmetry. 14 The computation of the BSIdir omitted the absolute value of the numerator of Equation (3). The sign of BSIdir was chosen such that values between 0 and 1 reflected greater cortical power in the affected hemisphere compared with the unaffected hemisphere, and vice versa for values between −1 and 0.
Statistical Analysis
The change in spectral characteristics during the first 6 months poststroke was investigated with linear mixed models analyses with the factor time (of measurement) as the main fixed effect. A random intercept per individual was used to correct for dependency between measurements. Separate models were used for each dependent outcome parameter (DAR, BSI, BSIdir).
The longitudinal association between spectral characteristics and clinical measures was investigated with longitudinal linear mixed model analyses using 2 different models. In the first model, we investigated the main effects of FM-UE and NIHSS on spectral characteristics using a linear mixed model, for each individual clinical measure. For this model, we used a random intercept for each individual, whereas time was added to the model as a potential confounder and effect modifier. Second, we applied a hybrid model 27 for the spectral characteristics, which revealed a trend or a significant longitudinal association with clinical scores measured during the first 6 months poststroke. This model made it possible to distinguish between the between- and within-subject effects of the longitudinal relationship. The between-subject covariate was determined as the individual average value over time of the independent variable, which reveals the association regardless the development over time. The within-subject covariate was calculated as the observed value minus the individual average, which reveals whether development of the dependent and independent covariates over time within a subject are associated. Subsequently, the associations between clinical measures and spectral characteristics were analyzed, resulting in 2 separate regression coefficients reflecting the within- and between-subject components of the longitudinal relationship.
Statistical analyses were performed using IBM SPSS Statistics for Windows, version 22.0 (IBM Corp, Armonk, NY, USA). Multiple testing was accounted for using the Holm-Bonferroni method. For each model, the distribution of residuals was tested for normality by inspecting histograms and Q-Q plots.
Results
Participants
A flowchart of the screening, inclusion and follow-up procedure, and an overview of missing data, are depicted in Figure 2. Forty-one out of 55 patients completed the 4 repeated measurements until 26 weeks poststroke and were included in the analyses. Baseline measurements took place at 13 ± 5days (mean ± SD) poststroke and were repeated at week 5 (32 ± 3 days), week 12 (82 ± 4 days), and week 26 (185 ± 20 days) poststroke. Patient characteristics at baseline and week 26 are presented in Table 1.
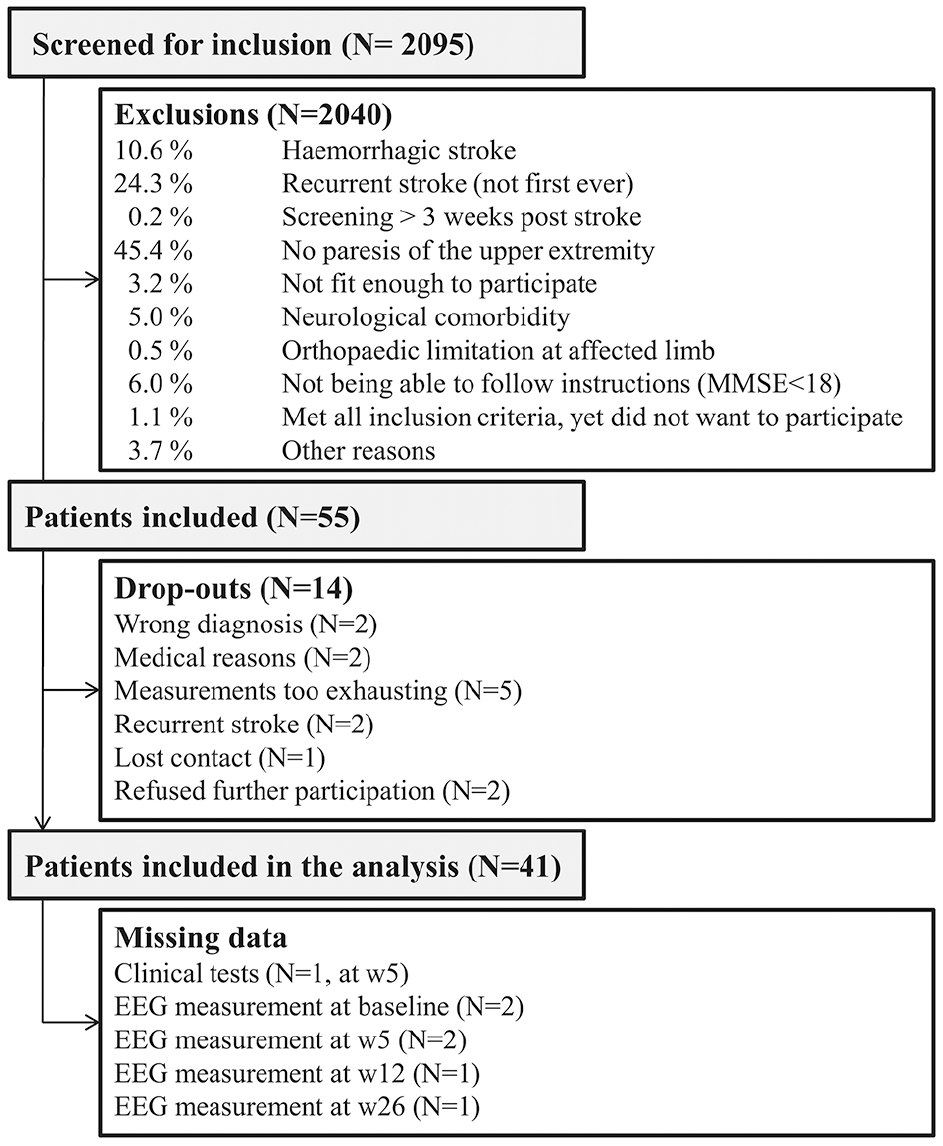
Flowchart of screening, inclusion, and follow-up.
Patient Demographics at Baseline and 26 Weeks Poststroke (N = 41). a
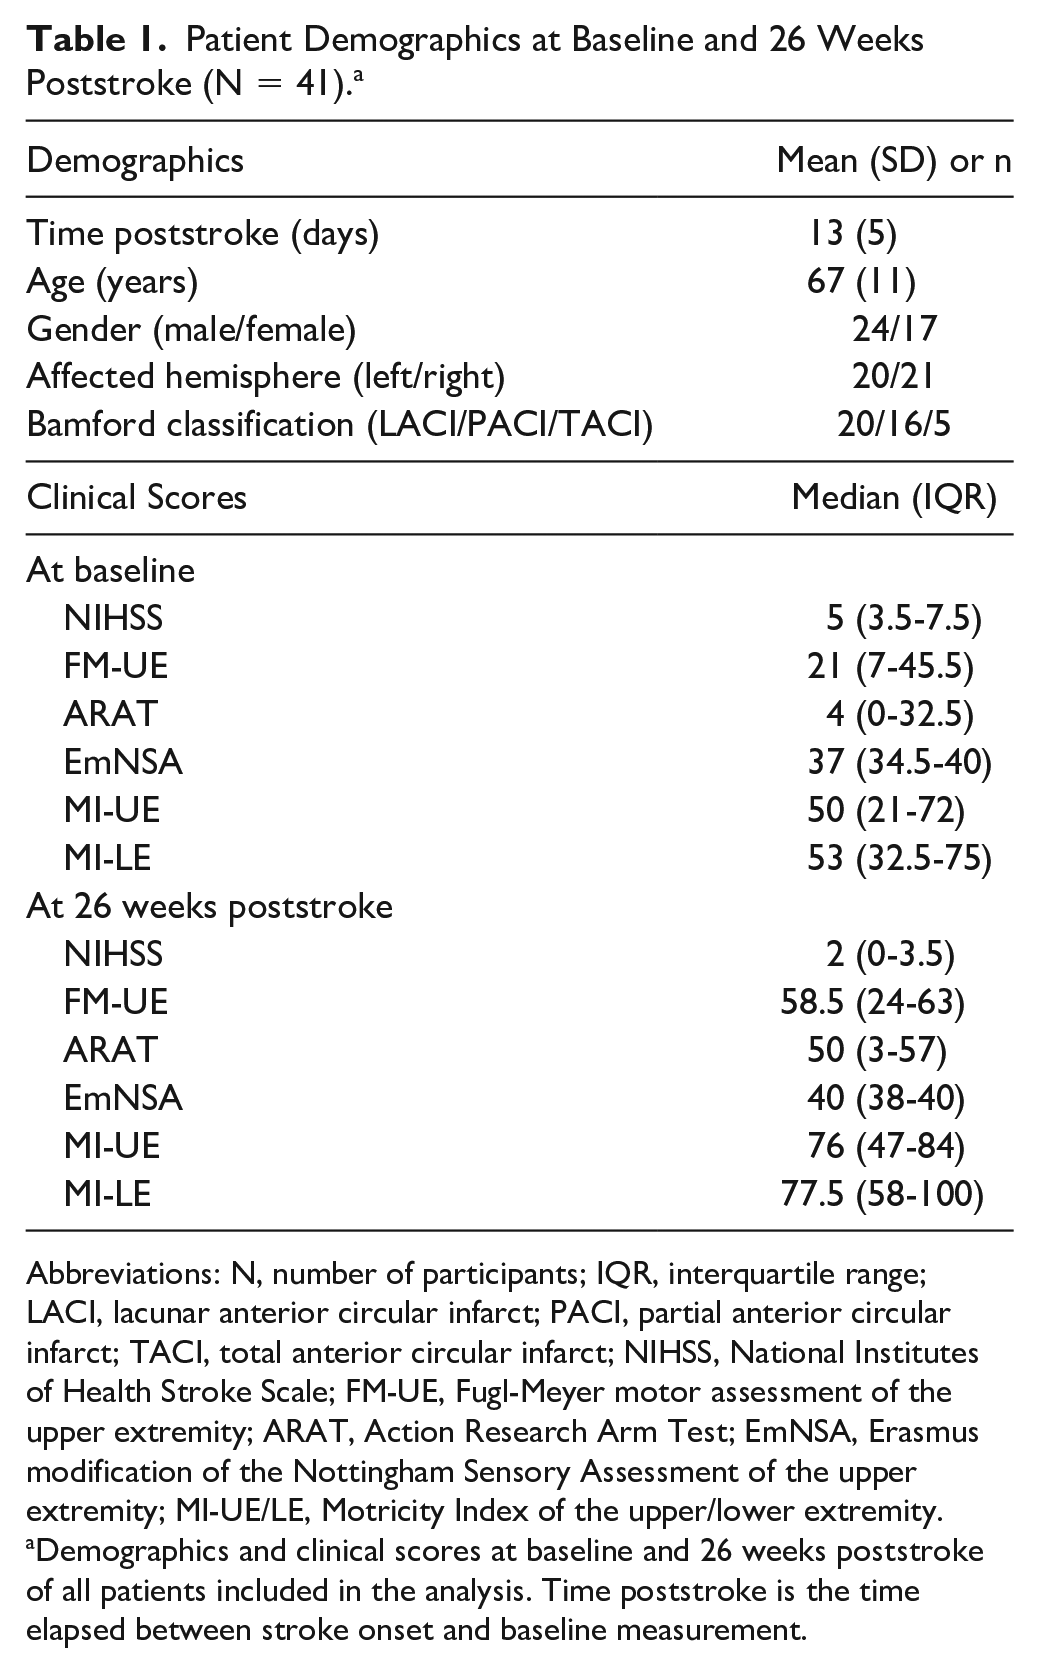
Abbreviations: N, number of participants; IQR, interquartile range; LACI, lacunar anterior circular infarct; PACI, partial anterior circular infarct; TACI, total anterior circular infarct; NIHSS, National Institutes of Health Stroke Scale; FM-UE, Fugl-Meyer motor assessment of the upper extremity; ARAT, Action Research Arm Test; EmNSA, Erasmus modification of the Nottingham Sensory Assessment of the upper extremity; MI-UE/LE, Motricity Index of the upper/lower extremity.
Demographics and clinical scores at baseline and 26 weeks poststroke of all patients included in the analysis. Time poststroke is the time elapsed between stroke onset and baseline measurement.
Changes in Spectral Characteristics Over Time
Figure 3A and B depicts the individual and averaged time courses of the NIHSS and FM-UE scores. Visual inspection of the NIHSS and FM-UE confirms our assumption that a plateau was reached at 12 weeks poststroke. Figure 3D depicts the averaged time courses of the investigated spectral characteristics. The corresponding coefficient estimates (β), 95% confidence intervals (CI), and probability estimates (P) are summarized in Table 2. Individual time courses of the spectral characteristics are presented in the Supplementary Materials (Figure 4).
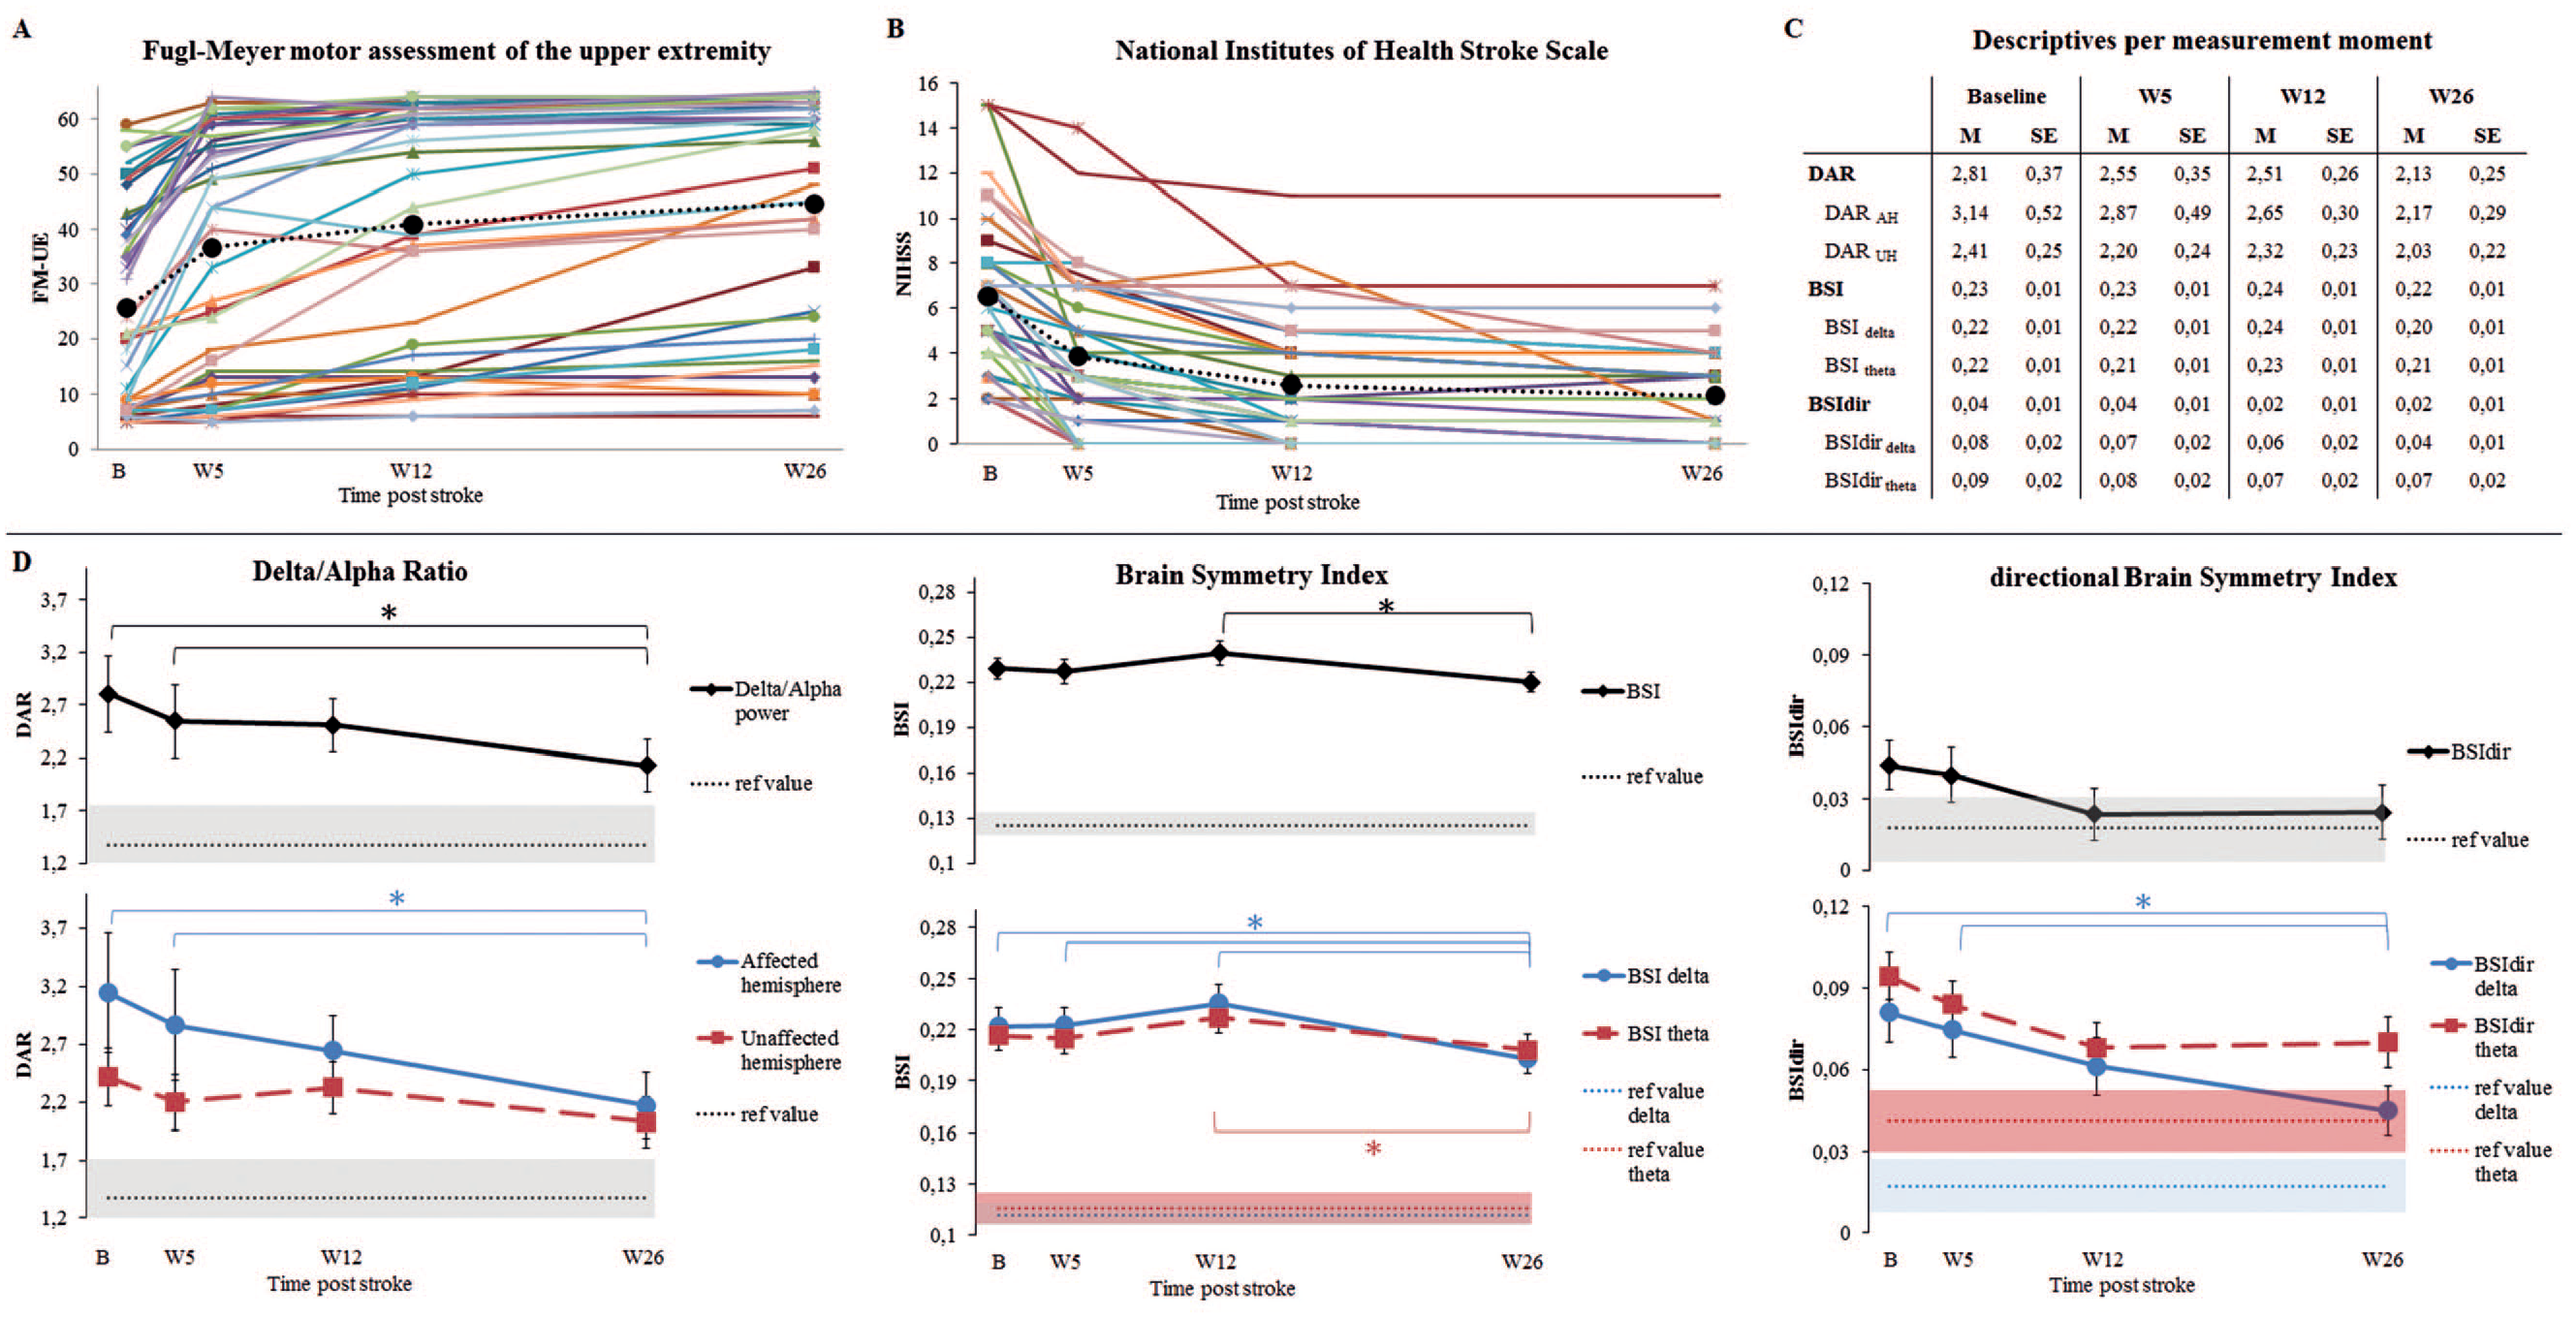
Panel A: Development of the Fugl-Meyer motor assessment of the upper extremity over time (maximum = 66), N = 41. Panel B: Development of the National Institutes of Health Stroke Scale over time (maximum = 42), N = 41. Panel C: Mean and standard error of the mean, per measurement moment, for the different spectral characteristics. Panel D: Development of the spectral characteristics over time; mean and standard errors of the mean are displayed. The blue and red dashed lines and surrounding colored area indicate the mean values of 11 healthy subjects and their standard error of the mean, as taken from Saes et al. 14 *Indicates a significant mean difference between moments, after Holm-Bonferroni corrections (P < 0.05/Ns). Delta band: 1-4 Hz, theta band:4-8 Hz.
Association Models of Spectral Characteristics and Time. a
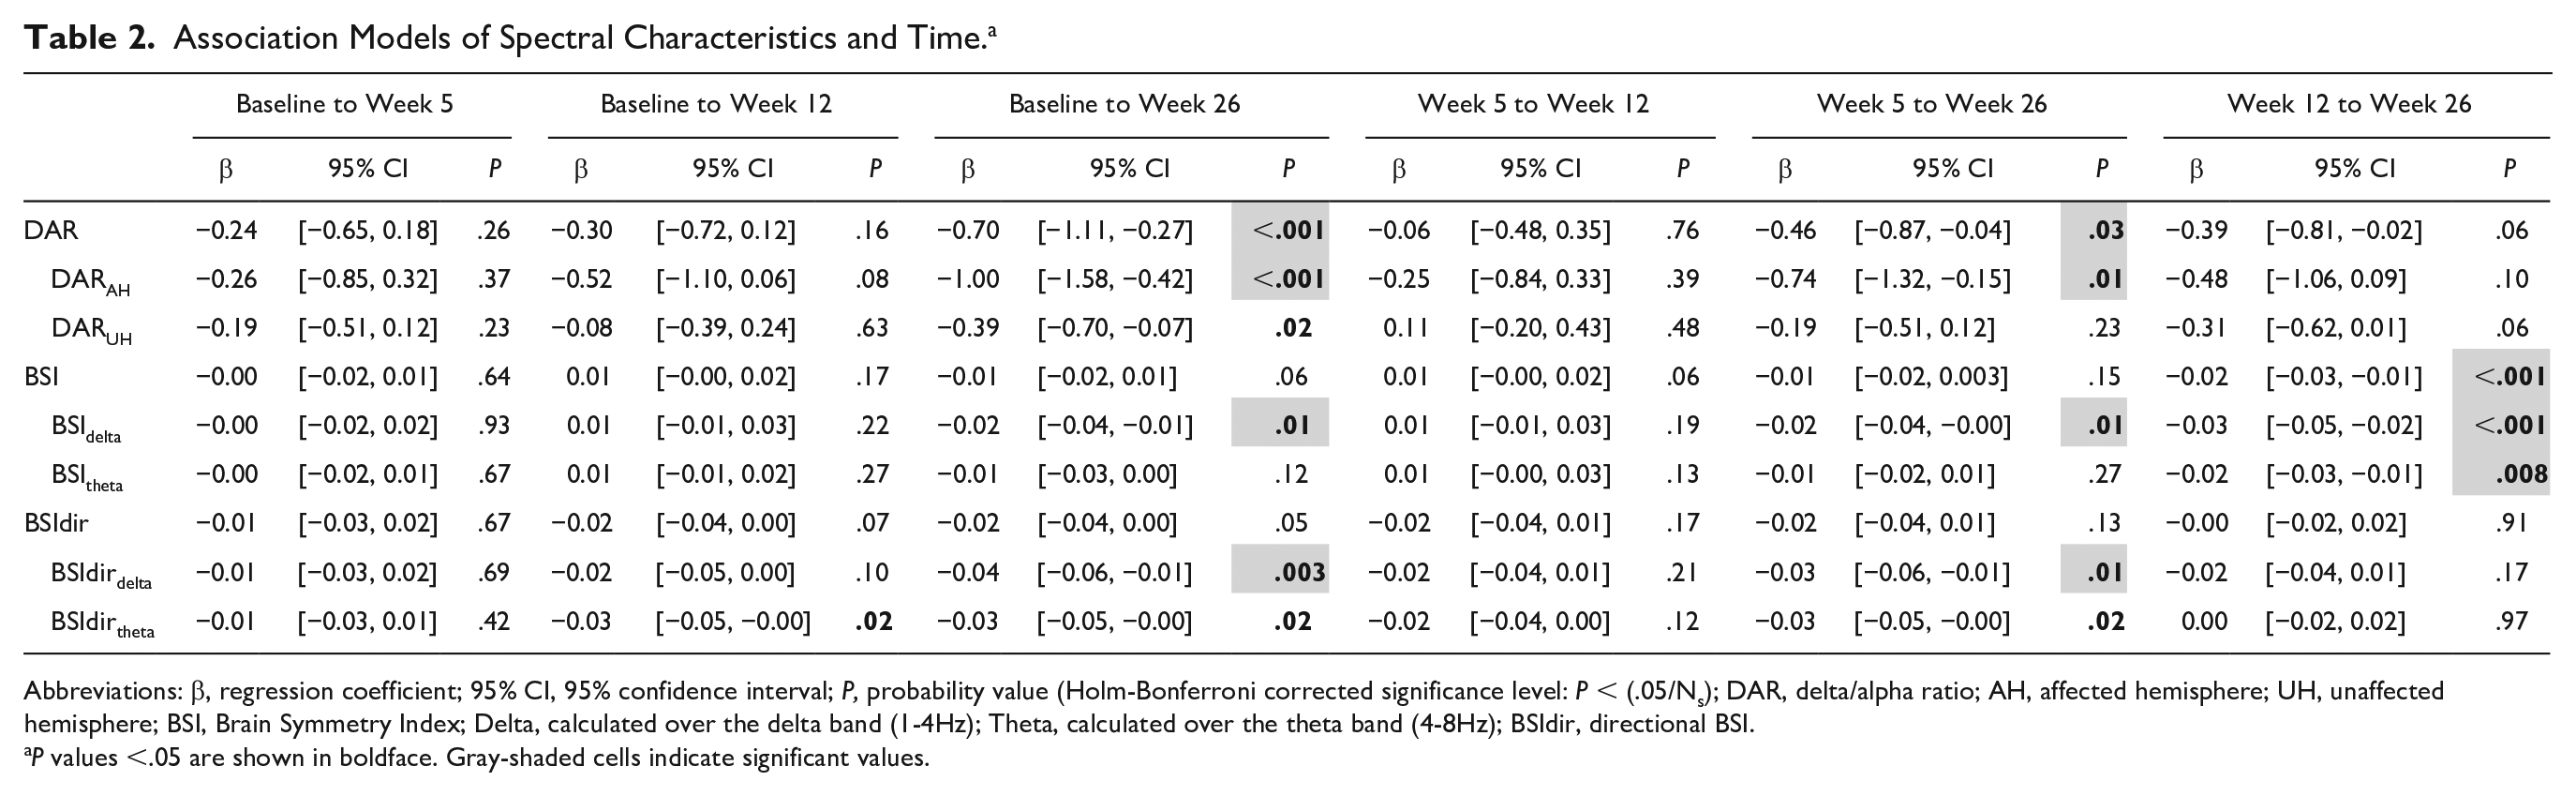
Abbreviations: β, regression coefficient; 95% CI, 95% confidence interval; P, probability value (Holm-Bonferroni corrected significance level: P < (.05/Ns); DAR, delta/alpha ratio; AH, affected hemisphere; UH, unaffected hemisphere; BSI, Brain Symmetry Index; Delta, calculated over the delta band (1-4Hz); Theta, calculated over the theta band (4-8Hz); BSIdir, directional BSI.
P values <.05 are shown in boldface. Gray-shaded cells indicate significant values.
DAR showed a significant decrease over time between baseline and week 26 (β = −0.69, P < .001), and from week 5 to week 26 (β = −0.46, P = .03). The largest decrease was found in the affected hemisphere, while only a trend was found for the unaffected hemisphere (Figure 3; Table 2). No decrease over time was observed between baseline and week 26 regarding BSI and BSItheta, although a decrease was observed between week 12 and week 26. BSIdelta showed to be decreased at week 26 when compared with baseline (β = −0.02, P = .01), week 5 (β = −0.02, P = .01) and week 12 (β = −0.03, P < .001). A statistically nonsignificant decrease over time was found for BSIdir and BSIdirtheta (Table 2), while a significant decrease was found for BSIdirdelta from baseline to week 26 (β = −0.04, P = .003), and from week 5 to week 26 (β = −0.03, P = .01). This indicates that the power over the hemispheres became less lateralized especially in the lower frequency band.
Association Between Spectral Characteristics and NIHSS
Table 3A-D presents the longitudinal associations between spectral characteristics and NIHSS scores. A lower DAR or DARAH was longitudinally associated with a lower NIHSS score (β = 0.12, P < .001; β = 0.19, P < .001; Table 3A). These relations concerned significant positive within- and between-subject effects (Table 3D). DAR and DARAH were significantly positively associated with NIHSS at baseline (β = 0.12, P = .04; β = 0.21, P = .01; Table 3B), while significance was not reached at other measurement moments. Regarding the DARUH no significant longitudinal association was found with NIHSS.
Association Models Between Spectral Characteristics, NIHSS/FM-UE and Time.a
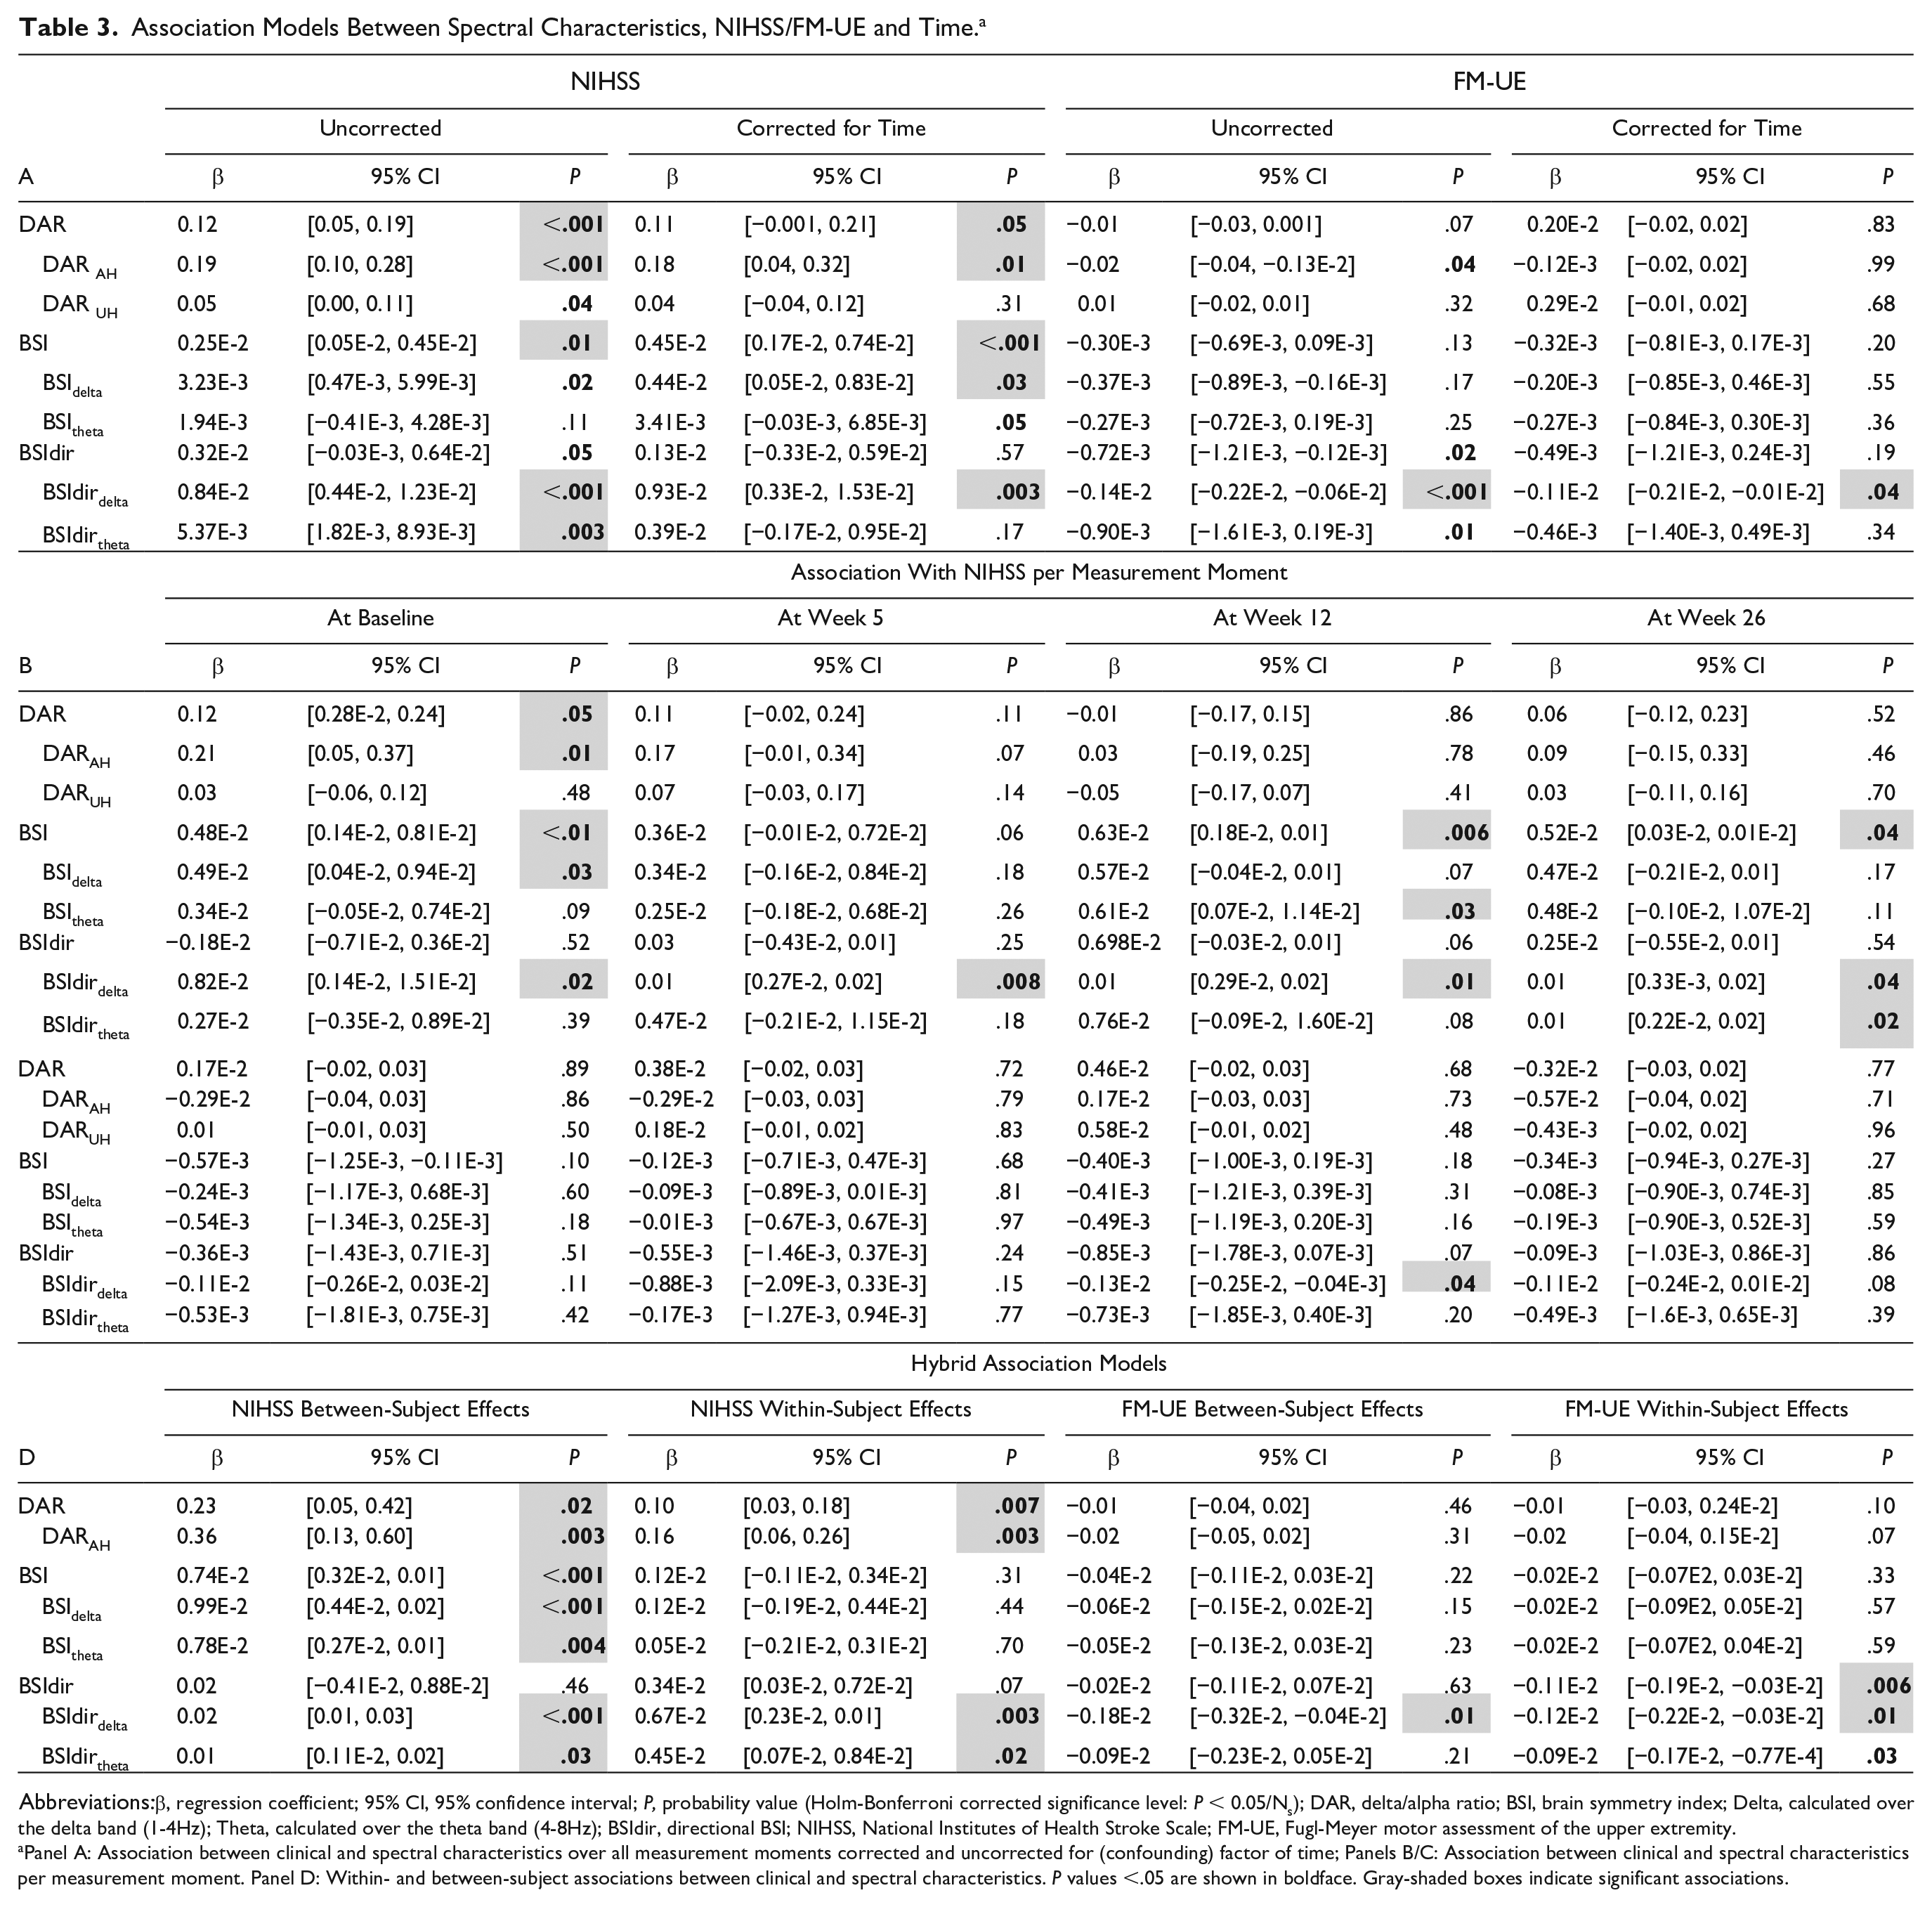
Abbreviations:β, regression coefficient; 95% CI, 95% confidence interval; P, probability value (Holm-Bonferroni corrected significance level: P < 0.05/Ns); DAR, delta/alpha ratio; BSI, brain symmetry index; Delta, calculated over the delta band (1-4Hz); Theta, calculated over the theta band (4-8Hz); BSIdir, directional BSI; NIHSS, National Institutes of Health Stroke Scale; FM-UE, Fugl-Meyer motor assessment of the upper extremity.
Panel A: Association between clinical and spectral characteristics over all measurement moments corrected and uncorrected for (confounding) factor of time; Panels B/C: Association between clinical and spectral characteristics per measurement moment. Panel D: Within- and between-subject associations between clinical and spectral characteristics. P values <.05 are shown in boldface. Gray-shaded boxes indicate significant associations.
BSI was positively associated with the NIHSS score (β = 2.51 × 10⁻³, P = .01; Table 3A). After correction for time, the association with NIHSS became stronger (β = 4.52 × 10⁻³, P < .001), which suggests an association between the dependent and independent covariates irrespective of the time-dependent changes of the covariates. The longitudinal relation mainly concerned a positive between-subject effect (Table 3D). The interaction term between NIHSS and time did not reach significance, suggesting that the association between BSI and the NIHSS did not change over time. The BSIdelta and BSItheta showed results similar to those for the BSI, yet remained borderline significant (Table 3A and D).
BSIdirdelta showed a significant positive relation with NIHSS (β = 0.84 × 10⁻², P < .001; Table 3A), where time was not a confounder. This relation consisted of significant positive within- and between-subject effects (Table 3D). The relation between BSIdirdelta and NIHSS was significant across measurement moments (Table 3B).
Association Between Spectral Characteristics and FM-UE
Table 3A-D shows the longitudinal associations between spectral characteristics and FM-UE. No significant longitudinal association was found between DAR or DARUH and FM-UE (Table 3A), neither when corrected for time nor at any specific moment in time (Table 3C). For DARAH, a trend toward a negative association with FM-UE was found, which was no longer present after correction for time. This agrees with the outcome of the hybrid model, which revealed that this association was primarily caused by a within-subject effect (Table 3D).
BSI, BSIdelta, as well as BSItheta did not show significant longitudinal associations with FM-UE (Table 3A), neither when corrected for time nor at any moment in time (Table 3C).
BSIdir showed a trend toward a negative association with FM-UE (β = −0.72 × 10⁻³, P = .02; Table 3A), but after correction for time this trend was no longer present. In line with this finding, the hybrid model showed only a significant negative within-subject effect (Table 3D). BSIdirdelta was negatively associated with FM-UE (β = −0.14 × 10⁻², P < .001; Table 3A), which was borderline significant after correction for time. This relation concerned significant negative within-and between-subject effects (Table 3D). Further analyses revealed that the interaction term (FM-UE × time) was significant, indicating that the relation varied over time.
Discussion
Current literature argues the importance of knowledge concerning the association between clinical improvements and changes in brain activity after stroke. 28 In the current study, resting-state EEG and clinical data were measured repeatedly at recommended fixed moments in the first 6 months poststroke. 28 The aim was to investigate longitudinal changes in the EEG-derived spectral characteristics DAR, BSI, and BSIdir, as well as their changes over time in relation to improvements of NIHSS and FM-UE scores within and beyond the window of spontaneous neurobiological recovery.
We hypothesized that DAR, BSI, and BSIdir would decrease (i.e. normalize) mainly within the time window of spontaneous neurobiological recovery after stroke as reflected by changing neurological impairments such as FM-UE and NIHSS. However, our findings revealed that this time window did not fully match with the time window of changes in spectral characteristics, which were found to normalize within and beyond the first three months. In line with our second hypothesis, the time course of DARAH and BSIdirdelta within subjects was significantly positively associated with the severity of global neurological impairments as reflected by the NIHSS score. Moreover, BSIdirdelta showed a clear negative within-subject association with recovery of motor impairments of the upper extremity as reflected by FM-UE scores. This means that a decreasing asymmetry in the delta band within a patient was related with recovery of motor function of the upper extremity.
Time Course of Spectral Characteristics Differs From Spontaneous Neurobiological Recovery
Most of the spectral characteristics we investigated showed normalization over time to a certain extent, in line with what has been reported in the literature.12,14,29 More specifically, DARAH and BSIdir approached values found in healthy subjects, 14 whereas lateralization as reflected by the BSI persisted. The seemingly inconsistent results for BSI and BSIdir might be the result of reciprocal asymmetries over the channel pairs, which accumulate in BSI while cancelling out in BSIdir. Nonetheless, our results show decreasing lateralization in the delta band for both asymmetry measures. Comparable with our results, a previous longitudinal MEG study reported delta activity to be increased in the affected hemisphere in the acute phase and to decrease over time during the early subacute phase poststroke. 29
The time course of the investigated spectral characteristics did not plateau at the same moment as spontaneous neurobiological recovery reflected by the NIHSS and FM-UE scores. This continuing normalization of EEG parameters suggests that not all changes measured with EEG reflect neurological improvements as shown by a global neurological deficits assessment as the NIHSS or motor function assessment as the FM-UE. Although speculative, the continuing normalization observed in EEG parameters may parallel more refined neurological improvements, which are not detectable with NIHSS and FM-UE due to their ceiling effect. Obviously, molecular and cellular processes related to poststroke recovery (ie, upregulated growth factors, angiogenesis and synaptogenesis)7,30,31 affect synaptic connections and network integrity, and lead to remapping, 5 which in turn may alter brain oscillations. 32 The underlying relationship between these dynamic processes remains to be investigated.
Spectral Characteristics as Monitoring Biomarkers of Recovery
The positive within-subject effects found for DAR and DARAH reveal decreasing values within patients as NIHSS scores improved. This is in line with the findings of the aforementioned longitudinal MEG study, which revealed that patients with persistent low-frequency activity also had lower NIHSS scores than patients without such persistent low-frequency activity. 29
The increased DAR values in both the affected and unaffected hemispheres, compared with healthy values, confirm the current literature reports suggesting that the unaffected hemisphere is also affected early after stroke.33,34 Therefore, our asymmetry measure may have underestimated the neurological deficits early poststroke. Since the unaffected hemisphere is less affected than the affected hemisphere, DARAH might be more appropriate to capture the relevant signals than DAR calculated over both hemispheres.
Our BSI results agree with those presented by Agius Anastasi and coworkers. 19 They reported a trend toward a decrease in BSI over time, and the absence of a significant correlation with FM-UE. We only showed a significant positive between-subject effect between NIHSS and BSI. This suggests that a lower NIHSS score in patient A compared with patient B, is related to a decreased BSI value in patient A compared with patient B.
The longitudinal associations between BSIdirdelta, stroke severity, and motor function as reported here emphasize the validity of this specification favoring the use of frequency bands and directionality. The within- and between-subject effects reveal that a lower degree of asymmetry in the delta band compared to another patient, or a decreasing degree of asymmetry in the delta band over time within a patient, were associated with decreased stroke severity and improved motor function of the upper extremity. This suggests that the development of BSIdirdelta and clinical scores over time within individuals are related. BSIdirdelta therefore shows potential as a monitoring biomarker of spontaneous neurobiological recovery.
In congruence with our data, which suggest increased activity toward the affected hemisphere in the delta frequency band (increased BSIdirdelta), Fanciullacci and coworkers 35 showed delta power to be increased in the affected compared with the unaffected hemisphere in stroke patients with subcortical lesions. Nonetheless, in the same sample, they showed a negative correlation between BSI and NIHSS, which is different from our findings. This discrepancy may result from methodological issues such as small sample sizes in combination with the lack of correction for multiple testing. Hence, the influence of lesion location on these results has yet to be investigated. Other techniques and imaging methods (eg, MRI or diffusion tensor imaging) are necessary to better understand the impact of anatomical integrity on the time course of spectral characteristics early poststroke.
Limitations and Future Directions
Several limitations of the study should be taken into consideration. Additional analyses were performed in which the time courses of the spectral characteristics were compared between 3 patient groups classified based on their FM-UE recovery pattern (see Supplementary Materials). Unfortunately, due to small subgroups, this analysis was underpowered. Furthermore, since in the current study MRI data were unavailable for a large proportion of the patients, we were not able to correct for lesion size or location, while we acknowledge that this might influence the observed resting-state oscillations and motor recovery poststroke.35,36 In previous work, DAR was found to be only increased in patients with a cortico-subcortical lesion, while BSI was only increased in patients with a subcortical lesion when compared with healthy individuals. 35 Future studies are needed to further investigate the influence of lesion location on the time course of DAR and BSI. Additionally, we restricted the present study to spectral characteristics representing low-frequency activity. Whether alpha, beta, and gamma frequencies may also be sensitive neurophysiological biomarkers of recovery early poststroke needs to be investigated. Finally, due to the limited capacity of patients in the acute phase poststroke, the baseline measurement took place at an average of 12 days poststroke, which means that a substantial amount of recovery might already have occurred. 37 Hence, we may have missed some of the early changes in spectral characteristics over time.
In future research, we suggest investigation of the contribution of low-frequency oscillations during upper limb movements. Previous work in rodents suggests that low-frequency oscillations are a possible target for neuromodulation to improve motor function recovery poststroke. 38
Conclusion
In the current study, it was concluded that normalization of resting-state EEG asymmetry measures was not restricted to the time window of recovery of clinical neurological impairments measured with NIHSS and FM-UE. This might reflect an ongoing neural recovery beyond 3 months, which is not detectable by these impairment-focused outcome measures. In addition, global neurological recovery and recovery of motor function of the upper extremity are associated with normalization of spectral characteristics in the low frequency bands in patients who suffered from ischemic stroke. Future research should investigate the influence of lesion location on this relationship as well as and the potential role of spectral characteristics as a prognostic biomarker of recovery.
Supplemental Material
Supplementary_Material – Supplemental material for Is Resting-State EEG Longitudinally Associated With Recovery of Clinical Neurological Impairments Early Poststroke? A Prospective Cohort Study
Supplemental material, Supplementary_Material for Is Resting-State EEG Longitudinally Associated With Recovery of Clinical Neurological Impairments Early Poststroke? A Prospective Cohort Study by Mique Saes, Sarah B. Zandvliet, Aukje S. Andringa, Andreas Daffertshofer, Jos W. R. Twisk, Carel G. M. Meskers, Erwin E. H. van Wegen and Gert Kwakkel in Neurorehabilitation and Neural Repair
Footnotes
Acknowledgements
In addition to the authors of the present study, the consortium consists of Caroline Winters, Dirk Hoevenaars, Luuk Haring and Elza van Duijnhoven from Amsterdam UMC, location VUmc; Jun Yao and Julius Dewald from Northwestern University, Chicago; and Martijn Vlaar, Teodoro Solis-Escalante, Alfred Schouten, Yuan Yang, Mark van de Ruit, Konstantina Kalogianni, Joost van Kordelaar, Lena Filatova and Frans van der Helm from Delft University of Technology.
Declaration of Conflicting Interests
The author(s) declared no potential conflicts of interest with respect to the research, authorship, and/or publication of this article.
Funding
The author(s) disclosed receipt of the following financial support for the research, authorship, and/or publication of this article: This research was funded by the European Research Council under the European Union’s Seventh Framework Programme (FP/2007–2013 ERC Grant Agreement n. 291339, project “4DEEG: A New Tool to Investigate the Spatial and Temporal Activity Patterns in the Brain”), as well as by the Dutch Brain Foundation (F2011(1)-25) and the Netherlands Organization of Scientific Research (research programme NeuroCIMT, project number 14905). Sponsors had no other involvement than financial support.
References
Supplementary Material
Please find the following supplemental material available below.
For Open Access articles published under a Creative Commons License, all supplemental material carries the same license as the article it is associated with.
For non-Open Access articles published, all supplemental material carries a non-exclusive license, and permission requests for re-use of supplemental material or any part of supplemental material shall be sent directly to the copyright owner as specified in the copyright notice associated with the article.