
Abstract
Background. Variability in hand function among children with unilateral cerebral palsy (UCP) might reflect the type of brain injury and resulting anatomical sequelae. Objective. We used atlas-based analysis of structural images to determine whether children with periventricular (PV) versus middle cerebral artery (MCA) injuries might exhibit unique anatomical characteristics that account for differences in hand function. Methods. Forty children with UCP underwent structural brain imaging using 3-T magnetic resonance imaging. Brain lesions were classified as PV or MCA. A group of 40 typically developing (TD) children served as comparison controls. Whole brains were parcellated into 198 structures (regions of interest) to obtain volume estimates. Dexterity and bimanual hand function were assessed. Unbiased, differential expression analysis was performed to determine volumetric differences between PV and MCA groups. Principal component analysis (PCA) was performed and the top 3 components were extracted to perform regression on hand function. Results. Children with PV had significantly better hand function than children with MCA. Multidimensional scaling analysis of volumetric data revealed separate clustering of children with MCA, PV, and TD children. PCA extracted anatomical components that comprised the 2 types of brain injury. In the MCA group, reductions of volume were concentrated in sensorimotor structures of the injured hemisphere. Models using PCA predicted hand function with greater accuracy than models based on qualitative brain injury type. Conclusions. Our results highlight unique quantitative differences in children with UCP that also predict differences in hand function. The systematic discrimination between groups found in our study reveals future questions about the potential prognostic utility of this approach.
Keywords
Introduction
The development of motor and sensory pathways occurs during a period in which the brain is particularly vulnerable to injury. Cerebral palsy (CP) is a group of developmental disorders that affect movement and posture in children who experience a brain injury during this early period of vulnerability.1,2 In unilateral cerebral palsy (UCP), injury is predominantly lateralized to one hemisphere and affects function on the contralateral side of the body. 3 Despite having a unitary diagnosis, the timing and location of brain injury and resulting sequelae is unique to each child. Children with UCP also display a large degree of interindividual variability with regard to motor function. 4 Individual differences might be driven in part by the extent and timing of underlying brain damage.5,6
The 2 most common lesion types in children with UCP are periventricular white matter lesions (PV) and middle cerebral artery infarcts (MCA).7,8 Events that cause disruptions to the developing brain create patterns of abnormality that depend on the stage of development. 8 PV injuries tend to occur during prenatal weeks 24 to 34, which is characterized by white matter tract development and increased blood flow to the germinal matrix, adjacent to the lateral ventricles. MCA injuries tend to occur during prenatal weeks 34 to 38, which involves increased myelination of the motor tracts 9 and increased blood flow toward cortical/subcortical areas. 10 The timing of MCA injuries results in lesions being primarily restricted to central and parasagittal gray matter. 8 The lesions tend to be diffuse and more likely than PV injuries to affect organization of somatosensory circuits.2,11 Consequently, children with MCA lesions demonstrate greater impairments in dexterity and sensory function relative to children with PV lesions.5,6,12,13
The clinical differences between children with MCA and PV raise questions about the complex interactions between structure and function. In adult stroke there is clear evidence demonstrating the association between lesion size or location and prognosis for long-term recovery.14-18 However, when a brain lesion occurs in the context of development, the resulting structural changes are multifaceted and variable, with abnormalities extending beyond the injured tissue.19,20 These intricate structural changes have limited the predictive power of brain imaging for future sensorimotor function in children with CP. 13 Understanding how brain injury might affect function remains an important issue however, as precise classification of anatomical features might create clinically informative definitions of the nature of cerebral injury in UCP.
We used an automated atlas-based pipeline in which the whole brain is parcellated into segments. 21 Unlike manual region of interest (ROI)-based approaches, automated parcellation provides an unbiased quantification of the effect of lesion type on the entire brain and has been demonstrated to successfully cluster clinical phenotypes.22,23 Our goal was to use atlas-based analysis of structural images to determine (1) if there were unique anatomical patterns that differed between children with PV and MCA, and typically developing (TD) children, and (2) if the patterns account for differences in hand function between the 2 groups of children with UCP with greater accuracy than lesion subtype alone. We hypothesized that the extracted patterns of structural differences between the 2 groups based on whole-brain analysis would be more predictive of hand function than the broader classification of injury type.
Methods
Participants
Forty children with UCP participating in a parent trial and who were able to provide imaging data participated. Table 1 provides demographic and clinical data. Participants were recruited from local clinics, our website (http://www.tc.edu/centers/cit/), online support communities, and as part of a larger clinical trial (ClinicalTrials.gov; CT00305006). The data presented in this study were collected prior to the onset of the intervention of the parent trial. The inclusion criteria for the parent trial were established based on our prior study 24 and included the following: (1) diagnosis of congenital unilateral spastic CP, (2) ability to lift the more-affected upper-extremity 15 cm above a table surface, (3) ability to grasp light objects, (4) mainstreamed in school, (5) and ability to follow instructions and complete assessments as demonstrated during screening and physical examination. Exclusion criteria of the parent trial included the following: (1) health problems unassociated with UCP, (2) current/untreated seizures, (3) visual impairments that would interfere with ability to perform assessments, (4) severe spasticity at any of the upper extremity (UE) joints (Modified Ashworth >3.5), or (5) orthopedic surgery on the more-affected UE within 6 months of enrollment in the study. Children who met the following additional criteria were recruited to participate in this study: (1) ages between 6 and 17 years and (2) ability to comply with magnetic resonance imaging (MRI) procedures without sedation. Additional exclusion criteria were (1) nonremovable metallic objects in the body, (2) claustrophobia precluding MRI testing, and (3) lesion diagnosis other than PV or MCA (ie, malformation). Informed assent/consent was obtained from all participants and their parents. The study was approved by the institutional review boards of Teachers College, Columbia University, Burke Medical Research Institute, and Weill Cornell Medical College.
Participant Characteristics.
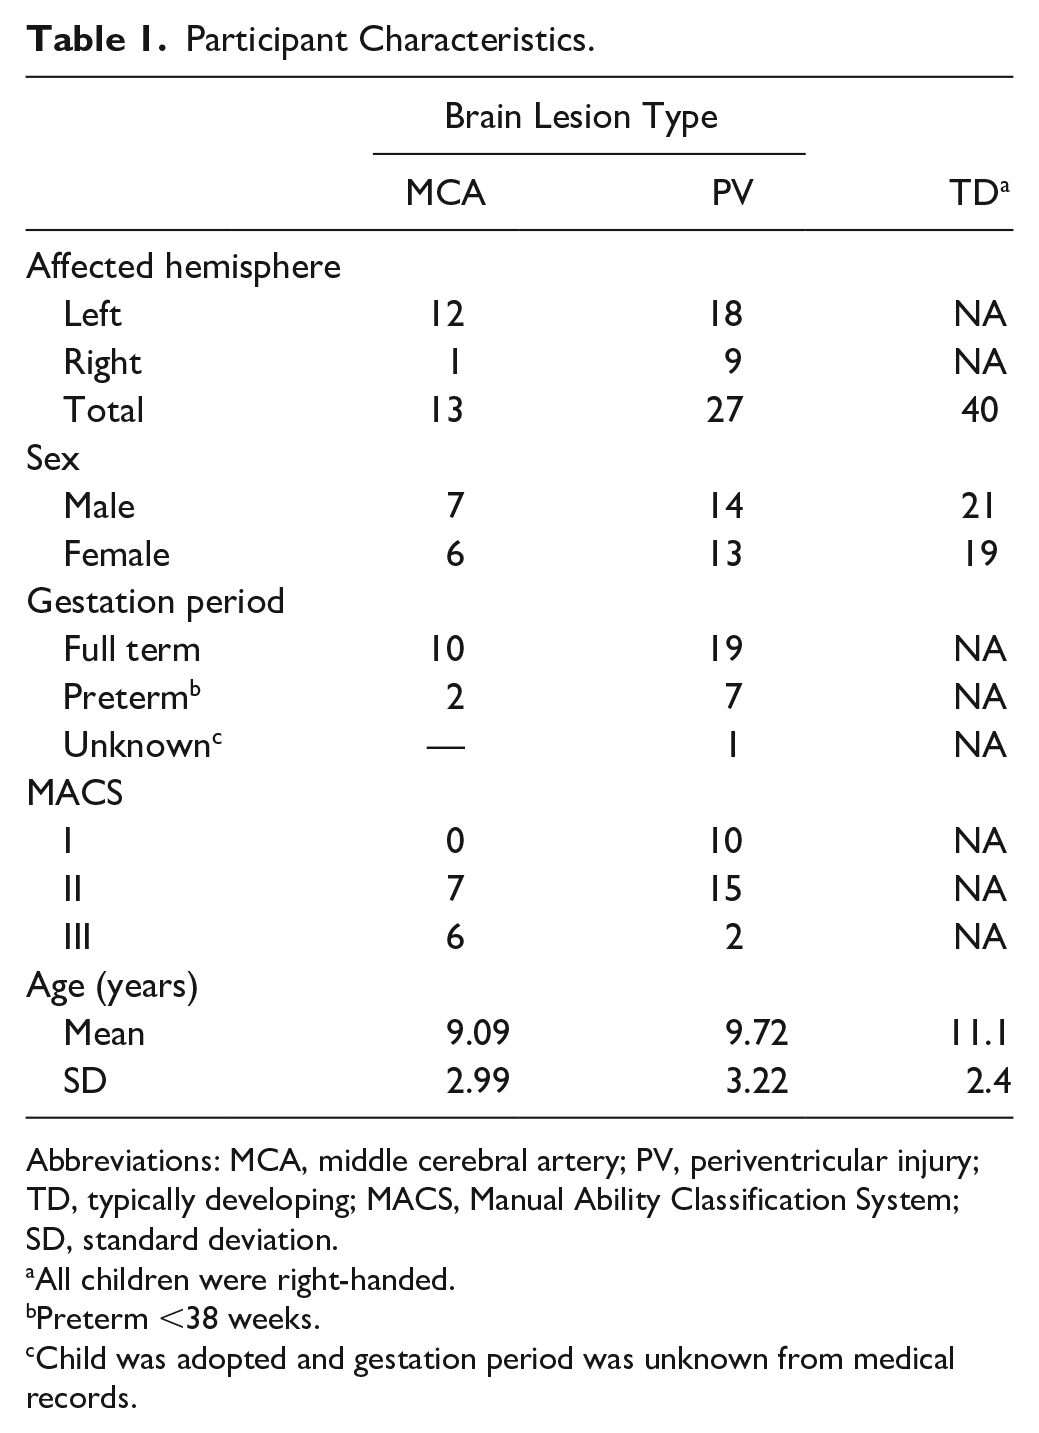
Abbreviations: MCA, middle cerebral artery; PV, periventricular injury; TD, typically developing; MACS, Manual Ability Classification System; SD, standard deviation.
All children were right-handed.
Preterm <38 weeks.
Child was adopted and gestation period was unknown from medical records.
Data from TD children used in the preparation of this article were obtained from the Pediatric Imaging, Neurocognition and Genetics Study (PING) database (http://pingstudy.ucsd.edu). The PING data set includes a sample of multimodal imaging, developmental, and behavioral assessments for a large cohort of children aged 3 to 20 years. For the current study, only T1-weighted images, age, sex, and handedness were analyzed. A group of 40 children were uniformly randomly sampled from a pool of over 400 right-handed participants using a custom-written MATLAB script. Briefly, the script matched children based on sex and the distribution of ages in our sample of children with UCP. Access to the PING data was granted by permission from the National Institute of Mental Health Data Archive (NDA).
MRI Data Acquisition
High-resolution structural MRI scans (T1-weighted images) were acquired for our sample of children with UCP on a single 3-T Siemens MAGNETOM Trio Tim (Siemens AG, Erlangen, Germany) system at Weill Cornell Medical College. Participants were positioned headfirst and supine. Scans were acquired according to a standardized protocol including the following parameters: an echo-planar imaging sequence in sagittal plane with field of view (FOV) = 256 mm by 256 mm, repetition time (TR) = 2170 ms, echo time (TE) = 4.33 ms, and inversion time (TI) = 1100 ms, number of sections = 176, flip angle = 7°, and voxel dimensions of 1.00 mm × 1.00 mm × 1.00 mm. Lesions were classified as PV or MCA by a pediatric neurologist in consultation with a neuroradiologist as needed. Imaging parameters for PING data are provided in Supplementary Table 1. The details of the PING study have been described previously. 25
Image Processing
To obtain volume estimates, multi-atlas brain parcellation was performed on T1-weighted images using the MRICloud pipeline (https://mricloud.org; Johns Hopkins University). MRICloud is a cloud-based platform for fully automated brain MRI parcellation and quantification.21,26,27 The pipeline employs a multi-atlas fusion procedure for parcellation. Details of the multi-atlas fusion algorithm are described in a previous publication. 28 Briefly, the pipeline consists of aligning the images to MNI space and correcting for intensity inhomogeneity. Given the age range in our study, pediatric atlases were selected on MRICloud as the templates. MRICloud permits users to specify atlases across different age groups and we ensured to process data based on the age range matching each participant. Using a nonlinear transformation, the set of pediatric atlases are warped to each participant’s brain by large deformation diffeomorphic metric mapping [LDDMM]. 29 LDDMM provides high accuracy on mapping, even for brains with large degrees of global or regional atrophy.29,30 The whole brain in T1-weighted images is parceled into 198 structures, which can be grouped at 5 hierarchical levels of granularity. 26 The transformed brain parcellation map is then superimposed onto the original MRI images. Volume estimates in native space of the participants’ images were obtained for each ROI. ROIs were manually inspected for gross misclassification using ROIEditor (Laboratory of Brain Anatomical MRI and Center for Imaging Science at Johns Hopkins University). Manual editing was performed based on suggestions provided by the developers of MRICloud (https://MRICloud.org). Separate estimates were obtained for structures in the affected and unaffected hemisphere. Examples of whole brain parcellation and select ROIs are illustrated in Figure 1.
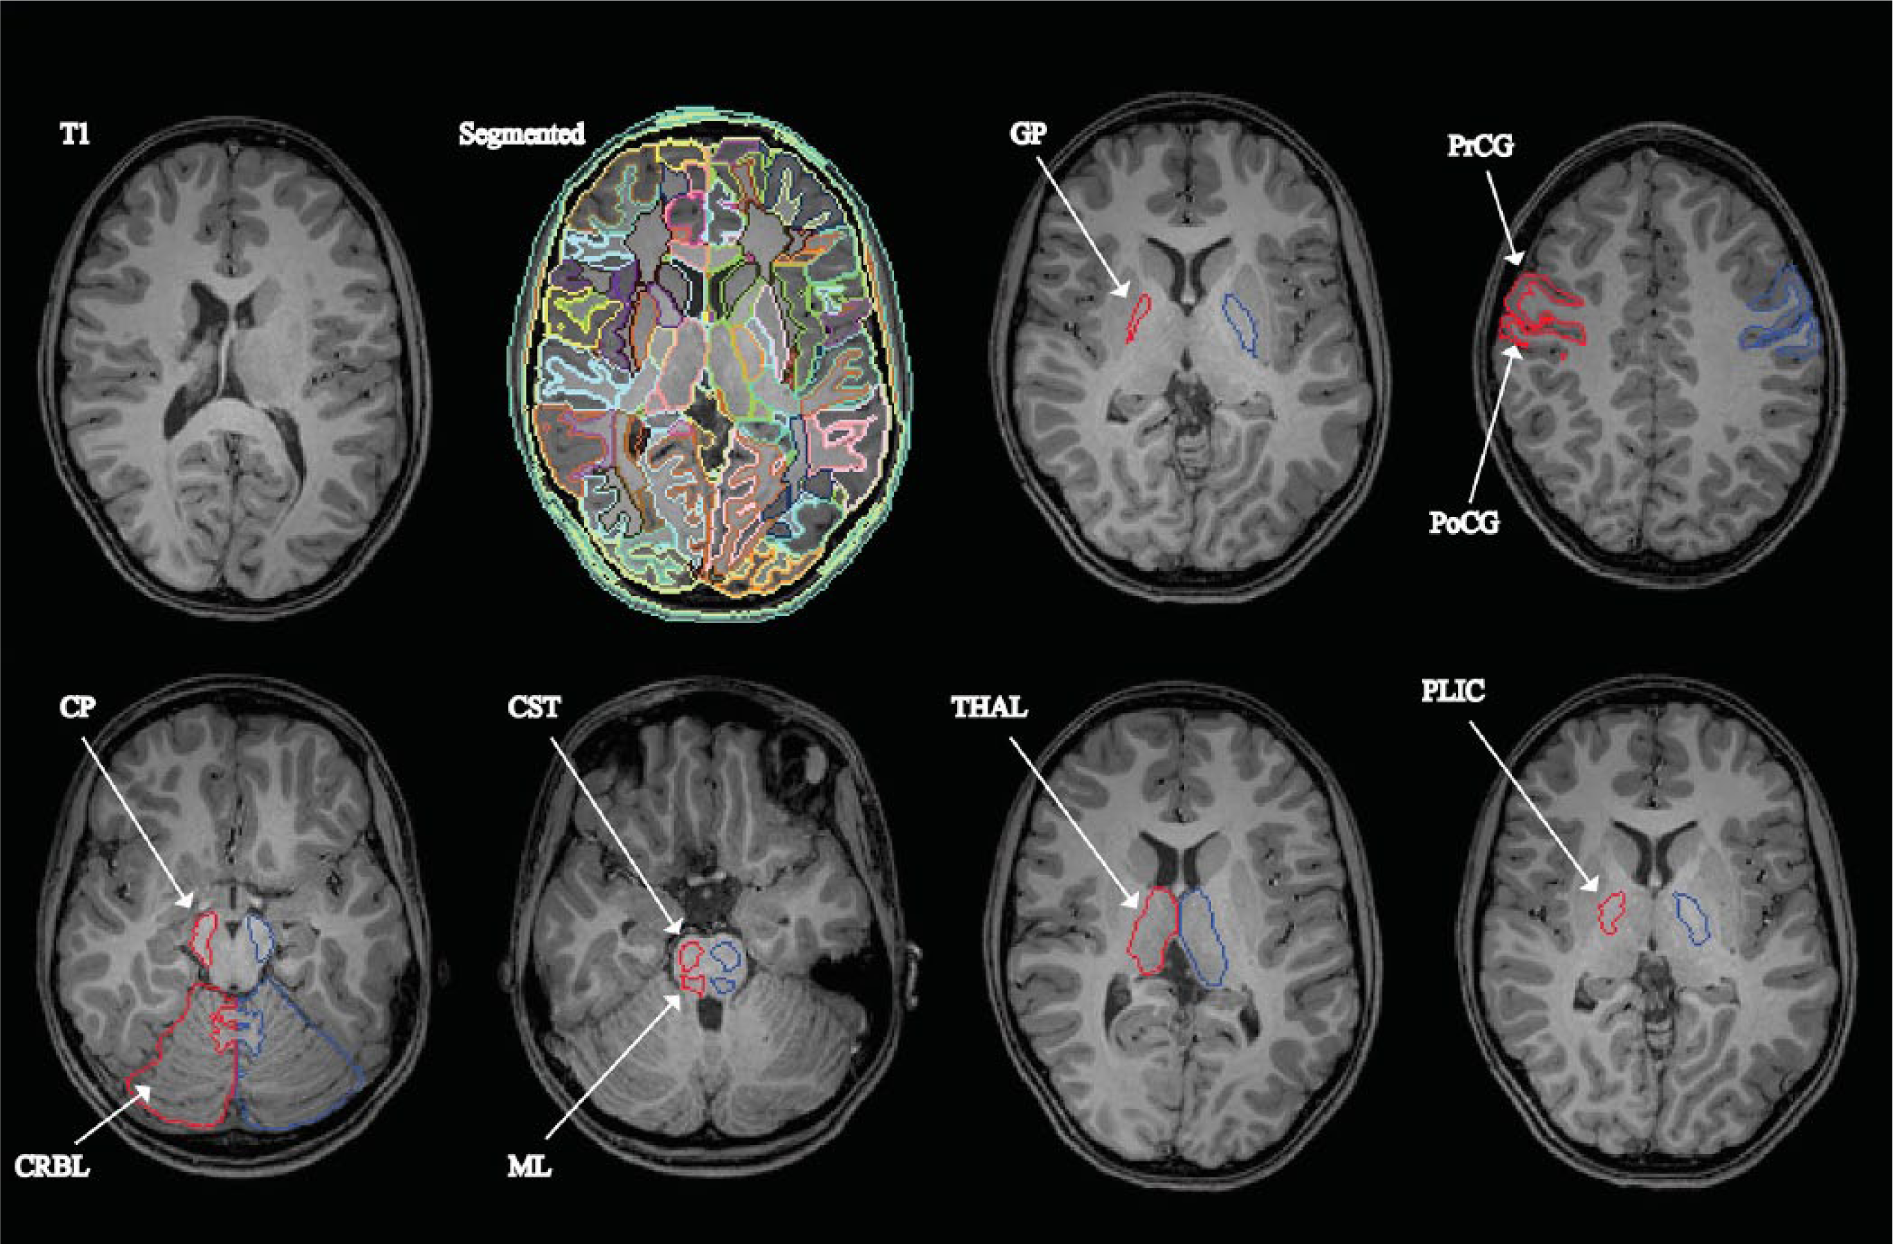
Automated image parcellation from MRICloud pipeline using multi-atlas likelihood fusion algorithm. Top (from left to right): T1, axial slice of T1-weighted MRI; Segmented, example of structures following parcellation of whole brain with fully automated brain segmentation tool; GP, globus pallidus (for all images, region of interest in red are from injured hemisphere; region of interest in blue is from uninjured hemisphere); PrCG, precentral gyrus; PoCG, postcentral gyrus; Bottom: CP, cerebral peduncle; CRBL, cerebellum; CST, corticospinal tract (pons); ML, medial lemniscus; THAL, thalamus; PLIC, posterior limb of internal capsule.
Hand Function Assessments
Unimanual dexterity was assessed with the Jebsen-Taylor Test of Hand Function (JTTHF) 31 and the Box and Blocks Test (BBT). 32 The JTTHF is timed test comprised of 6 subtests—flipping cards, picking up small objects, simulated eating, stacking checkers, and moving empty and full cans. The BBT measures the number of blocks moved between 2 boxes (over a barrier) in 60 seconds. Bimanual hand function was assessed with the Assisting Hand Assessment (AHA). 33 The AHA involves a semistructured play session with objects that afford bimanual hand-use. Sessions are video recorded and later scored by a certified assessor blinded to the study.
Statistical Analysis
All statistical analyses were performed using R. For all bivariate analyses, group differences were tested using a nonparametric permutation (5000 permutations) test based on the Welch t statistic. The test is robust with respect to unequal variances and samples sizes.
EdgeR, an R package for analyzing differential signals in count data, 34 was used to test for differences between brain injury groups in ROI volumes. Our approach was based on a class of analyses typically used for high-throughput sequencing of DNA fragments (ie, RNA-Seq.), now applied to ROIs. In the genetic analyses on which our approach was based, read counts are established for sequenced genes and compared between biological groups to identify differentially upregulated or downregulated genes. Given the large number of genes being compared, statistical techniques are employed that control for false discovery rate (ie, Benjamini-Hochberg procedure). In our data set, the volumes of individual segmented ROIs were treated as “counts” and comparison between PV and MCA groups were examined for “differentially expressed” ROIs; that is, we were able to determine relative increases or decreases in volume of ROIs. The analysis provides an unbiased approach to examining volumetric differences in brain regions between the 2 groups.
A multidimensional scaling (MDS) plot was generated using the volumes from all ROIs from each individual to look for segregation of groups of children (ie, TD vs PV vs MCA). MDS is a dimension reduction technique and a visual representation of dissimilarities between sets of individuals. 35 Individuals that are more similar (shorter distance) are closer together on the graph than individuals that are less similar (larger distance).
Next, principal component analysis (PCA) was performed on the volumes of differentially expressed ROIs. Using the differential ROIs was a data-driven approach to explore differences between brain-injury groups. PCA reduces dimensionality of the data by reducing the number of random variables into a set of principal variables. The 3 most dominant components from the PCA were extracted and were based on the inflection point of an exploratory scree plot. Finally, principal components regression (PCR) was used to determine the relationship between ROI volumes and hand function. PCA reduces the dimensionality of a data set with a large number of variables that display a high degree of multicollinearity and retains the original variability of the predictors. For each model, the extracted principal components were used as predictors of each hand function test.
To determine whether classification based on anatomical patterns (ie, identified using parcellation) were more predictive of hand function compared with injury type, we used a statistical model comparison approach. Specifically, we compared the fit of the PCR regression model described above with the fit of models using injury type to predict hand function. Akaike information criterion and Bayesian information criterion, and measures of model goodness-of-fit were also used to compare the models.
In addition to the model comparisons described above, we used logistic regression to use the principal components to predict brain injury group (MCA vs PV). We then used the fitted values to compute an area under the ROC (receiver operating characteristic) curve for discriminating between groups.
Data Availability
Data used for analysis are available from the corresponding author on reasonable request. R script used for analysis available as supplementary file.
Results
Demographic and clinical data are summarized in Table 1. There were a greater number of children with PV included in the study relative to children with MCA. There were no differences between any of the groups in age. The relationship between lesion type and hand function is shown in Figure 2. Univariate tests indicated children with PV lesions had significantly better hand function scores than children with MCA lesions in all of the tests: BBT (P < .01), JTTHF (P < .001), and AHA (P < .05). Hand function tests were not available for TD controls sampled from the PING data archive. Note that a TD child would have a maximum score on the AHA and age-related normative values for the JTTHF have been published 36 and all children in this study exceeded these norms.
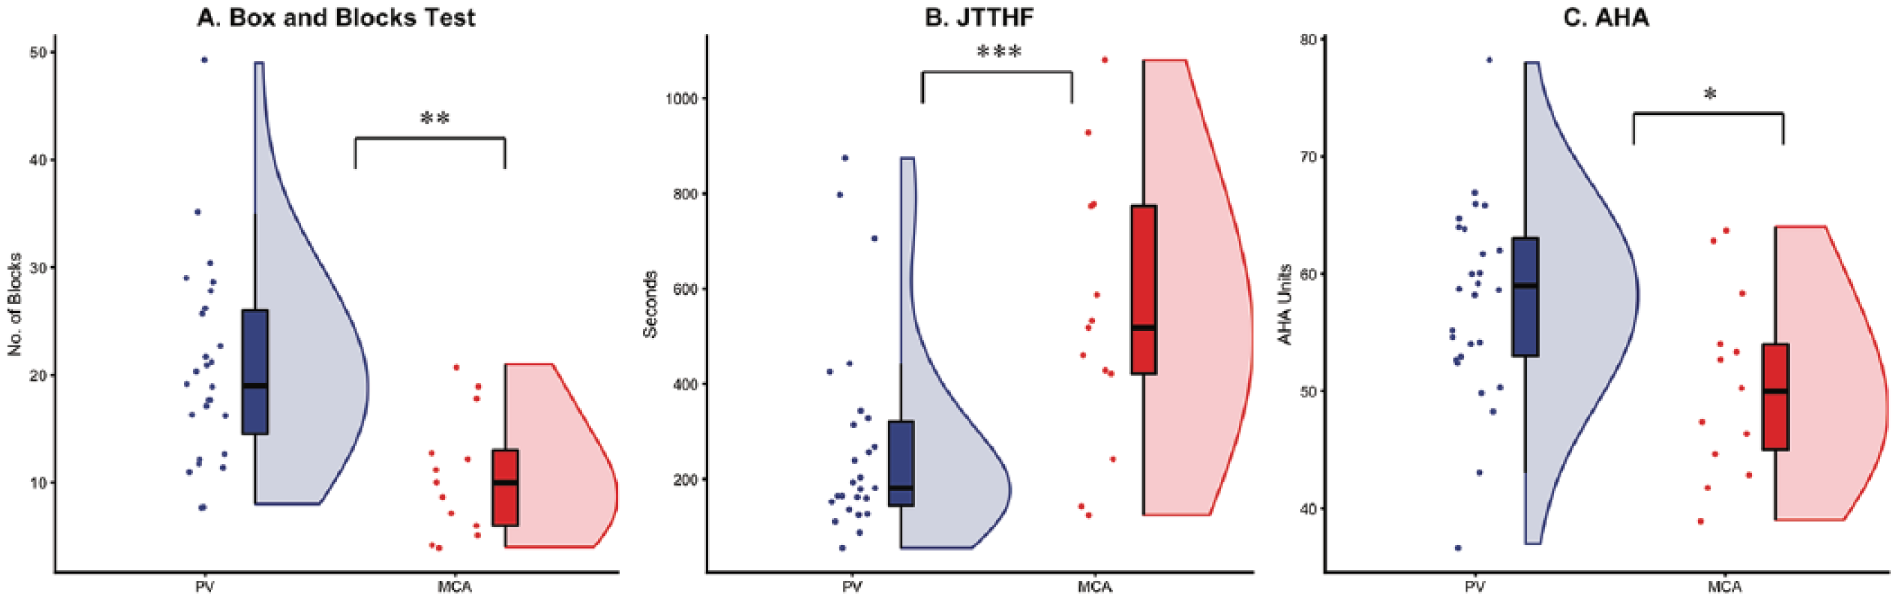
Children with MCA (middle cerebral artery) demonstrate greater deficits in hand function relative to children with PV (periventricular). Data are presented using elephant plots that include the following: (1) dots that represent individual data points, (2) boxplots (median, interquartile range, minimum, maximum), (3) density plot. (A) Children with PV showed greater performance on Box and Blocks Test compared to MCA, (B) JTTHF (Jebsen Taylor Test of Hand Function); Children with PV showed greater performance on JTTHF compared to MCA (lower scores indicate better dexterity), (C) AHA (Assisting Hand Assessment); Children with PV showed better bimanual function relative to MCA. *P < .05; **P < .01; ***P < .001. Plots generated in R using “Raincloud” package. 52
Clustering of TD Children and Children With UCP
Figure 3 provides an overview of the clustering of children by groups. The MDS plot suggests that the TD group had the smallest within group biological coefficient of variance (BCV) distance. Between the 2 brain injury groups, the PV group clustered the closest to the TD group, but showed greater within-group variability than the TD group. The MCA group, the group with the largest within BCV distance, clustered the furthest from the TD group. The MDS plot also shows a subgroup of children with MCA that cluster closer to the PV group than the rest of their respective MCA group.
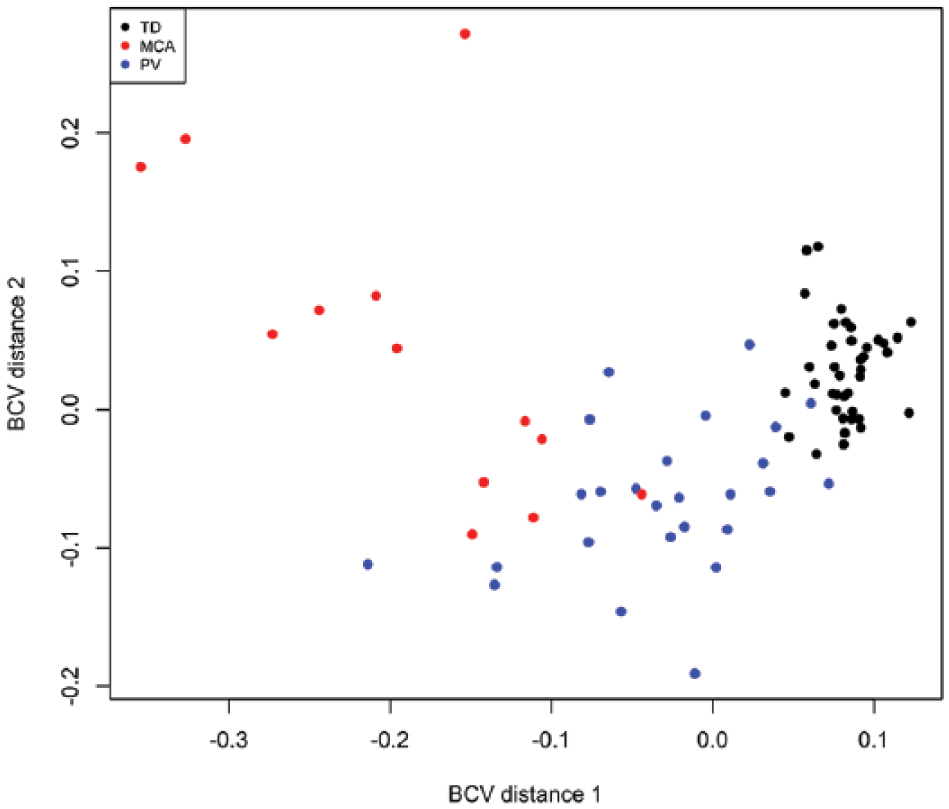
Multidimensional scaling plot (MDS) showing segregation of groups based on whole-brain volumetric analysis. All regions of interest (ROIs) for all individuals were used to generate plot. TD, typically developing group; MCA, middle cerebral artery injury group; PV, periventricular white matter injury group; BCV, biological coefficient of variance.
Volumetric Differences in ROIs
Figure 1 provides representative axial slices from one child with brain injury following T1 parcellation. A total of 198 ROIs, which includes all structures from the parcellation (both affected and less-affected sides), were included in the analysis. The volume of each ROI was transformed and calculated for differential size expression between the 2 groups. We found that a total of 89 ROIs significantly differed between the 2 injury groups (Supplementary Figure 1A), including 44 that were larger and 45 that were smaller in the MCA relative to PV group. A total of 133 ROIs significantly differed between the MCA and TD groups (Supplementary Figure 1B), including 69 that were larger and 64 that were smaller in the MCA relative to TD group. A total of 107 ROIs significantly differed between the PV and TD groups (Supplementary Figure 1C), including 55 that were larger and 52 that were smaller in the PV relative to TD group.
Figure 4A provides an overview of 50 top-ranked ROIs that differed between the 2 brain injury groups. For volumes that were increased in the MCA relative to PV group, 20 out of 23 (~87%) were located in the uninjured hemisphere. The volume decreases in the MCA relative to PV group were comprised mainly of cortical and white matter structures in the injured hemisphere. Figure 4B provides an overview of 50 top-ranked ROIs that differed between the MCA and TD groups. For volumes that were increased in the MCA relative to TD group, 19 out of 24 (~79%) were located in the uninjured hemisphere. Figure 4C provides an overview of 50 top-ranked ROIs that differed between the PV and TD groups. For volumes that were increased in the PV relative to TD group, 15 out of 25 (~60%) were located in the uninjured hemisphere.
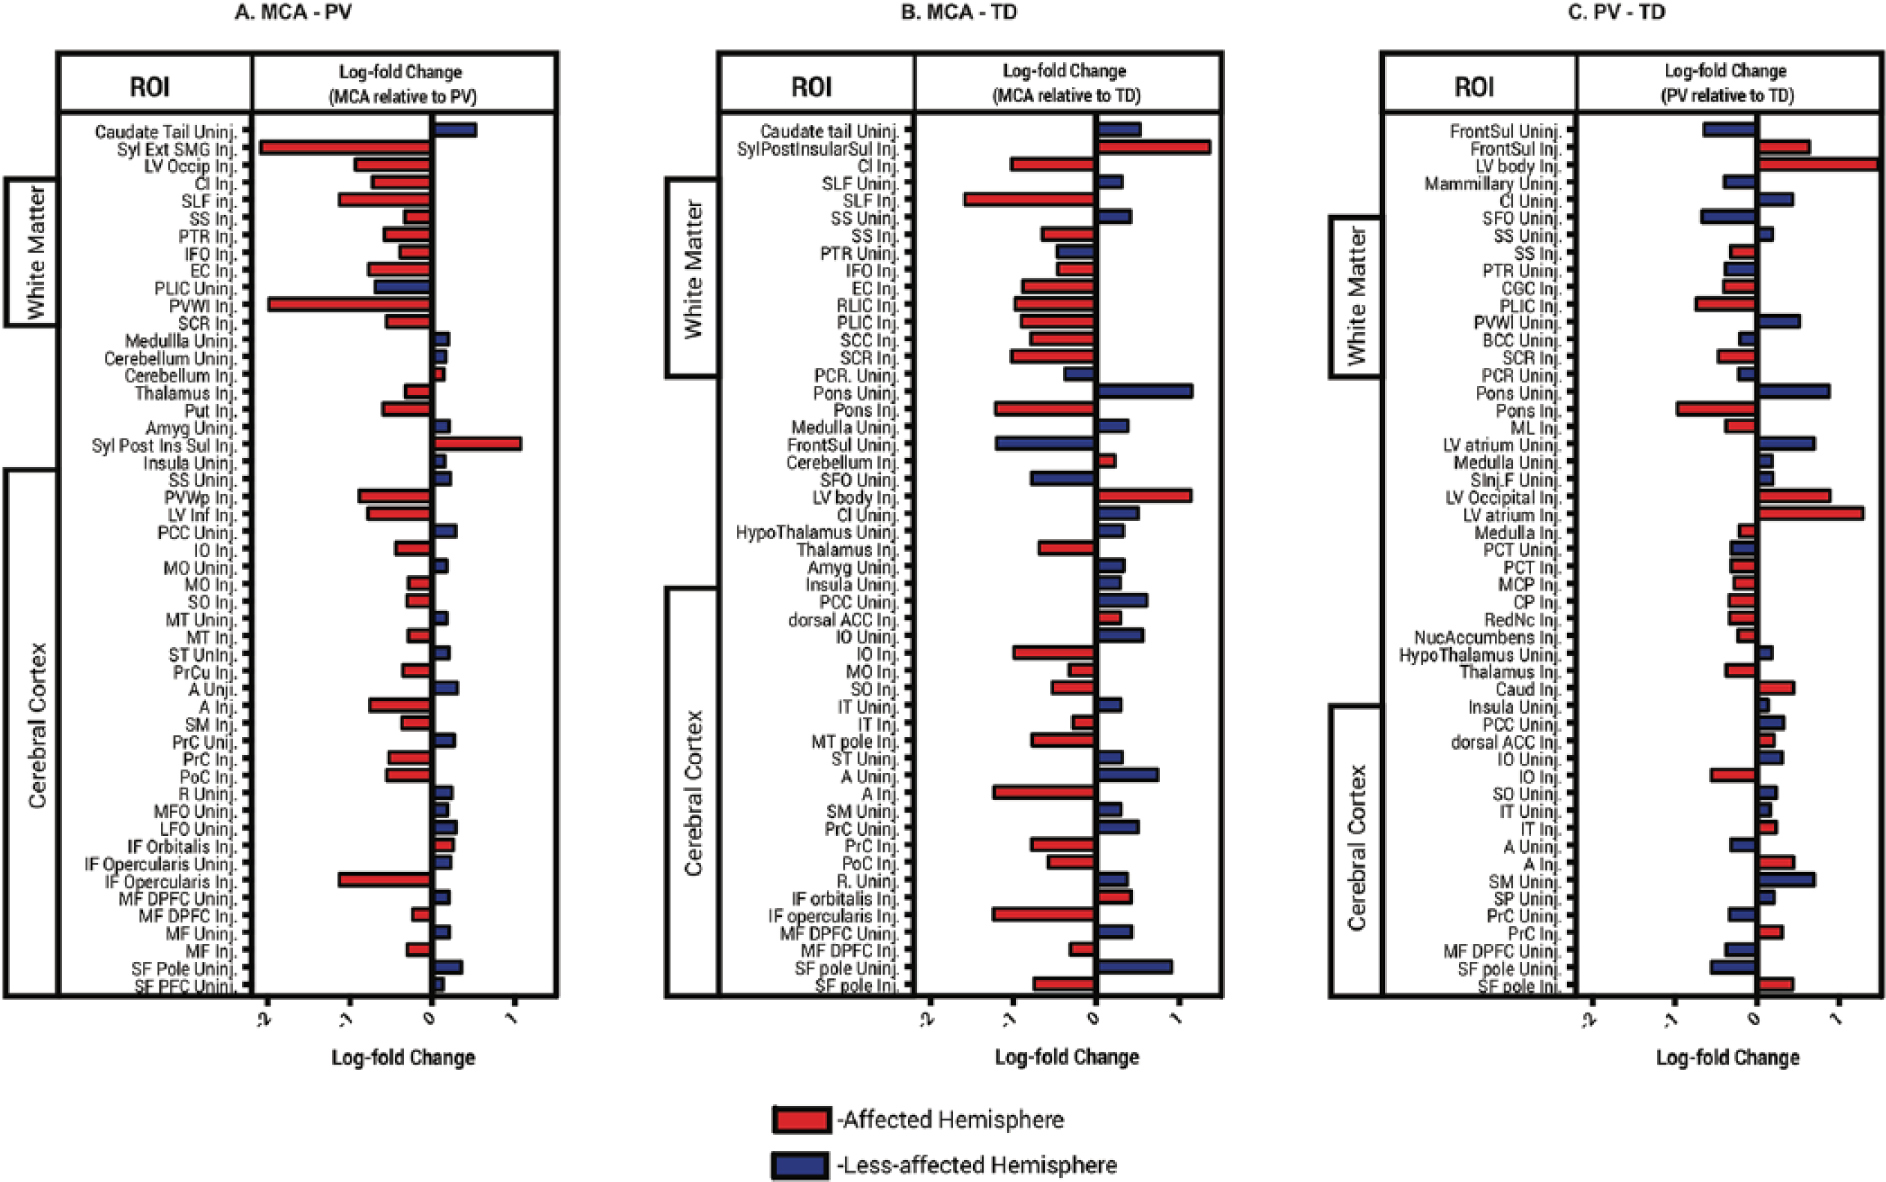
Specific ROIs differentially expressed between TD (typically developing), MCA (middle cerebral artery), and PV (periventricular). Bars represent log-fold change (ie, standardized difference) of MCA relative to PV. Abbreviations and atlas description can be found at https://mricloud.org.
Group Comparison Using PCA
PCA was performed using the group of structures (n = 89) that significantly differed between the 2 injury groups. The first component correlated strongly with volume increases of the uninjured cortex and decreases in volume of the injured cortex. The proportion of variance associated with the first component was 28.8%. The second component had a variance of 21.0%, and the third component was associated with a variance of 9.10%. Supplementary Figure 2 shows the results from the area under the ROC (receiver operating characteristic) curve. Principal component 1 and principal component 2 did fairly well at discriminating between brain injury groups. As suggested above (ie, variance component), principal component 3 was not very informative in discriminating between groups.
Relationship Between Structure and Function
Multiple regression analysis was used to develop models for predicting hand function from the first 3 principal components. Regression coefficients are presented in Table 2. For all the models, only the first 2 principle components had significant partial effects. For BBT, the full model accounted for 39% of the variance, F(3, 36) = 7.54, P < .001. For JTTHF, the model accounted for 42% of the variance, F(3, 36) = 8.44, P < .001. For AHA, the model accounted for 42% of the variance, F(3, 36) = 8.78, P < .001.
Regression Coefficients for Principal Components on Hand Function and Comparisons of PCA Versus Brain Injury-Type Models.
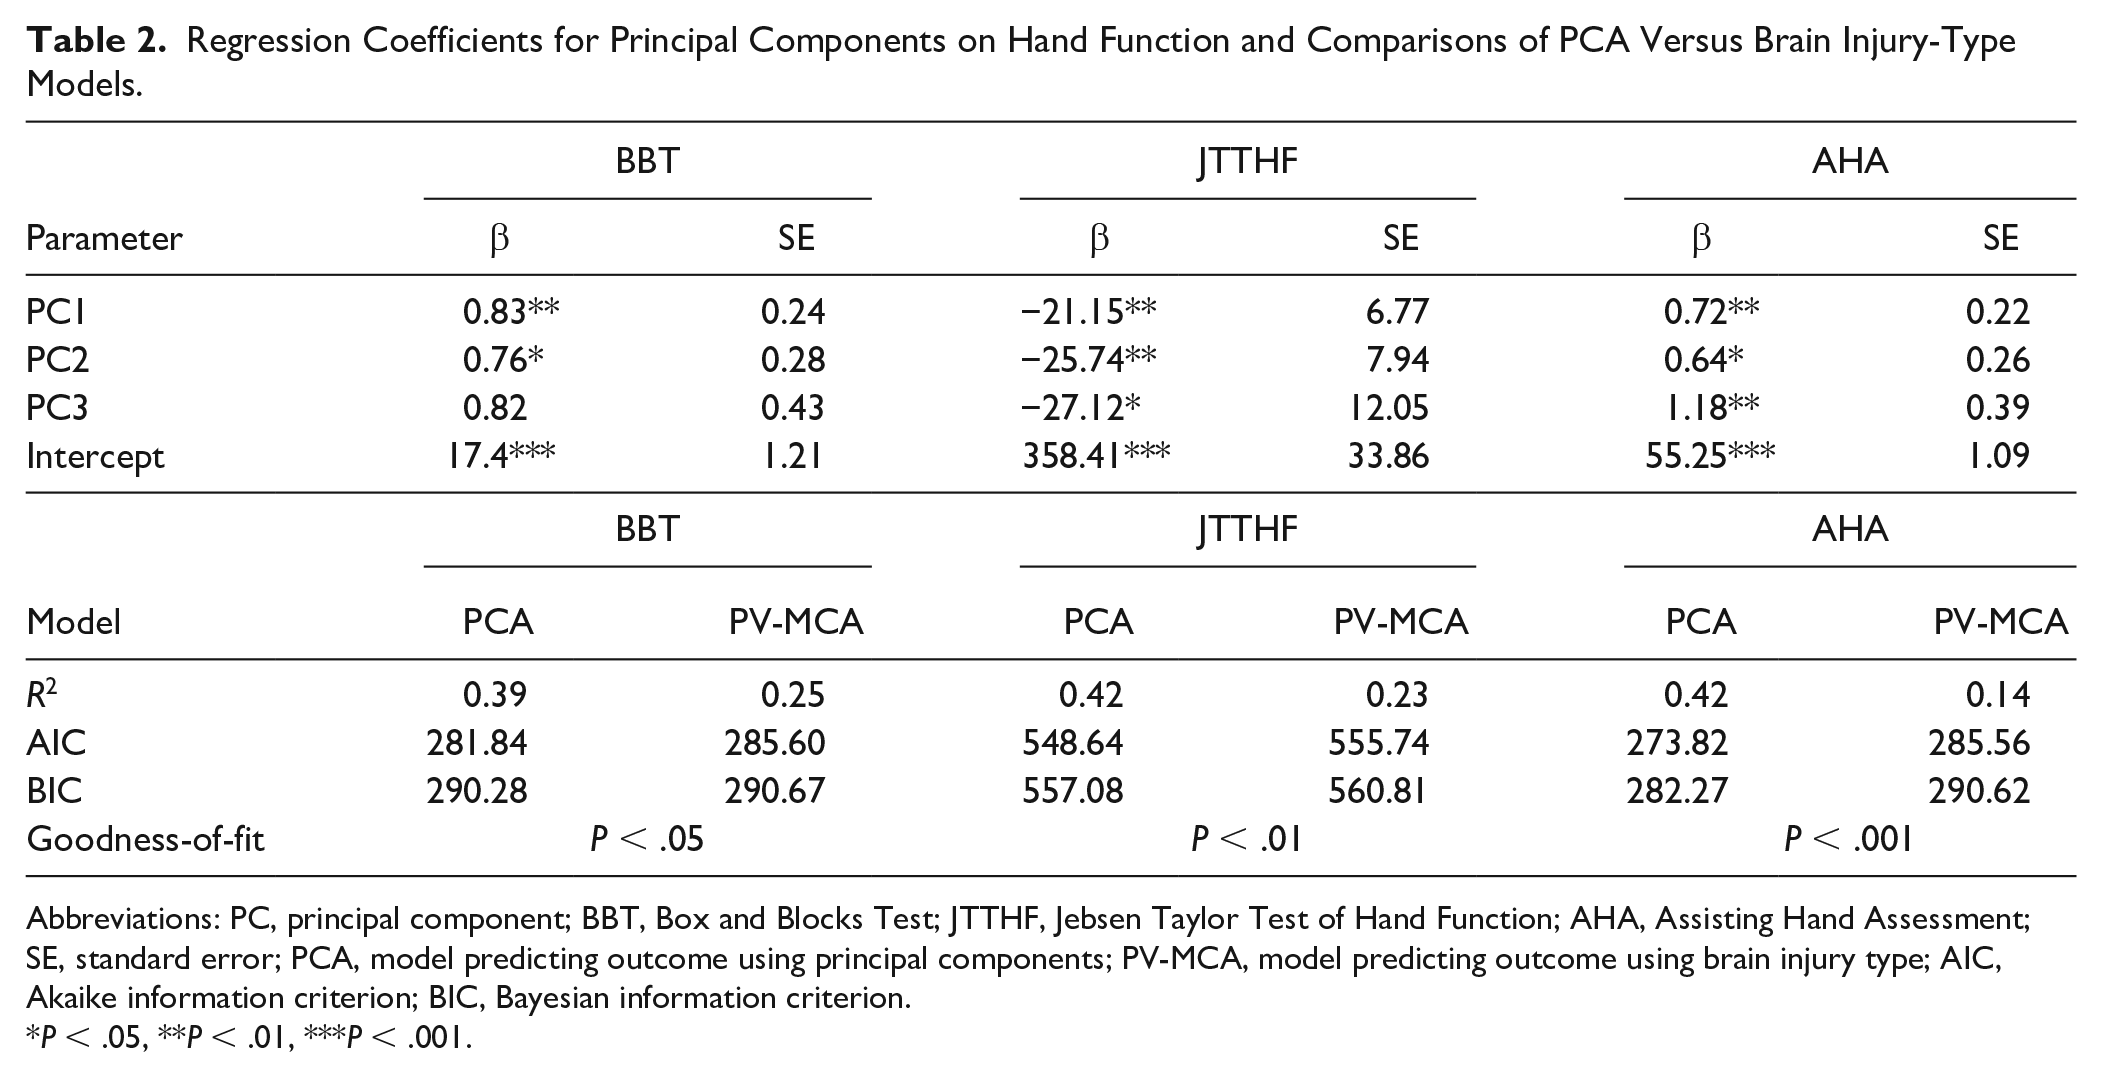
Abbreviations: PC, principal component; BBT, Box and Blocks Test; JTTHF, Jebsen Taylor Test of Hand Function; AHA, Assisting Hand Assessment; SE, standard error; PCA, model predicting outcome using principal components; PV-MCA, model predicting outcome using brain injury type; AIC, Akaike information criterion; BIC, Bayesian information criterion.
P < .05, **P < .01, ***P < .001.
Comparisons of Predictive Models
We compared PCA regression models described above with models containing only brain injury type to predict hand function. The results are presented in Table 2. For all the models, the PCA regression demonstrated a better fit compared to the brain injury type regression as indicated by the lower Akaike information criterion and Bayesian information criterion values, and the amount of variance accounted for by each model (ie, R2). The goodness-of-fit for each model comparison indicates that the observed differences were statistically significant.
Discussion
Using fully automated atlas-based parcellation, we identified anatomical patterns that related to hand function in children with UCP. We found that patterns of ROI volumes differentiated TD children from children with MCA and PV. Our differential volume analyses revealed volumetric differences in brain regions between children with MCA and PV—the majority of which were located in the cortex or as part of white matter structures. Clustering based on anatomical features revealed distinct subgroups of children. The patterns of volumetric differences were more predictive of hand function than gross classification of brain injury type. These findings highlight the value of using unbiased, data-driven classification to understand the heterogeneity present in children with perinatal brain injury. Improving categorization of anatomical patterns derived from imaging studies is likely to shed light on the etiological pathways of CP. 37
Data-Driven Classification of Brain Injury
Neuroimaging studies have been instrumental in increasing our understanding of developmental brain anomalies in children with CP. However, their clinical utility has been underwhelming due in part to variability in classification systems, inconsistent descriptions, and small sample sizes. 38 Structural findings are typically based on classification systems with broad categories (eg, malformations, periventricular leukomalacia, gray matter injury) and presumed timing of the brain injury (ie, inferred from established sequence of brain development). Although there is some evidence to suggest that such classification systems predict functional abilities, the heterogeneity within groups preclude a precise characterization of the relationship between brain lesions and clinical function. 39
The shortcomings of broad classifications systems highlight the need for more detailed quantitative studies. Until recently, the technical challenges associated with quantitative approaches have limited their widespread use. 40 The development of accessible image analysis tools has provided a bridge for clinicians and researchers to adopt standardized quantitative techniques. MRICloud, a high-throughput neuroinformatics platform for automated brain MRI segmentation, is one such tool that has facilitated data analysis and interpretation. 21 Estimation of ROI volumes permit meaningful and detailed comparisons between subgroups. The atlas-based tool allows precise anatomical evaluation of individuals with brain injury, above and beyond abnormality detection. For example, Faria and colleagues 41 performed quantitative whole-brain evaluation of diffusion tensor images to highlight differences in regional white matter between TD children and children with CP. Here we demonstrate similar differentiation between TD children and children with CP using structural images. Similarly, Yoshida and colleagues 42 used whole-brain parcellation and PCA to delineate anatomical patterns between 2 classification types of CP. As with the approach described in our study, the combination of whole-brain parcellation and PCA permits categorization of individuals that is based on observed anatomical variability rather than imposed categories uninformed by data.
Our differential signal analysis revealed for the most part, clusters of children that were comprised mainly of individuals from either TD children, or MCA and PV lesion types (Figure 3). However, there were many individuals that did not fit the anatomical patterns of their lesion type cluster, and instead clustered more closely with children from the other lesion type (ie, MCA individuals that presented more like patterns expressed by PV individuals). These individuals, outliers in terms of their anatomy with respect to their lesion type classification, may reveal cases that are unique in additional domains (ie, hand function, sensory abilities). 22 In our study, we paired data-driven categorization with clinical hand function data, thereby allowing us to analyze anatomy-function relationships. We observed that categorization of individuals based on the extracted features (ie, PCA) was more predictive of function than broader classification of injury type (ie, MCA vs PV). Further systematic characterization in future studies with even larger sample sizes is necessary to determine whether this approach provides predictive value for prognosis. In the adult stroke literature, the emergence of standardized pipelines for analyzing lesions and large imaging data have provided new promise for understanding anatomical variability and potential therapeutic targets. 43 The infrastructure for analysis of neuroimaging in CP population is severely lacking.
Identification of Patterns of Affected Brain Regions
Our analysis, based on differential signal analysis, allowed us to identify specific anatomical regions that differed between the 2 lesion types. Differential expression analysis normalizes (ie, using statistical and machine learning methods) the volumetric data and allows differential volumes to be extracted for specific ROIs. 44 This approach is robust with respect to the number of comparisons made with such a high volume of data. We found that about 45% of the ROIs examined differed between children with PV and MCA (Figure 4A). The majority of differences were reductions in white matter and cortical volume in children with MCA compared with PV. Interestingly, the majority of ROIs that were found to be larger in children with MCA compared with PV were identified in the cortex of the uninjured hemisphere. This observation might be explained by the developmental response to injury that occurs in children with CP, whereby early bilateral projections of descending motor tracts from the uninjured hemisphere persist in the absence of competition from the descending tracts of the injured hemisphere.7,45-47
For example, in our study, we observed clear differences between the 2 brain injury groups for the volume of the thalamus (Figure 4A). Given the importance of the structure’s involvement in sensorimotor loops and the clear differences in hand function between the 2 injury groups, further exploration of pathways involving the thalamus might be warranted using multimodal imaging. 2 Previous work with children with CP demonstrated that lesions affecting the basal ganglia/thalamus are predictive of greater upper-limb impairments. 12
We also observed that the cerebellum was larger in volume for both the MCA (injured and uninjured side) and PV (injured side) compared with TD children. Our finding, in combination with functional imaging studies that have observed broadly increased cerebellar activation during active hand movements in children with CP compared to TD children, 48 raise interesting questions about the potentially adaptive role of the cerebellum. Further work aimed at unraveling the role the cerebellum might play in sensorimotor learning in children with CP is urgently necessary. Given that it is hypothesized to play a role in sensorimotor adaptation, 49 the structural and functional integrity of the cerebellum may have direct consequences for neurorehabilitation paradigms.
Limitations
This study has several limitations. First, the total number of participants was small given the number of brain regions analyzed and the observed variability, although differential anatomical patterns were identified because of the robustness of the analysis employed. Although the differential signal analysis permits identification of specific ROIs that are unique between the brain injury groups, caution is warranted in interpretation of such differences. Given their size, lack of contrasts, and anatomical abnormalities, automated definition of smaller brains structures is less reliable than definition of larger structures. 26 Thus, automated segmentation results are only an approximation. Additionally, older children have larger brain volumes in general and comparisons with pediatric atlases might not be the most appropriate. Although we were able to specify the broad age range for atlas comparison, atlases based on more specific ages might facilitate segmentation. With larger databases and improved algorithms, the accuracy of fine-grained segmentation will improve. However, our results might still be used as a starting point for generating hypotheses.
Second, the automated brain parcellation might not provide accurate results, particularly when there are severe anatomical abnormalities. However, the inclusion of a TD group of children that served as comparison controls suggests that the parcellation accurately clusters anatomically distinct groups. Our TD control group are data from a publicly available resource (PING) that employed slightly different imaging parameters, thus creating technical between-scanner differences (eg, contrast differences) that may constrain the interpretation of our findings. Fjell et al 25 describe procedures used to facilitate pooling of data from different scanners in the PING study and to reduce bias or loss of sensitivity. Although the authors find reproducibility and validity of the procedures used to coordinate across their sites, the differences between PING and with our scanning protocol remain. Nonetheless, the feasibility of using healthy controls from publicly available data sets provides an incredibly valuable comparison. Future studies using our approach would benefit from data harmonization techniques to circumvent some of the heterogeneity present when pooling data across sites. 50
Although we performed gross visual inspection, the number of ROIs analyzed and the number of participants included in the study prevent comprehensive quality control. The parcellation pipeline permits segmentation into structures at various ontological levels with increasing specificity. Higher levels provide greater spatial resolution and analysis of more structures at the cost of increased noise. Future research should focus on establishing guidelines for correction and analysis as is being developed for adult stroke studies 43 and examine levels with less specificity but greater signal-to-noise ratio.
Our study population was restricted to specific types of brain injury (MCA and PV). Given that the participants in this study were also part of a larger parent trial testing an upper limb treatment, our population’s range of hand impairments were also limited to specific inclusion criteria. Although these subgroups make up a significant proportion of children with UCP, future studies should expand to include the entire range of brain injury types and a wider range of hand function. Finally, the sole imaging outcome for our study was volume. A more exhaustive characterization of structure-function relationships should include multimodal approaches (ie, structural imaging, diffusion tensor imaging, functional imaging, etc). 51
Conclusions
The singularity of lesion location, timing, and size in children with CP, and the developmental nature of the disorder preclude systematic anatomical classification by subjective observation. Whole-brain analyses reveal anatomical phenotypes that might be more accurate and informative in defining subgroups of children with UCP. Future studies should focus on the potential prognostic utility of this approach. An integrative and unbiased analysis of all brain regions might help elucidate the neuroanatomic relationships between different subgroups, and how different brain injuries contribute to the variability in motor function. Identifying these similarities and differences could help spur the development of more precise treatments and improve clinical prognosis.
Supplemental Material
Parcellation_analysis – Supplemental material for Anatomical and Functional Characterization in Children With Unilateral Cerebral Palsy: An Atlas-Based Analysis
Supplemental material, Parcellation_analysis for Anatomical and Functional Characterization in Children With Unilateral Cerebral Palsy: An Atlas-Based Analysis by Claudio L. Ferre, Jason B. Carmel, Véronique H. Flamand, Andrew M. Gordon and Kathleen M. Friel in Neurorehabilitation and Neural Repair
Supplemental Material
Supp_Figure_1 – Supplemental material for Anatomical and Functional Characterization in Children With Unilateral Cerebral Palsy: An Atlas-Based Analysis
Supplemental material, Supp_Figure_1 for Anatomical and Functional Characterization in Children With Unilateral Cerebral Palsy: An Atlas-Based Analysis by Claudio L. Ferre, Jason B. Carmel, Véronique H. Flamand, Andrew M. Gordon and Kathleen M. Friel in Neurorehabilitation and Neural Repair
Supplemental Material
Supp_Figure_2 – Supplemental material for Anatomical and Functional Characterization in Children With Unilateral Cerebral Palsy: An Atlas-Based Analysis
Supplemental material, Supp_Figure_2 for Anatomical and Functional Characterization in Children With Unilateral Cerebral Palsy: An Atlas-Based Analysis by Claudio L. Ferre, Jason B. Carmel, Véronique H. Flamand, Andrew M. Gordon and Kathleen M. Friel in Neurorehabilitation and Neural Repair
Footnotes
Acknowledgements
Data used in the preparation of this article were obtained from the NIH Pediatric MRI Data Repository created by the NIH MRI Study of Normal Brain Development. This is a multisite, longitudinal study of typically developing children from ages newborn through young adulthood conducted by the Brain Development Cooperative Group and supported by the National Institute of Child Health and Human Development, the National Institute on Drug Abuse, the National Institute of Mental Health, and the National Institute of Neurological Disorders and Stroke (Contract #s N01-HD02-3343, N01-MH9-0002, and N01-NS-9-2314, -2315, -2316, -2317, -2319, and -2320). A listing of the participating sites and a complete listing of the study investigators can be found at ![]() . We would also like to thank Drs Susumu Mori and Kenichi Oishi (Johns Hopkins University) for help with data processing and MRICloud support.
. We would also like to thank Drs Susumu Mori and Kenichi Oishi (Johns Hopkins University) for help with data processing and MRICloud support.
Supplementary material for this article is available on the Neurorehabilitation & Neural Repair website along with the online version of this article.
Author Contributions
Study concept and design: CF, JC, KF
Data acquisition and analysis: CF, JC, VF, KF, AG
Drafting manuscript and figures: CF, JC, AG, KF
Declaration of Conflicting Interests
The authors declared no potential conflicts of interest with respect to the research, authorship, and/or publication of this article.
Funding
The authors disclosed receipt of the following financial support for the research, authorship, and/or publication of this article: This work was supported by NIH/NCATS Grant # TL1-TR-002386 (CLF), NIH Grant #1R01NS092875 (JBC), and NIH Grant # R01HD076436 and #R01HD095663 (KMF, AMG).
References
Supplementary Material
Please find the following supplemental material available below.
For Open Access articles published under a Creative Commons License, all supplemental material carries the same license as the article it is associated with.
For non-Open Access articles published, all supplemental material carries a non-exclusive license, and permission requests for re-use of supplemental material or any part of supplemental material shall be sent directly to the copyright owner as specified in the copyright notice associated with the article.