
Abstract
Background. The neuroimaging literature on cerebral palsy (CP) has predominantly focused on identifying the structural aberrations (eg, fiber track integrity), with very few studies examining neural activity within the key networks that serve the production of hand movements. Objective. We aimed to start to fill this knowledge gap by using magnetoencephalographic brain imaging to quantify the temporal dynamics of the sensorimotor oscillations during a hand motor action. Methods: Children with CP (n = 12; MACS [Manual Abilities Classification System] levels I-III) and typically developing (TD) children (n = 26) performed an arrow-based version of the Eriksen flanker task where a button press was performed with either the second or third digit of the right hand depending on the arrow’s direction. Results: Overall, the children with CP were less accurate and had slower reaction times compared with the TD children. These behavioral differences were closely linked with aberrant sensorimotor cortical oscillations seen in the children with CP. Compared with the TD children, the children with CP had a weaker gamma (68-82 Hz) response during motor execution and a weaker post-movement beta rebound (PMBR; 14-26 Hz) response on movement termination. Moreover, we observed a significant correlation between the amplitude of the gamma and PMBR with reaction time, with weaker gamma and PMBR responses being linked with slower reaction times. Conclusions: Overall, these results suggest that aberrations in motor-related gamma and beta cortical oscillations are associated with the impaired hand motor actions seen in children with CP.
Introduction
Cerebral palsy (CP) is a blanket term for a group of permanent but malleable developmental disorders often stemming from a perinatal brain insult. 1 The insult frequently affects the periventricular white matter areas, 2 which reduces the integrity of the information transmitted by the thalamocortical and corticospinal tracts. 3 Damage to these fiber tracts can result in a wide variety of sensorimotor impairments that affect limb movement, including motor control of the hand during a variety of daily functional tasks (eg, buttoning shirt, grasping objects, and writing). 4 The impaired hand motor actions are often associated with sensory discrimination deficits, 5 poor prediction of grip forces, 6 and a declined ability to learn new upper extremity motor skills. 7 The current physical therapy trends are directed at remedying these impairments by using a task-oriented approach that focuses on inducing beneficial neurophysiological changes in the damaged areas of the brain through mass practice with the affected hand (eg, constrained-induced movement therapy, hand-arm bilateral intensive therapy). Numerous studies have shown that a large percentage of children with CP display clinically relevant improvements in their hand motor function after undergoing these treatment approaches. 8 However, the functional basis of these improvements remains poorly understood, as the neuroimaging literature has predominantly focused on identifying how structural aberrations (eg, fiber track integrity) modulate the clinically relevant improvements seen after these interventions,9-11 with very few studies examining neural activity within the key networks that serve the production of the hand motor actions.12-15
The outcomes from functional MRI (fMRI) have noted that children with CP have reduced sensorimotor cortical activity in the hemisphere contralateral to the more affected hand, and compensatory cortical activity in the ipsilateral hemisphere.14,16-18 Resting-state analyses have also shown less connectivity in the sensorimotor cortices of the more affected hemisphere. With regard to physical therapy, increased sensorimotor cortical activity and resting-state connectivity within sensorimotor networks may be associated with better hand motor function after therapy.14,15 Although the outcomes from these few studies have been enlightening, there remains a notable gap in our understanding of how aberrant cortical activity affects the hand motor actions of children with CP. Such insights may lead to new metrics for gauging success and/or identifying treatment principles for task-orientated therapeutic approaches that can improve hand motor function.
In individuals with no neurological deficits, there is remarkable consistency in the frequency-specific sensorimotor cortical oscillations seen across different movement types. For example, it is well appreciated that volitional movement is associated with a beta (15-30 Hz) event-related desynchronization (ERD) that begins prior to the initiation of the movement and is sustained throughout the movement duration.19-21 This response is generally centered on the sensorimotor strip and follows a somatotopic/motortopic organization. It has been suggested that the beta ERD response prior to movement onset represents the cortical processing to support the planning of a motor action, while the sustained beta ERD during the motor action likely contributes to execution and/or monitoring of the ongoing motor action. The sensorimotor cortices also display a brief gamma (~60-80 Hz) event-related synchronization (ERS) at movement onset. Since it is time-locked to movement onset, the gamma ERS is presumed to represent the execution of the motor command to the pertinent peripheral motor units.22,23 After the movement is completed, there is a strong post-movement beta rebound (PMBR). 24 The functional significance of the PMBR is less clear than the beta ERD and gamma ERS, but two of the most prominent theories include that it is a reflection of the afferent movement-related sensory feedback and/or confidence in the feedforward motor action based on the internal model of the musculoskeletal system dynamics.25-29 More recently, modulation of the PMBR amplitude has also been shown to be dependent on the intensity and rate of the muscular contraction that was performed. 30 This suggests that larger muscular contractions in the effector produce a greater PMBR.
Despite our emerging understanding of how changes in oscillatory activity within motor-related cortical areas are involved in the production and control of a motor action, very few studies have extended this knowledgebase to evaluate the neurophysiological nexus of the impaired motor actions seen in children with CP. The few studies that have been conducted have focused on the lower extremities and have shown that children with CP demonstrate aberrant beta and gamma oscillations while producing a leg motor action.21,31 Moreover, the strength of the beta oscillations in these studies appear to parallel the slower reaction times and errors that are seen in the leg motor actions of these children. Altogether, these prior studies imply that deviations in the beta and gamma cortical oscillations during the motor planning and execution stages are likely central to the altered motor actions seen in children with CP. Nevertheless, we still have limited insight regarding whether similar deviations in the cortical oscillations also are associated with the deficits in hand motor control seen in these children.
In the current investigation, we used magnetoencephalography (MEG) to identify whether the temporal dynamics of the sensorimotor cortical oscillations differ between children with CP and typically developing (TD) children as they completed an arrow-based version of the Erikson flanker task. We chose this task as a recent study showed that motor responses during the flanker are associated with robust beta and gamma oscillations. 32 Our primary hypotheses were (1) that the children with CP would have weaker gamma and beta sensorimotor cortical oscillations relative to TD group during the planning and motor execution stages of the task and (2) that the altered cortical oscillations seen in the children with CP would be significantly correlated with deviations in their motor performance.
Methods
Subjects
Twelve children with CP that had a diplegic or tetraplegic presentation (age = 15.8 ± 1.1 years; MACS [Manual Abilities Classification System] levels I-III) were recruited from clinics at the University of Nebraska Medicine’s (UNMC) Munroe-Meyer Institute and 26 typically developing (TD) children (age = 14.7 ± 0.3 years) were recruited from the community (Table 1). All of the children and their parent/guardian provided written consent to participate in the investigation, and the enrolled children provided assent. The protocol for this investigation was approved by the Institutional Review Board at UNMC and in compliance with the Code of Ethics of the World Medical Association.
Cerebral Palsy Group Characteristics.
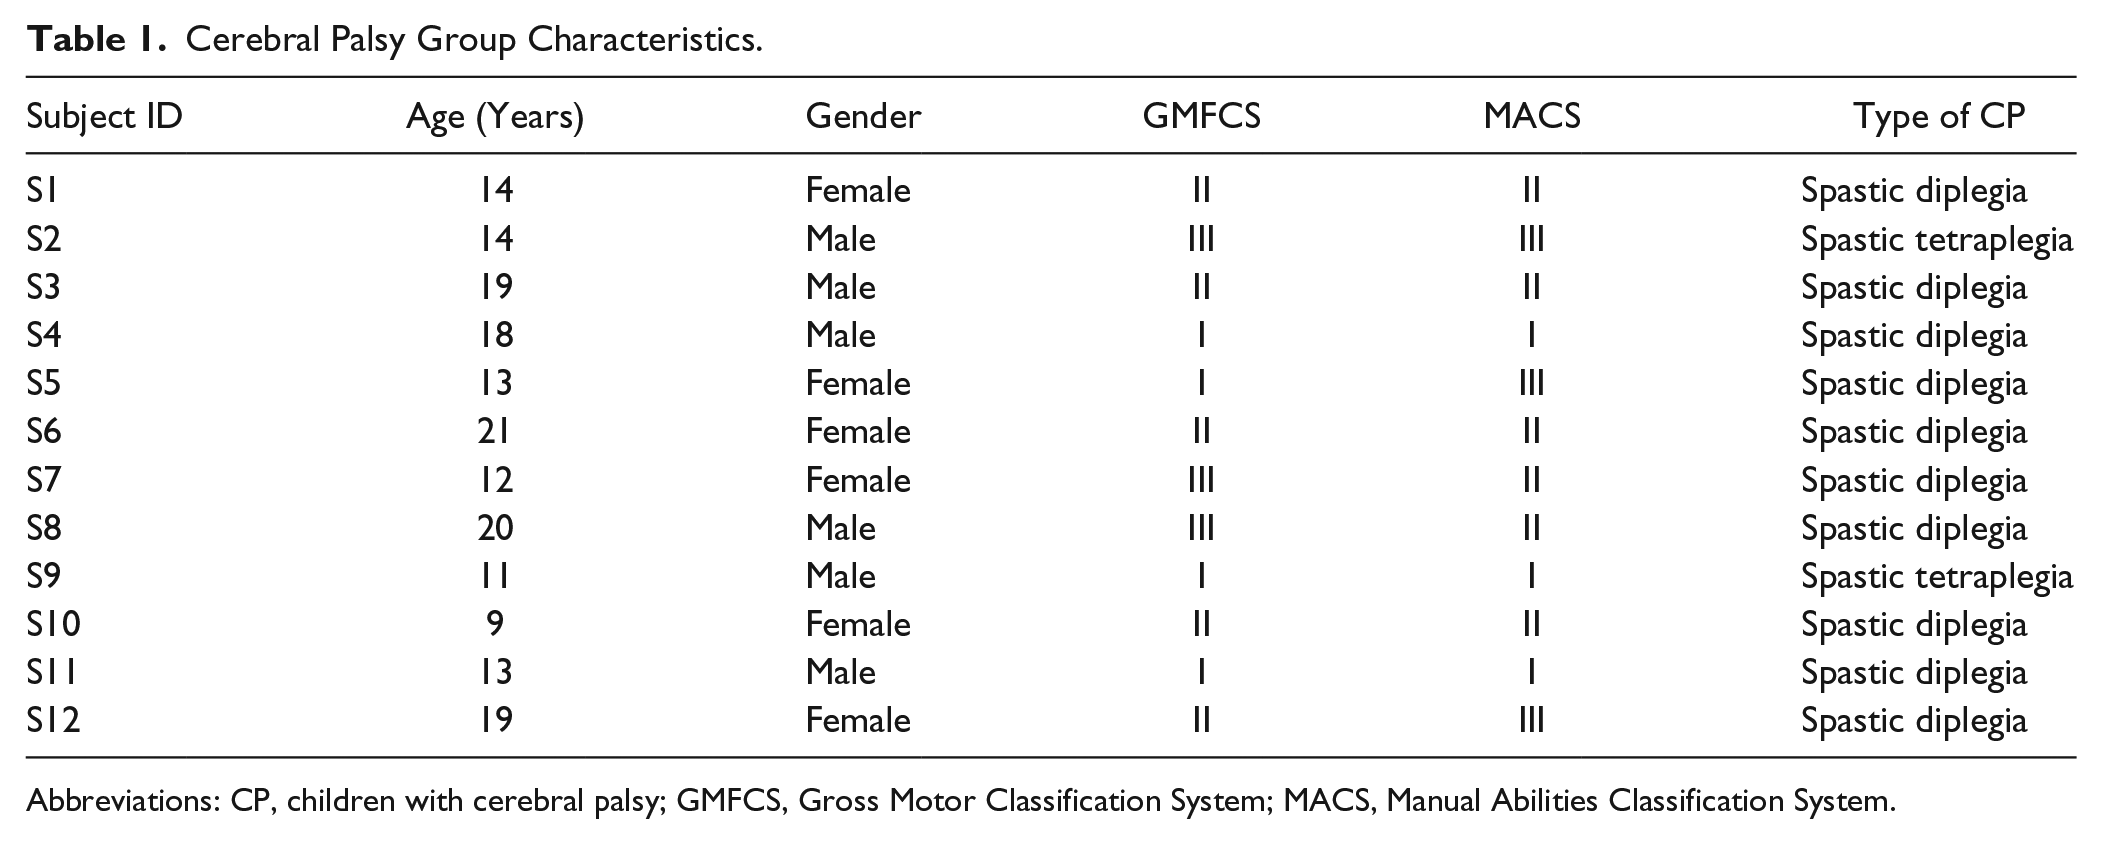
Abbreviations: CP, children with cerebral palsy; GMFCS, Gross Motor Classification System; MACS, Manual Abilities Classification System.
MEG Data Acquisition and Experimental Paradigm
Neuromagnetic responses were sampled continuously at 1 kHz with an acquisition bandwidth of 0.1 to 330 Hz using an Elekta MEG system (Helsinki, Finland). All recordings were conducted in a 1-layer magnetically shielded room with active shielding engaged for advanced environmental noise compensation. The children were seated upright in a magnetically silent chair and completed an arrow-based version of the Eriksen flanker task.33-35 Each trial began with a fixation cross that was presented for an interval of 1500 ± 50 ms. A row of 5 arrows was then presented for 2500 ms, at which time the children were instructed to respond as to the direction of the center arrow with their second (left arrow) or third (right arrow) digit of the right hand using a custom 5-button pad (Figure 1). The task image was projected into the magnetically shielded room on a screen that was approximately 70 inches from the child. A total of 200 trials were presented, and the trials were equally split and pseudo-randomized between congruent and incongruent conditions, with left and right pointing arrows being equally represented in each condition. Only correct responses were included for further analysis. Of note, the TD children were significantly more accurate than those with CP; thus, we randomly removed trials from the MEG data of the TD children to ensure that the total number of trials included in the final MEG analysis did not statistically differ between groups. Equating the number of trials across groups is important because it helps ensure that the signal-to-noise ratio (SNR) is roughly equal across the 2 groups, and thus circumvents the concern that differences in SNR underlie observed group differences in physiological response amplitude.
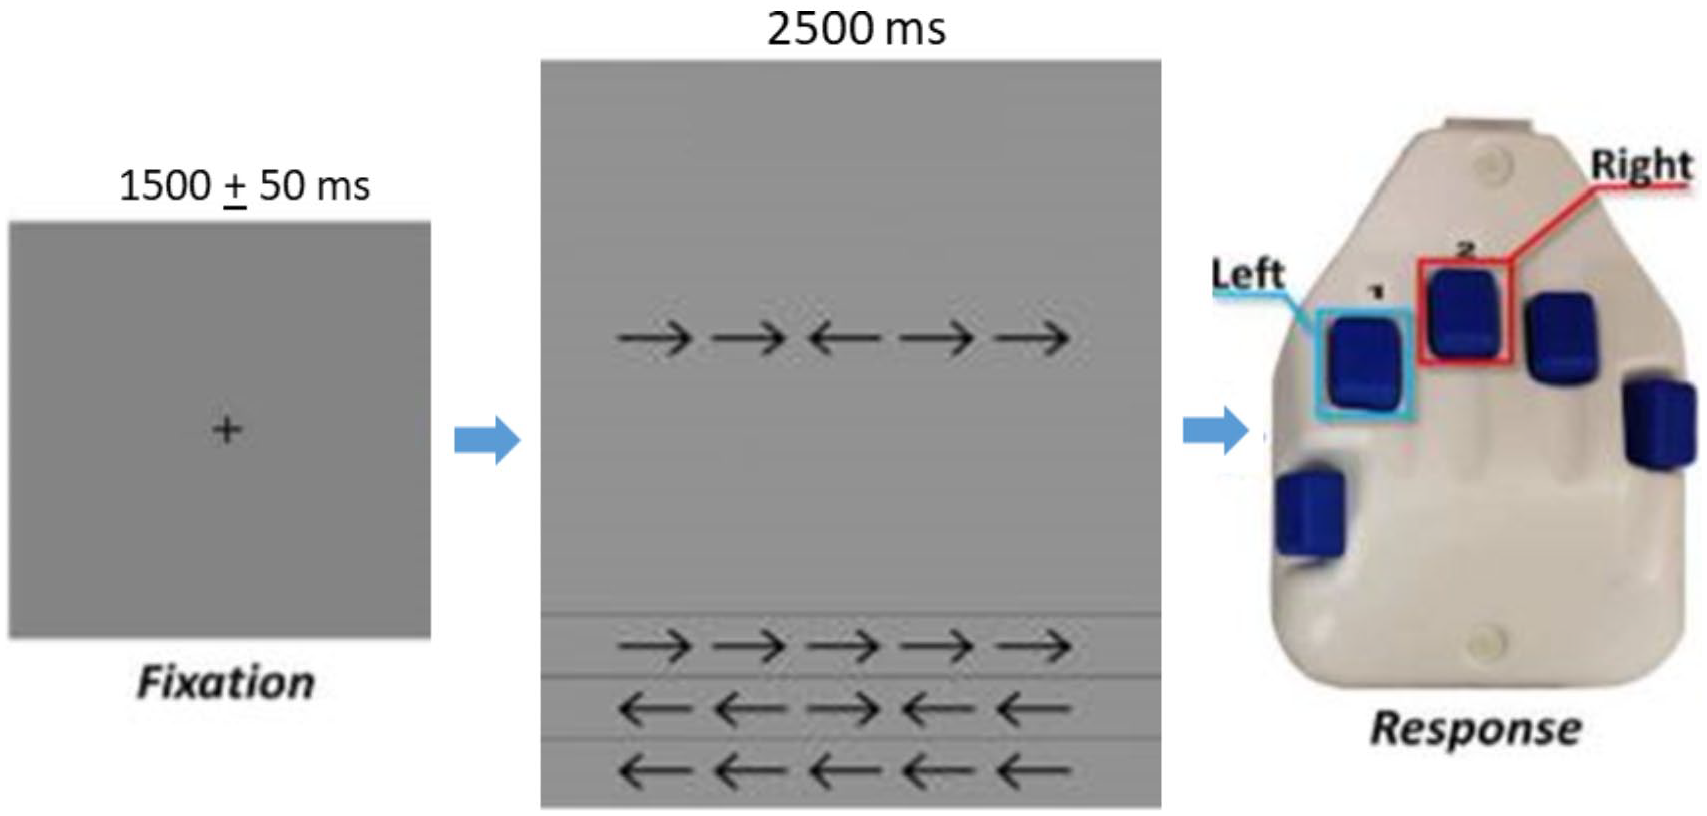
For each trial, the children fixated on a crosshair for 1500 ± 50 ms, then a display with a series of 5 arrows appeared for 2500 ms. On arrows appearing, the children responded with their right hand regarding the center arrow pointing to the left (second digit) or right (third digit). In the congruent condition, the flanking arrows pointed in the same direction as the middle arrow. In the incongruent condition, the flanking arrows pointed in the opposite direction than the middle arrow.
MEG Coregistration
Four coils were affixed to the head of the child and were used for continuous head localization during the MEG experiment. Prior to the experiment, the locations of these coils, 3 fiducial points, and the scalp surface were digitized to determine their 3-dimensional position (Fastrak 3SF0002, Polhemus Navigator Sciences, Colchester, VT). Once the child was positioned for the MEG recording, an electric current with a unique frequency label (eg, 322 Hz) was fed to each of the 4 coils. This induced a measurable magnetic field and allowed each coil to be localized in reference to the sensors throughout the recording session. Since the coil locations were also known in head coordinates, all MEG measurements could be transformed into a common coordinate system. With this coordinate system (including the scalp surface points), each child’s MEG data were coregistered with his/her individual high-resolution structural T1-weighted MRI data, prior to the application of source space analyses (ie, beamforming), using BESA MRI (Version 2.0). These T1-weighted images were acquired with a 3-T Siemens Skyra scanner using a 32-channel head coil (TR: 2400 ms; TE: 1.94 ms; field of view: 256 mm; slice thickness: 1 mm with no gap; in-plane resolution: 1.0 × 1.0 mm). The structural volumes were aligned parallel to the anterior and posterior commissures and transformed into Talairach standardized space, along with the functional images, after beamforming. 36 All lesions observed in the children with CP were subcortical and involved periventricular leukomalacia. Hence, the brain pathology did not corrupt the Talairach transformation process nor involve direct cortical tissue loss.
MEG Preprocessing, Time-Frequency Transformation, and Statistics
Using the MaxFilter software (Elekta), each MEG dataset was individually corrected for head motion that may have occurred during task performance and was subjected to noise reduction using the signal space separation method with a temporal extension. 37 Artifact rejection was based on a fixed threshold method, supplemented with visual inspection. The continuous magnetic time series was divided into epochs of 4000 ms in duration, with 0 ms defined as the button press response and the baseline being the −1600 to −1200 ms time window. Artifact-free epochs for each sensor were transformed into the time-frequency domain using complex demodulation and averaged over the respective trials. These sensor-level data were normalized by dividing the power value of each time-frequency bin by the respective bin’s baseline power, which was calculated as the mean power during the baseline (−1600 to −1200 ms). This baseline time window was selected based on our inspection of the sensor level absolute power data, which showed that this time window was quiet and temporally distant from the peri-movement oscillatory activity, and because we wanted to ensure that the onset of the visual stimulus did not occur during the baseline. The specific time-frequency windows used for imaging were determined by statistical analysis of the sensor-level spectrograms across the entire array of gradiometers. Each data point in the spectrogram was initially evaluated using a mass univariate approach based on the general linear model. To reduce the risk of false positive results while maintaining reasonable sensitivity, a 2-stage procedure was followed to control for Type 1 error. In the first stage, 1-sample t tests were conducted on each data point and the output spectrogram of t values was thresholded at P < .05 to define time-frequency bins containing potentially significant oscillatory deviations across all children and conditions. In stage 2, time-frequency bins that survived the threshold were clustered with temporally and/or spectrally neighboring bins that were also above the (P < .05) threshold and a cluster value was derived by summing all of the t values of all data points in the cluster. Nonparametric permutation testing was then used to derive a distribution of cluster values, and the significance level of the observed clusters (from stage 1) was tested directly using this distribution.38,39 For each comparison, 10 000 permutations were computed to build a distribution of cluster values.
MEG Source Imaging
A minimum variance vector beamformer was employed to calculate the source power across the entire brain volume. 40 The single images were derived from the cross spectral densities of all combinations of MEG sensors, and the solution of the forward problem for each location on a grid specified by input voxel space. Following convention, the source power in these images was normalized per subject using a separately averaged prestimulus noise period of equal duration and bandwidth.41-43 Thus, the normalized power per voxel (pseudo-t) was computed over the entire brain volume per child at 4.0 × 4.0 × 4.0 mm resolution. Each child’s functional images, which were coregistered to their structural T1-weighted MRI prior to beamforming, were transformed into standardized space using the transform previously applied to the structural MRI volume and spatially resampled. MEG preprocessing and imaging used the BESA software (BESA v6.0; Grafelfing, Germany).
Motor Behavioral Data
The output of the button pad was simultaneously collected at 1 kHz along with the MEG data and was used to quantify the child’s motor performance. The formulation of the motor plan was assumed to be represented by the reaction time, which was calculated based on the time from when the arrow array was presented to when the button press was initiated. We probed the effects of condition on accuracy and reaction time between groups. Accuracy was defined as the percentage of correct responses divided by the total number of trials. Separate repeated-measures ANOVAs (congruent/incongruent × group) were used to evaluate the differences in the accuracy and reaction time, respectively. Pearson correlations were used to determine the relationships between the behavioral and the average relative power identified for the beta ERD, gamma ERS, and PMBR. All statistical analyses were performed within SPSS statistical software (IBM, Armonk, NY) using a .05 α level.
Results
Motor Behavioral Results
Individual motor behavioral results are found in the supplementary material. The analysis of accuracy revealed a significant main effect of condition (P = 0.002), demonstrating that all children were less accurate during the incongruent condition (congruent = 97.3 ± 0.7%; incongruent = 94.1 ± 1.9%). Additionally, there was a main effect of group (P < .001), indicating that the children with CP were less accurate overall in selecting the correct response relative to the TD children (CP = 84.2 ± 4.8%; TD = 99.9 ± 0.2%). Last, there was a significant group-by-condition interaction (P = .006). Follow-up post hoc analysis showed that the TD group was slightly less accurate for the incongruent condition (incongruent = 98.4 ± 0.3%; congruent = 99.0 ± 0.3%; P = .04), there was a trend for the children with CP to be less accurate for the incongruent condition (incongruent = 84.9 ± 5.1%; congruent = 93.8 ± 1.8%; P = .06). Last, there was a significant correlation between overall accuracy (collapsed across conditions) and MACS levels within the CP group (ρ = −0.77, P = .003), indicating reduced accuracy in those with higher MACS levels.
The analysis of reaction time revealed a significant condition effect (P < .001), which is consistent with the well-established “flanker effect” indicating that all of the children took longer to respond during the incongruent compared to the congruent condition (congruent = 770.8 ± 40.1 ms; incongruent = 830.4 ± 40.3 ms). Additionally, there was a main effect of group (P < .001), signifying that the children with CP had slower reaction times relative to the TD group across the respective conditions (CP = 1102.3 ± 94.2 ms; TD = 692.3 ± 23.9 ms). The group-by-condition interaction was not significant for the reaction time (P = .71), which suggests that selective attention and response competition processes did not differ by group.
Sensor Space Analysis
Time-frequency analyses were conducted across all participants and gradiometer sensors and these were examined statistically to identify the time-frequency windows of interest for follow-up beamforming analysis. These analyses revealed significant beta ERD (14-26 Hz), PMBR (14-26 Hz), and gamma ERS (68-82 Hz) responses across a large number of sensors near the contralateral sensorimotor cortex (P < .0001, corrected). For illustrative purposes, we show a group-averaged time-frequency spectrogram for the TD children and the children with CP in Figure 2, but note that the sensor-based statistics were computed by collapsing the data across the respective conditions and groups. The sensor-level statistical analyses indicated that the beta ERD began about 400 ms prior to the hand movement (0 ms) and was sustained until the 400 ms after hand movement (ie, −400 to 400 ms). Shortly after, there was a prominent PMBR that occurred around 600 ms after movement onset and lasted until 1000 ms (ie, 600-1000 ms). Last, there was a transient gamma ERS that was closely yoked to the onset of the hand movement (ie, −75 to 100 ms). Visual inspection of Figure 2 suggests that the beta ERD and PMBR were weaker in the children with CP and that the gamma ERS was much weaker.
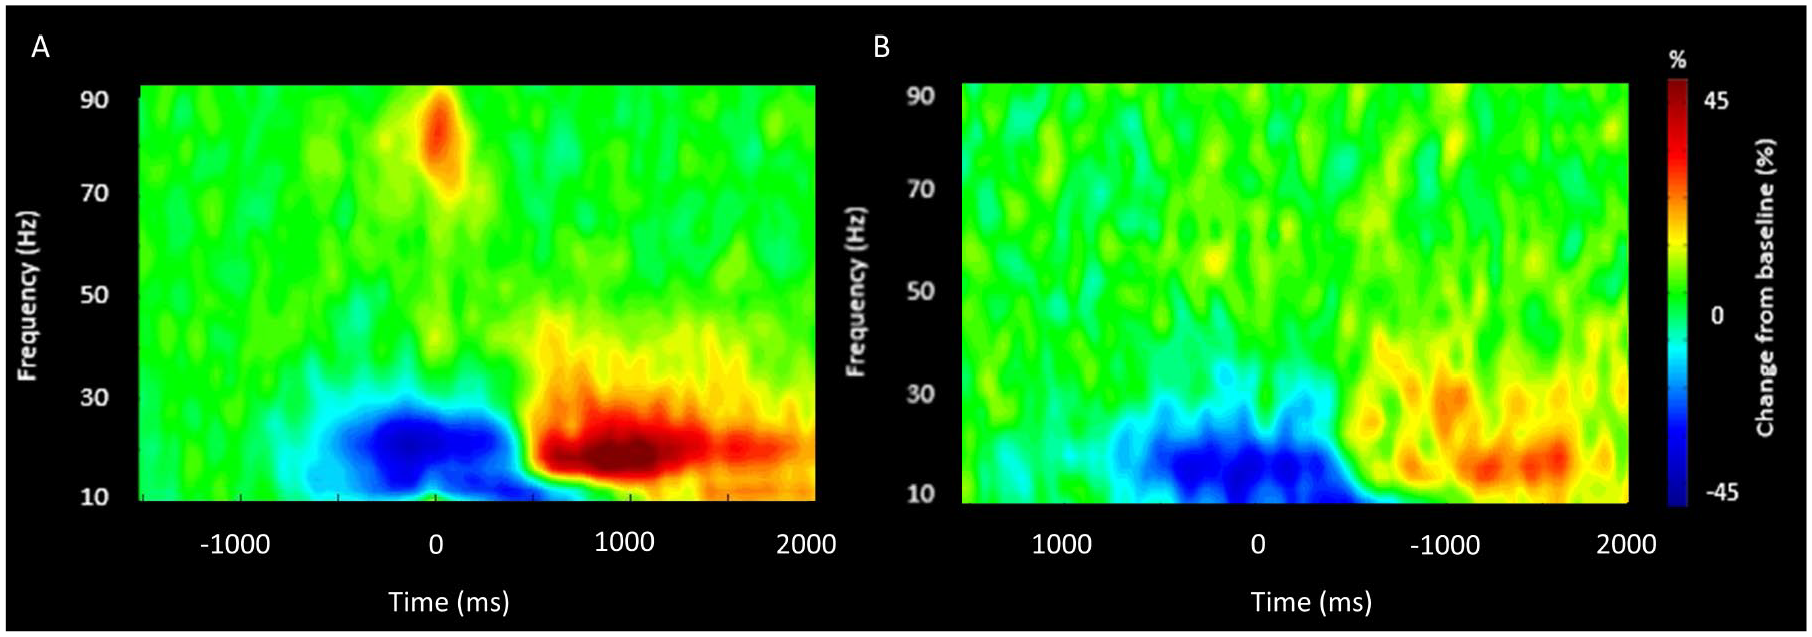
Magnetoencephalography sensor-level spectrograms. A group-averaged spectrogram from the same gradiometer sensor (located near the left motor cortex) is shown for the TD (typically developing) children (A) and the children with CP (cerebral palsy; B). Time (ms) is represented on the x-axis with 0 signifying movement onset. Relative spectral power is expressed as a percentage difference from baseline, with the color legend shown to the right of the spectrograms. As shown in the respective figures, there was a beta (14-26 Hz) event-related desynchronization (ERD) that was initiated 400 ms prior to the movement onset, which was sustained for ~400 ms after movement onset. Following movement termination, there was a notable post-movement beta rebound (PMBR) from 600 to 1000 ms. A prominent gamma (68-82 Hz) event-related synchronization (ERS) was also time locked with the onset of the hand motor action. Comparison of the spectrograms suggests that the strength of the changes in the respective neural oscillations were notably weaker in the children with CP. Note that the time-frequency windows of interest were determined statistically from the data collapsed across the 2 groups.
Cortical Gamma Oscillations
Since there were no group differences in the classic flanker reaction time effect, we collapsed across the conditions for all MEG analyses. To examine gamma, beamforming was conducted on the time period and bandwidth identified through the sensor-level spectrogram analysis (ie, −75 to 100 ms, 68-82 Hz) using a baseline period of equal duration and bandwidth (ie, −1600 to −1425 ms, 68-82 Hz). The resulting images were grand averaged across groups and this indicated that the gamma ERS was centered on the left (contralateral) primary motor cortex in the hand “knob” region (Figure 3A).
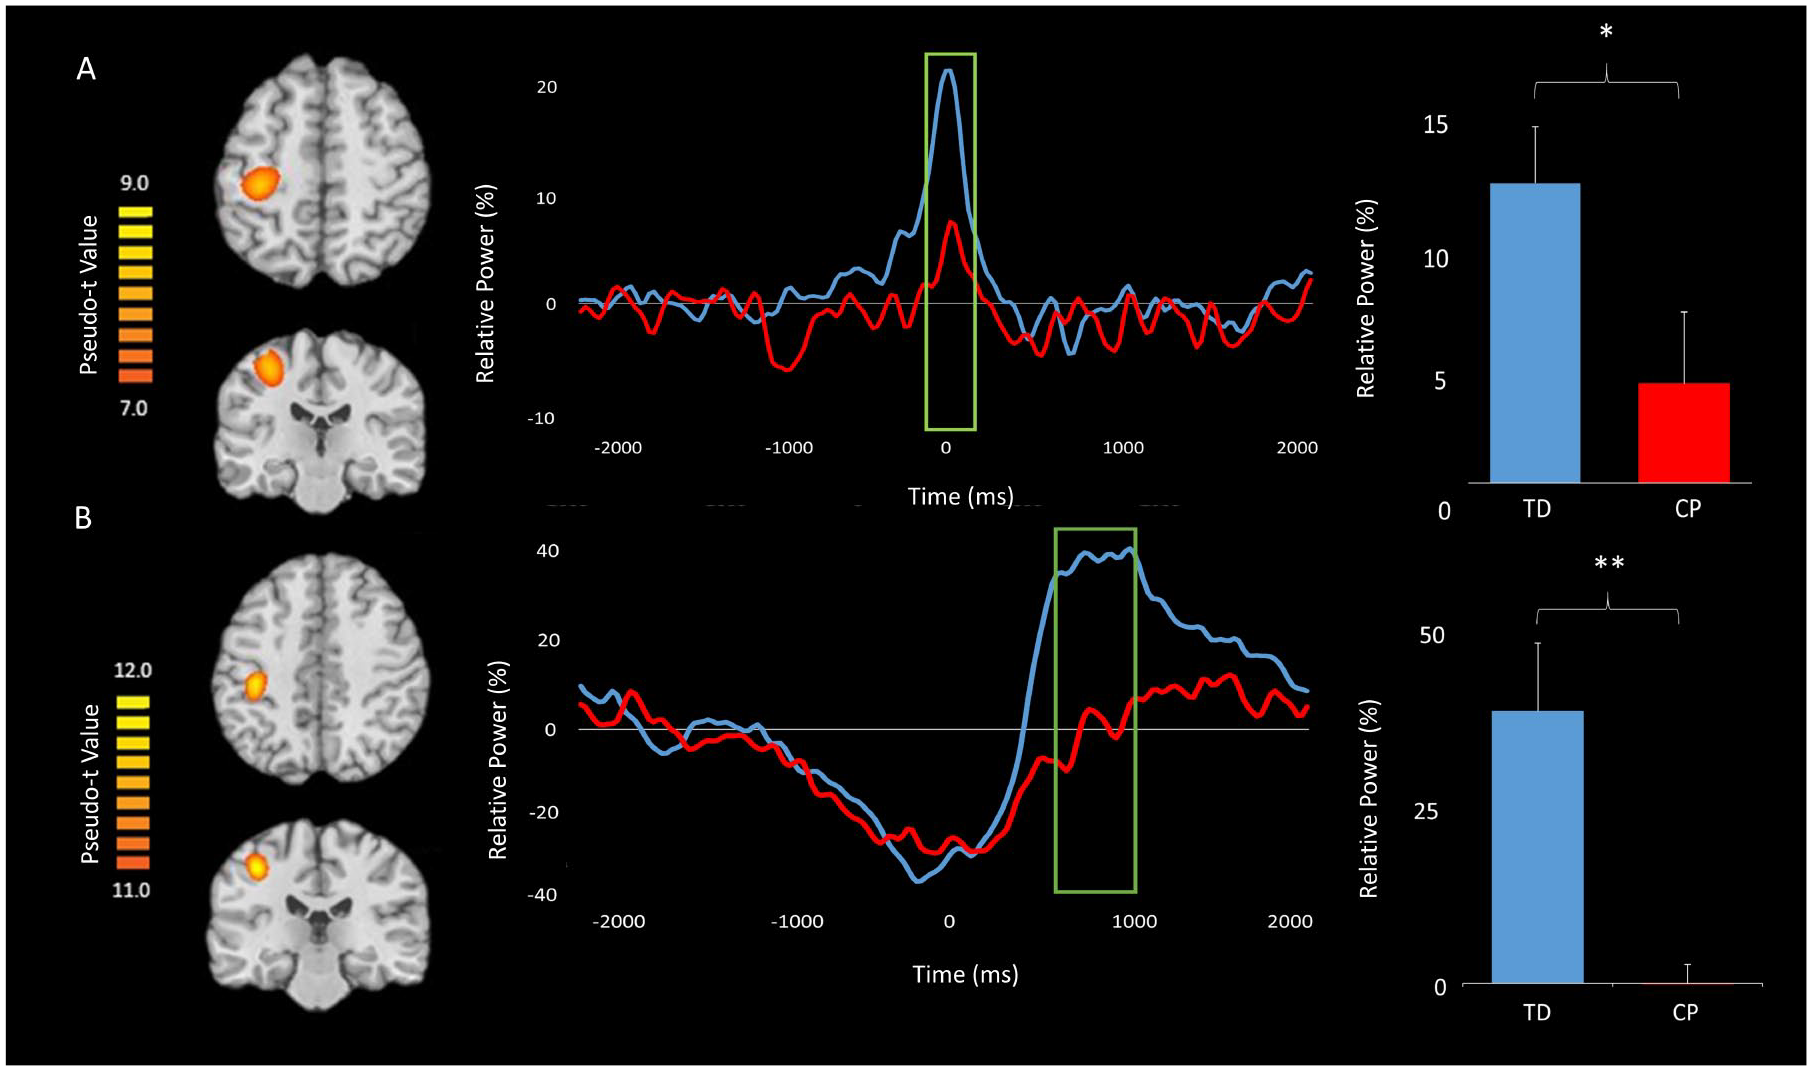
Grand-averaged pseudo-t maps across both groups for the (A) gamma event-related synchronization (ERS) and (B) post-movement beta rebound (PMBR) are shown in the left panel. These images clearly show that the gamma ERS and PMBR were generated from the motor hand knob region. The voxel time series (virtual sensors) for these cortical activations are shown in the middle panel with the gamma and PMBR windows of interest marked by a green box; the TD (typically developing) children are shown in blue and the children with CP (cerebral palsy) are shown in red. For each time series, time (ms) is denoted on the x-axis, with 0 ms defined as the movement onset, and relative power (% of baseline) denoted on the y-axis. The green boxed regions indicate significant differences in relative power between groups. Average relative power values for the green boxed windows for both the TD children and children with CP are shown in the far right panel (*P < .05, **P < .01). As seen in the figure, the children with CP had a weaker gamma ERS during the −75 to 100 ms time window and a weaker PMBR during the 600 to 1000 ms time window.
To examine group differences in the gamma ERS response, virtual sensors were extracted from the peak voxel. Briefly, we identified the peak voxel by conducting an average on the output pseudo-t values from the beamforming analysis over all participants for the response of interest. We selected the voxel with the highest pseudo-t value in the peak cluster for virtual sensor extraction. The virtual sensors were extracted by applying the sensor weighting matrix derived through the forward computation to the preprocessed signal vector.44-46 Once the virtual sensors were extracted, they were transformed into the time-frequency domain and averaged across the passband of interest (68-82 Hz) to create a time series of the gamma envelope. These time series were averaged across the group and are plotted in Figure 3A. Visual inspection of these neural time courses suggest that the dynamics are similar across groups, but that the amplitude of the response throughout the time window of interest was much weaker in the children with CP compared with the TD children. The average relative power was extracted from the gamma ERS response window described above. These values were then examined using a 2-sample t test, which revealed that the children with CP had a weaker gamma ERS compared with the TD children (P = .04).
Cortical Beta Oscillations
Beamforming was conducted on the significant beta responses (14-26 Hz) identified in the sensor level spectrograms. Separate images were generated for the beta ERD during the motor planning (−400 to 0 ms) and execution periods (0-400 ms) using a common baseline from −1600 to −1200 ms. Additionally, images were generated for the PMBR (600-1000 ms) using the same baseline period. Consistent with the gamma analyses, we collapsed across condition for all MEG analyses since there were no group differences in the classic flanker reaction time effect.
To evaluate the beta ERD, we first computed a grand average image by collapsing across groups for the planning/execution time periods and then identified the peak voxel in this image, which was centered on the left (contralateral) primary motor cortex in the hand “knob” region. As described for the gamma oscillatory analysis, virtual sensors were extracted and transformed into the time-frequency domain and averaged across the passband of interest (14-26 Hz) to create a time series of the beta envelope. The time series were averaged across groups and the average relative power was extracted from each participant’s motor planning (−400 to 0 ms) and execution (0-400 ms) images separately, and these values were examined using a 2 × 2 mixed model ANOVA, with group (TD, CP) and time (planning, execution) as factors. There were no effects of time, group, nor a group × time interaction effect (Ps > .05).
We followed the same pipeline for the PMBR response. Virtual sensors were extracted from the peak PMBR voxel using the same methods as were applied to the gamma-frequency data,44-46 and the output was transformed into the time-frequency domain, averaged across the beta passband (14-26 Hz), and the results were then averaged for each group to create a time series of the beta envelope (Figure 3B). The average relative power for the PMBR response period for each participant was determined and utilized to conduct a 2-sample t test, which revealed that the children with CP had a significantly weaker PMBR relative to the TD children (P = .008). These time series demonstrate that the children with CP had a much weaker PMBR compared with the TD children and that this effect was largely sustained.
Motor Behavior Correlations
Pearson product-moment correlations were performed by collapsing the data from the entire group of children and both the congruent and incongruent conditions. The strength of the gamma ERS and PMBR were significantly correlated with the reaction time (gamma ERS: P = .02, r = −0.41; PMBR: P = .04, r = −0.364), indicating that the children that had a stronger gamma ERS and/or PMBR also tended to have a faster reaction time (Figure 4). Beta ERD response amplitudes were not correlated with reaction time (Ps > .05). Accuracy was not correlated with the gamma ERS, PMBR, or beta ERD response amplitudes (Ps > .05).
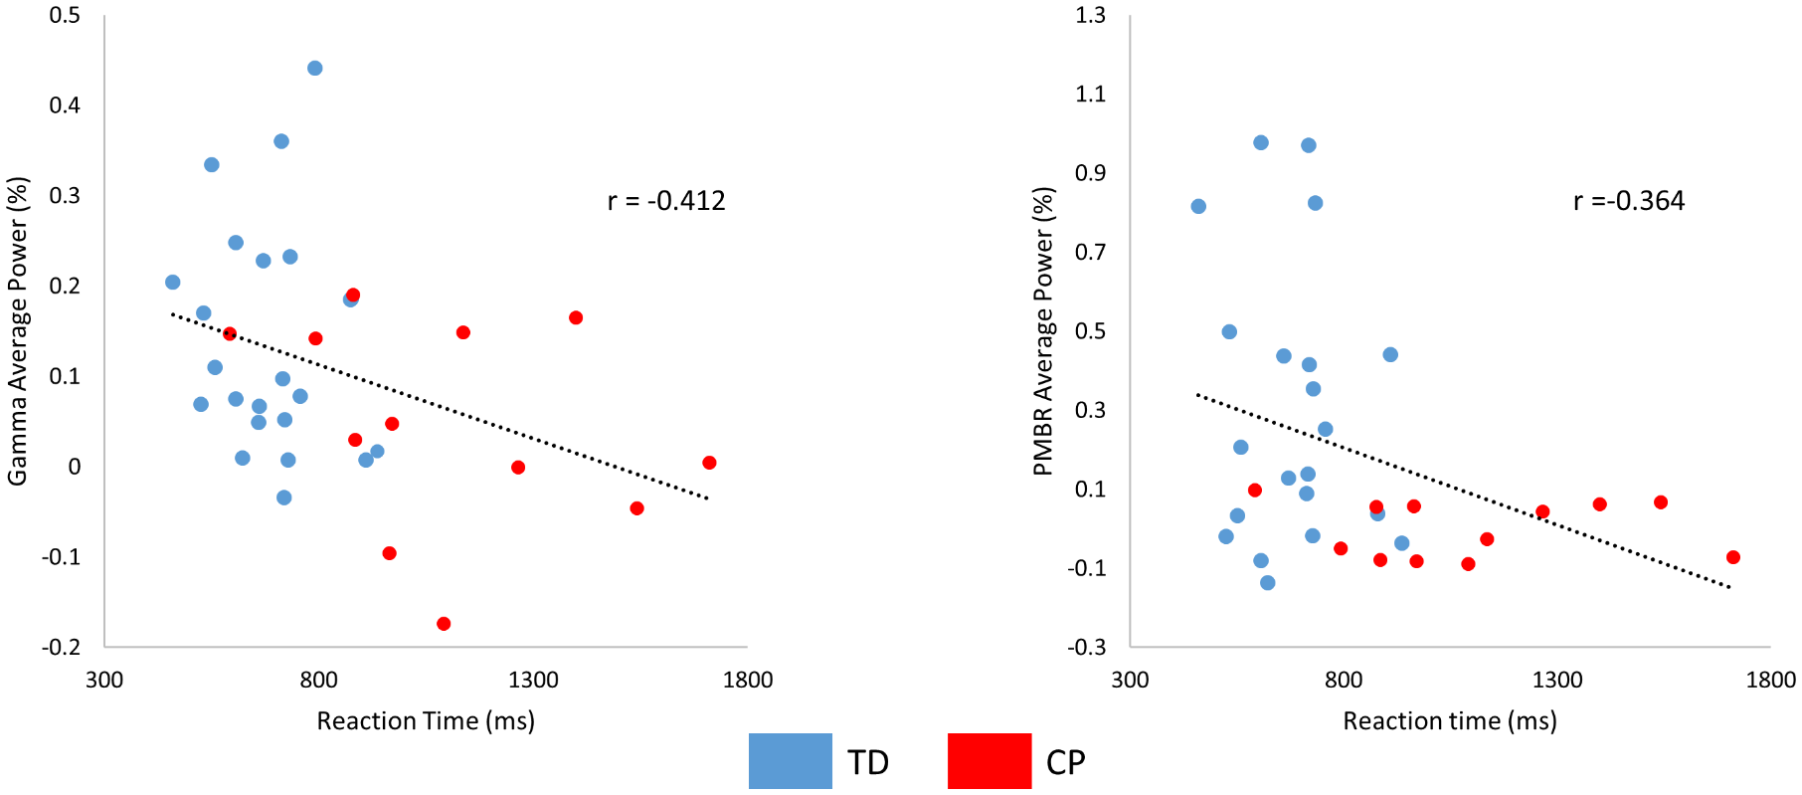
Scatterplot showing the relationship between reaction time and the strength of the (A) gamma event-related synchronization (ERS) and (B) post-movement beta rebound (PMBR) based on the results from all of the children collapsed across conditions. The negative relationship suggests that a weaker gamma ERS and PMBR was associated with a slower reaction time. All correlations were significant at (P < .05). Groups are indicated (TD = blue and CP = red).
Discussion
This study used MEG brain imaging to examine the temporal dynamics of the sensorimotor cortical oscillations in a group of children with CP and TD children as they performed a hand motor task. Overall, the children with CP were less accurate in deciding which finger motor action to produce and had slower reaction times compared with the TD children but did not differ in regard to the flanker effect suggesting that the slower reaction times were largely due to the motor system. These behavioral differences paralleled the motor-related cortical oscillations, with the children with CP displaying both a weaker gamma ERS at movement onset and a weaker PMBR on termination of the hand motor action. Further discussion of the implications of our experimental results are discussed in the following sections.
One of our key findings was that children with CP had weaker gamma oscillatory activity at movement execution relative to the TD group within the hand region of the contralateral motor cortex. This is consistent with previous research from our laboratory that has shown that children with CP have a weaker gamma ERS while performing a leg motor action task. 21 Additionally, our results suggested that a weaker gamma ERS was related to a slower reaction time. Together, these findings suggest that the impaired motor actions seen in children with CP might be partially related to the execution of the motor command. Several animal and MEG studies have provided supporting evidence that the concentration of the inhibitory γ-aminobutyric acid (GABA) neurotransmitter within the cortices appears to be linked with the strength and frequency of local gamma oscillations.23,47,48 This relationship might explain the results presented here since prior PET (positron emission tomography) studies have also shown that children with CP tend to have increased GABA receptor binding potential within the motor cortices.49,50 Based on this evidence, we suspect that the weaker gamma ERS and impaired motor actions seen in this investigation are partially a result of altered GABA activity.
Beyond gamma, this investigation is the first to show that the strength of the PMBR during a hand motor task is atypical in the children with CP. Moreover, our results also suggested that a weaker PMBR was related to a slower reaction time. It has been previously proposed that the PMBR represents afferent sensory feedback that is returned after the movement is terminated in order to assess the confidence of the estimations made from the internal model of the musculoskeletal system dynamics.26-28 Based on this premise, the weaker PMBR may suggest that the children with CP are less confident of the selected hand motor actions. We presume that this reduced certainty may be related to the aberrant somatosensory cortical processing often seen in children with CP.31,51-55 Alternatively, other MEG research has shown that larger and faster muscular force production results in a stronger PMBR. 30 Thus, it is also plausible that the diminished PMBR might reflect the lower muscular force output often seen for the hand motor actions produced by children with CP.56,57
In contrast to the gamma ERS and PMBR responses, the beta ERD during the motor planning and execution stages did not differ between the children with CP and TD children. This result was somewhat surprising given that numerous behavioral studies have reported that children with CP have difficulty planning and executing their hand motor actions.58-61 Furthermore, these results are contrary to our previous studies that have shown that the beta ERD is aberrant in children with CP during the planning and execution stages of a leg motor action.21,31 One possible explanation might be that many of the children with CP that participated in this investigation had a spastic diplegic presentation and less significant hand impairments (eg, MACS levels I-II = 9; MACS level III = 3). Alternatively, the lack of differences in the beta ERD might be related to the complexity of the tasks that the children were required to perform. In our prior investigation, the children had to generate a precise isometric force that would animate a box to match a target, while in this investigation the children generated a simple finger flexion motor action in order to press a button. It is conceivable that the button press may require less planning and online monitoring than an isometric target matching task. The lack of differences in the beta ERD during the motor planning stage also suggests that the slower reaction times seen in the children with CP might not be due to improper planning of the hand motor action.
In conclusion, our results provide new insight into the aberrant neural dynamics that are associated with the hand motor control deficits that have been well recognized in the clinical literature.58-62 This study also revealed an association between the PMBR and gamma ERS responses and reaction time (a marker of task performance). Due to this association, improvements in performance (eg, success in rehabilitation) may be associated with changes in the PMBR and gamma ERS responses. Therefore, we suggest that the PMBR and gamma ERS may possibly be utilized as metrics of performance improvement associated with successful therapeutic rehabilitation. Although this premise seems plausible, further studies are needed to assess the feasibility of using these neural oscillatory markers to guide the clinical decision process.
Supplemental Material
Supplemental_Table_1 – Supplemental material for Hand Motor Actions of Children With Cerebral Palsy Are Associated With Abnormal Sensorimotor Cortical Oscillations
Supplemental material, Supplemental_Table_1 for Hand Motor Actions of Children With Cerebral Palsy Are Associated With Abnormal Sensorimotor Cortical Oscillations by Rashelle M. Hoffman, Tony W. Wilson and Max J. Kurz in Neurorehabilitation and Neural Repair
Footnotes
Supplementary material for this article is available on the Neurorehabilitation & Neural Repair website along with the online version of the article.
Declaration of Conflicting Interests
The authors declared no potential conflicts of interest with respect to the research, authorship, and/or publication of this article.
Funding
The authors disclosed receipt of the following financial support for the research, authorship, and/or publication of this article: This work was partially supported by grants from the National Institutes of Health (1R01-HD086245), the National Science Foundation (NSF 1539067), NASA Nebraska Space Grant, and the Promotion of Doctoral Studies I Scholarship from the Foundation for Physical Therapy Research.
References
Supplementary Material
Please find the following supplemental material available below.
For Open Access articles published under a Creative Commons License, all supplemental material carries the same license as the article it is associated with.
For non-Open Access articles published, all supplemental material carries a non-exclusive license, and permission requests for re-use of supplemental material or any part of supplemental material shall be sent directly to the copyright owner as specified in the copyright notice associated with the article.