
Abstract
Background. Upper limb (UL) performance, or use, in daily life is complex and likely influenced by many factors. While the recovery trajectory of UL impairment poststroke is well documented, little is known about the recovery trajectory of sensor-measured UL performance in daily life early after stroke and the potential moderating role of psychosocial factors. Objective. To examine the recovery trajectory of UL performance within the first 12 weeks poststroke and characterize the potential moderating role of belief, confidence, and motivation on UL performance. Methods. This was a longitudinal, prospective cohort study quantifying UL performance and related psychosocial factors early after stroke. UL performance was quantified via bilateral, wrist-worn accelerometers over 5 assessment sessions for 24 hours. Belief, confidence, and motivation to use the paretic UL, and self-perceived barriers to UL recovery were quantified via survey. Change in 4 accelerometer variables and the moderating role of psychosocial factors was tested using hierarchical linear modeling. The relationship between self-perceived barriers and UL performance was tested via Spearman rank-order correlation analysis. Results. UL performance improved over the first 12 weeks after stroke. Belief, confidence, and motivation did not moderate UL performance over time. There was a negative relationship between UL performance and self-perceived barriers to UL recovery at week 2, which declined over time. Conclusions. Sensor-measured UL performance can improve early after stroke. Early after stroke, rehabilitation interventions may not need to directly target belief, confidence, and motivation but may instead focus on reducing self-perceived barriers to UL recovery.
Introduction
Rehabilitation services aim to reduce the long-term effects of post-stroke disability. Motor system impairments are one of the top reasons individuals are referred for rehabilitation services.1-3 Indeed, nearly 80% of individuals will experience some degree of upper limb (UL) paresis after a stroke. 4 At 6 months, 65% of individuals will have difficulty incorporating their paretic UL into daily activities.5,6 Improving UL function is a top priority for many stroke survivors.7-9 As a result, researchers have invested significant time and money establishing several efficacious, protocol-based UL interventions both early10-13 and later14,15 after stroke. Efficacy of these interventions are primarily assessed by UL impairment or capacity measures. Capacity, quantified via standardized assessments in the rehabilitation clinic or laboratory, refers to what a person is capable of doing. 16 It is often assumed in-clinic improvements in UL capacity directly translate to increased UL performance, or use, in daily life. Performance is defined by the International Classification of Functioning (ICF) Framework as what a person actually does outside of the clinic or laboratory, in the unstructured, free living environment. 16 Recent research, however, does not support this assumption when performance is directly quantified via sensors (eg, accelerometry).17-20 Instead, this emerging body of research posits that while UL capacity and UL performance are related, they are distinctly different constructs.
The paucity of studies examining change in UL performance over the first 12 weeks after stroke,17,21 when majority of UL motor recovery occurs,22,23 is problematic. Understanding how UL performance changes during this critical period of motor recovery will provide important insights into the unique trajectory of real-world UL use after stroke. Preliminary data suggest some (n = 2) individuals can improve UL performance early after stroke. 21 Compared with the chronic phase (≥6 months), UL performance may increase over the first 12 weeks due to a combination of factors unique to the early weeks poststroke: improvement in UL capacity, rehabilitation services, and less likelihood of learned nonuse. 24 These early facilitating factors likely serve as barriers in the chronic phase of UL recovery. 20 Additionally, psychosocial factors and self-perceived barriers to UL recovery may influence UL performance in daily life early after stroke but have yet to be explored.
Recent work suggests a more robust philosophy, including the substantial role of individual agency (ie, an active role through biology, belief, and self-regulatory systems), 25 in explaining the disparity between UL capacity and performance poststroke.17,18 Psychosocial factors, such as belief, confidence, and motivation may underscore improved UL performance in daily life. Belief in one’s ability to succeed in a task, despite setbacks or challenges, can profoundly influence the types of activities people choose to perform. 26 Both belief and confidence in one’s prospective ability to complete a task are key components of self-efficacy. 27 Additionally, motivation is a key psychosocial factor for motor learning 28 and behavior change 29 and may potentially moderate real world UL performance as well. Recent work reports high levels of individual belief, confidence, and motivation early after stroke. 30 An important next step is to explore the potential moderating role of these psychosocial factors on UL performance early after stroke.
Thus, the purpose of this study was to examine the recovery trajectory of sensor measured UL performance within the first 12 weeks poststroke, when majority of motor recovery and rehabilitation services occur. A secondary purpose was to characterize the relationship between UL performance and psychosocial factors related to UL performance. We specifically focused on individual belief that further UL improvement is possible, and individual confidence and motivation to use the paretic UL in daily life. A third, exploratory purpose was to examine the relationship between total self-perceived barriers to UL recovery and UL performance.
Methods
This was a longitudinal, prospective cohort study tracking UL performance and related measures over time. Potential participants admitted to a large, urban hospital were recruited via the Stroke Patient Access Core at Washington University. First-ever stroke survivors with residual UL paresis were enrolled within 2 weeks of their stroke. Participants were included in the study if the following criteria were met: (1) within 2 weeks of a first-ever ischemic or hemorrhagic stroke, confirmed with neuroimaging; (2) presence of UL motor deficits within the first 24 to 48 hours poststroke, as indicated by a National Institutes of Health Stroke Scale (NIHSS) Arm Item score of 1 to 4 or documented manual muscle test grade of <5 anywhere on the paretic UL; (3) able to follow a 2-step command, as measured by a NIHSS Command Item score of zero; and (4) anticipated return to independent living, as indicated by the acute stroke team. Participants were excluded from the study if any of the following criteria were met: (1) history of previous stroke, neurological condition, or psychiatric diagnoses; (2) presence of other comorbid conditions that may limit recovery (eg, end-stage renal disease or stage IV cancer); (3) lives more than 90 minutes from study location; and (4) currently pregnant by self-report. The Human Research Protection Office at Washington University in St Louis, Missouri, approved this study and all participants provided written informed consent.
Study participants completed 5 assessment sessions over the first 12 weeks poststroke. The assessment battery was administered by trained personnel at 2, 4, 6, 8, and 12 weeks, with each assessment session lasting 30 to 60 minutes. All study participants, to varying degrees, received rehabilitation services during this 12-week period. We did not control for the amount or type of rehabilitation services delivered to each participant in this observational study. Instead, each participant received therapy services in accordance with their overall plan of care established by the medical team. Assessments were administered in either the research lab, participants’ homes, inpatient hospital wards, or other health care facilities depending on travel abilities.
Study Assessments
UL performance in daily life was quantified via bilateral, wrist-worn accelerometers (Actigraph Link, Pensacola, FL). Accelerometry is a valid and reliable measure of UL performance in both healthy adults31,32 and adults with stroke.33-36 Briefly, accelerometers record accelerations along three axes in activity counts where 1 count = 0.001664g. Data are sampled at 30 Hz, bandpass filtered between frequencies of 0.25 and 2.5 Hz, and down-sampled into 1-second epochs (ie, activity counts) for each axis using ActiLife 6 software (Actigraph Corp, Pensacola, FL). Activity counts are combined across the 3 axes to create a single value, a vector magnitude
Participants wore the accelerometers for 24 hours at each assessment time point. The 24-hour wearing period has previously shown to accurately reflect a typical day in adults with stroke (ie, no difference between weekdays and weekends) and has high adherence rates.31,37,38 Participants were encouraged to wear the accelerometers at all times, including walking and bathing. Previous research indicates that wearing activity monitors poststroke does not result in reactivity, or an increase in activity levels because of wearing the monitor. 39 Similar to previous work,31,32,35,36 accelerometry data were uploaded, visually inspected, and processed using custom written software in MATLAB (Mathworks, Inc, Natick, MA). A threshold filter removed vector magnitude values <2, which has been previously shown to significantly reduce variability and improve reliability of the accelerometer data. 34 Four accelerometry-derived variables were included in this analysis: hours of paretic UL use, use ratio, magnitude ratio, and bilateral magnitude. These accelerometer-derived variables quantify somewhat different aspects of UL performance in daily life. Two variables, hours of paretic UL use and the use ratio (or activity ratio), quantify total duration of movement while the magnitude ratio and bilateral magnitude are second-by-second variables.
Total hours of paretic UL use is the total time, in hours, the paretic UL was active over the 24-hour recording period, as measured by summing the seconds when the activity count was ≥2. 31 On average, healthy, community-dwelling adults use their dominant UL 9.1 ± 1.9 h/d and their nondominant UL 8.6 ± 2.0 h/d. 31 The total hours of paretic UL use are then divided by the total hours of nonparetic UL use to derive a use ratio.31,40 A use ratio value of 1 would indicate both limbs are active the same amount of time while a value of 0.5 would indicate the paretic UL was active 50% of the time the nonparetic UL was active. A referent value of 0.95 ± 0.06 has been previously established in healthy, community-dwelling adults. 31 The magnitude ratio quantifies the contribution of each limb to an activity, for every second of data. The magnitude ratio value is the natural log of the paretic UL vector magnitude divided by the vector magnitude of the nonparetic UL.32,35 A magnitude ratio value of zero indicates equal contribution of both limbs to an activity. Negative magnitude ratio values represent greater use of the nonparetic UL while positive numbers represent greater paretic UL use. Previous work has established a median referent value of −0.1 (interquartile range [IQR] 0.3) in healthy adults.32,35 Last, the bilateral magnitude value is the sum of the vector magnitudes of the paretic and nonparetic UL, respectively.32,35 The bilateral magnitude is a measure of the intensity of movement, with higher numbers reflecting greater intensity. Healthy adults have a median referent bilateral magnitude value of 136.2 (IQR 36.6).32,35 The hours of paretic UL use, use ratio, and magnitude ratio are all responsive to change in UL function. 41 While not previously shown to be responsive to change, the bilateral magnitude represents intensity of movement, which may change during the early time period just after stroke.
Individual belief, confidence, and motivation to use the paretic UL was queried using a modified version of a survey developed from focus group data.7,8 The details of the survey have been previously reported. 30 Here, 2 of the 4 sections were used: sections II and III. Section II quantifies self-perceived barriers to UL recovery (eg, “not enough movement to work with” or “not interested”). Section III includes individual statements that measure belief (I believe further improvement of my [paretic] arm and hand is possible), confidence (I feel confident to do what I need to do to use my [paretic] arm and hand in everyday tasks); and motivation (I want to be able to use my [paretic] arm and hand more in everyday tasks). The individual statements are measured using a 4-point Likert-type scale (strongly agree, slightly agree, slightly disagree, and strongly disagree).
Additional Study Assessments
The Action Research Arm Test (ARAT) was used to measure UL capacity. The ARAT is a valid and reliable measure of UL capacity in adults with UL paresis.42-45 The ARAT is a 19-item assessment of grasp, grip, pinch, and gross motor function. Individual items are scored using a 0-to-3 ordinal scale (0 = unable to complete the task, 1 = partially performed, 2 = task completed but with abnormal movement pattern or >5 seconds, and 3 = performed with normal movement in <5 seconds). Individual item scores are summed, and the final score ranges from 0 to 57, with higher scores indicating better motor function. Paretic UL strength was quantified using the SAFE (shoulder abduction, finger extension) score. 46 Cognitive function was screened using the Montreal Cognitive Assessment (MoCA). 47 The MoCA assesses most cognitive impairment domains commonly observed in cerebrovascular disease 48 and is more sensitive to change compared with the Mini Mental Status Exam. 48 Participant demographics were collected via questionnaire.
Statistical Analysis
All statistical analyses were completed in R (version 3.3.2), 49 an open source statistical computing program. Individual change in UL performance over the 12-week study period was tested using hierarchical linear modeling (HLM). HLM is an extension of traditional regression analysis and models individual intercepts and slopes over time in addition to modeling potential moderators of the intercepts and slopes.50,51 Group level intercepts and slopes are derived from the individual intercepts and slopes for each accelerometer variable. HLM is the preferred method for these data given it does not require the same number of assessments across participants and can account for missing data,50,51 thereby including participants with varying assessment sessions in the analysis. Our dependent variable was change over time (slope values) for each accelerometer variable. The week 2 assessment was the baseline assessment for all accelerometer variables and potential moderators of UL performance over time. The intercept value reflects group UL performance values at the week 2 assessment session.
First, we analyzed change in UL performance by testing growth curves across the entire sample with individual change trajectories nested within each participant (model 1, primary purpose). All nested models were tested using χ2 goodness-of-fit tests to identify the best-fit model. When necessary (eg, violation of normality assumption), inferences were confirmed via bootstrap analysis. Using model 1, we then tested for potential moderators of UL performance over time (secondary purpose). Individual belief, confidence, and motivation were introduced separately into the initial model to test for their potential moderating effects on both the intercept and slopes for all accelerometer variables. Participants were dichotomized into 2 categories (dummy coded), based off their responses on the 4-point Likert-type scale: strongly agree (group 1) and slightly agree/slightly disagree/strongly disagree (group 2). The decision to dichotomize this scale was 2-fold. First, participants who “strongly agree” to these questions are considered to have high, unwavering belief, confidence and motivation to use their paretic UL in daily life. Clinicians would likely not prioritize improving any of these factors with their interventions. Participants in the second category (slightly agree/slightly or strongly disagree), however, lack varying degrees of surety in their belief, confidence, and motivation. Any of these responses could potentially merit intervention in the clinic. The groups were dummy coded and those who indicated they slightly agreed/slightly or strongly disagreed (group 2) served as the reference group in each model.
An additional moderator of interest was baseline UL capacity (week 2 ARAT score). Baseline ARAT scores were grand mean centered and evaluated for their potential moderating effect on both the intercepts and slopes (ARAT × time interaction). The significant level for all HLM models was set to α < .01 due to multiple predictors across four variables. All moderators were tested separately; however, the more stringent P value was applied to reduce the likelihood of a type I error.
Last, we tested for a relationship between the total number of self-perceived barriers to recovery and UL performance using Spearman’s rank-order correlations (third purpose). The total self-perceived barriers reflects the total number of barriers (out of 13 possible) identified at each assessment. We analyzed the relationship between the use ratio and self-perceived barriers at weeks 2 and 12. The significance level for correlation analyses was set at α < .05.
Visual displays of second-by-second data from the complete 24-hour recording period were examined using density plots. 32 These density plots display the magnitude ratio (x-axis) and the bilateral magnitude (y-axis) for each assessment. Example density plots for healthy, neurologically intact adults (figure 3, Hayward et al 52 ; figure 1, Bailey et al 32 ) display several key features to consider when interpreting density plots from adults with UL paresis. First, the density plots from healthy adults are symmetrical, indicating both UL are active nearly the same amount over a 24-hour period. The rounded, bowl-like shape indicates most UL activity is of low intensity. The blue points toward the outer rims of the bowl indicate unilateral UL movement (eg, one hand is stirring a bowl while the other stabilizes). A center peak represents higher bilateral magnitude values, or more intense UL activity. The color change represents overall frequency of UL movement, with warmer colors indicating increased activity and cooler colors (blue) indicating less frequent UL activity. The color change in the center of the plot indicates majority of UL movement in a 24-hour period is bilateral (magnitude ratio = 0) and at low intensity levels (low bilateral magnitude value). The small, individual color bars on both sides of the plot represent unilateral UL movement. These characteristics are stable across neurologically intact, community-dwelling adults. 32
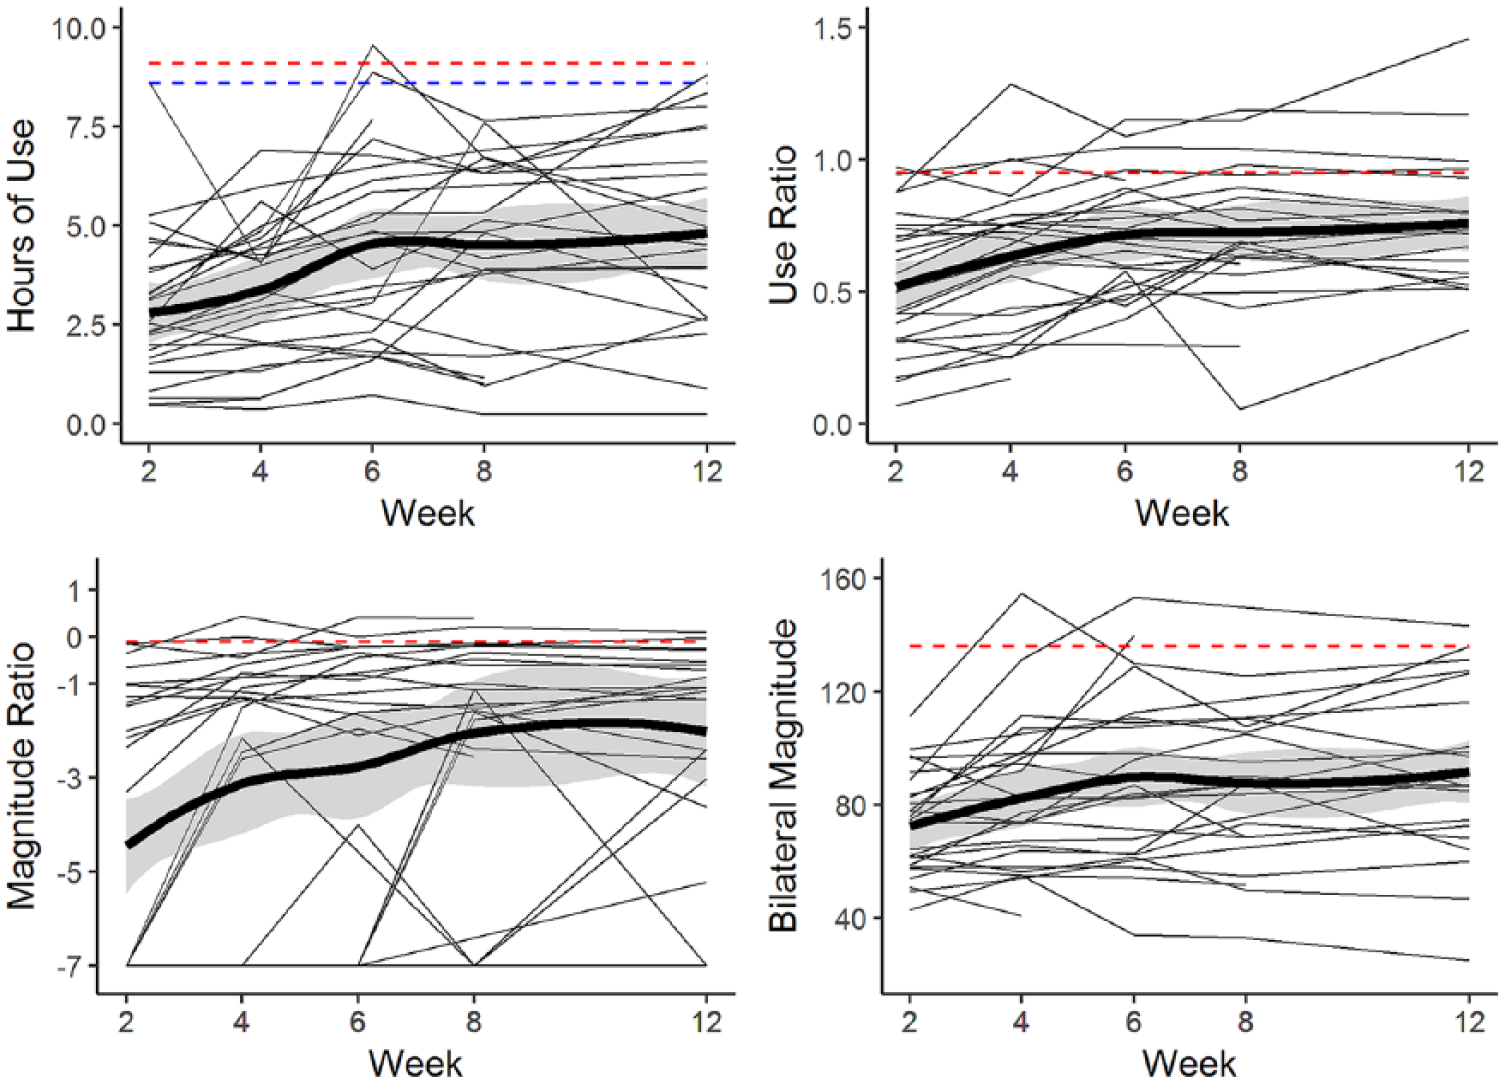
Change profiles for every participant (spaghetti plots) Each line represents a study participant with the thick black line representing the mean ± SE (standard error) shading. The dashed lines represent referent values from a healthy, community-dwelling adult population. For hours of use, the dashed red line represents referent hours for the dominant upper limb (UL) and the blue line represents referent values for the nondominant UL.
Results
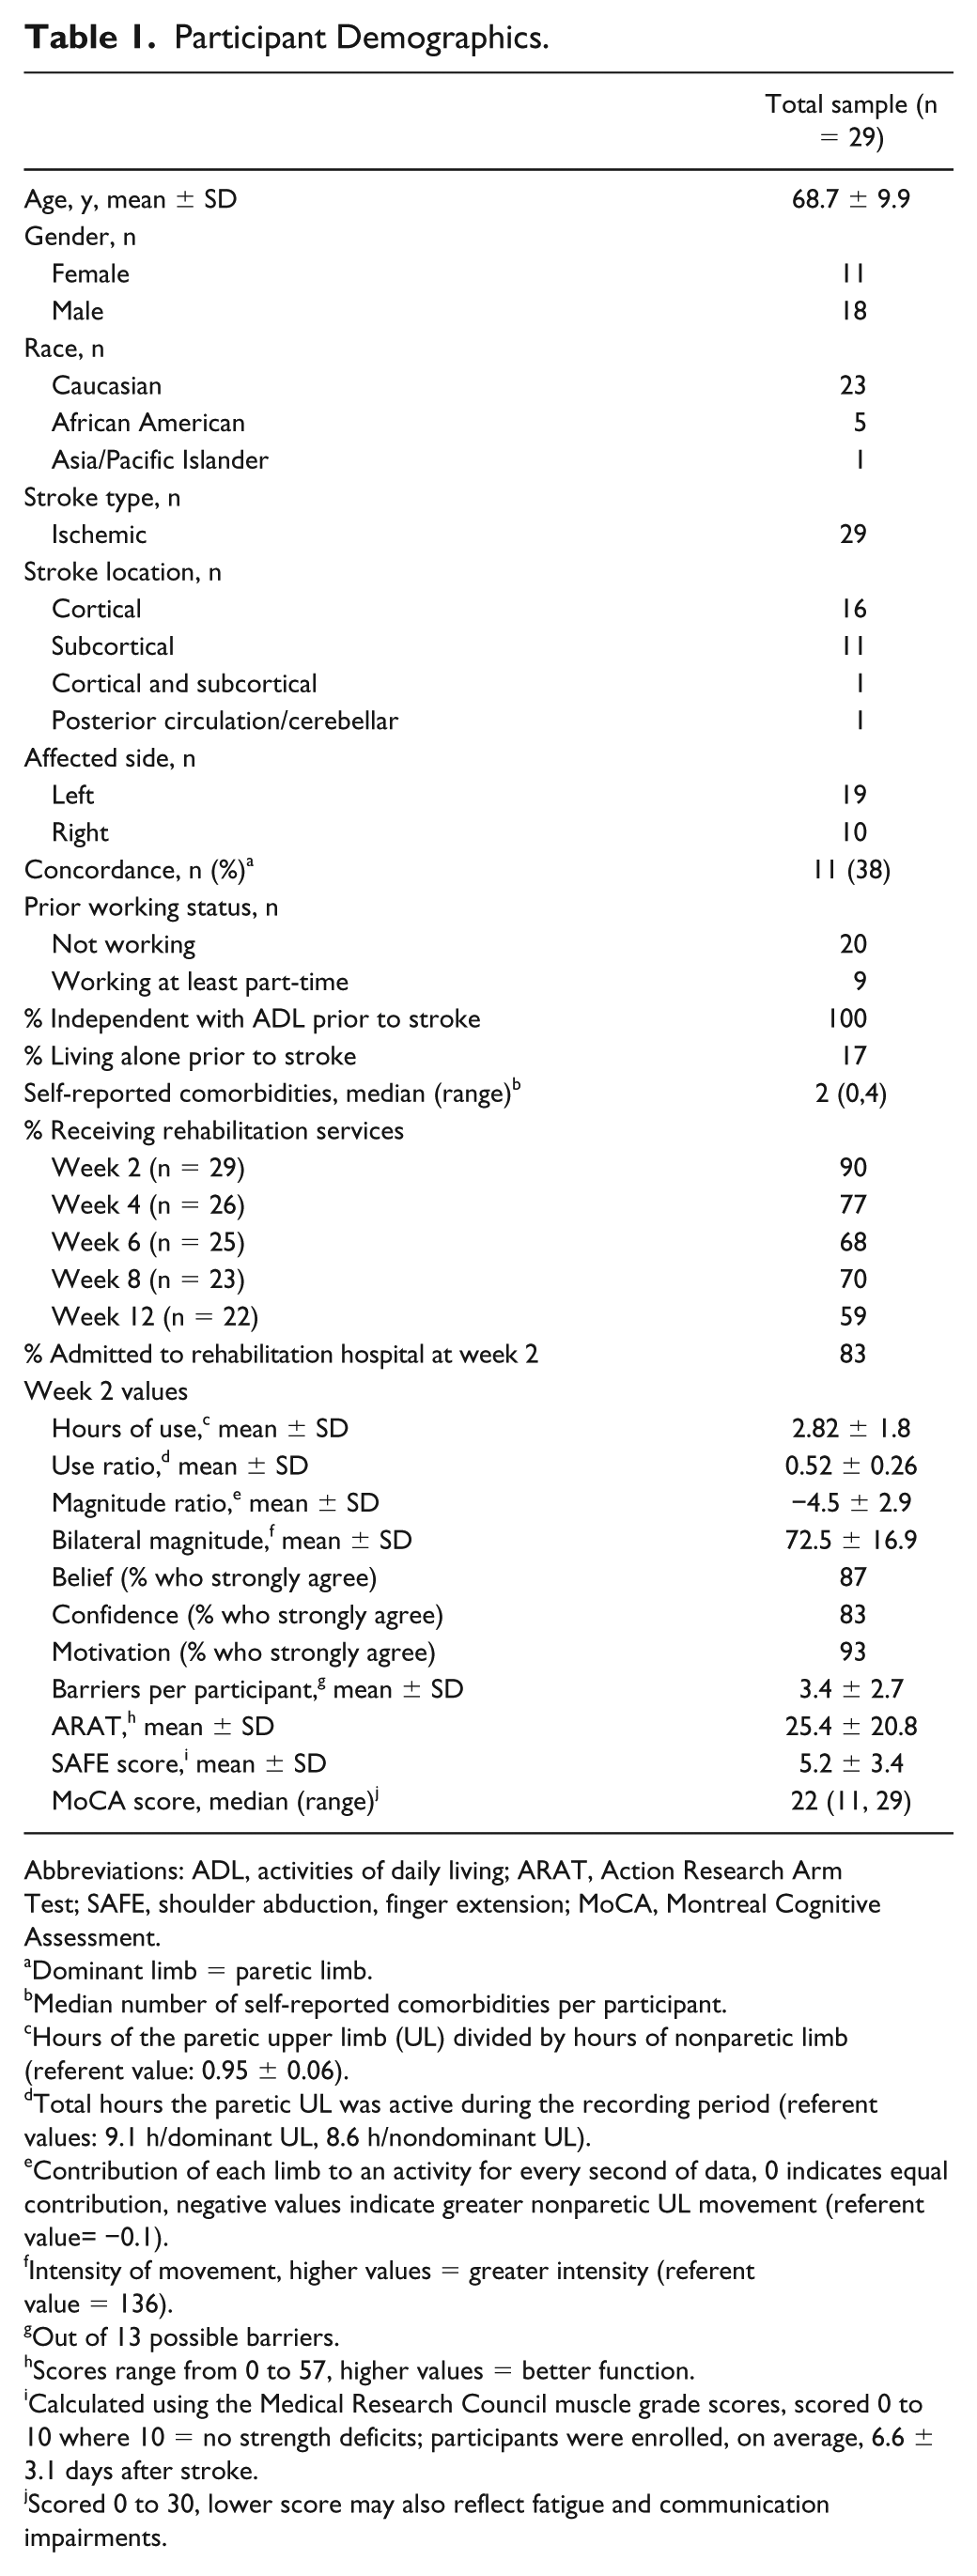
Twenty-nine of the 32 enrolled participants had available data for this analysis. The 3 excluded participants were a result of screen failure (unable to follow a 2-step command), withdrawal prior to completing the week 2 assessment, and inability to return accelerometers after each assessment. Table 1 presents key participant demographics. The majority of the sample received rehabilitation services across all 12 weeks, with 83% admitted to an inpatient rehabilitation facility at the week 2 assessment. All participants were independent with basic activities of daily living prior to their stroke. At week 2, a large percentage of the sample strongly agreed further improvement of their UL was possible (belief, 87%) and were confident (83%) and motivated (93%) to use their UL in everyday tasks and these numbers stayed high over the duration of the study. 30 Seven participants dropped out of the study between weeks 2 and 12, due to self-selected withdrawal (n = 2), second stroke (n = 1), fatal cancer diagnosis (n = 1), fall resulting in fractured UL (n = 1), and decline in medical status (n = 2). At week 2, the average ARAT score was 25.4 ± 20.8 points. At week 12, the group average was 43 ± 13.3 points, and the average within participant ARAT change was 14.6 ± 11.7 points between weeks 2 and 12. A small number of participants regained full UL capacity by week 12 (n = 6, ARAT score of 57 points), with 2 additional participants receiving 56 and 53 points, respectively.
Participant Demographics.
Abbreviations: ADL, activities of daily living; ARAT, Action Research Arm Test; SAFE, shoulder abduction, finger extension; MoCA, Montreal Cognitive Assessment.
Dominant limb = paretic limb.
Median number of self-reported comorbidities per participant.
Hours of the paretic upper limb (UL) divided by hours of nonparetic limb (referent value: 0.95 ± 0.06).
Total hours the paretic UL was active during the recording period (referent values: 9.1 h/dominant UL, 8.6 h/nondominant UL).
Contribution of each limb to an activity for every second of data, 0 indicates equal contribution, negative values indicate greater nonparetic UL movement (referent value= −0.1).
Intensity of movement, higher values = greater intensity (referent value = 136).
Out of 13 possible barriers.
Scores range from 0 to 57, higher values = better function.
Calculated using the Medical Research Council muscle grade scores, scored 0 to 10 where 10 = no strength deficits; participants were enrolled, on average, 6.6 ± 3.1 days after stroke.
Scored 0 to 30, lower score may also reflect fatigue and communication impairments.
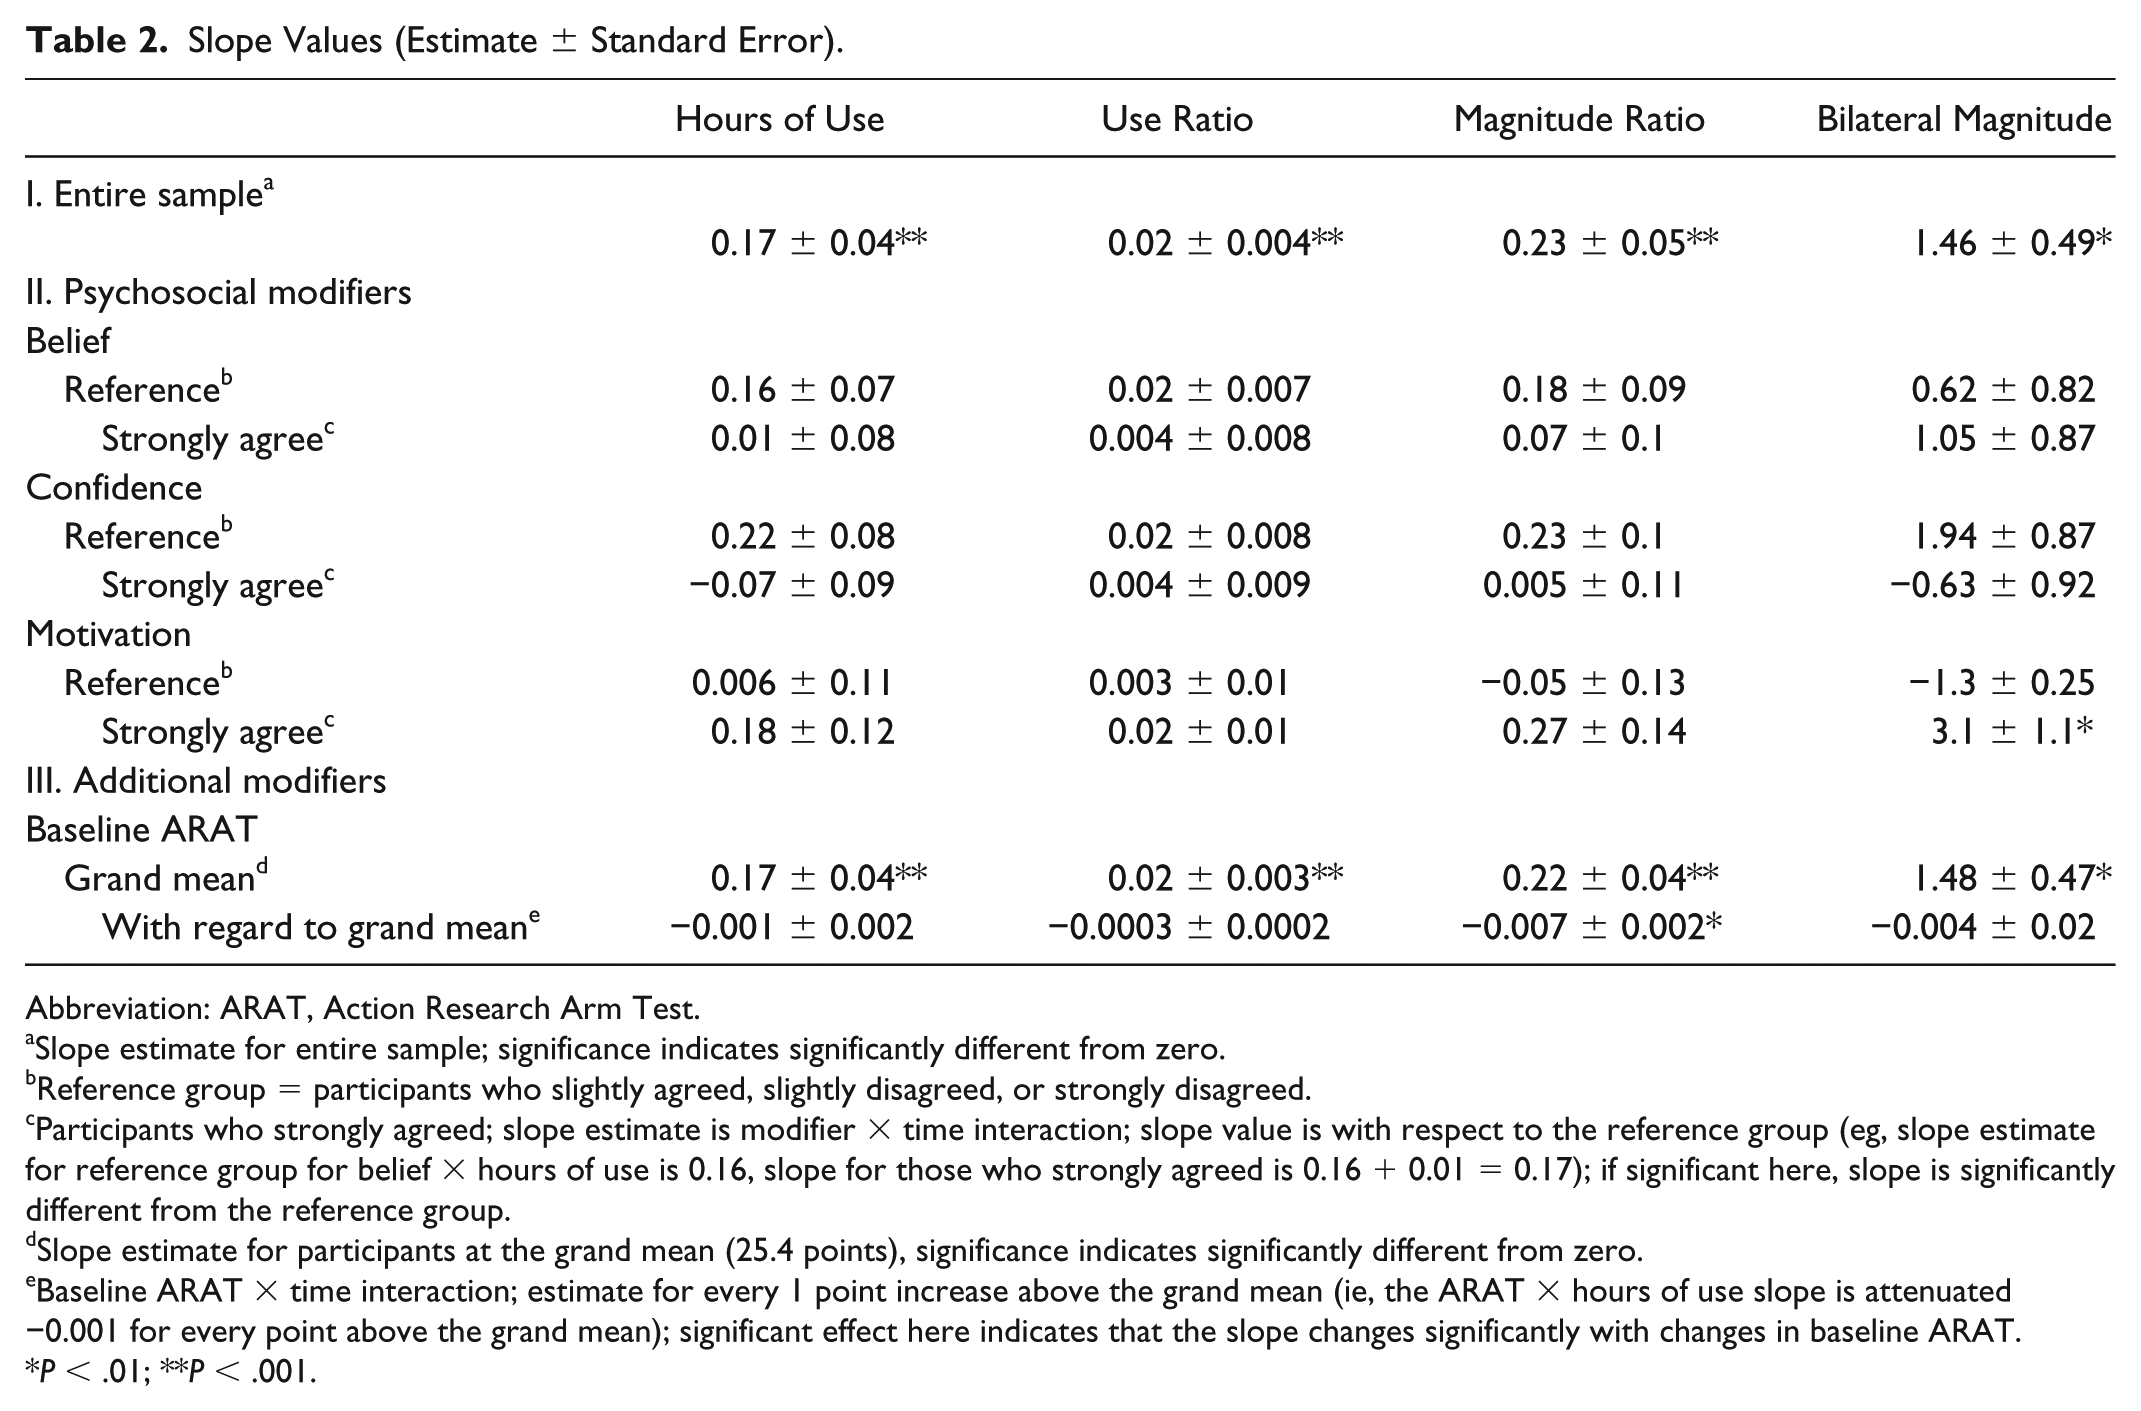
There was a significant improvement across all four accelerometer variables over the first 12 weeks poststroke (purpose 1). Section I of Table 2 reports estimated slope values for the entire sample. These slope estimates represent rate of change per 2 weeks for the study duration (eg, participants, on average, increased paretic hours of use by 0.17 hours, or approximately 10 minutes, every 2 weeks). Figure 1 presents individual change profiles (spaghetti plots) for each accelerometer variable. Despite overall group improvement, UL performance for the majority of participants was below referent values over the duration of the study. There was a high degree of variability in UL performance across participants for all 4 accelerometer variables, with some participants fluctuating between weeks, some steadily increasing, and some demonstrating little to no increase in UL performance.
Slope Values (Estimate ± Standard Error).
Abbreviation: ARAT, Action Research Arm Test.
Slope estimate for entire sample; significance indicates significantly different from zero.
Reference group = participants who slightly agreed, slightly disagreed, or strongly disagreed.
Participants who strongly agreed; slope estimate is modifier × time interaction; slope value is with respect to the reference group (eg, slope estimate for reference group for belief × hours of use is 0.16, slope for those who strongly agreed is 0.16 + 0.01 = 0.17); if significant here, slope is significantly different from the reference group.
Slope estimate for participants at the grand mean (25.4 points), significance indicates significantly different from zero.
Baseline ARAT × time interaction; estimate for every 1 point increase above the grand mean (ie, the ARAT × hours of use slope is attenuated −0.001 for every point above the grand mean); significant effect here indicates that the slope changes significantly with changes in baseline ARAT.
P < .01; **P < .001.
Belief, confidence, and motivation did not significantly modify UL performance over the first 12 weeks poststroke (Table 2, section II, purpose 2). Compared with the reference group (ie, those who slightly agreed, slightly or strongly disagreed), participants who strongly agreed further improvement of their paretic UL was possible (belief), and were both confident and motivated to use their paretic UL did not demonstrate greater change over time. The single, moderating effect of motivation on the bilateral magnitude is notable but should be interpreted with caution given the lack of moderating effect on the other accelerometer variables. Figure 2 visually displays the predicted slope values for the confidence × time interaction. There was no difference in rate of change over time (slope value) in participants who strongly agreed compared with those who slightly agreed or disagreed (reference group). Belief, confidence, and motivation did not significantly modify the intercepts of any accelerometer variable.
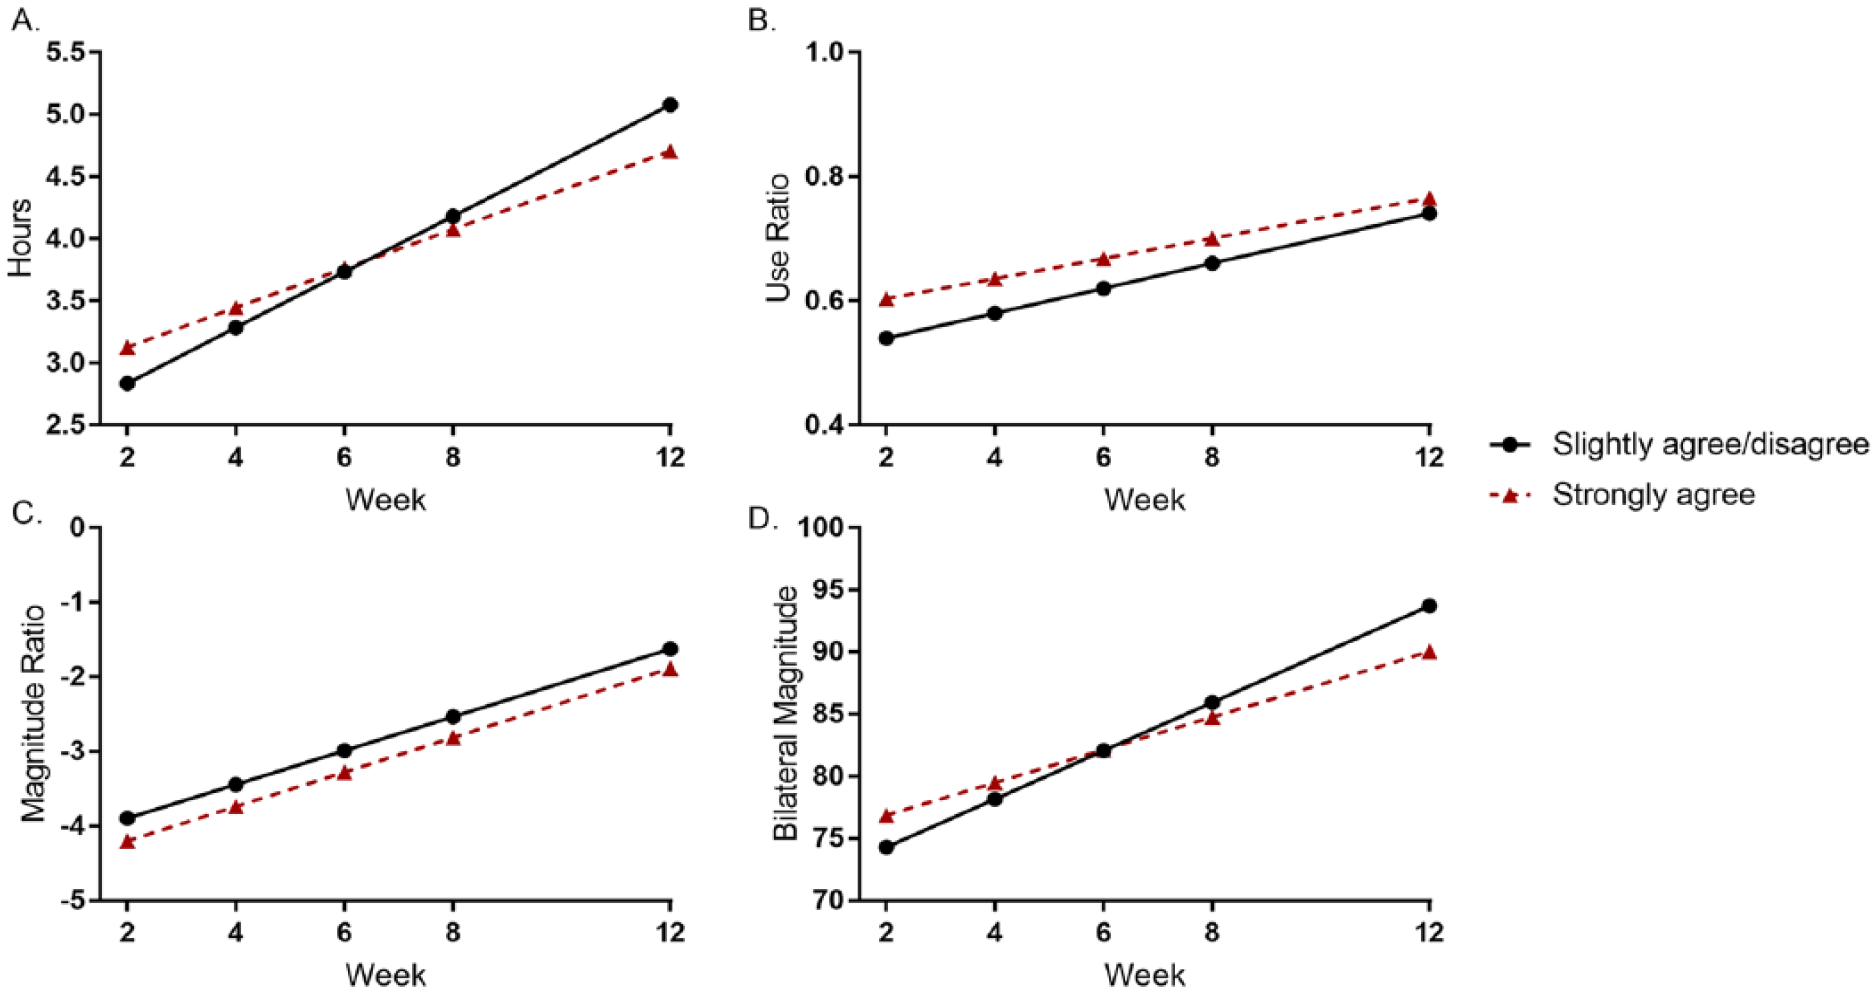
Predicted slopes for confidence × time interaction. The black line represents the reference group (participants who slightly agreed, slightly disagreed, or strongly disagreed) and the red line represents participants who strongly agreed. Participants who strongly agreed did not differ from the reference group in rate of change over time.
There was a single, significant interaction between baseline ARAT and time for the magnitude ratio (Table 2, section III). The significant interaction for the magnitude ratio indicates that for every 1-point increment above the grand mean, the slope is attenuated by 0.007. There was not a significant interaction between baseline ARAT and time for the remaining accelerometer variables. The significant slope at the grand mean indicates that participants who were at the grand mean (25.4 points) had a significant change over time. Baseline ARAT significantly modified the intercept for hours of use (intercept = 3.16 ± 0.02, modified by 0.06 ± 0.01, P < .001), use ratio (intercept = 0.57 ± 0.02, modified by 0.01 ± 0.001, P < .001), magnitude ratio (intercept = −3.90 ± 0.28, modified by 0.12 ± 0.01, P < .001), and the bilateral magnitude (intercept = 77.3 ± 2.9, modified by 0.63 ± 0.14, P < .001). This significant intercept indicates that for every point increase in baseline ARAT, the intercept increased by the modified value listed above (eg, hours intercept increased by 0.02 hours for every point above the grand mean).
For illustrative purposes, Figure 3 presents individual data for the entire sample grouped by baseline ARAT score. Participants were categorized into mild (ARAT between 46 and 57 points), moderate (ARAT between 20 and 45 points), or severe (ARAT between 0 and 19 points) UL capacity levels for better visualization. Both the intercept and attenuating slope estimates are visually represented in Figure 3. Overall, participants with higher UL capacity started with greater UL performance (intercepts) but demonstrated less change in UL performance (slopes), compared with those with less UL capacity (lower ARAT scores).
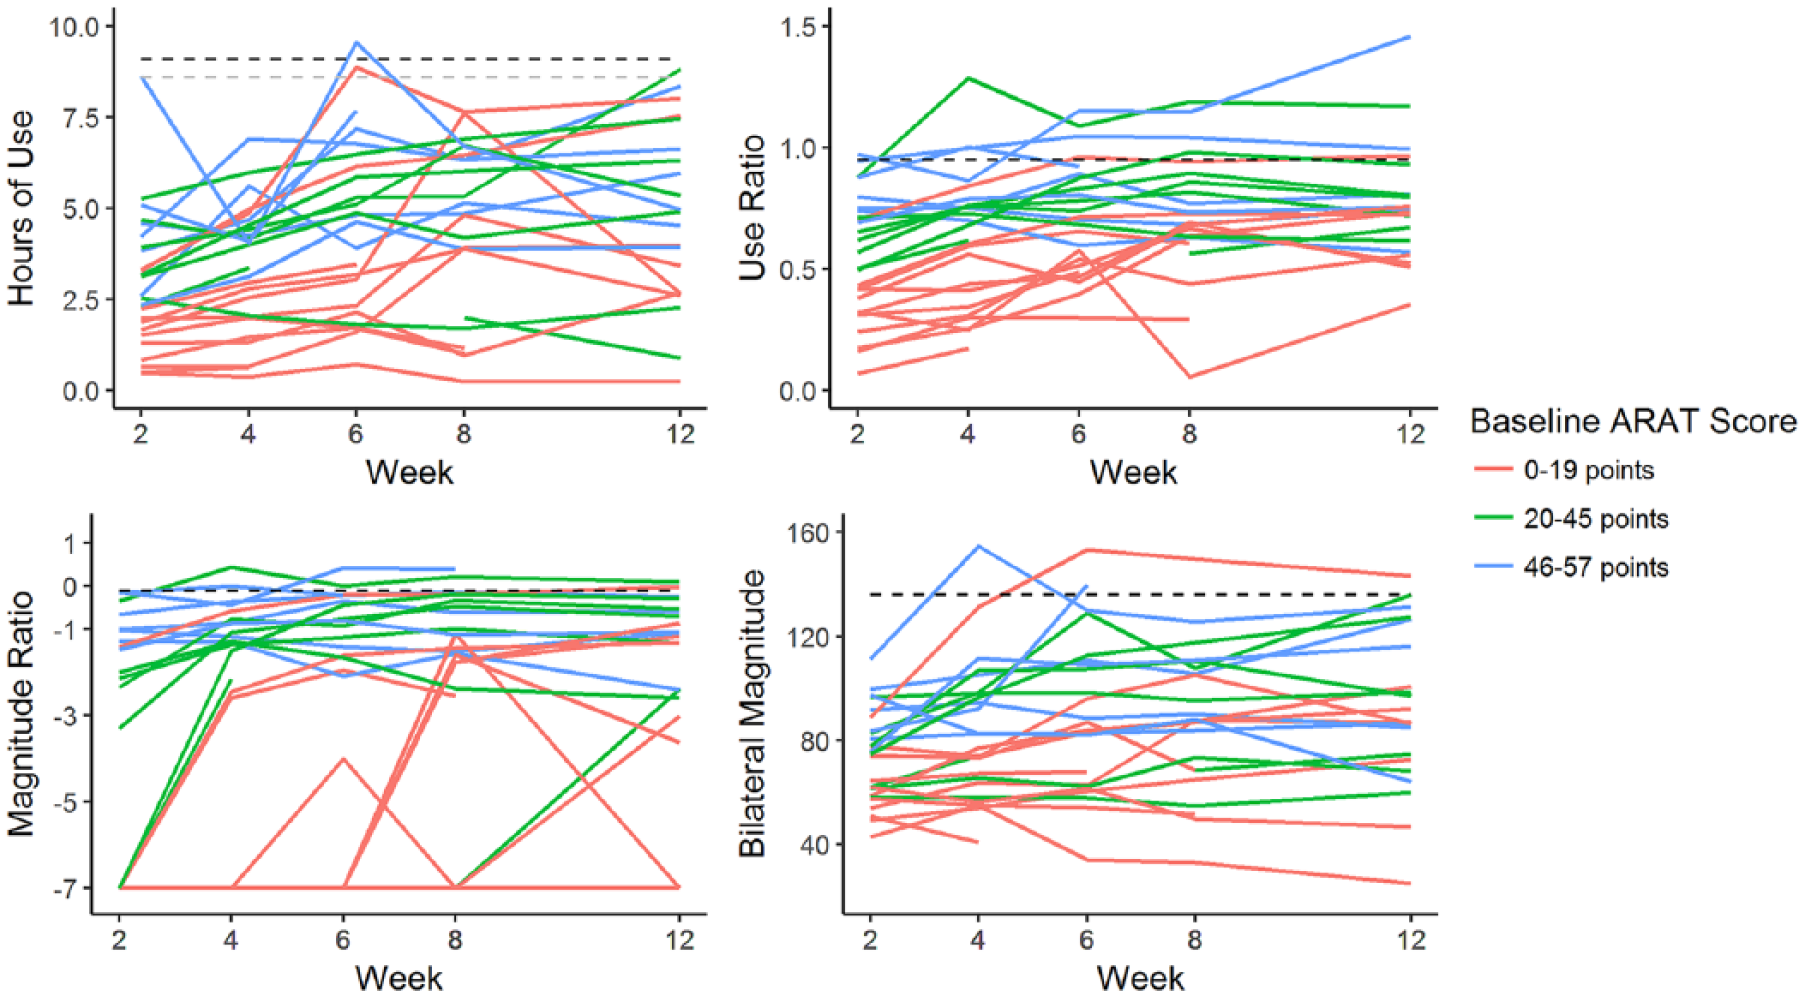
Individual change profiles by week 2 Action Research Arm Test (ARAT) score. The dashed lines represent referent values. For hours of use, the black line represents the dominant upper limb (UL) and the gray line represents the nondominant UL. Participants with limited UL capacity at week 2 (low ARAT score) demonstrated greater change compared to participants with mild UL paresis.
There was a significant, moderate, negative relationship between total self-perceived barriers and the use ratio at week 2 (ρ = −0.45, P = .01, third purpose). This relationship declined by week 12 (ρ = −0.29, P = .19), indicating total self-perceived barriers to UL recovery were associated with the use ratio early after stroke, but not later.
To better visualize changes in UL performance over time, Figure 4 presents density plots from three study participants, each with varying degrees of UL capacity at week 2. Participant 1 (Figure 4A) had severe UL paresis at week 2 (ARAT = 0 points) but consistently improved in both UL capacity and UL performance across the 12-week study period. Compared with week 2, the improved symmetry of the plot indicates an overall increase in paretic UL movement and the color change indicates increased overall UL activity (week 12). Participant 2 had moderate UL paresis at week 2 (ARAT = 24) and increased UL performance between weeks 2 and 12. Similar to participant 1, participant 2 increased paretic UL performance (symmetry) and overall UL activity (color change) over the study period. Participant 2 demonstrated increased intensity of UL movement (bilateral magnitude, center peak) over the study period as well. Last, participant 3 had mild UL paresis (ARAT = 54). Their paretic UL performance was closer to referent values, compared with the other participants, at week 2 (less asymmetry), and fell within referent ranges by week 12.
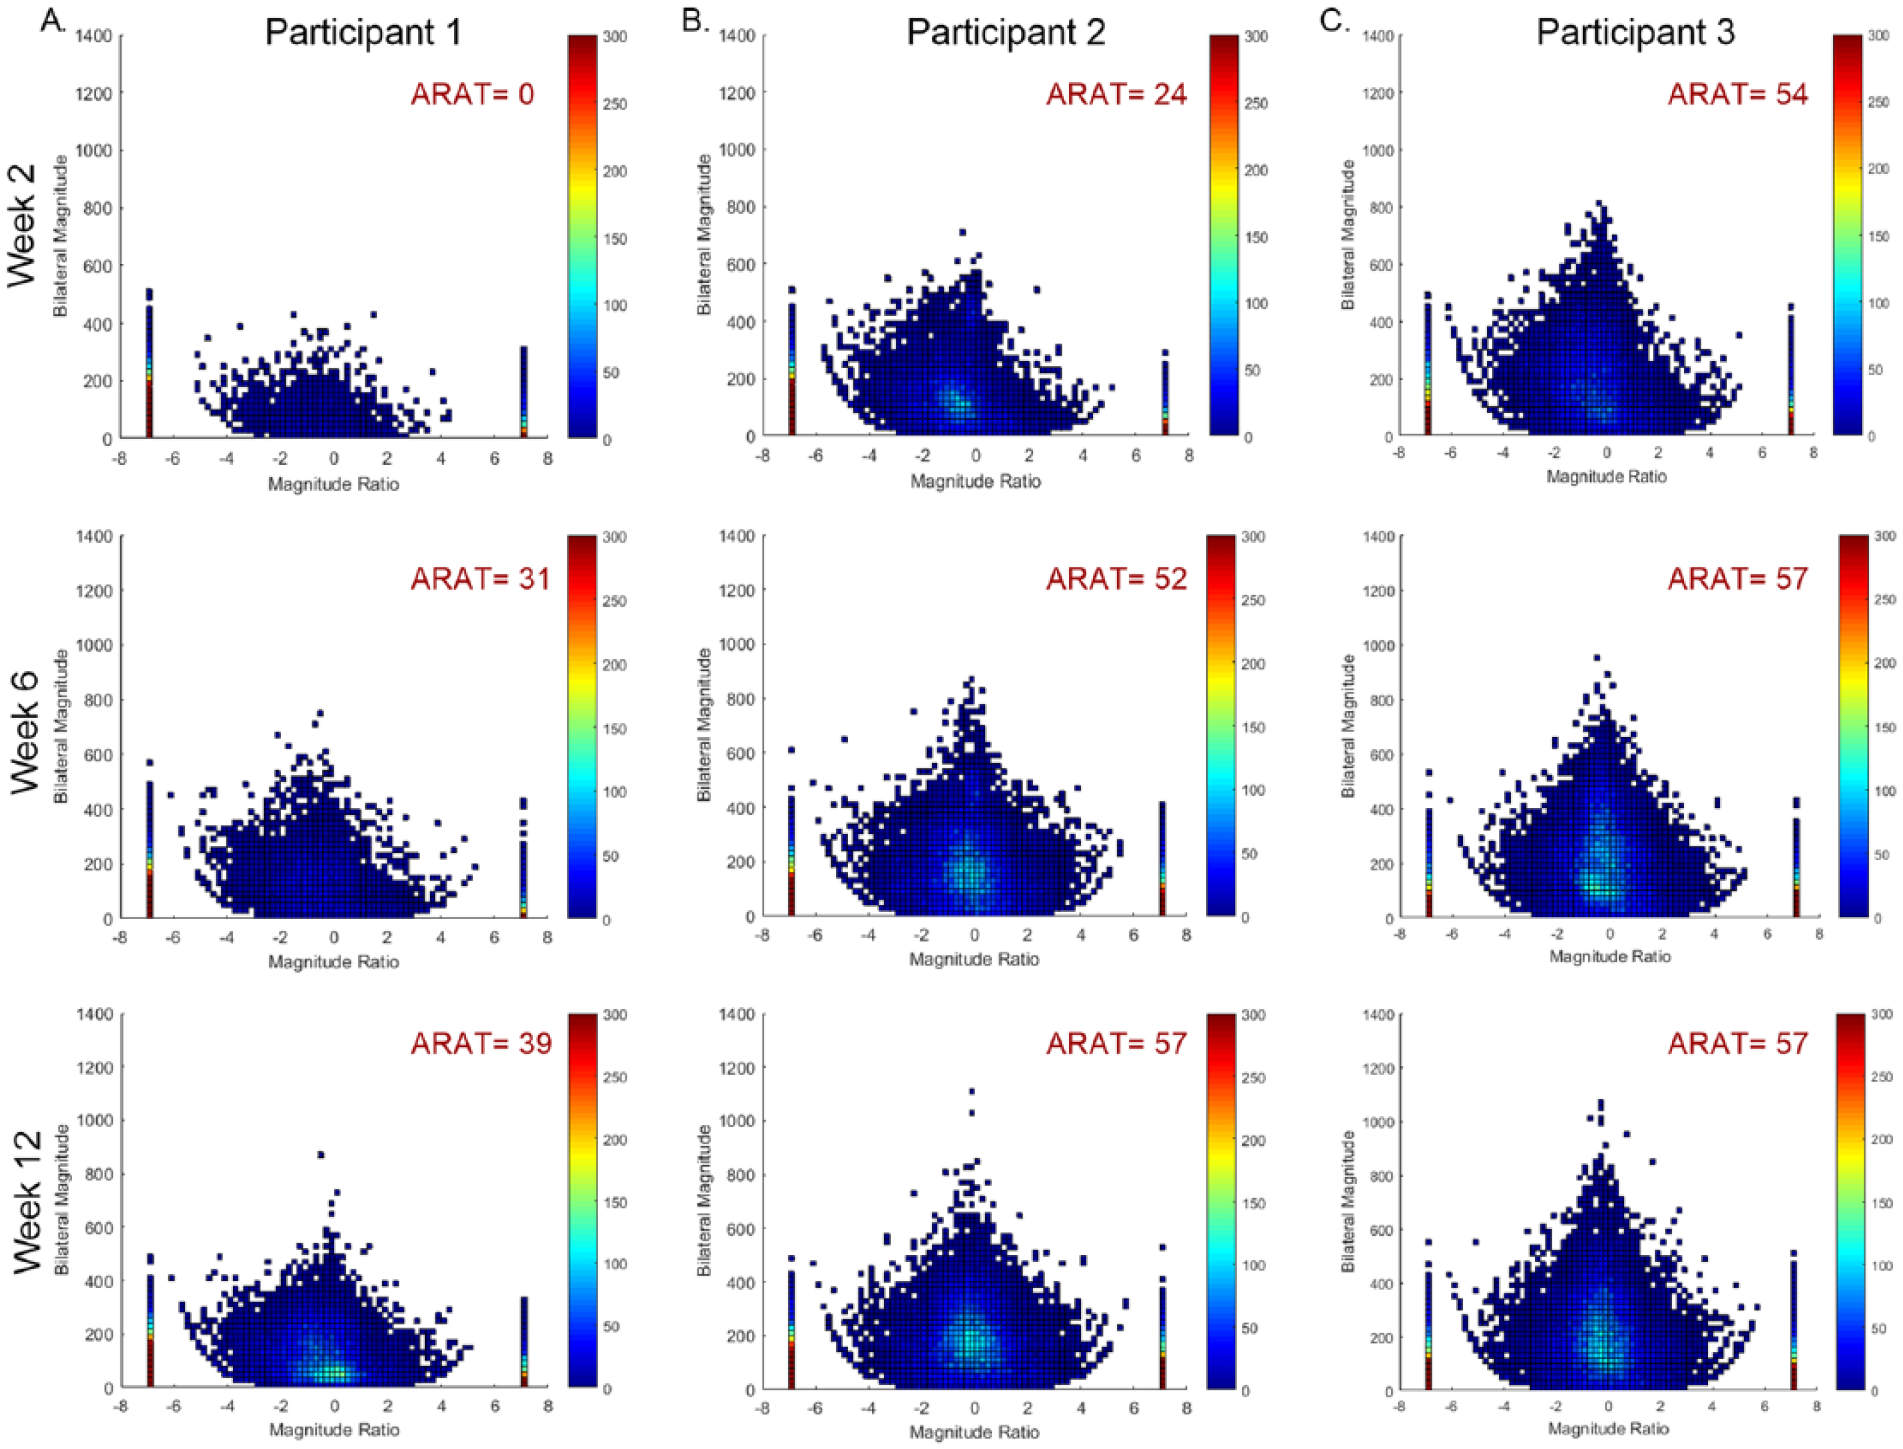
Examples of individual density plots. Density plots show upper limb (UL) activity for both ULs, for every second of data. The magnitude ratio, which quantifies the contribution of each limb to an activity, is on the x-axis. The y-axis represents the intensity of UL activity (bilateral magnitude). At week 2, participant 1 (A) had severe UL paresis, participant 2 (B) had moderate UL paresis, and participant 3 (C) had mild UL paresis. Across all 3 participants, there was an increase in UL performance from week 2 to week 12, as observed in the improved symmetry, appearance or increase of the center peak (bilateral magnitude), and improved overall frequency of UL activity (color change). For all 3 participants, the majority of UL activity occurred bilaterally (magnitude ratio value of 0) and of low intensity, consistent with healthy, neurologically intact adults.
Discussion
To our knowledge, this is the first study to examine the trajectory of sensor-measured UL performance early after a stroke and characterize the relationship between psychosocial factors, self-perceived barriers, and UL performance during the period of time when majority of UL motor recovery occurs. Our results show that UL performance can improve early after a stroke. It is well-established UL impairment and capacity spontaneously improve after stroke,22,23,53 to varying degrees, and these are the first results to suggest this is also true for sensor-measured UL performance. This increase in UL performance is not moderated by individual belief, confidence, and motivation over the first 12 weeks poststroke. Our results also showed a moderate, negative relationship between self-perceived barriers and UL performance (use ratio) 2 weeks after a stroke. By week 12, this relationship weakens. Together, these findings provide novel insight into the interconnections of UL performance in daily life and the psychosocial factors that may underscore improvements early after a stroke.
The most salient finding was that UL performance increased early after a stroke, which is in contrast to previous work in chronic stroke survivors.18,20 The participants who demonstrated the greatest increase in UL performance were more impaired at week 2 (low ARAT scores, low performance values). These participants had more room to improve, compared with participants who were mildly impaired. The increase in UL performance, however, is modest over the 12 weeks, and the group change was below referent values across all 4 accelerometer variables. Participants likely had variable UL use prior to their stroke. While ratio values are consistent in healthy adults, there is a wide range of total hours of UL use and intensity of movement.31,32 Improvements in UL performance after a stroke, therefore, may be related to prestroke activity levels.
As expected, there was a high degree of variability in the change profiles of participants. This mirrors the well-documented variability in the recovery of UL impairment and capacity.54-56 Some participants demonstrated a steady, positive increase over the duration of the study while some were more variable between weeks, and others did not change or slightly worsened. The degree of heterogeneity varied across the four accelerometer variables. This variability is likely influenced by biological, personal, environmental, and compensatory factors. Future studies could explore these factors in greater detail to possibly develop a predictive algorithm for UL performance, similar to the PREP2 algorithm for UL impairment outcomes. 53 To date, the prognostic indicators of UL performance are relatively unexplored, leaving the field vulnerable to developing a uniform, one-size-fits-all intervention that would only benefit some individuals but not others after stroke.
There are several hypotheses as to why belief, confidence, and motivation did not modify UL performance over the first 12 weeks poststroke. The lack of moderating effect is likely a result of very high levels of belief, confidence, and motivation across the study duration. 30 More than 80% of the sample strongly agreed they were motivated to use their paretic UL in daily life at every assessment session. In the event where participants did not strongly agree to these questions, they often slightly agreed. This is an intriguing finding, given the current push to incorporate motivation and confidence into clinical interventions.29,57 Early after a stroke, it appears these factors are very high and may not merit direct intervention until much later (≥6 months) in the recovery process. Efficacy expectations are vulnerable to failures, level of task difficulty, and incentives to perform, all of which vary over time and circumstance. 27 It is reasonable to presume these factors are high early after stroke because most survivors possess a strong desire to return to prestroke abilities and are willing to engage in rehabilitation efforts as a means to meet their recovery goals. Over months and years, belief, confidence, and motivation may decline and thus, become more appropriate therapy targets.
Instead, the moderate, negative relationship between self-perceived barriers to recovery and UL performance (use ratio) may be an early target of clinical intervention. In-clinic interventions could aim to reduce self-perceived barriers that may limit UL use in daily life. Some barriers are appropriate clinical targets (eg, lack of UL movement) while some are outside the scope of direct therapy intervention (eg, lack of money). However, addressing barriers, whether through an acknowledgement or a controlled intervention such as strategy training 58 could help participants increase UL use in daily life.
Several limitations influence the interpretation of these data. The small sample size, single recruitment site, and specifics of our recruitment site limit the generalizability of these findings. Our main recruiting source was one large, urban, tertiary care hospital. Because one of the inclusion criteria for this study was the potential to return to independent living, a large proportion of our participants were referred and received services at inpatient rehabilitation facilities. A larger study, quantifying UL performance over 24 weeks, is currently underway to verify these findings. This larger, longer study will allow advanced analyses to test for nonlinear change in UL performance over a 24-week period and additional moderators such as prestroke hand dominance and rehabilitation services. Prestroke hand dominance did not moderate change in UL performance in a chronic stroke cohort, but may merit investigation in a larger, early cohort. 20 An important limitation is that, belief, confidence, and motivation are complex constructs and the survey used in this study was not capable of quantifying every aspect of these factors. Currently, there are no validated UL-specific assessments that probe these factors in-depth. The survey used here was specific to the paretic UL, an important detail given that belief, confidence, and motivation are often situation specific and vary across tasks. 59 Future research could explore individual belief, confidence, and motivation using a mixed methods approach to dissect the different components of these broad constructs.
Conclusions
UL performance can improve early after a stroke. The participants who changed the most had limited UL capacity at week 2 (low baseline ARAT). Participants with higher UL capacity (high baseline ARAT scores) started with higher values, compared to those with limited UL capacity, and had a narrower range for improvement. The lack of moderating effect of individual belief, confidence, and motivation on UL performance suggests improving these factors may matter less early after stroke. These factors may vary or decline with increased time and personal circumstance. Early after stroke, clinical interventions could address self-perceived barriers to UL recovery in effort to increase overall UL performance in daily life. Understanding the time course and factors influencing UL performance will ultimately lead to a more integrated approach for optimizing UL performance outcomes, a top priority for people poststroke.
Footnotes
Declaration of Conflicting Interests
The authors declared no potential conflicts of interest with respect to the research, authorship, and/or publication of this article.
Funding
The authors disclosed receipt of the following financial support for the research, authorship, and/or publication of this article: Research reported in this publication was supported by the National Institutes of Health R01HD068290 and TL1 TR002344.