
Abstract
Background. A common assumption is that changes in upper limb (UL) capacity, or what an individual is capable of doing, translates to improved UL performance in daily life, or what an individual actually does. This assumption should be explicitly tested for individuals with UL paresis poststroke. Objective. To examine changes in UL performance after an intensive, individualized, progressive, task-specific UL intervention for individuals at least 6 months poststroke. Methods. Secondary analysis on 78 individuals with UL paresis who participated in a phase II, single-blind, randomized parallel dose-response trial. Participants were enrolled in a task-specific intervention for 8 weeks. Participants were randomized into 1 of 4 treatment groups with each group completing different amounts of UL movement practice. UL performance was assessed with bilateral, wrist-worn accelerometers once a week for 24 hours throughout the duration of the study. The 6 accelerometer variables were tested for change and the influence of potential modifiers using hierarchical linear modeling. Results. No changes in UL performance were found on any of the 6 accelerometer variables used to quantify UL performance. Neither changes in UL capacity nor the overall amount of movement practice influenced changes in UL performance. Stroke chronicity, baseline UL capacity, concordance, and ADL status significantly increased the baseline starting points but did not influence the rate of change (slopes) for participants. Conclusions. Improved motor capacity resulting from an intensive outpatient UL intervention does not appear to translate to increased UL performance outside the clinic.
Introduction
A large proportion of individuals poststroke experience significant difficulty incorporating their paretic hand into daily activities and they often identify improved upper limb (UL) function as a top rehabilitation priority.1-4 Despite the resources spent on stroke rehabilitation, individuals continue to experience ongoing barriers with performing activities at home and will ultimately discontinue 57% of their daily activities. 5 Given the importance of both upper limbs in daily activity, 6 decreased daily performance following stroke is likely influenced by UL paresis. Clinical interventions to address UL paresis are often aimed at improving UL capacity, which describes an individual’s ability to execute a task, or what a person is capable of doing, within the structured environment of a clinic or laboratory. 7 A common assumption is that improvement in UL capacity directly translates to improved UL performance. Performance describes what individuals actually do in their current environment, outside of the clinic or laboratory. 7 Recent research has emphasized the importance of measuring capacity and performance separately.8,9
Protocol-based UL motor interventions can improve capacity after stroke.10-14 Less clear is whether gains made in UL capacity, measured with standardized assessments (eg, Action Research Arm Test 15 [ARAT] and Wolf Motor Function Test 16 ), translate to improved UL performance, or use, in daily life. Several studies have reported increased UL performance when measured via self-report,10,17-19 and individuals with larger improvements in UL capacity demonstrate a positive trend toward clinically significant changes in self-reported performance.10,17,19 Self-report measures, however, are subject to many report biases including cognitive deficits20,21 and social desirability. 22 Self-report measures often rely on an individual’s ability to recall activities completed over a previous week, which may be of particular difficulty for individuals with stroke, given the high prevalence of cognitive impairment.23,24 Pilot studies that have used a more quantitative measure of UL performance, that is, accelerometry, report little to no improvement in UL performance in daily life, despite gains in UL capacity.25-27 The growing emphasis on efficient, evidence-based rehabilitation services demands an evaluation of the relationship between change in UL capacity and change in UL performance in poststroke chronic UL paresis.
In this analysis, we examine changes in performance in the community that resulted from an individualized, intensive, progressive, task-specific UL intervention. We explicitly test the assumption that increased UL capacity translates to increased UL performance using data from a recent clinical trial. 14 Finally, we examine the effect of dose (ie, amount) of task-specific movement practice on UL performance in daily life.
Methods
This article is a secondary analysis from a phase II, single-blind, randomized, parallel dose-response trial (NCT 01146379). 14 Individuals were recruited for this study via the Brain Recovery Core database and the Cognitive Rehabilitative Research Group at Washington University in St Louis, Missouri. Inclusion criteria were (1) ischemic or hemorrhagic stroke as determined by a stroke neurologist and consistent with neuroimaging; (2) time since stroke ≥6-months; (3) cognitive skills to actively participate, as indicated by scores of 0 to 1 on items 1b and 1c of the National Institutes of Health Stroke Scale (NIHSS) 28 ; (4) unilateral UL weakness, as indicated by a score of 1 to 3 on item 5 (arm item) on the NIHSS; and (5) mild-to-moderate functional motor capacity of the paretic UL, as indicated by a score of 10 to 48 on the ARAT.15,29,30 The lower limit of 10 on the ARAT meant that participants had at least some ability to open the hand, grasp and lift off the table at least 2 to 3 test items. Exclusion criteria were (1) participant unavailable for 2-month follow-up; (2) inability to follow-2-step commands; (3) psychiatric diagnoses; (4) current participation in other UL stroke treatments (eg, Botox); (5) other neurological diagnoses; (6) participants living further than 1 hour away and were unwilling to travel for assessment and treatment sessions; and (7) pregnancy. The trial was approved by the Washington University Human Research Protection Office and all participants provided informed consent.
Clinical trial details and primary outcomes have been reported. 14 Briefly, the primary aim of the trial was to determine the range of doses of UL task-specific practice that produce the largest change in UL functional capacity in individuals with chronic UL paresis. Participants were randomized into 1 of 4 groups. Dose was quantified by the total number of repetitions achieved over the course of the intervention. The 4 dose groups were: 3200 (100 repetitions/session; median = 13.6 hours of active practice), 6400 (200 repetitions/session; 20 hours of active practice), 9600 (300 repetitions/session; 26.3 hours of active practice), and individualized maximum, respectively. Participants completed four treatment sessions per week for 1-hour over 8 weeks. The individualized maximum group completed 300 repetitions per session and continued their enrollment past the 8 weeks until specific stopping criteria were met (32.8 hours of active practice). 14 The >32 hours of active practice in the individualized maximum group is likely equivalent to the total scheduled therapy time in the constraint induced movement therapy trials (≥65 hours), 31 given that active practice is often 50% or less of scheduled time.32,33 At least once every 2 weeks throughout the length of enrollment, participants were asked questions related to UL performance at home (eg, what new activities have you tried with your arm?) and new activities were identified and discussed to help facilitate increased UL performance at home. The primary outcome for the trial was the ARAT, a valid and reliable measure of UL capacity.34-36
Performance Measures
UL performance was measured with bilateral, wrist-worn accelerometers (wGT3X+, Actigraph, Pensacola, FL, USA). Accelerometers are a well-established, valid, and reliable instrument for quantifying UL performance in both non-disabled adults6,9 and individuals with stroke.9,25,37-40 Accelerometers record accelerations along 3 axes in activity counts where 1 count = 0.001664g. Data were sampled at 30 Hz and activity counts were binned into 1-second epochs for each axis using ActiLife 6 (Actigraph Corp, Pensacola, FL, USA) software. Activity counts across each axis were combined to create a single vector magnitude value (
Each participant wore bilateral, wrist accelerometers once a week for 26 hours throughout the intervention, at the conclusion of the intervention, and at the 2-month follow-up. Using custom-written software in MATLAB (Mathworks Inc, Natick, MA, USA) the first 2 hours of each recording were removed because this included the time in therapy session plus transportation home afterward. Data from the remaining 24 hours at home were used for this analysis. The single day wearing period was chosen because previous research has shown this is an adequate representation of performance in nonemployed adults6,40,41 and to ensure increased adherence to wearing the accelerometers multiple times over the course of the study. Accelerometers are waterproof so participants could wear them for all activities, including bathing. Accelerometers were worn during the night (sleeping) and those data are part of the 24 hours. Accelerometers were returned the next treatment session and the data were downloaded using ActiLife 6 software.
Six variables were calculated from the data collected over the 24 hours at home, with each variable quantifying different, but related, aspects of UL movement. Upper limb movements associated with walking were included in our calculations. Previous work has established that walking does not influence the accelerometer ratio variables in individuals poststroke. 37 Although inclusion of walking does not change the nonratio variables for neurologically intact adults, 42 it is possible that the inclusion of walking could result in an overestimation of the nonratio variables for participants with stroke. We first examined summary variables of UL performance with the use ratio (also called activity ratio) and hours of use. The use ratio is the hours of paretic limb use divided by the hours of nonparetic limb use and quantifies the contribution of the paretic limb relative to the nonparetic limb to activity. 6 Healthy, neurologically intact adults (54.3 ± 11.3 years of age, 53% female, and 84% right hand dominant, recruited to match the demographic characteristics of the trial participants) 9 have a use ratio of 0.95 ± 0.06, indicating nearly equal amounts of UL use during activities. 6 A use ratio value close or equal to 1 indicates nearly equal durations of activity from both limbs while values less than 1 indicate greater nonparetic activity and values greater than 1 would indicate more paretic UL activity. 6 The total hours of use is the total amount of time, in hours, the paretic limb was active, as measured by summing the seconds when the activity count was >2, and is a broad measure of paretic limb activity over the recording period.6,9 Neurologically intact adults use their dominant UL 9.1 ± 1.9 hours and their nondominant UL 8.6 ± 2.0 hours. 6
We then more closely examined, on a second-by-second basis, the contribution of both limbs to activity and the intensity of movement with the magnitude ratio and bilateral magnitude, respectively. The magnitude ratio is the natural log of the vector magnitude of the paretic UL divided by the vector magnitude of the nonparetic UL, and describes the contribution of both limbs to an activity for each second of data. 43 A magnitude ratio value of 0 indicates both ULs contributed equally to an activity.9,43 A negative magnitude ratio value indicates greater nonparetic UL activity and positive values indicate greater paretic UL activity. 9 Across 74 healthy, nondisabled adults, the median magnitude ratio value (median of all the seconds recorded during 24 hours) averages −0.1 (0.3), indicating that both ULs are used nearly the same amount during activity. 9 The bilateral magnitude measures the intensity of UL activity by summing the vector magnitude of the paretic UL and the nonparetic UL. 43 The bilateral magnitude distinguishes between high intensity and low intensity movements, for every second of data. Bilateral magnitude values of 0 indicate no movement and increasing values are indicative of more intense UL movement. A referent median value of 136.2 (36.6) has been established in nondisabled adults. 9 Higher values are associated with activities requiring larger, faster movements, (eg, placing boxes on an overhead shelf). 43 A low bilateral magnitude value would indicate smaller, less intense movements such as chopping vegetables. 44
The final quantification of UL performance examined only the paretic limb performance using the median paretic acceleration magnitude and the acceleration variability. The median paretic acceleration magnitude captures the individual’s median acceleration value over the entire recording period. 45 The acceleration variability is the variance of the mean acceleration value over the recording period and explains the average distance of the paretic accelerations from the mean acceleration. 45 A higher value for both the median acceleration magnitude and acceleration variability indicates more overall UL movement and greater variability of movement, respectively.
These variables can detect differences between participants with stroke 9 and, with the exception of the bilateral magnitude, are responsive to change in UL function following a task-specific intervention in individuals with UL paresis poststroke. 45 While not responsive to change in UL function, the bilateral magnitude may be a valuable variable for quantifying the intensity of bilateral movement, which is of interest to rehabilitation professionals.
Statistical Analysis
All data were analyzed in R, an open source statistical computing program. The primary analysis used hierarchical linear modeling (HLM), also referred to as linear mixed effects regression analysis,14,46 for all 6 accelerometer variables. HLM is applied to longitudinal data and is an extension of a traditional regression analysis. 46 In contrast to repeated-measures analysis of variance, HLM allows for modeling of individual intercepts and slopes over time in addition to modeling potential moderators of the intercepts and slopes. HLM does not require the same number of assessments across participants and can account for missing data, therefore participants with varying assessment sessions can still be included in the analysis. 46 Slopes for each variable were of primary interest for this analysis, as they quantify the amount of change in UL performance over the duration of the study. Preliminary analyses indicated that nonlinear model components were not necessary. The group level intercepts and slopes are derived from the individual intercepts and slopes for each variable. 46
We initially analyzed change in UL performance across the entire sample by testing growth curves for all 6 variables, with individual time trajectories nested within participants (model 1). This model allowed us to estimate the intercept and slope for the entire sample. Next, we tested the relationship between change in UL capacity (ie, ARAT score) and change in UL performance with nested models. Participants were stratified into 2 groups, those who improved ≥6 points on the ARAT and those who did not improve at least 6 points, as the 6-point value has been previously described as an estimate of the minimal clinically important difference for individuals with chronic stroke. 35 These 2 groups (dummy coded) were added to model 1 and time was nested within each participant, with individual intercepts and slopes allowed to vary randomly. We evaluated the potential influence of change in UL capacity on both the intercepts and slopes (via group × time interaction). Nested models were compared using χ2 tests and the final, best fit model for change in UL capacity was identified (model 2). Additionally, a new series of nested models were created to test for a potential dose effect on UL performance by adding treatment group (dummy coded), and a group by time interaction to model 1, yielding a final model identified as model 3. Outliers were identified using Cook’s distance and when necessary, models were reevaluated with outliers excluded. Across all levels of analysis, no outliers significantly influenced the results. We verified the inferences reported from the models using bootstrapping procedures and no differences were found as a result of this procedure. Finally, we evaluated the potential modifiers of time poststroke (months), baseline UL capacity (ie, baseline ARAT score), concordance (dominant side = affected side), and activities of daily living (ADL) status (ie, requires assistance vs independent) and their influence on change in UL performance over time for all 6 variables. Each modifier was added to Model 1 separately, and the effects of the modifier on the intercept and the slope (interaction between modifier and time) were evaluated (models 4-7). Time poststroke is widely assumed to be a predictor of UL performance, therefore we tested its influence on both initial baseline intercept and change over time (ie, slope). Baseline ARAT scores were grand mean centered across all participants. Concordance and ADL status were tested because they have previously been shown to modify UL performance in daily life. 44
Visual representations of accelerometer data were examined using density plots which display second-by-second data for the magnitude ratio (x-axis) and bilateral magnitude (y-axis) over the entire recording period, at every assessment time point. Example density plots have been previously published for healthy, neurologically intact adults (figure 1, Bailey et al 9 ; supplemental figure 1, Doman et al 27 ; figure 3, Hayward et al 47 ). There are a few salient characteristics in healthy adults that should be considered when interpreting these density plots. First, in healthy adults, plots are symmetrical, indicating that both ULs are used similarly. The bottom portion is wide, and rounded, indicating that the majority of UL movements in a 24-hour period are low intensity. Additionally, the rounded edges or rims of the bowl-like structure represent movements when one limb is moving while the other is relatively still (eg, holding a piece of paper with one hand while the other hand writes, holding a container with one hand and opening it with the other). The color bar represents the overall frequency of movement. Warmer colors (ie, red and/or orange) represent more UL movement overall, and the small color bars on both sides of the density plot are specific to the frequency of unilateral nonparetic UL movement and unilateral paretic UL movement, respectively. While specific UL movements are highly variable across individuals, 43 the salient characteristics of these graphs are highly consistent across community-dwelling, neurologically intact nondisabled adults. 9 Six examples of individual patients from the baseline data of this same cohort can be seen in figure 2 of Bailey et al. 9 Examples of how individual density plots change over time in persons with stroke can be seen in figure 4B of Hayward et al 47 and in figure 1 of Doman et al. 27
Results
Seventy-eight of the 85 participants in the trial had available data for this analysis. Of the 7 excluded participants, 4 had accelerometer recording errors, 2 withdrew from the study prior to the intervention, and 1 did not consistently wear the accelerometers for >6 hours at each assessment time point. Table 1 presents the demographic characteristics of the 78 participants and baseline values for the 6 accelerometer variables. The 6400-repetition group had low concordance (ie, fewer people reporting their dominant side was the affected side). 14 Individuals had mild to moderate levels of UL paresis at baseline and most of the participants were independent with basic activities of daily living.
Participant Demographics and Baseline Accelerometer Intercepts by Treatment Group. a
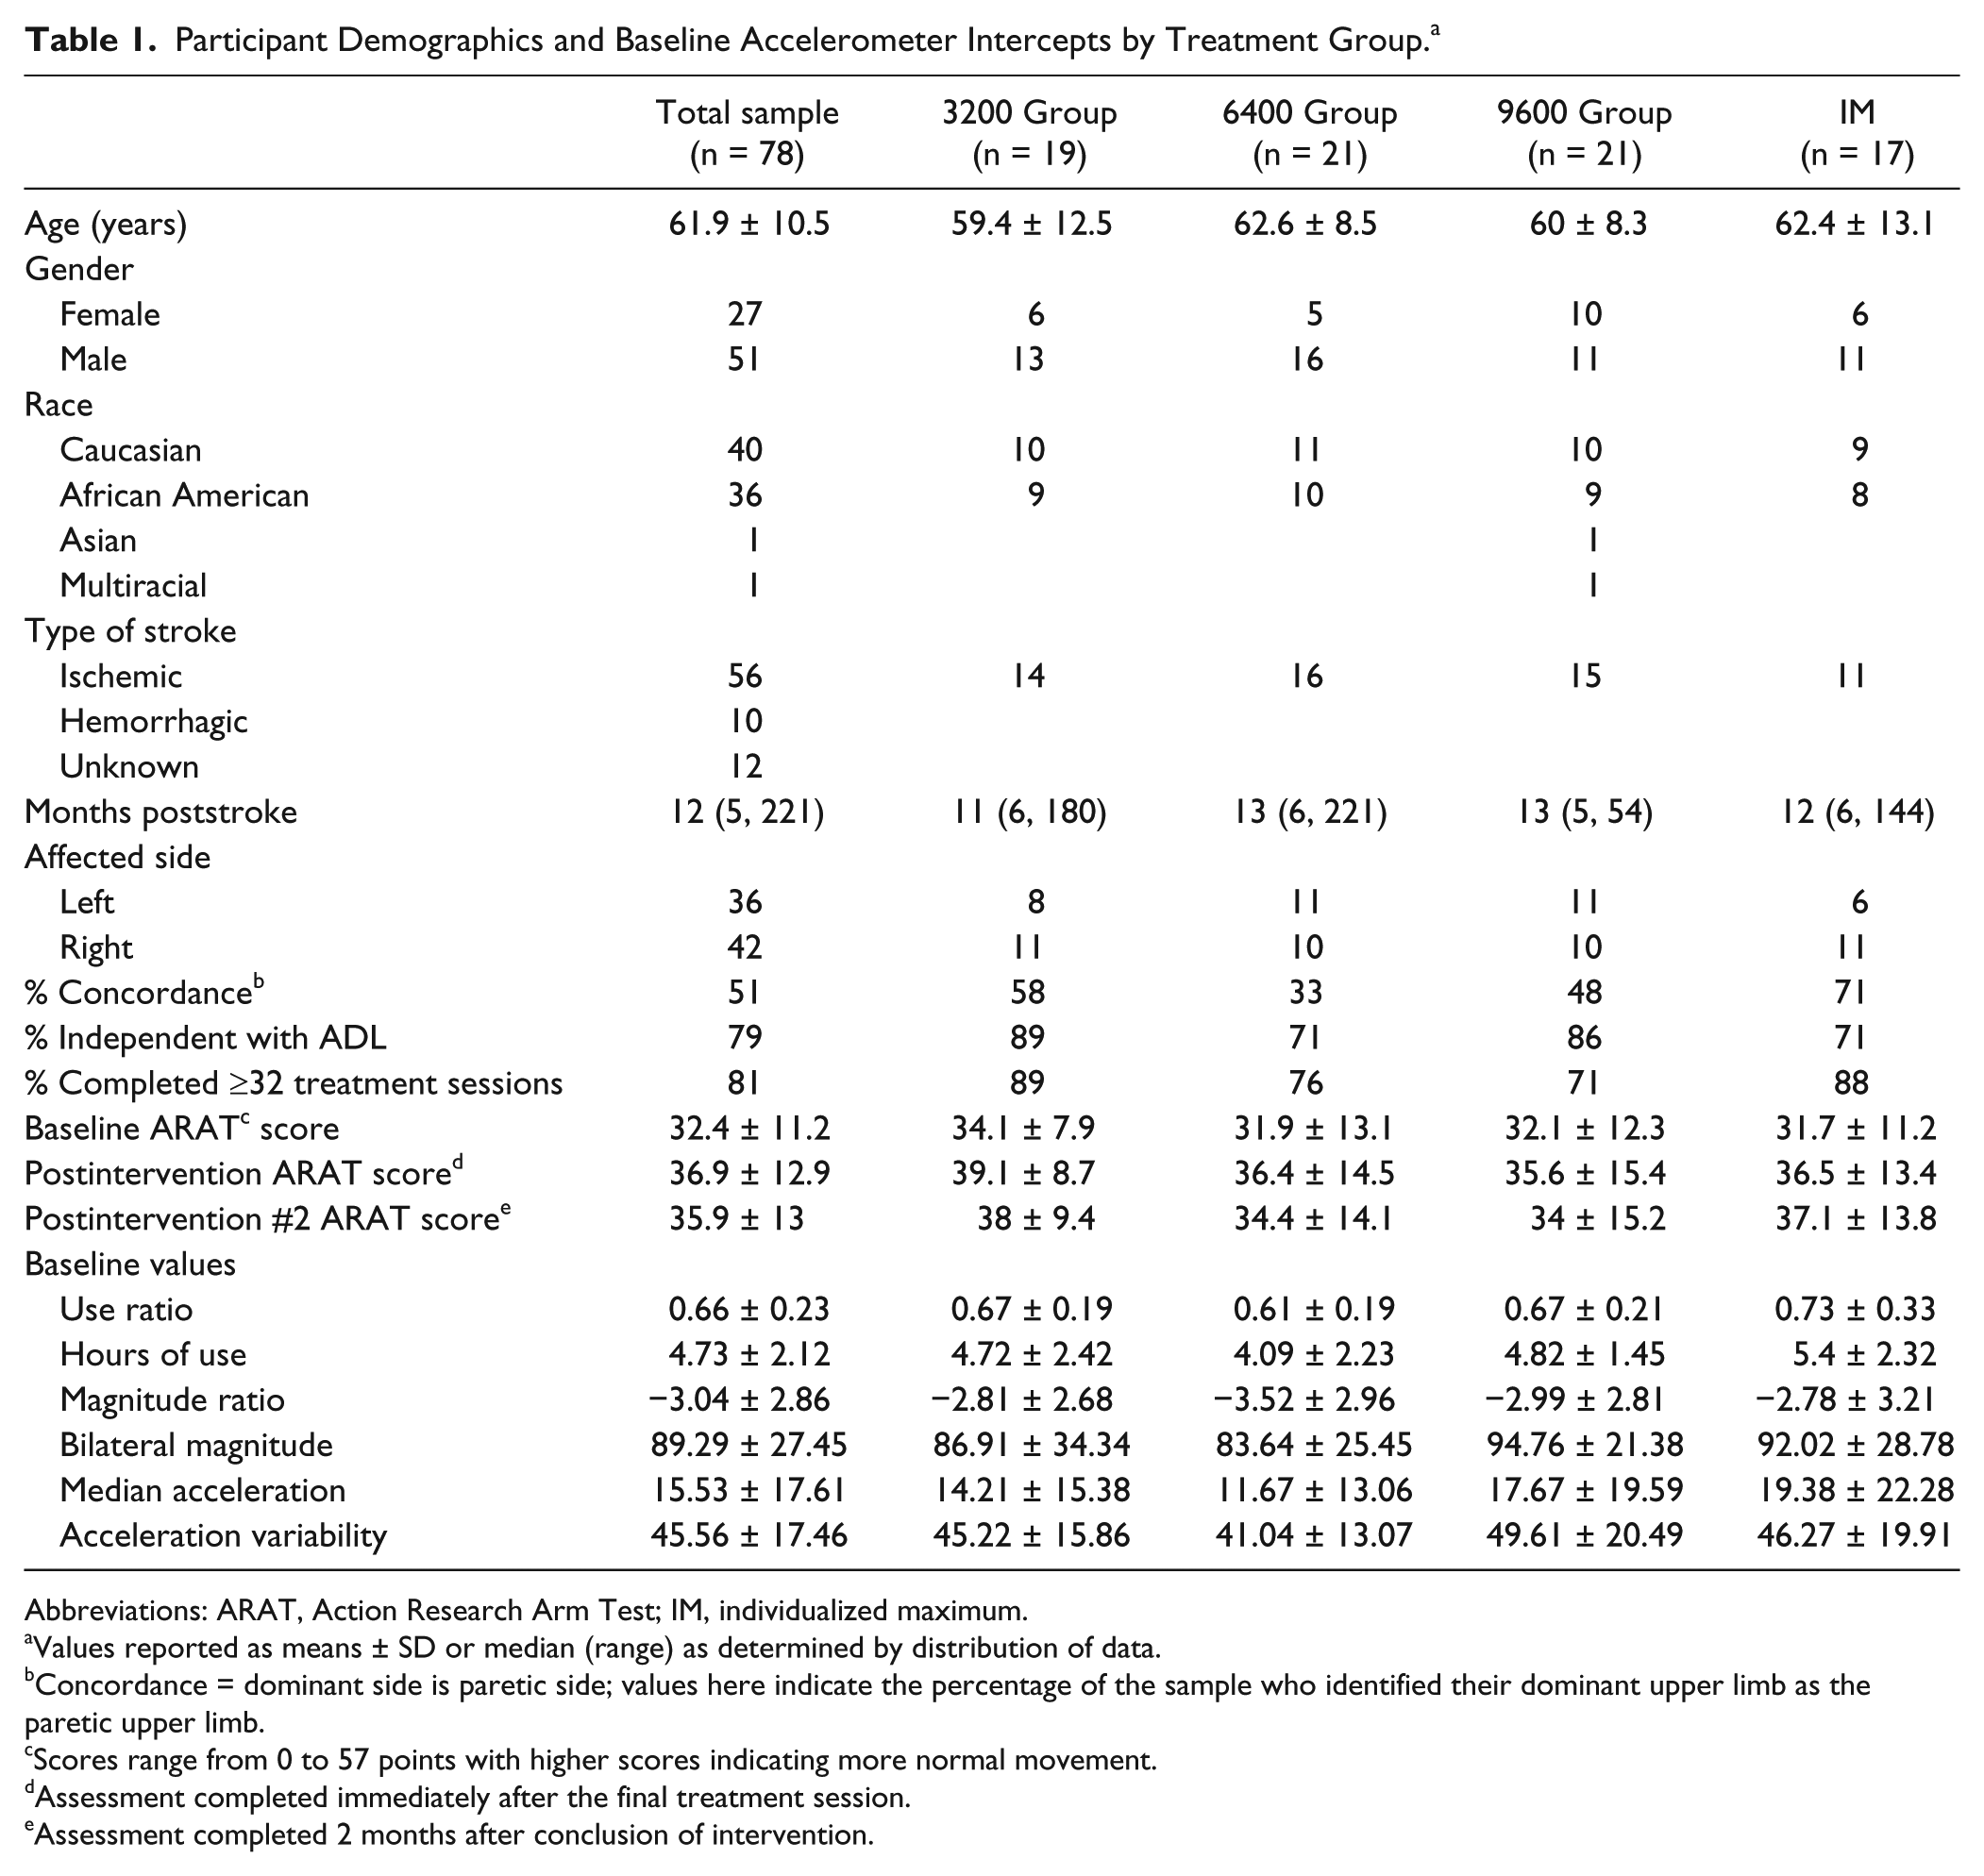
Abbreviations: ARAT, Action Research Arm Test; IM, individualized maximum.
Values reported as means ± SD or median (range) as determined by distribution of data.
Concordance = dominant side is paretic side; values here indicate the percentage of the sample who identified their dominant upper limb as the paretic upper limb.
Scores range from 0 to 57 points with higher scores indicating more normal movement.
Assessment completed immediately after the final treatment session.
Assessment completed 2 months after conclusion of intervention.
Overall, there was no change in UL performance across all 78 participants on any of the 6 accelerometer variables. The final model for 5 of the 6 variables included the linear effect of time which produced better fitting models for the use ratio (χ2 = 15.08, df = 3, P = .002), hours of paretic limb use (χ2 = 15.45, df = 3, P = .001), the magnitude ratio (χ2 = 15.08, df = 3, P = .03), median acceleration (χ2 = 10.84, df = 3, P = .01), and the acceleration variability (χ2 = 12.24, df = 3, P = .007). For the sixth variable, the bilateral magnitude, the addition of a linear effect of time was not significant (χ2 = 2.76, df = 3, P = .43), indicating that time did not increase the predictive ability of the model and was not a significant predictor of change. Time was still included in the final model to acquire a slope value for the bilateral magnitude and also test potential modifiers of the slope. Rates of change, quantified as model slopes are reported in the top row of Table 2, in units of change per week. The slopes for each accelerometer variable were not significantly different from zero.
Slopes Over Time for the Entire Sample, by Group, ARAT Change Score, and Potential Modifiers. a
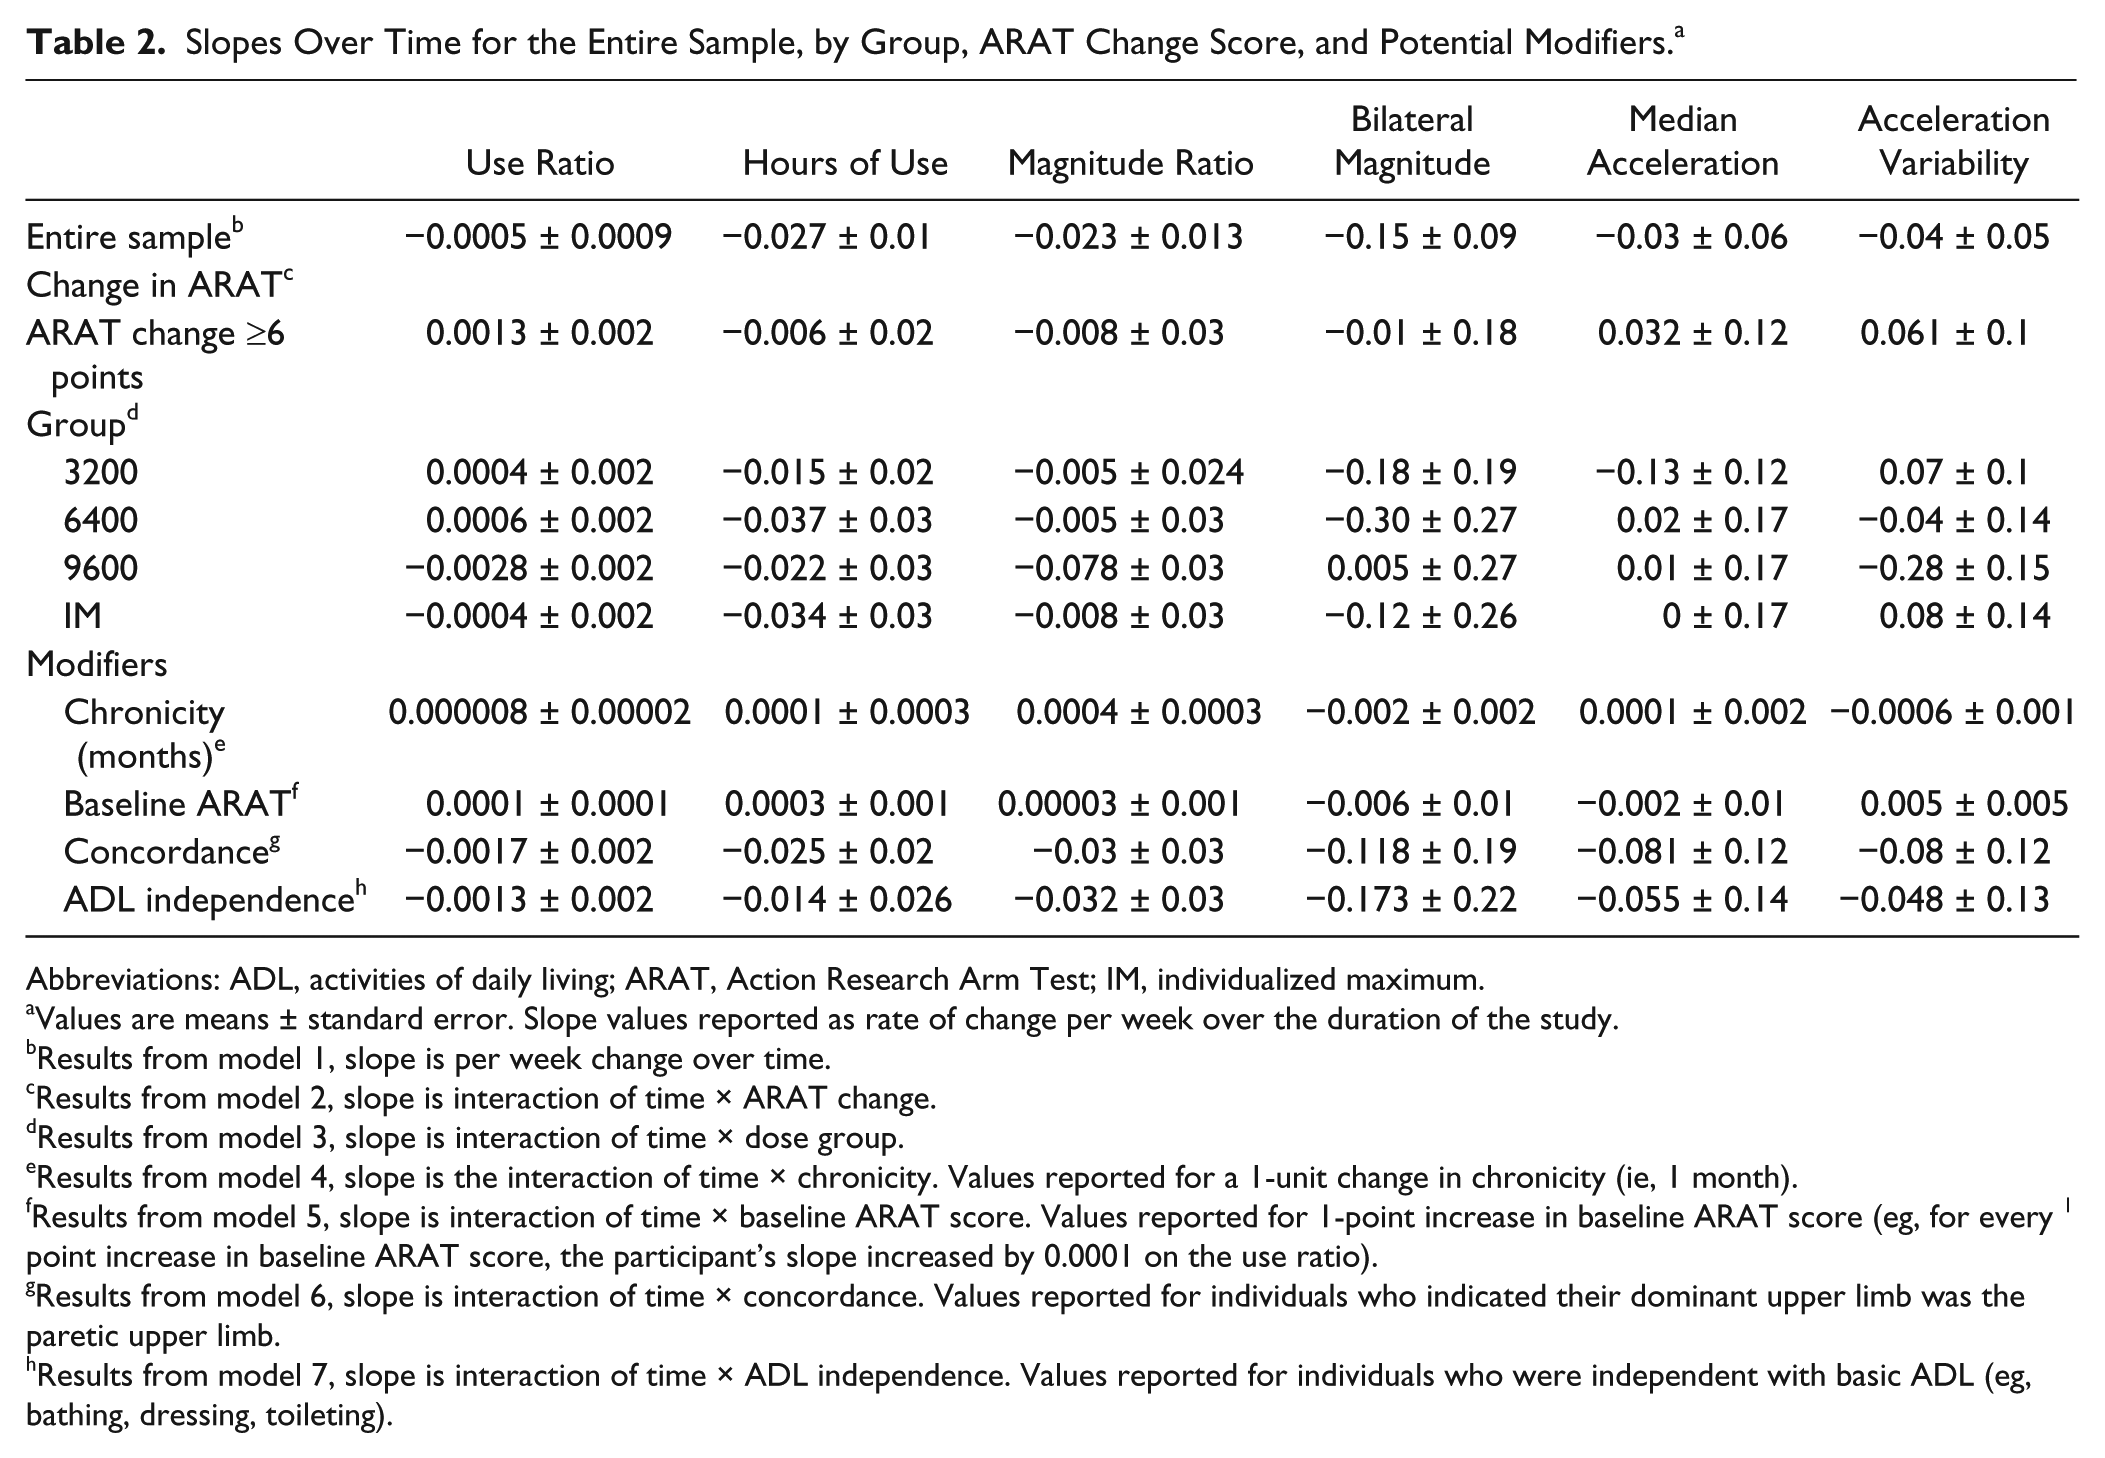
Abbreviations: ADL, activities of daily living; ARAT, Action Research Arm Test; IM, individualized maximum.
Values are means ± standard error. Slope values reported as rate of change per week over the duration of the study.
Results from model 1, slope is per week change over time.
Results from model 2, slope is interaction of time × ARAT change.
Results from model 3, slope is interaction of time × dose group.
Results from model 4, slope is the interaction of time × chronicity. Values reported for a 1-unit change in chronicity (ie, 1 month).
Results from model 5, slope is interaction of time × baseline ARAT score. Values reported for 1-point increase in baseline ARAT score (eg, for every 1 point increase in baseline ARAT score, the participant’s slope increased by 0.0001 on the use ratio).
Results from model 6, slope is interaction of time × concordance. Values reported for individuals who indicated their dominant upper limb was the paretic upper limb.
Results from model 7, slope is interaction of time × ADL independence. Values reported for individuals who were independent with basic ADL (eg, bathing, dressing, toileting).
To test the possibility that some changes in performance were masked in the entire sample, we grouped participants based on changes in UL capacity. Seventy-five participants had available data for this portion of the analysis. The 3 excluded cases withdrew from the study prior to the first assessment after treatment was initiated, and therefore did not have an ARAT change score. Individuals who had larger changes in UL capacity (ARAT change score ≥6 points, n = 36) started better (higher baseline intercepts) for the use ratio (P < .001), hours of paretic limb use (P = .007), magnitude ratio (P < .001), median acceleration (P < .001), and acceleration variability (P < .001), as would be expected (values not shown). Despite the better starting points, ARAT change did not influence the rates of change between the 2 groups (Ps >.05) and all slopes were still not significantly different from zero (Table 2, second row of data).
The addition of treatment group, and the interaction between treatment group and time also did not change the results. Figure 1 illustrates the lack of group effect on all 6 variables. No significant intercept and slope differences existed between groups and results from general linear hypothesis tests indicated none of the group slopes were significantly different from zero for any of the 6 variables (all Ps >.05). Results of the group effects are reported in the middle rows of Table 2. Finally, we tested potential modifiers that have previously been shown to influence UL performance. 44 Time poststroke, baseline UL capacity, concordance, and ADL status influenced the starting points (ie, better intercepts) as expected, but did not influence change over time (model slopes calculated from time × modifier interaction, all Ps >.05, slope values reported at the bottom of Table 2). Specifically, time poststroke significantly influenced the use ratio (P = .04) and magnitude ratio (P = .03) intercepts, respectively, but was not a significant modifier of the remaining four intercept values. Baseline UL capacity and ADL status significantly influenced the intercepts of all 6 variables, and concordance significantly influenced the use ratio (P < .001), magnitude ratio (P = .01), median acceleration (P = .04), and acceleration variability (P = .04) intercepts.
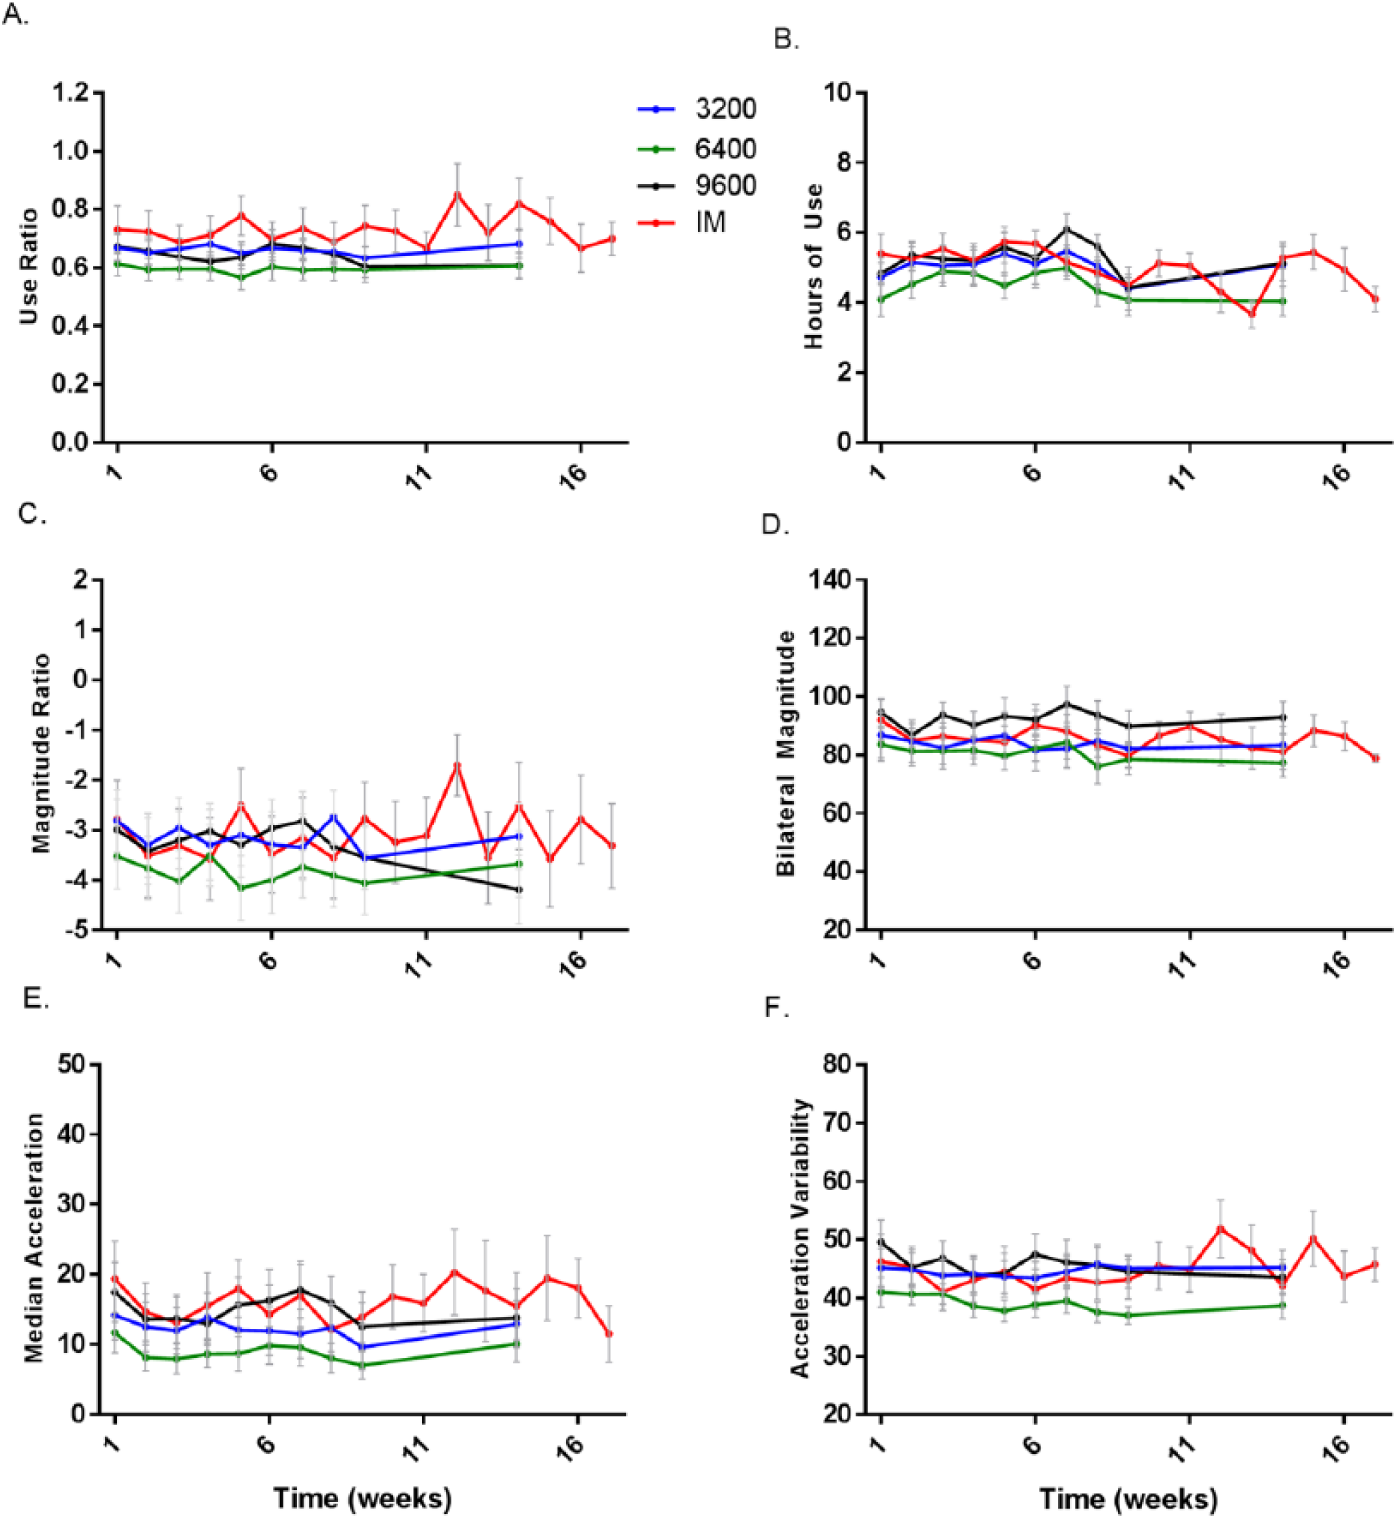
UL performance over time for all six accelerometer variables by dose group. Values are group means ± SE for each assessment. Week 1 corresponds to the baseline assessment, and subsequent weeks correspond to the weekly assessment out to the immediate post-intervention assessment and follow-up assessment. Participants in the individualized maximum (IM) group were allowed to continue beyond the 8-week enrollment period until specific stopping criteria were met, observed here by the presence of additional data points.
Figure 2 provides representative individual examples of the lack of change in UL daily performance. Despite substantial changes in UL capacity, participants 1 (10 point ARAT change) and 2 (18-point ARAT change) show no change in performance from baseline to postintervention. The pictures from these 2 participants are not distinctly different from participant 3 (3-point ARAT change). Compared with healthy, neurologically intact adults, the density plots in Figure 2 are all asymmetrical, with mostly negative magnitude ratio values that indicate increased nonparetic UL activity. An absence of warmer colors indicates less movement overall, with no change in the frequency of movement from baseline to postintervention. There is a noticeable peak in the center of participant 1’s density plot at week 4 (ie, a higher bilateral magnitude value), indicating more intense movements, but this was not sustained by the postintervention assessment. While some participants showed small fluctuations such as this one, no subjects showed sustained changes over time.
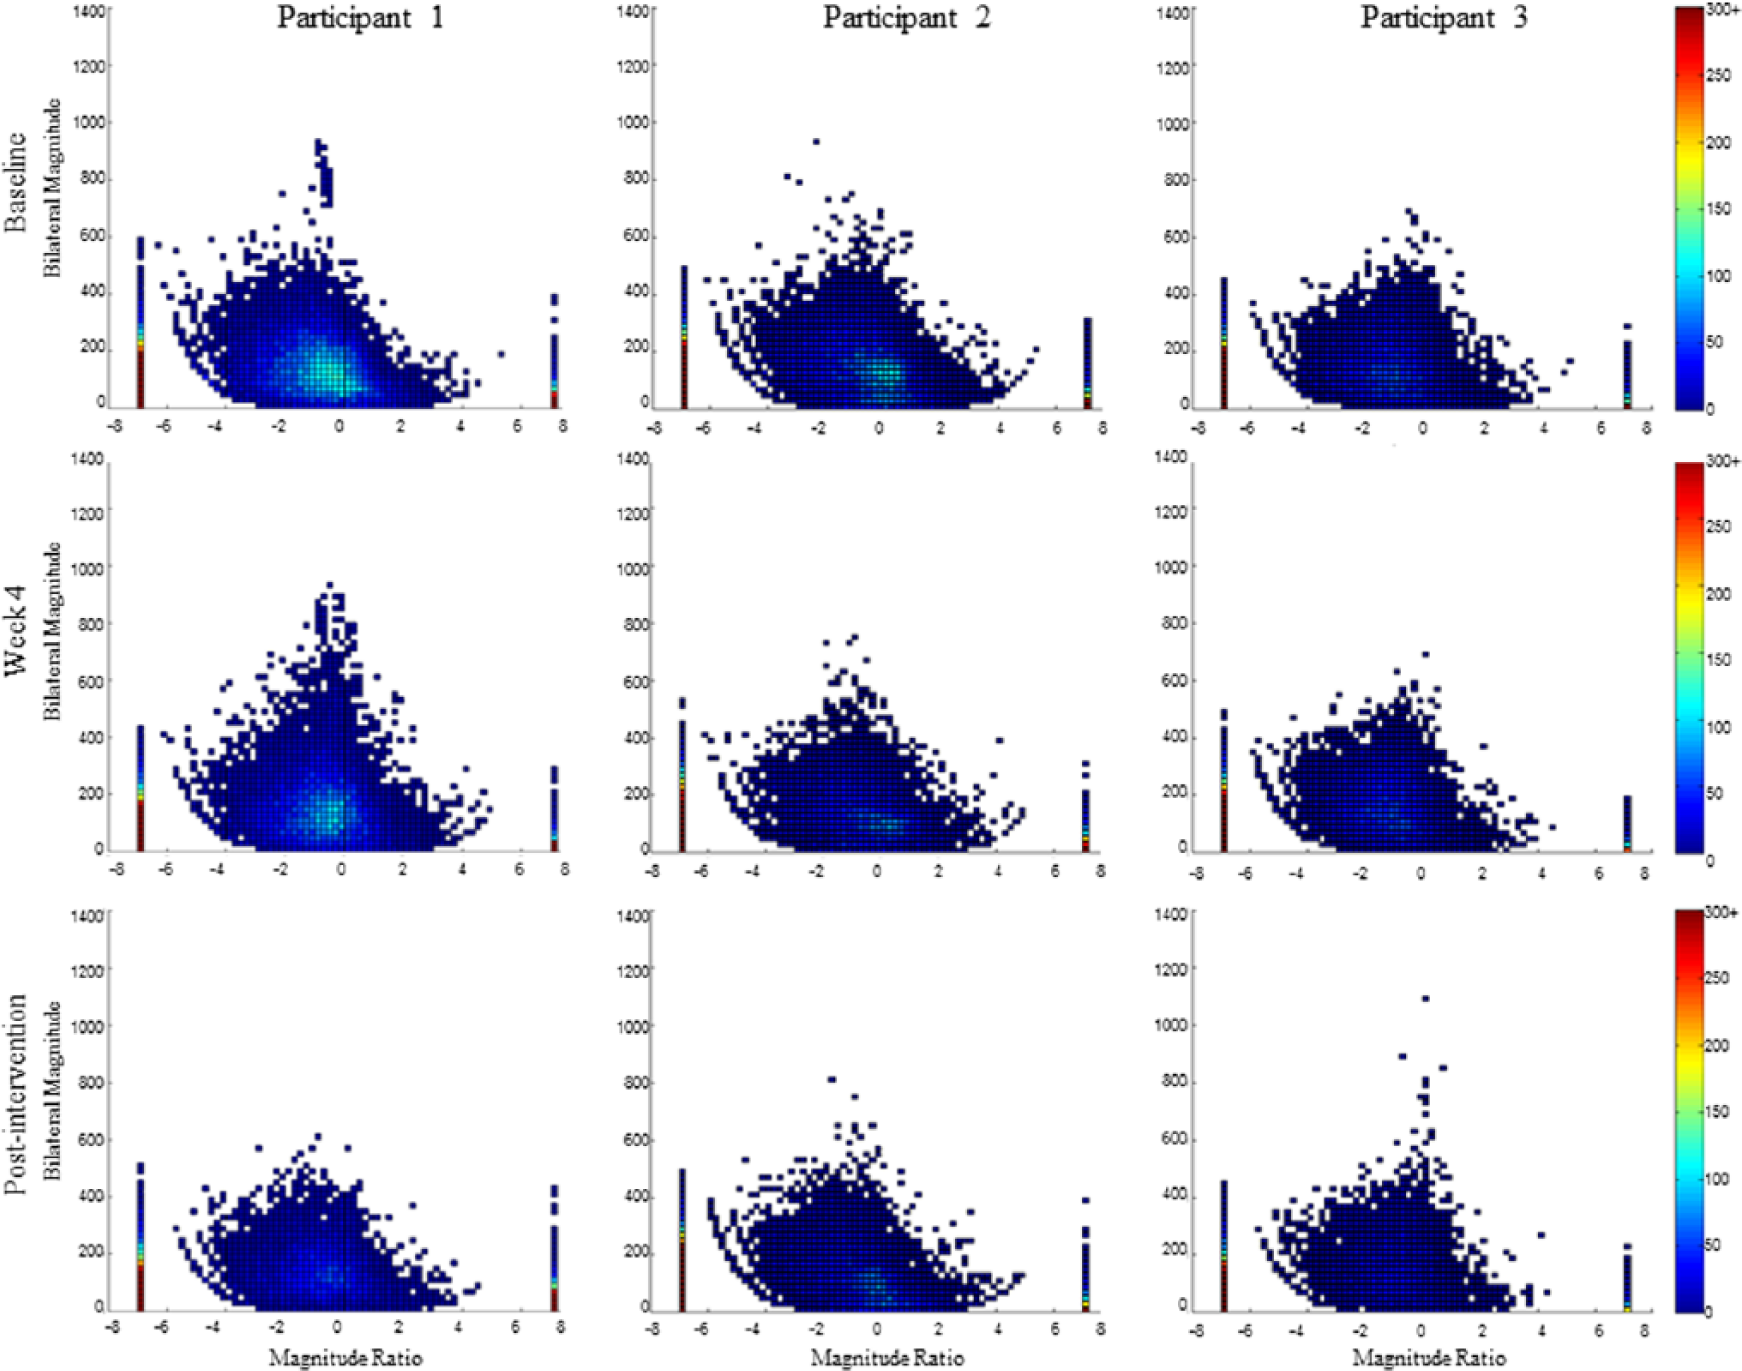
Density plots showing second-by-second data from three representative participants. Time points are from baseline (top), week four (middle), and post-intervention assessments (bottom). The y-axis (Bilateral magnitude) represents the intensity of movement, with higher values indicating larger, more intense movements. The x-axis (Magnitude ratio) represents the contribution of each limb to an activity, with 0 indicating equal UL contribution, negative values indicate more non-paretic UL movement and positive values indicate more paretic limb movement. The color scale shows overall frequency of UL movement, with warmer colors indicating more UL movement. The small bars on each side of the plot indicate non-paretic (negative) and paretic (positive) unilateral movement. Overall, participants had a moderate level of UL paresis at baseline (participant 1 = 38 points; participant 2 = 35 points, and participant 3 = 36 points). Participants 1 and 2 demonstrated 10-point and 18-point changes in ARAT score, respectively. Participant 3 increased 3 points on the ARAT. Regardless of UL capacity changes, there was no evidence of sustained changes in performance.
Discussion
We evaluated changes in UL performance in daily life resulting from a task-specific intervention using a quantitative measure of performance. None of the 78 participants increased their UL performance in daily life, as measured by the 6 accelerometer variables. Dividing the sample into groups based on changes in UL capacity or dividing the sample into groups based on amount of motor practice failed to produce changes in performance over time. Additionally, despite having various effects on the initial intercepts, none of the modifiers influenced change over time (slopes). Thus, UL task-specific training, designed to improve UL capacity in the clinic may be unable to improve UL performance in daily life. This is contrary to the long-standing clinical assumptions that improving UL capacity directly translates to improved UL performance in daily life.
A key reason people are referred to motor rehabilitation services is to improve UL performance in daily life. With the cost of stroke expected to exceed 2.2 trillion dollars by 2050, 48 it is striking that not one person changed UL performance after this carefully delivered intervention. 14 These results are consistent with a few other studies that have begun to identify a discrepancy between changes observed in the rehabilitation clinic (ie, capacity) and a failure to increase UL performance in daily life both for adults26,49 and children 50 (but see Shim et al 51 ). When changes seen in the clinic do not carry over to life at home, then it is time to reconsider what is being delivered in the clinic and how it might need to be changed.
One argument against these striking results is that perhaps the accelerometers failed to capture change that really occurred. There are numerous studies of UL interventions poststroke that have reported a positive increase in UL performance in daily life when measured via self-report10,17-19 and for individuals earlier after stroke, the MAL and use ratio are correlated. 38 Self-perception of changes in UL performance is a valuable component of the rehabilitation process, but perhaps not the whole story. We cannot completely rule out the possibility that other variables from the accelerometers would show changes. In deciding on these 6 variables however, we did test a number of others that were not useful (eg, highly variable across neurologically intact population).39,43 Our accelerometers were on the wrists, so we also cannot completely rule out the possibility that small, dexterous movements of the fingers improved and we did not capture this. This second possibility is also unlikely, since pilot testing with accelerometers picked up most of the hand/finger movements,43,52 particularly the less efficient and uncoordinated movements of the paretic hand and fingers poststroke.
There are several possible reasons for these striking results. First, this study included those with chronic (≥6 months) stroke when habits have likely already formed. Perhaps changes in UL performance would be observed if task-specific training was delivered earlier after stroke. Second, changes in capacity may be insufficient or not enough to improve UL performance in daily life. There may be a specific threshold for UL capacity that must be exceeded to drive changes in UL performance.53,54 Third, UL performance is not solely a function of UL capacity but dependent on other factors such as motivation, health behaviors, and environmental supports. It is likely that these results are a combination of all three proposed reasons. Future studies could examine the timing of intervention to improve UL performance post-stroke, as some pilot studies have reported changes in both UL capacity and UL performance earlier after stroke.27,55 Additional studies could explore other potential factors related to UL performance such as health behaviors and motivation, and explicitly test interventions that target these factors. Indeed, the 36 participants who demonstrated improvements in capacity (ie, ARAT change ≥6 points) may be ideal candidates for interventions targeting UL performance in daily life, given their ability to change at this stage of recovery.
Several limitations influence the interpretation of these data. First, wearing sensors on the upper limbs could potentially cause people to do more with their ULs in daily life. Sensor data were collected weekly with more than 8 assessments. Thus, the novelty of wearing the devices likely wore off early. If anything, we may have overestimated UL performance in daily life within the first few assessments. Second, the sensor-based methodology quantifies movement but does not quantify specific activities or movement parameters (eg, speed, efficiency, accuracy). It is possible that some participants made small improvements in these parameters that went unmeasured. These changes, however, were not sufficient to change the involvement of the paretic limb either in total duration (use ratio) or on a second-by-second basis (magnitude ratio).
Conclusions
We found no evidence of improvement in UL performance in daily life in 78 people with long-standing paresis poststroke who completed an 8-week individualized, intensive, progressive, task-specific intervention. Neither changes in UL capacity nor the overall dose (ie, amount) of movement practice influenced changes in UL performance. These results expose an emerging problem in stroke rehabilitation. Rehabilitation services, and the providing clinicians, may be changing what people can do while they are in the rehabilitation clinic, but these benefits do not carry over to improved UL performance at home, when measured with wrist-worn accelerometers. If a primary goal of rehabilitation is to improve performance in daily life for individuals poststroke, then it is imperative that future research investigate this emerging issue.
Footnotes
Acknowledgements
The authors would like to acknowledge Brittany Hill, BA, for assisting with data collection, and Keith Lohse, PhD, for assisting with preliminary data analysis.
Declaration of Conflicting Interests
The authors declared no potential conflicts of interest with respect to the research, authorship, and/or publication of this article.
Funding
The authors disclosed receipt of the following financial support for the research, authorship, and/or publication of this article: Funding for this project was provided by NIH R01HD068290 and TL1 TR000449.