
Abstract
Background. Graph-theoretic approaches are increasingly popular for identifying the patterns of disrupted neural systems after traumatic brain injury (TBI). However, the patterns of neuroplasticity in brain organization after cognitive training in TBI are less well understood. Objective. We identified the patterns of training-induced neuroplasticity of the whole-brain network in TBI, using resting-state functional connectivity and graph theory. Methods. A total of 64 civilians and veterans with TBI were randomized into either a strategy-based cognitive training group (n = 33) or a knowledge-based training group (active control group; n = 31) for 8 weeks. The participants experienced mild to severe TBI without focal damage and persistent cognitive dysfunctions. A subset of participants complained of subclinical but residual psychiatric symptoms. We acquired their resting-state functional magnetic resonance imaging before training, immediately posttraining, and 3 months posttraining. From participants’ resting-state networks, we obtained the modularity, participation coefficient, within-module connectivity, global efficiency, and local efficiency over multiple network densities. We next performed longitudinal analyses on those measures corrected for multiple comparisons across network densities using false discovery rate (FDR). Results. Relative to the knowledge-based training group, the strategy-based cognitive training group had reduced modularity and increased participation coefficient, global efficiency, and local efficiency over time (Pnodal < .05; qFDR < 0.05). Brain behavior analysis revealed that the participation coefficient and global efficiency within the strategy-based cognitive training group correlated with trail-making scores in the context of training (Pnodal < .05; qFDR < 0.05). Conclusions. Cognitive training reorganized modular networks in TBI over the whole brain. Graph-theoretic approaches may be useful in identifying a potential brain-based marker of training efficacy in TBI.
Introduction
System-based approaches are increasingly popular in traumatic brain injury (TBI) research1,2 because of injury mechanisms and advanced imaging and mathematical tools. Diffuse axonal injury (DAI)—multifocal injuries to the axons connecting spatially distributed cortical regions—is a primary injury mechanism of TBI 3 and a major contributor to impairments in cognitive functions after TBI. 4 The advancement of resting-state functional magnetic resonance imaging (rsfMRI) and graph theory have allowed us to characterize TBI-related impairments in neural information processing within the brain system.5-12 For example, a TBI disrupts the optimal balance between network integration and segregation,8,9 modular organization,6,10 and the efficiency of brain communication.7,8,11,12
Neuroimaging tools have also provided evidence for training-dependent neuroplasticity in healthy adults.13-15 Accordingly, the neurorehabilitation community seeks to identify training-induced neuroplasticity of the injured brain.16,17 Previously, we reported the efficacy of cognitive training in TBI and its underlying neuroplasticity18-21 as measured by changes in cortical thickness, cerebral blood flow, and resting-state functional connectivity.
Although our previous studies18-21 and those of others22,23 demonstrated neuroplasticity after cognitive training in TBI, little is known about training-induced changes in the full-scale organization of the brain networks in individuals with TBI. Because the assessments of whole-brain networks in TBI utilizing rsfMRI and graph theory have provided insights into the brain systems disrupted by DAI,3,5,6,8-12 it would be informative to identify training-related neuroplasticity in TBI at the whole-brain level. Furthermore, assessing training-dependent plasticity of the network at the whole-brain level is advantageous, given that cognitive training is often multifaceted and addresses heterogeneous and complex patterns of cognitive dysfunction in TBI. 24 For instance, the cognitive training program in our previous studies aimed to improve multiple cognitive domains such as abstract reasoning, goal management, and selective attention. Thus, cognitive training might have wide effects on neural systems. Taken together, graph theoretic analyses of neuroplasticity on whole-brain networks may quantify the dynamics of neural information processing related to cognitive training in TBI.
We identified whether cognitive training would induce whole-brain network changes in individuals with TBI. Particularly, we assessed training-induced changes in resting-state modular organization and network efficiency in TBI. Based on previous findings showing disrupted modular organization over the whole brain after TBI (ie, increased modularity, decreased participation coefficients, and altered within-module connectivity, relative to healthy individuals), 6 we hypothesized that cognitive training for TBI would decrease the modularity, increase the participation coefficient, and induce bidirectional changes (ie, increases or decreases across regions) in within-module connectivity. Furthermore, based on the previous report indicating reduced network efficiency in TBI,7,8 we hypothesized that cognitive training would improve network efficiency.
Methods
We conducted a 2-arm, double-blinded (with respect to the types of intervention to participants and data acquisition team) randomized controlled study with a 3-month follow-up phase. 25 We acquired neuropsychological scores and MRI data prior to training (TP1), immediately after training completed (TP2), and 3 months after training completed (TP3).
Participants
We selected a subset of 64 civilians and veterans with TBI (>6 months postinjury), whose rsfMRI scans were available from a larger study. 25 We recruited the participants from the Dallas-Fort Worth area. The study inclusion criteria were (1) age 19 to 65 years; (2) TBIs identified by Ohio State University Traumatic Brain Injury Identification (OSU TBI-ID) method 26 ; (3) >6 months postinjury time; (4) ability to understand, read, and speak English; (5) an Extended Glasgow Outcome Scale score between 4 (lower severe disability) and 7 (lower good recovery); (6) no history of clinically diagnosed neurological or psychiatric comorbidities; (7) no current use of any prescription medications; and (8) not pregnant. For this report, we only included the participants lacking visible focal lesions or extreme white matter degeneration on structural MRI scans. Initial injury severity was retrospectively estimated utilizing the OSU TBI-ID method. 26 The rationale for utilizing the OSU TBI-ID and the reliability of OSU TBI-ID are described in our previous report. 19 A subset of participants from our previous studies7,18-21 were included in this report: the pretraining data from Han et al, 7 the data from Vas et al, 18 and Han et al 19 and a subset of data from other previous studies.20,21 All these previous studies addressed different topics related to TBI and cognitive training. Prior to participating in the study, all participants provided written informed consent. This study was approved by the institutional review boards of the University of Texas at Dallas and University of Texas Southwestern Medical Center.
Training Protocols
All participants were randomly assigned to 1 of the 2 training programs: (1) a Strategic Memory Advanced Reasoning Training (SMART; n = 33) or (2) a comparison training called Brain Health Workshop (BHW; n = 31). Training programs were delivered in small groups (4-5 participants per group) for 8 weeks (12 one-and-a-half-hour sessions) by 2 trained clinicians. Detailed descriptions of the SMART and BHW programs are described in supplementary material and elsewhere. 18 Briefly, the SMART group focused on selective attention targeting strategic memory, abstract reasoning, and other thinking strategies to improve cognitive control. 27 The BHW group was taught about brain structure and function and the impact of sleep and exercise on brain health, especially learning and memory. 28
Neuropsychological Assessments
For this report, we selected card sorting and trail making from the Delis-Kaplan Executive Function System (D-KEFS) for problem solving and processing speed, from the full testing battery. 25 These tests showed training-induced improvement in our previous study. 19 From the card-sorting test, we selected correct sorts and description scores during free sorting and description scores during sort recognition. Because the 3 selected scores were highly correlated, we obtained composite scores by averaging the scaled scores for these subtests. From the trail-making test, we selected scaled scores on number-letter switching versus motor speed. We administered multiple versions of neuropsychological tests across time points to reduce practice effects.
We also acquired full-scale intelligent quotient-2 (FSIQ-2) from the Wechsler Abbreviated Scale of Intelligence for estimated IQ 29 and FSIQ from the Wechsler Test of Adult Reading for estimated premorbid IQ. 30 Our participants did not show clinically significant psychiatric symptoms. However, previous studies in TBI reported that individuals with TBI often have psychiatric symptoms. 31 Thus, we quantified the symptom severity of subclinical-but-residual depression and posttraumatic stress disorder (PTSD), using the Beck Depression Inventory-II (BDI-II) 32 and PTSD Check List Stressor-specific (PCL-S). 33 Note that the BDI-II and PCL-S were not primary outcome measures but supplementary characterization measures.
MRI Data Acquisition
The participants underwent MRI scans on a Philips Achieva 3T scanner (Philips Medical Systems, Netherlands). In each imaging session, we acquired 1 high-resolution T1-weighted imaging of the whole brain (Repetition time [TR]/Echo time [TE] = 8.1/3.7 ms; flip angle [FA] = 12°; field of view [FOV] = 25.6 × 25.6 cm2; matrix = 256 × 256; 160 slices, 1.0 mm thick) and either one or two 416-s runs of T2*-weighted rsfMRI scans (TR/TE = 2000/30 ms; FA = 80°; FOV = 22.0 × 22.0 cm2; matrix = 64 × 64; 37 slices, 4.0 mm thick) for each participant, using a standard 32-channel head coil. At the early stage of our study, the quality assurance procedures with only 1 rsfMRI run yielded high rates of participant exclusion. Thus, we acquired 2 rsfMRI runs for the remainder of the data collection. Refer to the rsfMRI preprocessing section for our strategy to account for differences in total number of rsfMRI scans across participants. During rsfMRI acquisition, the participants were asked to remain still with their eyes closed.
RsfMRI Preprocessing
We preprocessed rsfMRI data in AFNI (version AFNI_17.3.02). 34 Each participant’s structural images were first skull-stripped and registered to the Montréal Neurological Institute (MNI) space. 35 For each rsfMRI run, we discarded the initial 4 frames, followed by despiking, slice timing correction, motion correction, linear coregistration to the structural images in the MNI space with spatial resampling (4 mm isotropic), normalization to whole-brain mode of 1000, band-bass filtering (0.009 < f < 0.08 Hz), and nuisance regression with detrending (third order). Nuisance variables included the 6 rigid body motion profiles, averaged signals over the lateral ventricles, averaged signals over the deep cerebral white matter, and their temporal derivatives. After the linear regression, we performed motion “scrubbing” 36 with a framewise displacement (FD) of 0.5 mm and a standardized root mean square of temporal derivative of signal intensity over voxels (referred to as DVARS) to prevent potential motion artifacts. 36 If 2 runs of rsfMRI scans were acquired, we temporally concatenated them. To account for the differences in total number of frames after motion scrubbing across rsfMRI scans, all remaining scans were trimmed to a minimum length (121 frames; 242 s) across all rsfMRI scans. 37 Finally, we spatially smoothed the preprocessed rsfMRI data with a 6-mm full-width-at-half-maximum Gaussian kernel.
Quality Assurance
We visually inspected structural MRI scans to ensure that participants lacked significant brain atrophy and checked the quality of the preprocessed rsfMRI data at each step. We ensured that the total length of remaining time courses after the motion “scrubbing” was longer than 4 minutes, the minimum length required to reliably estimate functional connectivity. 38 We also confirmed that there were no MRI scans or neuropsychological measures that were acquired outside the study time constraints (ie, outside the 2-SD band from the mean).
Network Analysis
Network Construction
We constructed both weighted and undirected networks. We initially defined 268 nodes as 5-mm radius spheres centered at 264 regions from the Power atlas, 39 the amygdalae (L: −24, −1, −16; R: 26, 1, −18) from the automated anatomical label atlas, 40 and the hippocampi (L: −30, −13 −12; R: 30, −4, −12). 41 Then, we excluded 3 nodes where >20% of the rsfMRI scans showed susceptibility artifacts, yielding 265 total available nodes. We defined an edge as the Pearson correlation coefficient for time-series from a pair of the nodes. We masked out short-range connectivity (<20 mm in Euclidean distance), which might be associated with nonbiological origins such as preprocessing and participant motion. 39 The remaining correlation coefficients were then thresholded at multiple levels of network density. The network density refers to the proportion of remaining connections after thresholding over all possible connections. Specifically, in the connectivity matrix, the network density was obtained by counting the number of elements for suprathreshold connections divided by the total number of off-diagonal elements of the connectivity matrix (ie, 265 × 264). We first thresholded at a 15% level, then lowered network density by 1% until stable modular organization was retained in our participants. 6 The lowest allowable network density was 5%.
Network Measures
For whole-brain network measures, we obtained modularity levels 42 after module identification. Briefly, modularity quantifies the balance between within- and between-module connections of the network. The modularity values depended on network density. Similar to the procedure described in Arnemann et al, 43 we obtained the aggregated modularity of each network by averaging modularity values over 11 network densities (15%-5%). Refer to the supplementary material for the mathematical definitions of modularity and other procedural details. For regional network measures, we obtained participation coefficients, 42 within-module degree z-scores, 42 regional global efficiency, 44 and regional local efficiency. 44 Briefly, the participation coefficients and within-module degree z-scores represent the connectivity strength of a given node with the other nodes outside and within the corresponding module, respectively. The regional global efficiency and regional local efficiency quantify the average efficiency of connecting paths between a given node and the other nodes across the whole brain and their immediate neighbors, respectively. Refer to the supplementary material for mathematical definitions of the regional network measures. We obtained all the network measures using the Brain Connectivity Toolbox. 45
Longitudinal Analysis
To identify training-induced changes in the network measures, we performed a linear mixed-effects model (LME) analysis 46 using a piece-wise linear model with a break-point at the posttraining time point, a randomly varying intercept, and within- and between-subject covariates for BDI scores. We adjusted for BDI scores because the average BDI-II scores for the participants corresponded to mild depressive symptoms per the BDI manual 32 and previous studies reported that the subclinical levels of depression had an effect on connectivity in TBI.21,47 We only included BDI scores because BDI and PCL-S scores were highly correlated and the inclusion of both covariates could yield the multicollinearity problem in the LME model. Refer to our previous studies19-21 for the mathematical formula of the LME model. We performed subsequent statistical inferences for the within- and between-group contrasts of network measures at monotonic and nonmonotonic changes over the 3 time points. Monotonic changes refer to increases or decreases over time. Nonmonotonic changes refer to increases followed by decreases, or decreases followed by increases over time. As previous studies reported increased modularity and reduced participation coefficients, global efficiency, and local efficiency after TBI,6,7 we conducted 1-tailed tests for these measures (ie, alternative hypotheses: monotonic increases or increases followed by decreases). A previous study 6 reported bidirectional changes in within-module degree z-scores after TBI; therefore, we ran 2-tailed tests for within-module degree z-scores.
For regional network measures, we first performed the LME analysis at each of the nodes and each of the network densities. We then aggregated changes in these measures across space and network densities using the following procedures. For each network density, we identified the number of nodes that showed between- and within-group differences in the given regional network measure at Pnodal < .05. Subsequently, we performed the likelihood ratio χ2 test (1-tailed) to determine whether the percentage of nodes showing substantial change in the regional network measure was greater than by chance (ie, 5%). Finally, we corrected for multiple comparisons across network densities at a false discovery rate (FDR) 48 of 0.05.
We performed an exploratory analysis to identify spatial patterns of nodes with changes in regional network measures and variations in these patterns across network densities. This was accomplished by counting the number of times that a given node showed a change in each of the regional network measures at Pnodal < .05 over network densities. We identified these spatial patterns based on the large-scale resting-state networks (cingulo-opercular, frontoparietal, salience, dorsal attention, ventral attention, default mode, motor and somatosensory, auditory, visual, and subcortical networks) from the Power atlas. 39
Assessment of Demographics and Behavior
All statistical analyses were conducted in MATLAB R2017a. First, we performed the Mann-Whitney U test to compare age, years of education, postinjury time, current IQs, and premorbid IQs between the groups because these demographics did not pass the Shapiro-Wilk normality test at α = 0.05. The Fisher exact test was used to compare the gender distributions and proportion of civilians and veterans between the groups. The likelihood ratio χ2 test was used to compare the distribution of primary cause of injury between the groups. Similar to longitudinal analysis of the network measures, we performed the LME analysis on the age-adjusted scores of the card sorting and trail-making tests with covariates for BDI-II scores, years of education, and estimated current IQ. For BDI-II and PCL-S scores, the LME analysis did not include the age, years of education, and estimated current IQ covariates because we did not expect these demographic variables to affect BDI-II and PCL-S scores.
Assessment of Brain-Behavior Relationships
To identify whether changes in network measures were associated with neuropsychological test performance over 3 time points, we selected the trail-making test as the neuropsychological test of interest because it showed group differences in performance (see the Results section). Then, we performed the revised LME analysis with additional within- and between-subject covariates of trail-making scores. Note that when we assessed the trail-making scores (see the Assessment of Demographics and Behavior section above), we adjusted for age, years of education, and BDI scores. We regressed these variables out from the trail-making scores to prevent potential effects of these variables in our revised LME. The age-, education-, and BDI-adjusted trail-making scores were then included as covariates in the revised LME analysis. We used a 1-sided hypothesis test (negative correlations) because we observed reductions in network modularity and increases in trail-making scores. Among regional measures, we chose the participation coefficients and global efficiency as targeted network measures because these measures are related to network integration, our focus in this study. We corrected for multiple comparisons across network densities at qFDR < 0.05. We also used a 1-sided hypothesis test (positive correlations) because we observed increases in the selected regional network measures and trail-making scores.
Motion Analysis
To identify whether there were systematic differences in participant motion during rsfMRI runs, we performed an LME analysis on the average FD of each scan.
Alternative Thresholding Approach to Obtain Connectivity Matrix
Previous studies reported the potential effects of differences in overall functional connectivity strength levels on network analyses.49,50 To confirm whether our findings were independent of differences in functional connectivity strengths across training groups and time points, we thresholded the correlation coefficients by the network cost, the average suprathreshold correlation coefficients. 51 This allowed us to perform analyses while matching overall functional connectivity strengths across groups and time points. See supplementary material for the details.
Assessment of Participant Characteristics
We identified (1) the effects of estimated initial injury severity on our main findings, (2) the number of civilians and veterans who completed neuropsychological assessments and resting-state fMRI scans by time points, and (3) the effects of residual psychiatric symptoms on our findings. See supplementary material for the details.
Results
Demographics
The participants were heterogeneous. They included both civilians (70%) and veterans (Table 1). The participants’ estimated initial injury severity was primarily mild but varied across the participants. Participants’ average baseline BDI and PCL scores corresponded to mild depressive symptoms and were borderline for PTSD-related symptoms. The average postinjury time was 8 years but varied across participants. Demographic variables (gender, the ratio of civilians and veterans, age, education, current IQ, premorbid IQ, BDI-II, PCL-S, postinjury time, estimated initial injury severity, and primary cause of injury) were not significantly different (P = .05).
Participant Demographics. a
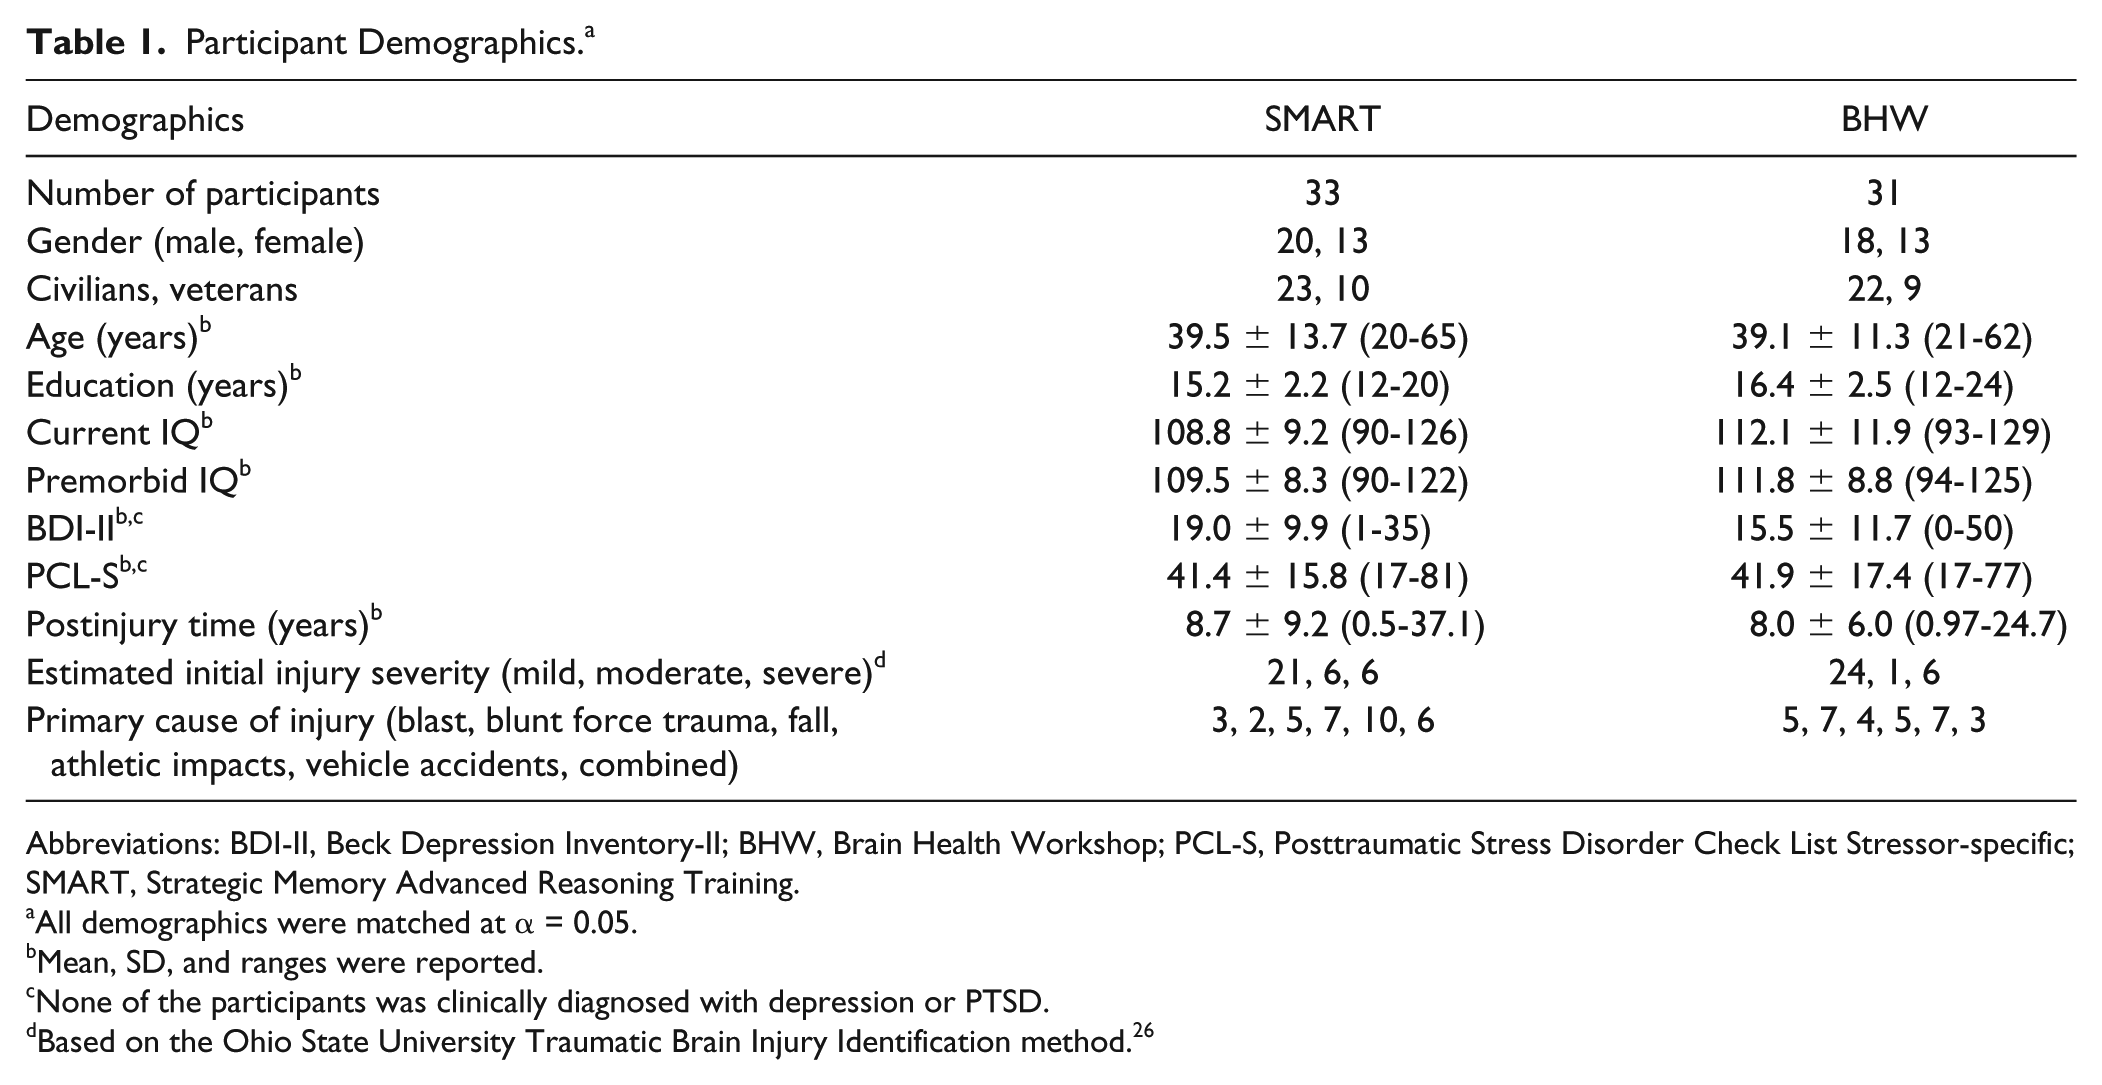
Abbreviations: BDI-II, Beck Depression Inventory-II; BHW, Brain Health Workshop; PCL-S, Posttraumatic Stress Disorder Check List Stressor-specific; SMART, Strategic Memory Advanced Reasoning Training.
All demographics were matched at α = 0.05.
Mean, SD, and ranges were reported.
None of the participants was clinically diagnosed with depression or PTSD.
Based on the Ohio State University Traumatic Brain Injury Identification method. 26
Neuropsychological Assessment Results
The average times of assessments at TP2 and TP3 were 9 and 18 weeks, respectively (Table S1). Scaled scores of the participants indicated that participants’ average baseline performance of the card-sorting and trail-making tests were lower than the normative mean 52 (Table S2). The SMART group showed statistically significant improvements (P = .02) in trail-making scores relative to the BHW group (Figure 1A; Table S2). The BHW group did not show statistically significant changes in trail-making scores over time at α = 0.05. Both groups showed statistically significant reductions in BDI and PCL scores (Table S2). However, there were no statistically significant between-group differences (Table S2).
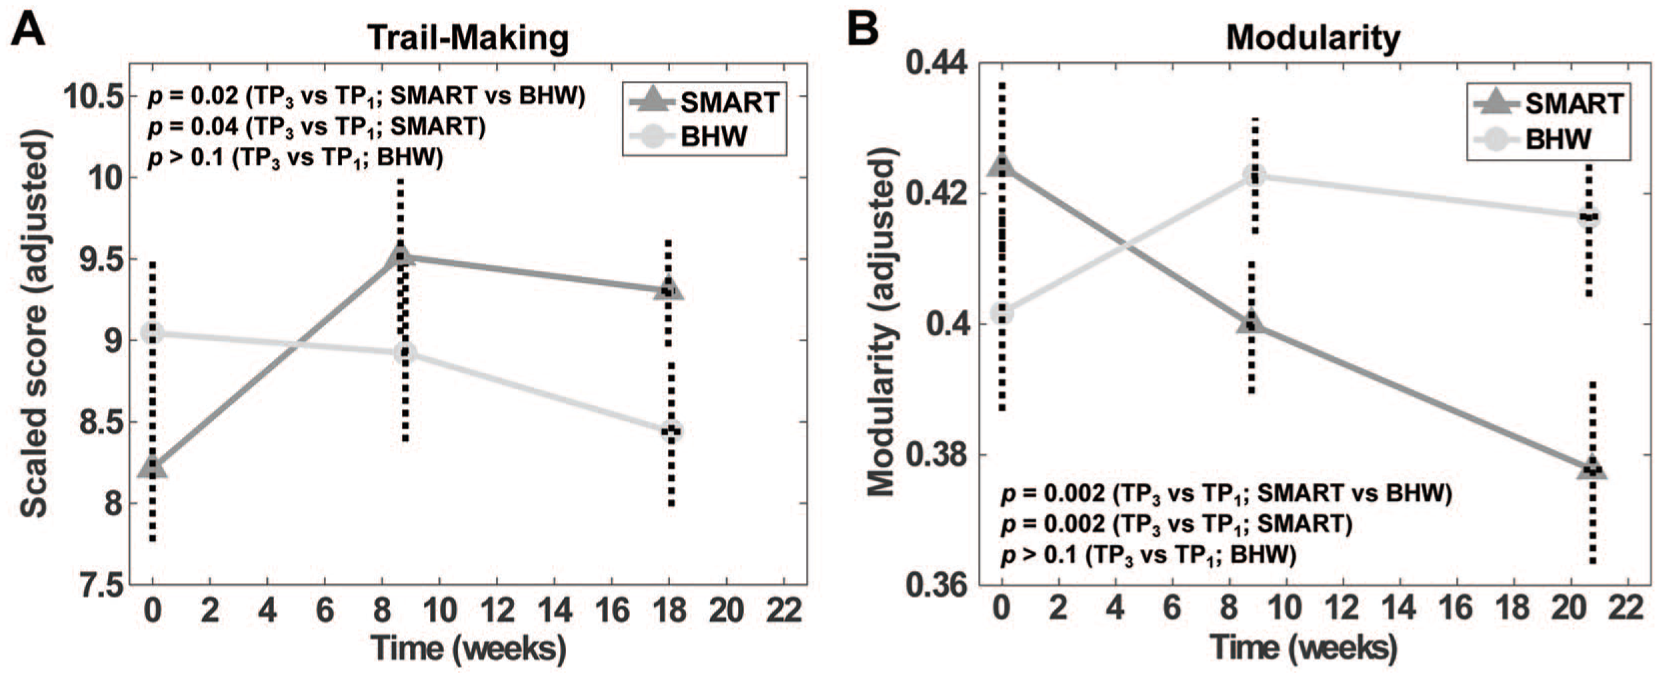
Changes in the trail-making scores (A) and modularity (B) over time.
Training-Induced Changes in Network Measures
The SMART group showed monotonic reductions in modularity over time, relative to the BHW group (Figure 1B). At the regional level, when aggregated across nodes, there were statistically significant (Pnodal < .05, qFDR < 0.05) between-group changes in the participation coefficient, within-module degree z-score, global efficiency, and local efficiency (Figure 2). However, group differences in changes in the participation coefficient were less prominent than those in the efficiency measures (Figure 2A). Relative to the BHW group, the SMART group showed both increases and decreases in within-module degree z-score (Figure 2B). Within-group analysis results revealed that increases in the participant coefficient, global efficiency, and local efficiency and bidirectional changes in the SMART group primarily led to the observed between-group contrasts (Figures S1 and S2).
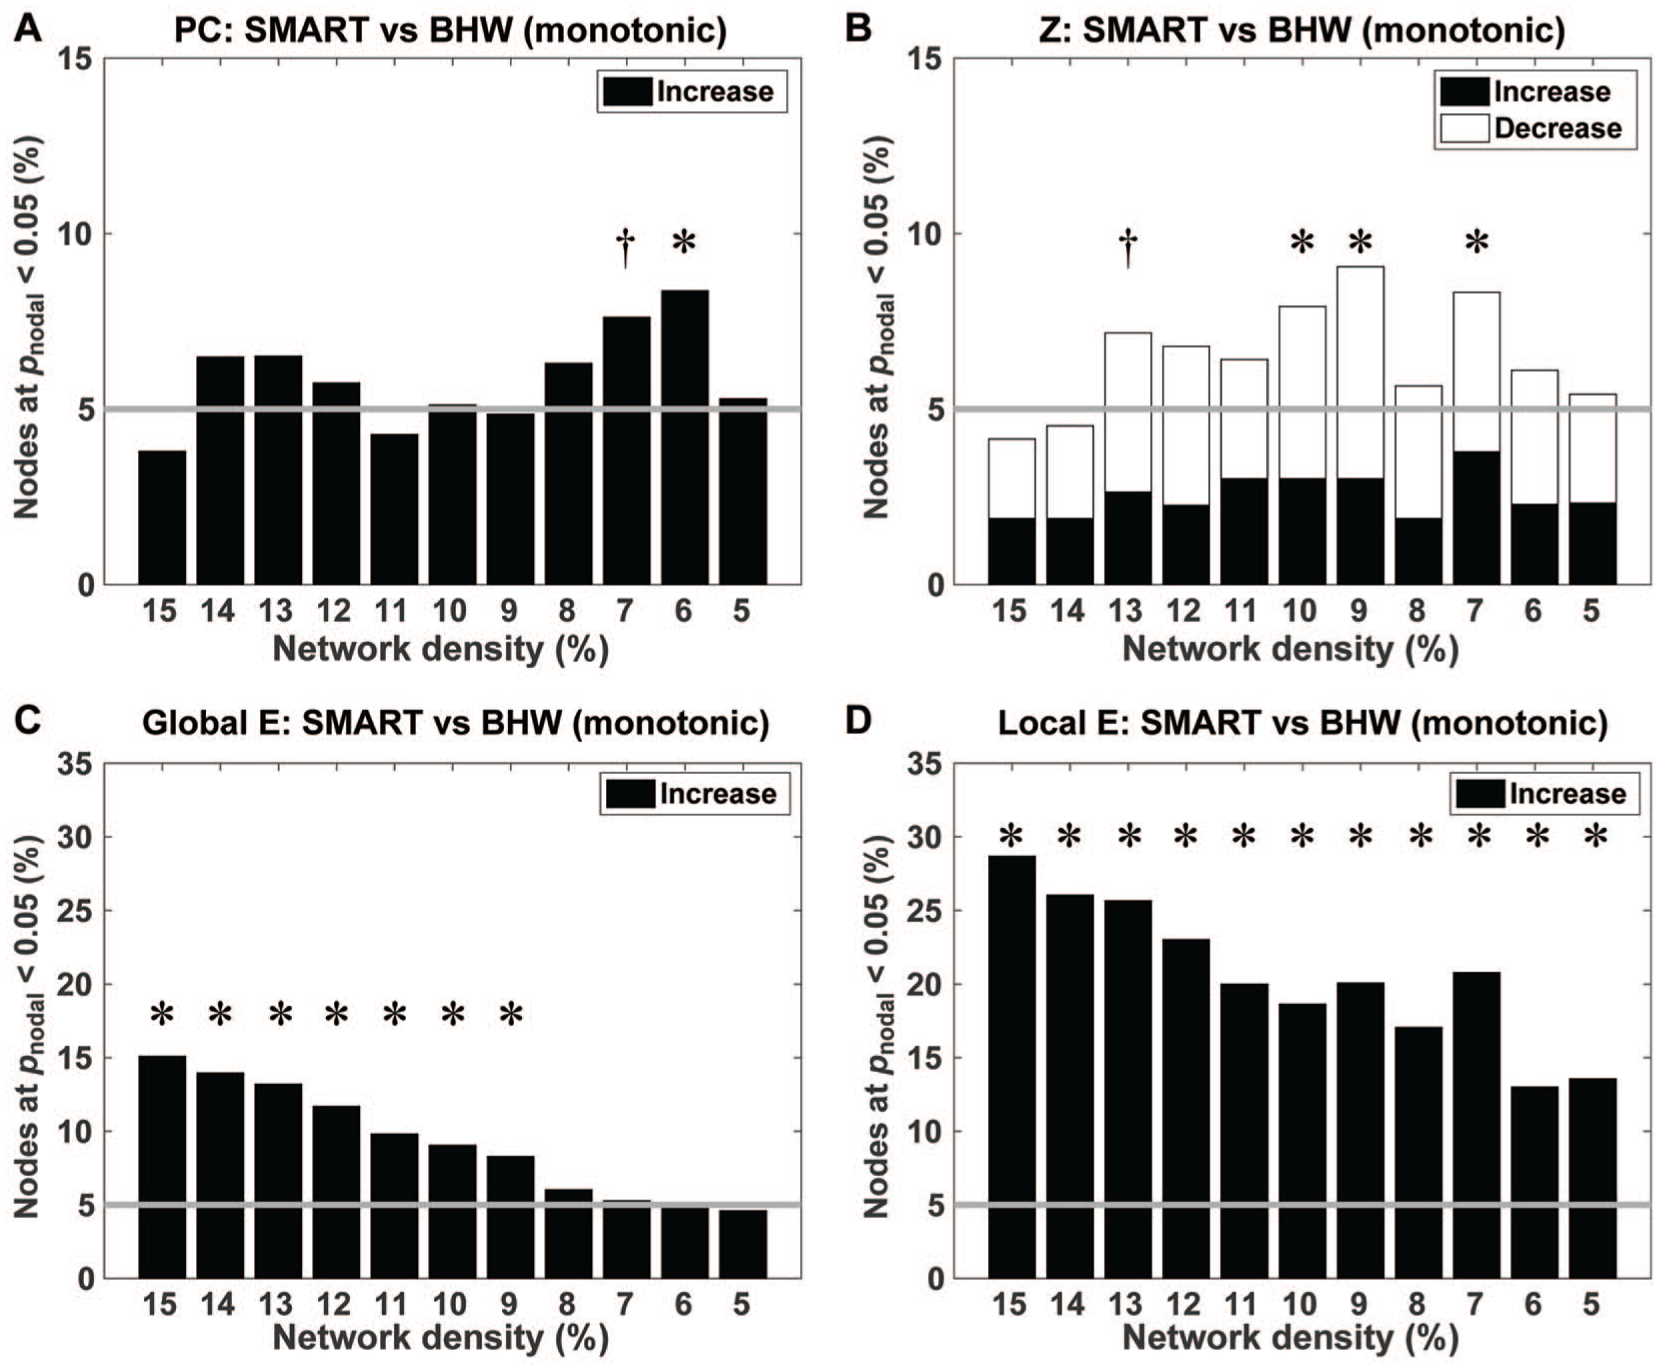
Bar graphs for the percentage of nodes that showed between-group differences in temporal changes in the participation coefficients (A), within-module degree z-score (B), global efficiency (C), and local efficiency (D) at Pnodal < .05. Gray horizontal lines indicate the percentage of such nodes if they occurred by chance (ie, 5%).a
The brain maps for between-group changes in regional network measures at Pnodal < .05, aggregated across network densities, demonstrated spatial patterns of training-induced changes in the regional network measures (Figure 3). Overall, the spatial patterns of between-group contrasts for changes in the efficiency measures were more consistent over network densities (ie, large spheres in Figure 3) than those in module-based measures. From the perspective of the large-scale resting networks, consistent between-group changes in the participation coefficient across network densities primarily occurred within the default mode network (ie, red spheres in Figure 3A). In contrast, consistent between-group changes in within-module degree z-scores occurred at multiple resting-state networks, such as the default, cingulo-opercular, frontoparietal, salience, motor, ventral attention, and auditory networks (Figure 3B). Similarly, consistent between-group changes in the efficiency measures across network densities occurred within various large-scale resting-state networks (Figures 3C and 3D). Within-group analyses revealed that aggregated changes in the regional network measures within the SMART group over network densities were more prominent than those within the BHW group at Pnodal < .05 (Figures S3 and S4). Furthermore, changes within the SMART group primarily fell within regions where between-group changes occurred, indicating that SMART led to the observed between-group differences in the regional measures.
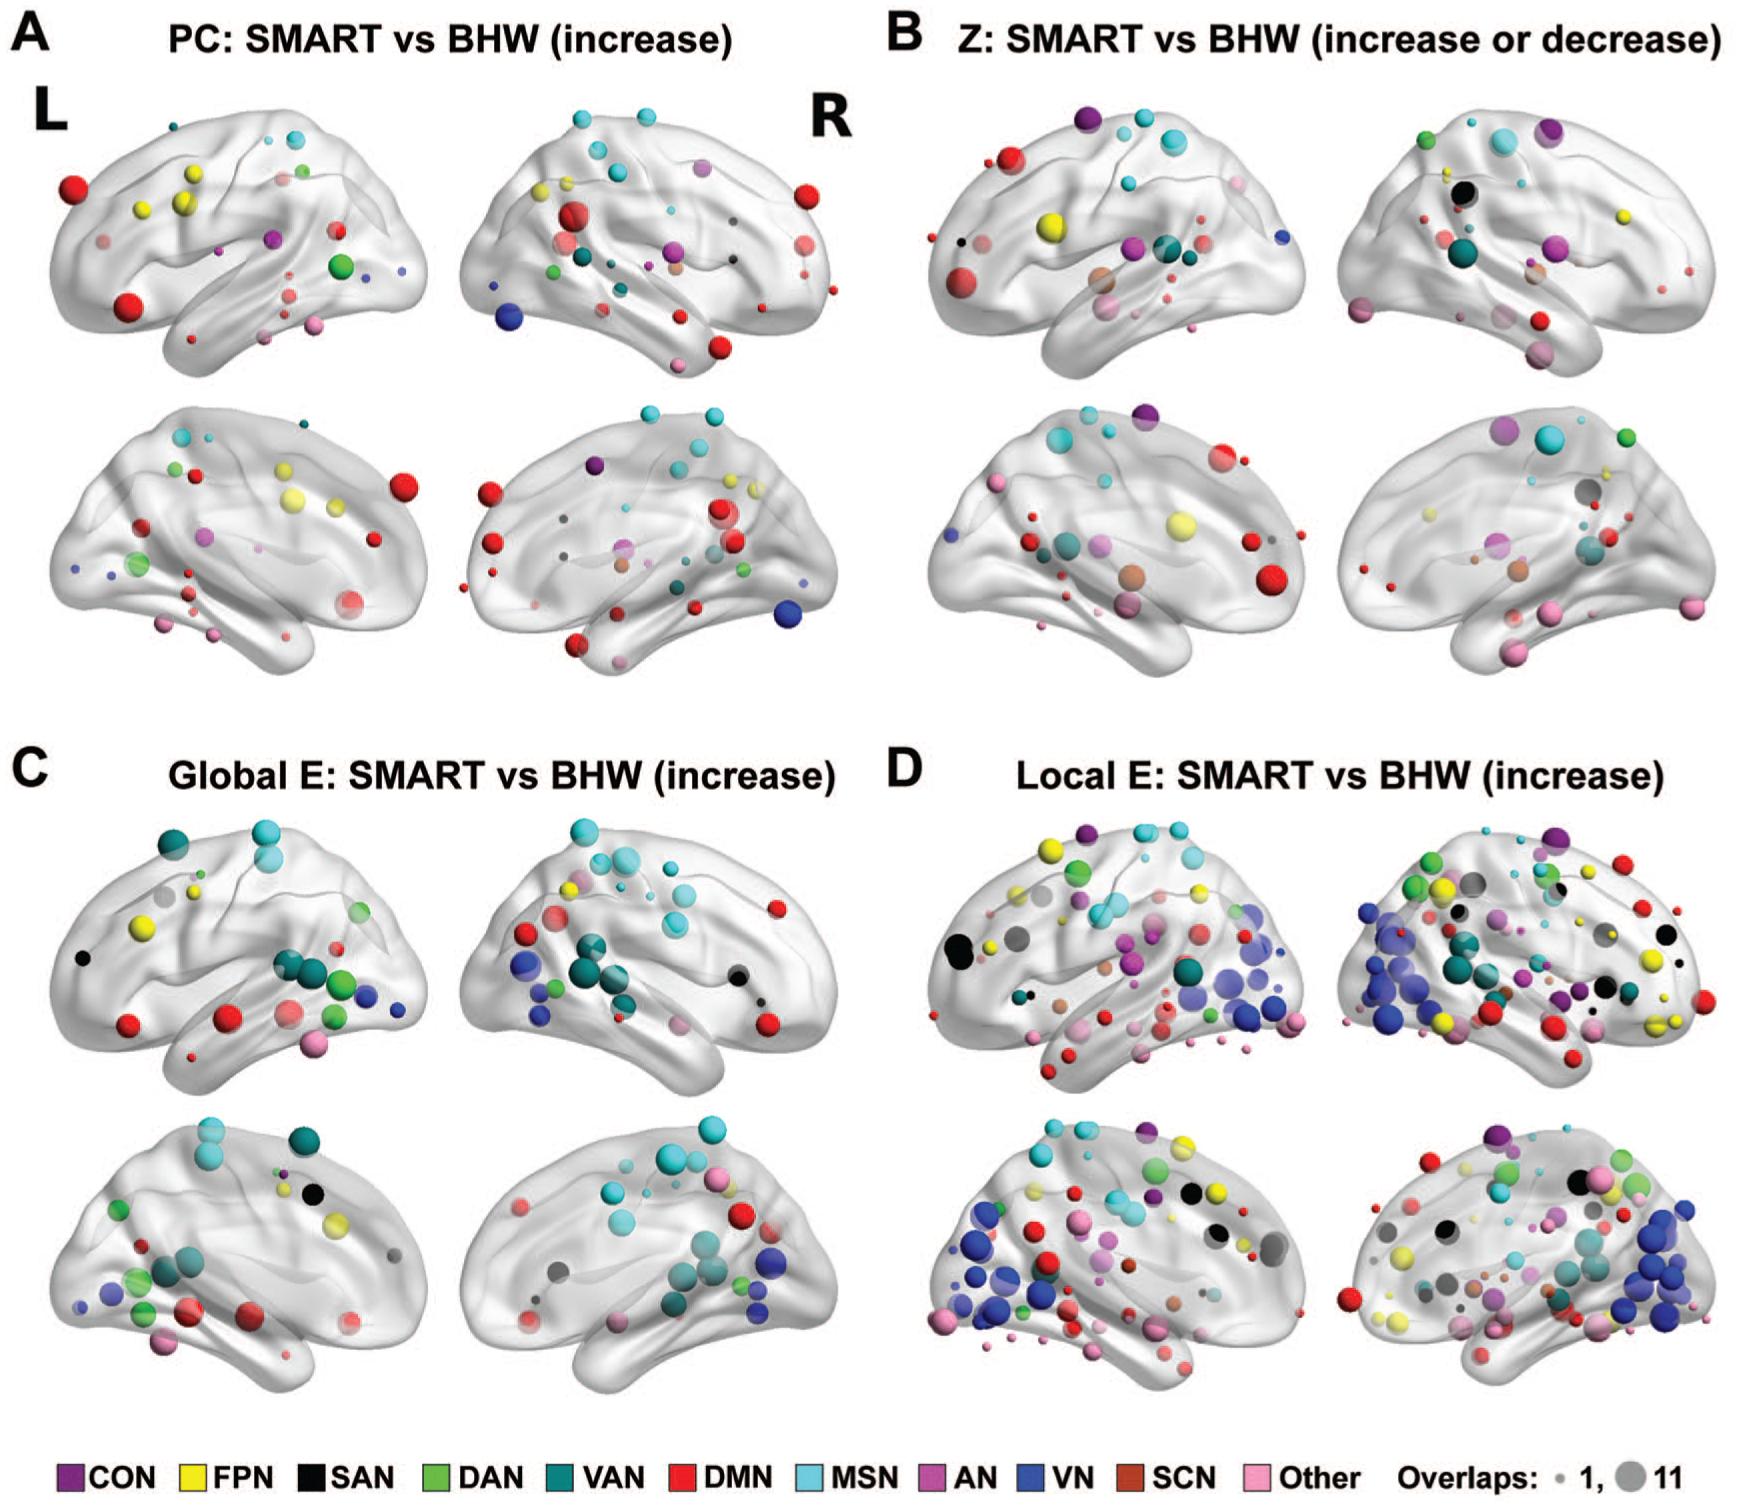
Color maps for the spatial distribution of nodes that showed consistent between-group differences in temporal changes in the participation coefficient (A), within-module degree z-score (B), global efficiency (C), and local efficiency (D) over network densities at Pnodal < .05. The size of spheres represents the number of times (ranging from 1 to 11) that nodes showed changes across network densities Pnodal < .05. The nodes were color coded by affiliated large-scale resting networks per Power atlas. 39 The nodes under the brain were located in the cerebellum.
Brain-Behavior Relationships
Modularity did not correlate with trail-making test performance, but regional network measures were correlated with trail-making scores. Specifically, within the SMART group, training-induced increases in the participation coefficient were correlated with improvement in the trail-making scores at Pnodal < .05, qFDR < 0.05 (Figure 4A). Although less prominent, positive correlations also occurred for the BHW group at 10% and 8% network densities (Figure 4B). Correlations also occurred at the between-subject level. The average global efficiency within the SMART group was correlated with trail-making scores across all network density levels (Figure 4C). Such correlations did not occur within the BHW group (Figure 4D).
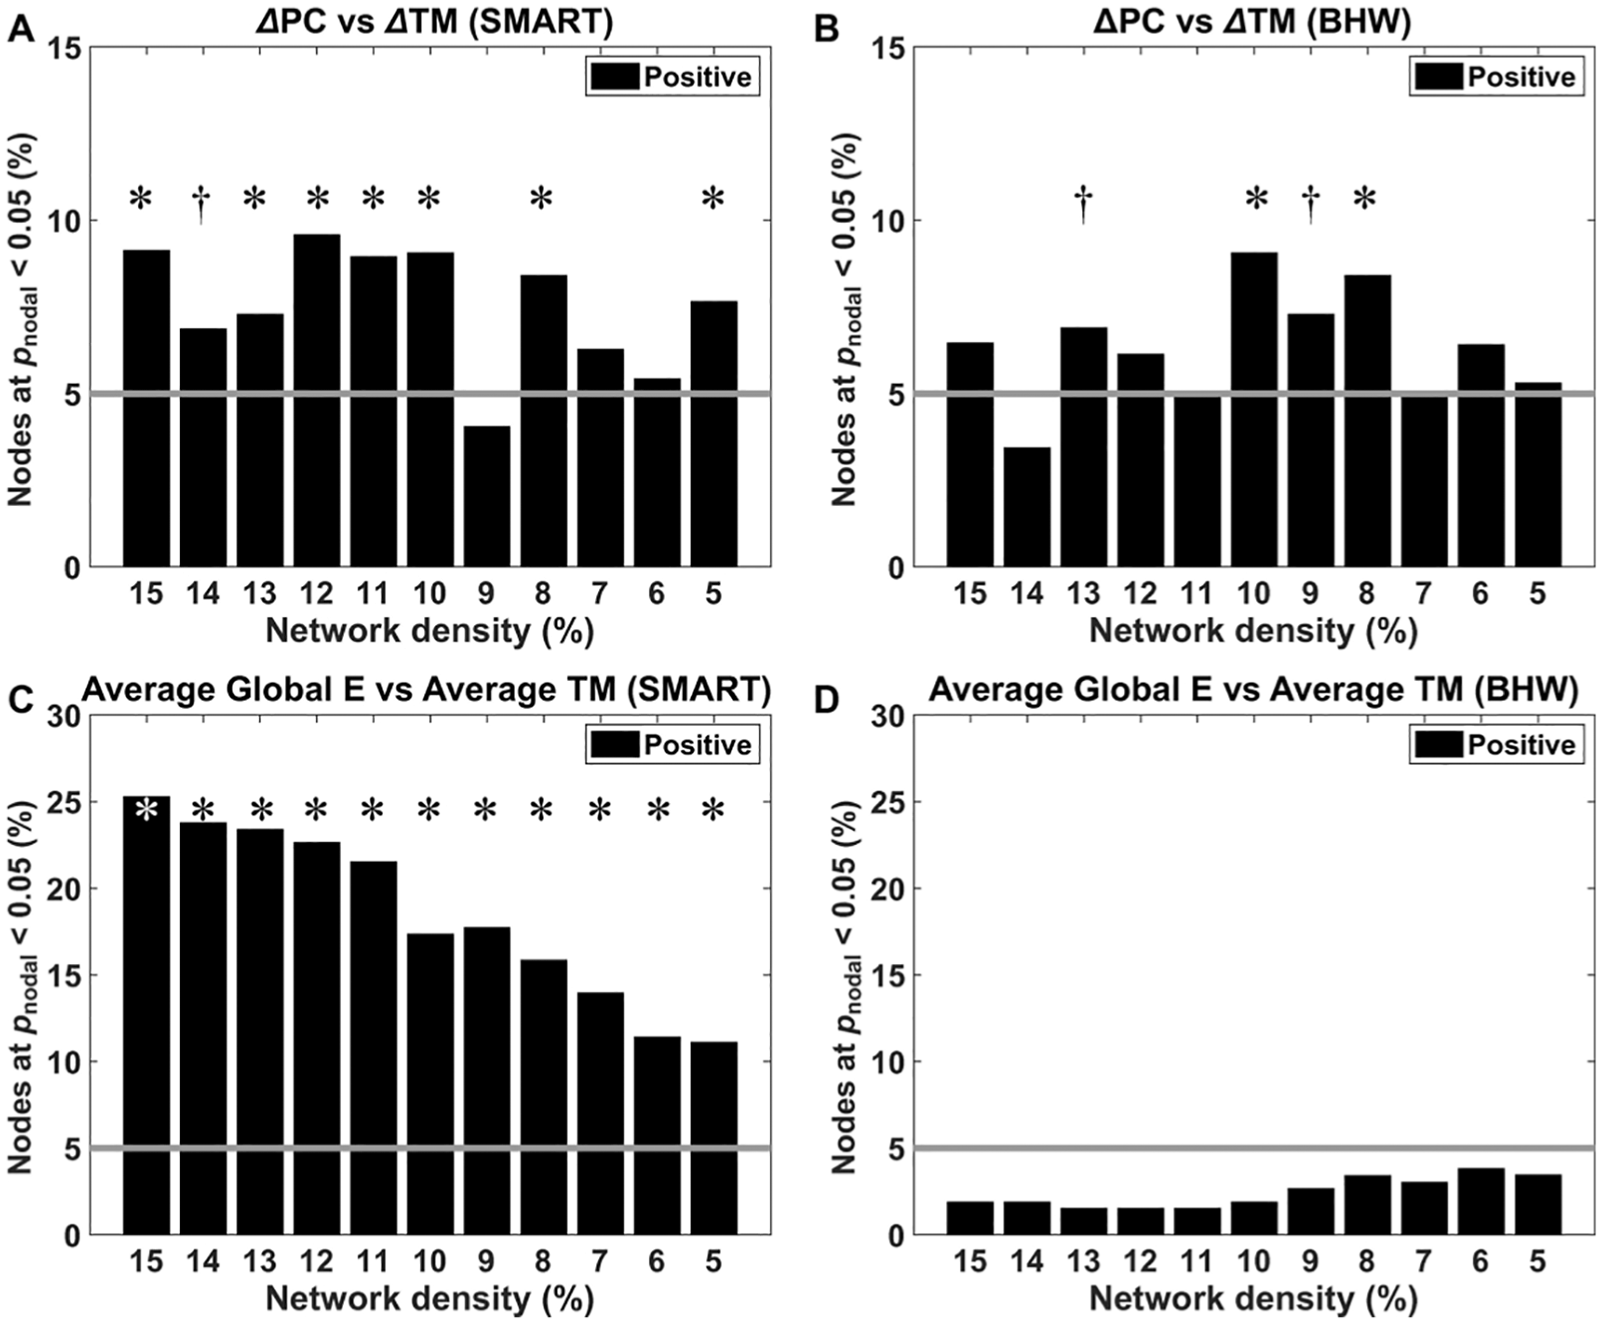
Bar graphs for the percentage of nodes where trail-making scores were correlated with changes in the participation coefficients (A, B) and average global efficiency (C, D) at Pnodal < .05. Refer to Figure 2 for other details.
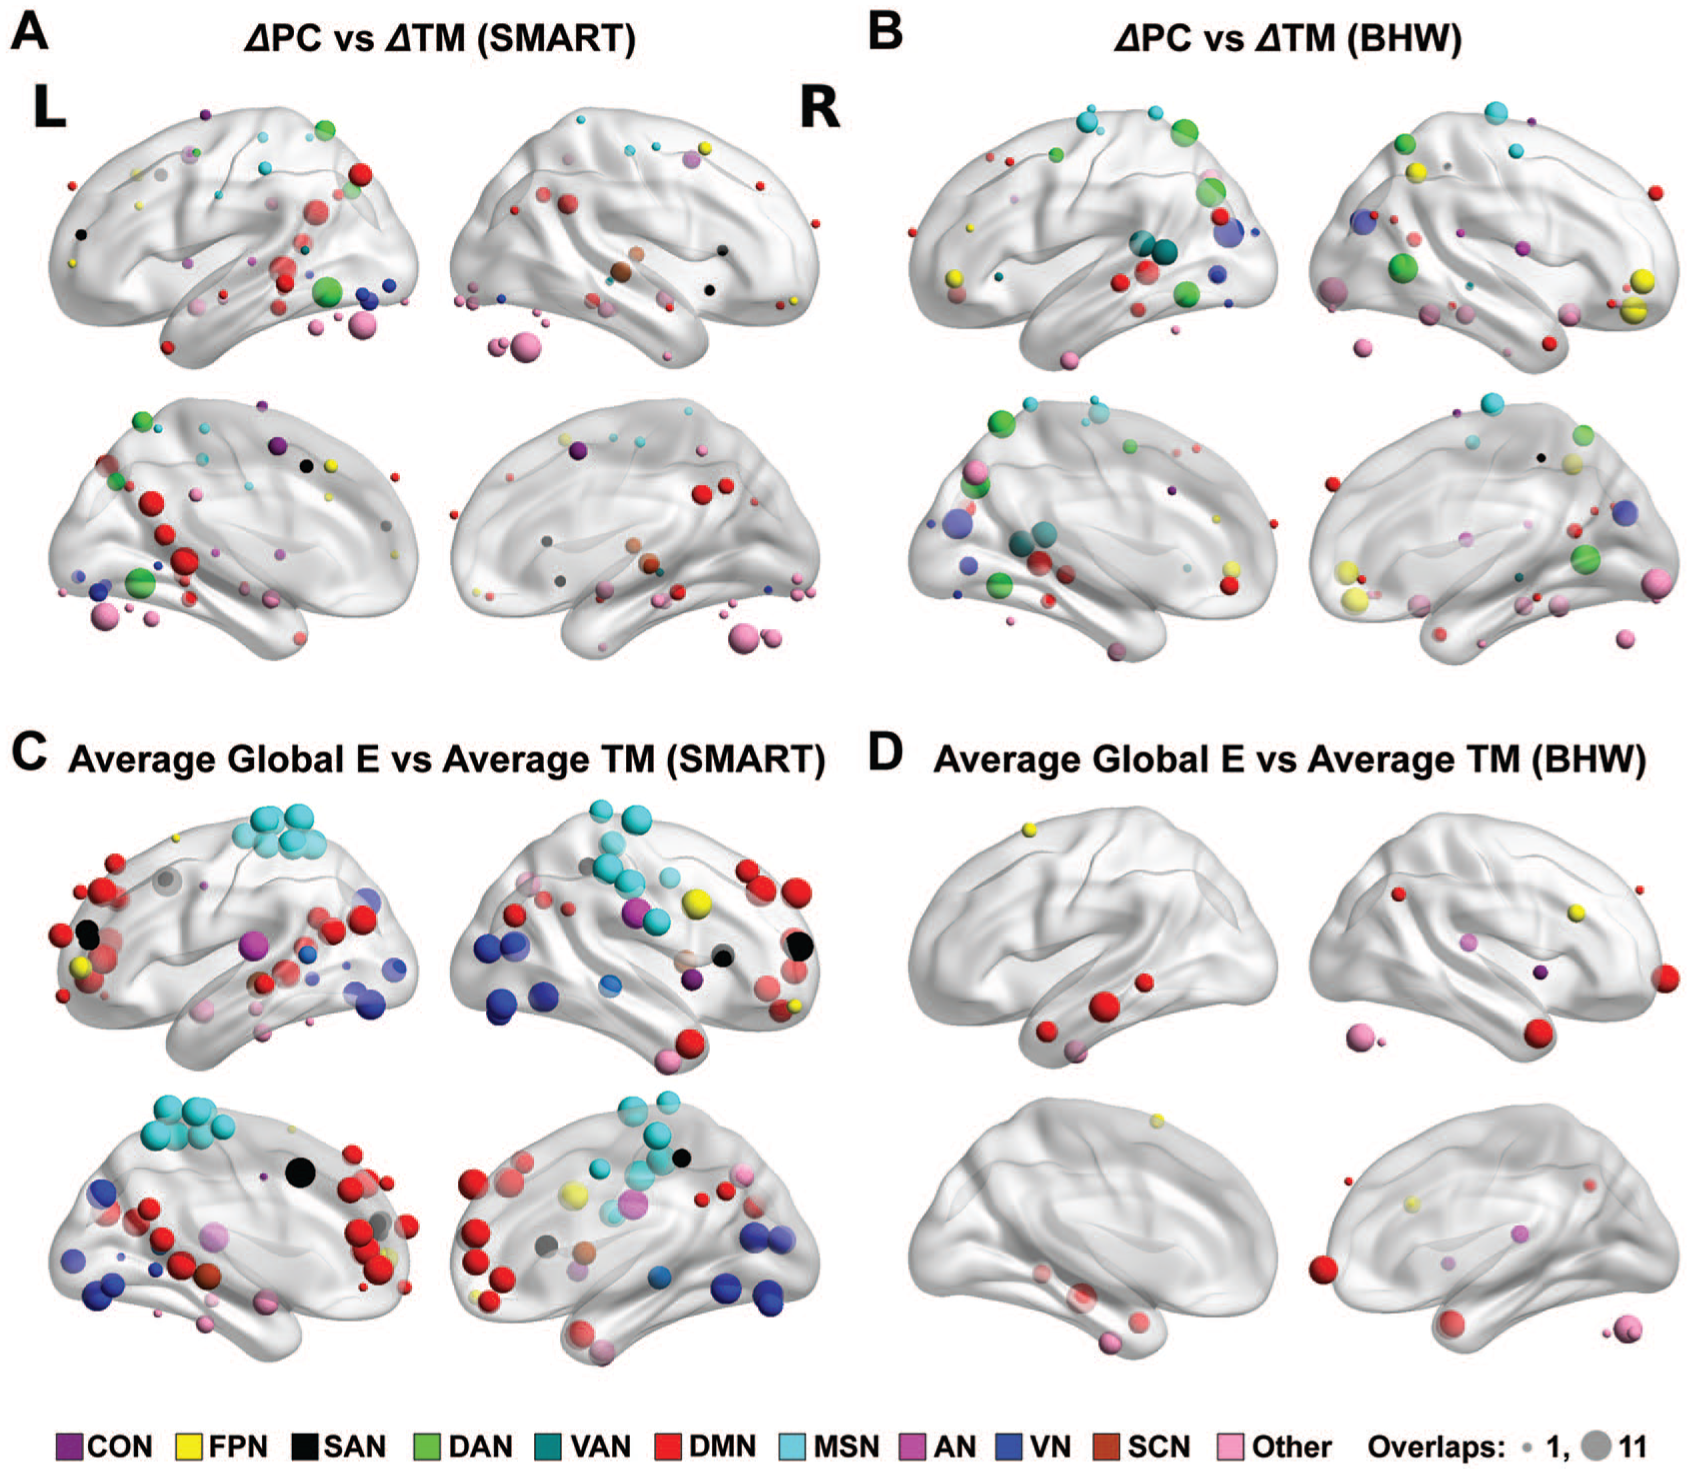
The brain maps for correlations between the regional network measures and trail-making scores, aggregated across network densities at Pnodal < .05, demonstrated distinct spatial patterns (Figure 5). Although both training groups showed correlations between changes in the participation coefficient and trail-making scores, their spatial patterns were different from one another. The SMART group showed consistent neural correlates primarily within the default mode and dorsal attention networks (Figure 5A), whereas consistent patterns within the BHW group primarily occurred within the visual, motor and somatosensory, dorsal attention, ventral attention, and frontoparietal networks (Figure 5B). We observed correlations between average global efficiency and trail-making scores over time. For the SMART group, prominent correlations occurred at the default mode, motor and somatosensory, visual, frontoparietal, and salience networks (Figure 5C). In contrast, correlations were sparse within the BHW group (Figure 5D).
Motion Analysis Results
The LME analysis on the average FD of each scan indicated that there were no systematic differences in participant motion between groups and across time within each of the groups (Table S3).
Results of Alternative Thresholding Approach to Obtain Connectivity Matrix
The network cost approach replicated our main findings with more prominent training-related effects (Figures S7-S9). See supplementary material for more details.
Effects of Participant Characteristics
Adjusting initial injury severity levels did not change the main findings on neuropsychological test scores or the network measures (Figures S10 and S11). Injury severity was negatively correlated with the efficiency measures (Figures S12 and S13). The ratios of civilians and veterans were consistent across data types and time points (Table S1). The within-subject BDI covariate was associated with modularity level, participation coefficient, and within-module connectivity, whereas the between-subject BDI covariate was not associated with any of the measures (Figures S14-S17). Inclusion of PCL scores replicated the main findings (Figures S18-S20). PTSD-related effects primarily occurred between the within-subject covariates and the network measures (Figures S21-S24). See supplementary material for the details.
Discussion
Cognitive training was associated with reorganization of modular brain networks among 64 individuals with a history of TBI. Specifically, cognitive training reduced modularity as a result of increased connectivity between modules. Such reduced modularity after training also yielded increases in global and local efficiency.
Our findings support the hypothesis that cognitive training for individuals after TBI induces changes in whole-brain networks. Previous graph theory studies in TBI demonstrated that the spatial extent of alterations in resting-state functional connectivity after TBI (particularly DAI) could span the whole brain, and a TBI disrupts the organization of entire networks.6,8-10 We extend this line of research in the context of TBI rehabilitation. Indeed, training-induced changes in the participation coefficient and within-module connectivity spanned both cognitive control networks (ie, cingulo-opercular and frontoparietal networks) and other large-scale resting-state networks, including the dorsal attention, ventral attention, default mode, motor-somatosensory, and visual networks (Figures 3A and 3B, Figures S3A and S3B). These training-induced changes in multiple networks shifted the balance between network integration and segregation at the whole-brain level (Figure 1B), potentially enabling more efficient and robust neural communication (Figures 3C and 3D, Figures S3C and S3D).
The directionality of changes in the module-based connectivity and network efficiency measures are consistent with previous reports of disrupted connectivity after TBI. Previous studies demonstrated that a TBI (1) increased the modularity, reduced between-module connectivity, and led to fluctuations (ie, increases or decreases across regions) in within-module connectivity 6 and (2) reduced global and local efficiency.7-9 The directionality of the modularity, between- and within-module connectivity, and the efficiency after cognitive training were opposite to those TBI-induced disruption patterns, presumably leading to improved neuropsychological performance in the participants. Specifically, the SMART program led to decreased modularity, increased between-module connectivity, and increased network efficiency (Figures 1 and 2, Figures S1 and S2). However, such normalization of overall modular structure and network efficiency after training might not result from restoring brain networks at the connection-by-connection level. Rather, consistent with the principle of energy conservation in the brain, 53 cognitive training may reorganize brain networks through rerouting existing connectivity (ie, reallocating neural resources) for more “successful” neural information processing given the limited amount of available energy. Because the numbers of nodes with training-related increases and decreases in within-module connectivity are comparable to each other (Figure 2B, Figure S1B), constraints on the total energy may play a role in training-induced neuroplasticity in TBI. The question of restoration, or network reorganization, is related to the distinction between recovery and compensation. 54 A prevailing opinion in the neurorehabilitation literature is that compensation of injured neural network is more consistent with the underlying mechanisms of rehabilitation-induced functional improvement than “true” recovery of injured networks. 55 Taken together, training-induced neural plasticity shown in this report may be more related to compensation of altered neural circuitry rather than ‘true’ recovery of neural circuitry.
The observed brain-behavior relationship in our study (Figures 4 and 5, Figures S5 and S6) corroborated our interpretation of the findings on training-induced neural plasticity in TBI, as the observed training-induced neural plasticity was associated with improved functioning. Specifically, the measures for network integration (ie, the participation and global efficiency) were correlated with trail-making scores in the context of rehabilitation. Several TBI studies, including graph-theoretic approaches, reported correlations between brain network and behavior (eg, neuropsychological performance and psychiatric symptom severity).8,9,11,12,56 However, such brain-behavior correlations in the context of cognitive rehabilitation in TBI were rarely reported. For example, among 11 studies reviewed by Galetto and Sacco, 16 only 1 study 23 reported brain-behavior relationships. In this regard, the current study strengthens the TBI neuroplasticity literature. Interestingly, each of the selected brain-based measures (ie, the participant coefficient and global efficiency) provided unique information about the relationship between the brain and behavior. As such, the participation coefficient allowed us to identify which SMART participants showed the greatest improvement in trail-making scores, whereas the global efficiency indexed overall performance of trail-making scores for each of the SMART participants (Figure 4, Figure S5). Furthermore, the spatial patterns of correlations of the participation coefficient and global efficiency with trail-making scores minimally overlapped (Figure 5, Figure S6). Our observed brain-behavior relationships demonstrate the utility (ie, interpretability and specificity) of using network measures for neurorehabilitation in TBI.
There are some limitations to our study. First, the participants had mixed TBI backgrounds, including initial injury severity, civilians and veterans, and subclinical-but-residual psychiatric symptoms. Although we further characterized training-induced changes in brain network according to various TBI backgrounds, future studies with more homogeneous TBI samples could provide clearer interpretations. Second, spatial information was not fully incorporated at the stage of hypothesis testing to circumvent the issue of multiple comparisons across 265 brain regions. Rather than performing statistical analysis region by region, we used omnibus measures (ie, the total number of brain regions that showed neuroplasticity) to confirm our hypothesis of training-induced neuroplasticity at the whole-brain level while correcting for multiple comparisons across network densities. Nonetheless, after supporting our hypothesis, we identified the spatial patterns of training-induced changes in the network-based measures as an exploratory analysis. Third, though it is reported that 4 minutes of rsfMRI scans is sufficient for reliable estimate of resting-state functional connectivity, 38 the scan duration after scrubbing was relatively short. In all, 11% (16/142) of rsfMRI scans had 4 to 5 minutes of data after scrubbing, and we trimmed entire rsfMRI scans to this minimum number of frames after scrubbing to account for different number of runs across scans. A previous study reported that increased scan duration from 5 to 13 minutes improved the reliability of rsfMRI scans 57 ; thus, 4 minutes of scan may not be sufficient. In this context, our findings could be more reliable if we addressed the issue of in-scan participant motion earlier. Next, there were overlaps of data between the current report and our previous studies. Our current findings would be more generalizable and stronger if we used independent data. Finally, individual differences in training-induced neuroplasticity in TBI are unknown because we focused on group analyses. The heterogeneity of training response in our current study is expected given the overall variability within TBI outcomes. Thus, our future research includes attempting to identify a neuroimaging biomarker to predict training-induced neuroplasticity based on network patterns at the pretraining stage.
In conclusion, we demonstrated that cognitive training reorganized modular networks in TBI. Our findings highlighted that training-induced neuroplasticity in TBI could occur over the whole brain. Thus, resting-state brain networks quantified by graph-theoretic measures (ie, the modularity, module-based connectivity, and network efficiency) may be sensitive brain-based markers of training efficacy in TBI.
Supplemental Material
Modularity_Training_Manuscript_R2_Supplemental_20190628 – Supplemental material for Cognitive Training Reorganizes Network Modularity in Traumatic Brain Injury
Supplemental material, Modularity_Training_Manuscript_R2_Supplemental_20190628 for Cognitive Training Reorganizes Network Modularity in Traumatic Brain Injury by Kihwan Han, Sandra B. Chapman and Daniel C. Krawczyk in Neurorehabilitation and Neural Repair
Footnotes
Acknowledgements
The authors would like to thank all study participants and their families who supported this study. Thanks also go out to Mr Jameson Miller for recruiting participants, Mr Weikei Yu and Mr Michael Holloway for acquiring MRI scans, Ms Tiffani Jantz and Ms Jelena Rakic for acquiring psychological functioning scores, Dr Asha Vas and Ms Molly Keebler for administering the training programs, and Mr Barry Rodgers for assisting in the analysis of psychological functioning scores.
Supplemental Material
Authors’ Note
Clinical trial registration number: NCT01552473.
Declaration of Conflicting Interests
The authors declared no potential conflicts of interest with respect to the research, authorship, and/or publication of this article.
Funding
The authors disclosed receipt of the following financial support for the research, authorship, and/or publication of this article: This work was supported by the Department of Defense (W81XWH-11-2-0194 to DCK and W81XWH-11-2-0195 to SBC), the Meadows Foundation to DCK and SBC, and the Sapphire Foundation Distinguished New Scientist Award and the Friends of BrainHealth Distinguished New Scientist Award to KH. The views and opinions expressed in this article are those of the authors and do not reflect the official policy or position of the US Department of the Army, US Department of the Air Force, US Department of Defense, US Government, or the affiliated institutions.
References
Supplementary Material
Please find the following supplemental material available below.
For Open Access articles published under a Creative Commons License, all supplemental material carries the same license as the article it is associated with.
For non-Open Access articles published, all supplemental material carries a non-exclusive license, and permission requests for re-use of supplemental material or any part of supplemental material shall be sent directly to the copyright owner as specified in the copyright notice associated with the article.