
Abstract
Background. Persons with stroke (PwS) are at increased risk of falls, especially toward the paretic side, increasing the probability of a hip fracture. The ability to recover from unexpected loss of balance is a critical factor in fall prevention. Objectives. We aimed to compare reactive balance capacity and step kinematics between PwS and healthy controls. Methods. Thirty subacute PwS and 15 healthy controls were exposed to forward, backward, right, and left unannounced surface translations in 6 increasing intensities while standing. Single step threshold, multiple step threshold, and fall threshold (ie, perturbation intensity leading to a fall into harness system) were recorded as well as reactive step initiation time, step length, and step velocity. Results. Twenty-five PwS fell into harness system during the experiment while healthy controls did not fall. Fourteen out of 31 falls occurred in response to surface translations toward the nonparetic side, that is, falling toward the paretic side. Compared with healthy controls, PwS demonstrated significantly lower fall threshold and multiple step threshold in response to forward, backward, and lateral surface translations. Impairments were more pronounced in response to forward surface translation and toward the nonparetic side (ie, loss of balance toward the paretic side). A trend toward significant shorter step length in response to lateral surface translations was found in PwS compared with healthy controls. Conclusions. Findings highlight the importance of assessing reactive balance capacity in response to perturbations in different directions and intensities in addition to the routine assessment in PwS.
Keywords
Introduction
Falls are among the most common medical complications after stroke. About 70% of persons with stroke (PwS) fall during the first 6 months after discharge from hospital or rehabilitation setting and it remains a considerable health concern throughout their life span.1-4 The proportion of falls leading to injury in PwS is up to 69%. 4 Moreover, compared with the general population of older adults who fall, PwS who fall are twice as likely to sustain a hip fracture, mostly involving the affected side.2,5-8 In addition, to physical consequences associated with fractures and related injuries, falls may have serious psychological and social consequences such as functional decline, poor quality of life, dependency, social isolation, and depression. 8
The ability to execute a successful reactive response to a sudden loss of balance, that is, unexpected balance perturbation, is a critical factor that determines whether a fall occurs. 9 Although many falls among PwS living in the community occur due to inability to recover from balance loss during walking, 10 Mansfield et al 11 found that impaired reactive balance control during both standing and walking predicted increased risk of falls in PwS. Commonly used clinical instruments assessing balance and gait in PwS, such as the Berg Balance Scale, 12 Timed Up and Go,13,14 Dynamic Gait Index, 15 the Performance Oriented Mobility Assessment (POMA), 16 and the miniBESTest 17 can identify patients with balance impairments and risk for falls; however, they have limitations in their usage especially in respect to assessing the ability to recover from unexpected loss of balance and indicating specific impairments contributing to falls. Perturbations i.e., sternal pushes, are provided in the POMA, but a warning is given. In the miniBESTest the patient leans against the examiner’s resistance who then releases it, but here the direction and timing of perturbation is predicted. Thus, neither instrument assesses the ability to recover from unexpected loss of balance. Assessing balance recovery abilities using a horizontal platform translation system that moves unexpectedly may be more ecologically valid since it provides perturbation types, that is, slip or trip, similar to unexpected loss of balance that frequently precedes falls in real life. 18 This may also resolve many of these issues by providing a high level of unpredictability.
Studies have documented characteristics of reactive stepping performances in stance that were associated with falls in older adults19-23: initiating reactive step responses at lower levels of instability (ie, lower step threshold),19,22,23 failure to recover equilibrium19,24 and taking multiple balance recovery steps rather than a single step response.19-21,25,26 Recent studies in PwS have shown impaired stepping reactions characterized by the need for assistance, inability to step with either lower limb, multiple step strategy, and falls.11,27-29 Also, PwS demonstrated lower postural stability at step touch-down in response to slip-like forward perturbations (posterior center of mass position and larger backward center of mass velocity relative to base of support) and shorter step length compared with healthy controls. 30 However, these studies have focused on responses to large perturbations, provided at a single intensity in forward and backward directions. Providing unexpected multidirectional perturbations (forward, backward, and sideways) may be the closest approach to simulate a fall in real life, which is unexpected and may occur to all directions. There is relatively little information regarding characteristics of reactive balance strategies to lateral loss of balance in PwS. This is specifically important in PwS suffering from unilateral hemiparesis, since lateral perturbations involve different biomechanical demands than forward or backward perturbations. Also, in many falls a second lateral loss of balance that followed forward or backward step was frequently seen in older adults. 7 The fact that PwS tend to fall toward the paretic side10,31 highlights the clinical importance of studying these reactions in response to multidirectional perturbations.
Reactive balance assessment that includes increased perturbation intensities enables assessment of reactive balance capacity through measures such as single step threshold and multiple step threshold as was recently reported in chronic PwS. 32 To our knowledge, fall threshold (ie, perturbation intensity that results in a fall into harness system) that might be a more direct measure of inability to prevent a fall in real life, has not yet been studied in PwS. Therefore, the main aim of the study was to compare single step threshold, multiple step threshold, and fall threshold in response to increasing intensities of unannounced random forward, backward, right, and left surface translations between PwS and healthy controls. Single step threshold is defined as the minimum perturbation intensity that consistently elicits a single compensatory step in at least 2 consecutive perturbations; multiple step threshold is defined as the minimum perturbation intensity that consistently elicits 2 or more compensatory steps in at least 2 consecutive perturbations and fall threshold is defined as the perturbation intensity that results in unsuccessful balance recovery, that is, fall into harness system.33-35 We hypothesized that similarly to de Kam et al 32 who tested recovery stepping in chronic PwS, subacute PwS in our study would demonstrate lower single step threshold, lower multiple step threshold as well as lower fall threshold compared with healthy controls. Our second aim was to explore differences in kinematics of reactive step responses between PwS and healthy controls. We hypothesized that similar to Salot et al 30 who reported shorter step length in response to forward perturbations, PwS in our study would exhibit impaired kinematics of step recovery responses, that is, delayed step initiation, shorter step length, and lower step velocity in all 4 directions. Based on previous studies conducted in persons with Parkinson’s disease36,37 and multiple sclerosis, 38 we further hypothesized that reactive balance impairments would be more pronounced in response to forward surface translation than to backward surface translation and in response to translations toward the nonparetic side (ie, falling toward the paretic side) than toward the paretic side in PwS.
Methods
Participants
Thirty patients with first unilateral stroke and 15 healthy adults participated in the study (Table 1). PwS were recruited during their hospitalization at the Loewenstein Rehabilitation Hospital (LRH), Ra’anana, Israel as part of a baseline assessment in an ongoing randomized control trial (RCT) aiming to examine the effect of perturbation-based balance training on reactive balance responses in PwS (ClinicalTrials.gov #NCT02619175). Healthy participants were recruited through flyers (age range 40-75 years). Participants had to be able to stand for at least 2 minutes and to walk independently or under supervision with or without a walking aid. Exclusion criteria included other neurological disorders in addition to stroke, significant musculoskeletal conditions (eg, severe arthritis, joint replacement surgery) and significant visual impairment. Participants signed a written informed consent in accordance with approved procedures by the Helsinki Ethics Committee, LRH (#LOE-14-0021).
Subjects Characteristics. a
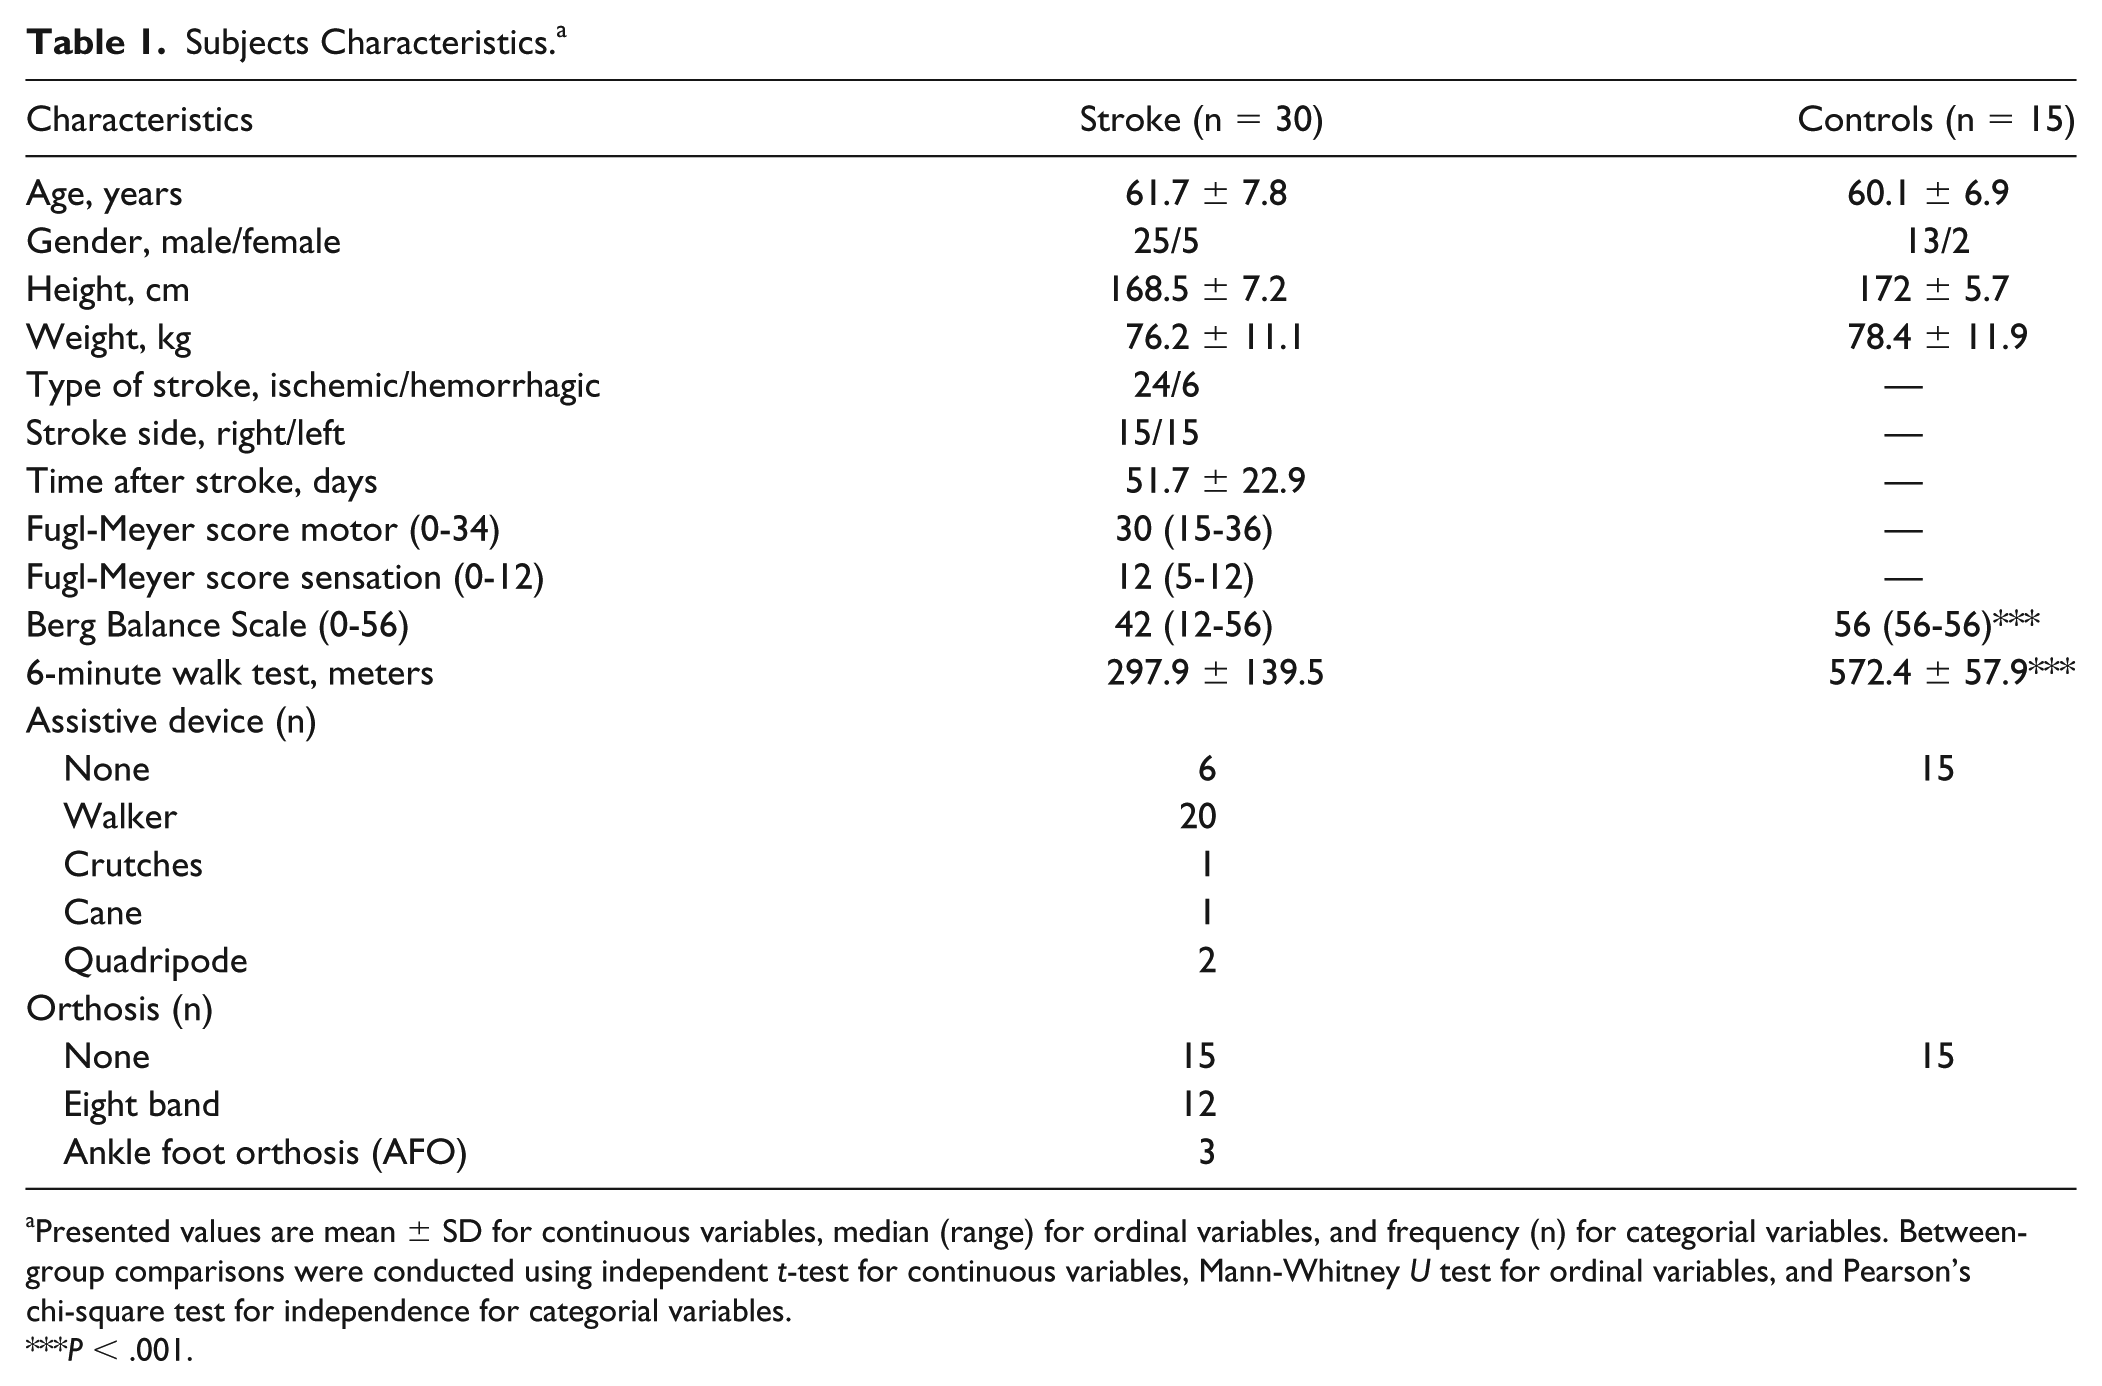
Presented values are mean ± SD for continuous variables, median (range) for ordinal variables, and frequency (n) for categorial variables. Between-group comparisons were conducted using independent t-test for continuous variables, Mann-Whitney U test for ordinal variables, and Pearson’s chi-square test for independence for categorial variables.
P < .001.
Study Protocol
Participants stood on a computerized treadmill system with a horizontal movable platform (Balance Tutor, MediTouch, Israel), wearing a safety harness that prevented falls but did not restrict their movements. Walking aid usage was not allowed during the assessment. Participants were instructed to stand with feet placed together and to react naturally to prevent themselves from falling in response to random unannounced forward, backward, right, and left surface translations with time interval of 25 to 30 seconds between perturbations. Participants were informed neither of the direction nor the timing of perturbations. Surface translations were increased systematically in six intensities from low (intensity 1) to high (intensity 6) for a total of 24 perturbation trials (characteristics of perturbation intensities are described in Table 2). In this study, perturbation direction refers to the direction of the platform translation. In case of a fall into harness, determined by visual inspection of 2 physical therapists, the participant did not continue to higher intensity. Seated rest breaks were given between trials if needed. Participants performed all trials wearing their own sport shoes and foot orthosis in case they needed ankle support.
Perturbation Characteristics.
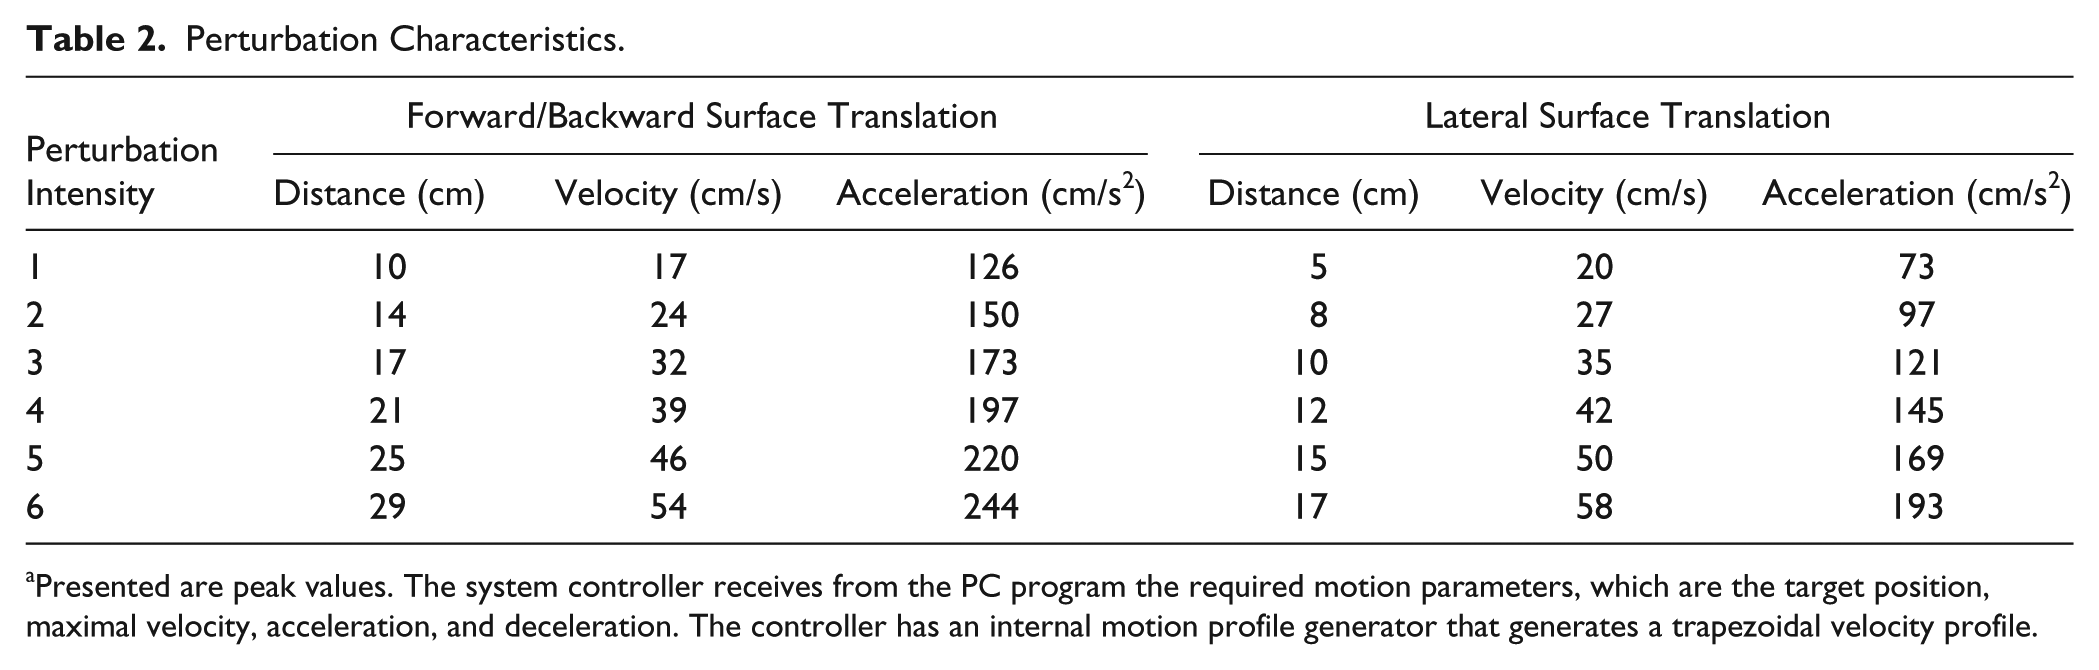
Presented are peak values. The system controller receives from the PC program the required motion parameters, which are the target position, maximal velocity, acceleration, and deceleration. The controller has an internal motion profile generator that generates a trapezoidal velocity profile.
Prior to reactive balance control assessment, PwS underwent clinical assessment including the Fugl-Meyer Assessment, Berg Balance Scale (BBS), and 6-Minute Walk Test (6MWT). The clinical assessment for healthy participants included the 6MWT and BBS only.
Data Collection and Analysis
A 2-camera motion capture system with a sampling rate of 60-Hz was used to record body kinematics (APAS, Ariel Dynamics Inc, Trabuco Canyon, CA, USA). Cameras were mounted 4 meters in front of the perturbation system at an angle of 45° between each camera and the subject’s standing position, at a height of 2.5 m. Eight reflective markers were placed on the skin bilaterally on the following landmarks: midline of the anterior aspect of ankle joints, anterior superior iliac spines, shoulder acromion processes and radial styloid processes and 2 additional markers were placed on the moving platform to identify perturbation onset. 33 The raw marker data were mapped onto a 3D coordinate system using an internal direct linear transformation algorithm. Data were recorded, digitized, transformed, and low-pass filter smoothed (Butterworth second-order forward and backward passes) with a cutoff frequency of 5-Hz. This approach was shown to be valid and reliable, that is, mean point estimate error of <3.5 mm, 1.4 mm mean linear error, and 0.26° mean angular error. 39
Our primary outcome measures included the fall threshold and the multiple step threshold. Balance recovery strategies following perturbations were identified by visual inspection of the videos: (1) no step, (2) single step, (3) multiple step (≥2 steps), and (4) fall into harness system, that is, when a subject is unambiguously supported by the harness system.34,35 In case a participant did not fall at perturbation intensity 6, his or her fall threshold was calculated as intensity 7.
Secondary outcome measures included the single step threshold and spatiotemporal characteristics of the reactive step response. Single step threshold and multiple step threshold have been shown to demonstrate high test-retest reliability in young adults. 40 Also, high interobserver reliability for step threshold, multiple step threshold and fall threshold was found in older adults. 33 The spatiotemporal events extracted from the collected data were analyzed by customized semiautomated program written in C# (Microsoft, 2000) specifically for this study protocol 33 : (1) The surface translation was detected as the first horizontal deviation of the marker placed on the treadmill greater than 3 standard deviations from the average baseline noise. (2) First step lift-off the ground was defined at the first deviation of the marker placed on the swinging leg ankle joint in the vertical direction, greater than 4 mm from the average baseline after the surface translation. (3) Step initiation (ms) was calculated as the time from surface translation to foot off the ground. 4) Foot-contact the ground poststepping was defined as the swinging leg ankle joint marker was placed on the ground completing the step, that is, same ground level as the vertical baseline marker placement. (5) Step duration (ms) was calculated as the time from step initiation, that is, foot off the ground to foot contact. (6) First step length was calculated as the Euclidian distance (cm) that the ankle markers displaced from step initiation to foot contact. (7) The average step velocity (m/s) was calculated as step length divided by step duration. During data analysis, foot off and foot contact were verified through visual inspection of the ankle marker. For the stroke group video recordings were viewed to determine the leg that initiated the reactive step response (ie, paretic leg or nonparetic leg).
Sample Size Estimation
Separate calculations were performed to determine sample size requirements based on multiple step threshold and kinematic parameters (ie, step length), that earlier found to be different between PwS and healthy controls.30,32 Based on results by de Kam et al, 32 the multiple step threshold was 2.2 m/s2 in PwS and 4.0 m/s2 in controls. Based on data reported by Salot et al, 30 the step length in response to forward perturbation was 0.05 m for PwS and 0.09 m for controls. Using net reduction values (1.8 m/s2 and 0.04 m, respectively) in combination with the initial variance estimates (standard deviations of 1.3 m/s2 and 0.045 m, respectively), it was determined that 9 and 14 participants per group would be required to be able to reject the null hypothesis with level of significance (α) of 0.05 and power (1 − β) of 0.8 (Power and Sample Size calculations, version 3.0).
Statistical Analysis
For statistical analysis, SPSS version 24.0 was used (IBM Corp). Normality of data was evaluated using the Shapiro-Wilk test. Subjects’ characteristics and clinical measures of balance and gait were compared between the 2 groups using independent t-test (age, weight, height, 6-minute walk test), Mann-Whitney U test (Berg Balance scale), and Pearson’s chi-square test for independence (gender and assistive devices) (Table 1).
The generalized linear models for ordinal variables (cumulative logit ordinal logistic regression) was conducted to test differences in fall threshold between groups. Differences in frequencies of falls by direction were tested using Pearson’s chi-square test for goodness of fit.
Multiple step threshold and single step threshold were assessed in response to all 4 surface translation directions. Therefore, group effect (PwS vs healthy controls), direction effect (forward vs backward; right vs left) and group-by-direction interaction (eg, whether performance in response to each direction of surface translation was similar between PwS and healthy controls) were tested using the generalized estimating equations for ordinal variables, with direction as within-subjects effect and group as between-subjects effect. Note: for the stroke group we compared between surface translations toward the paretic versus nonparetic side instead of toward right versus left. Significance levels were set at P < .0125 in order to adjust for multiple comparisons and trend levels were set at P < .05. Kinematic analysis for reactive step measures was conducted only for stepping responses at intensity 4, since stepping responses were not frequently induced at low perturbation intensities in healthy controls and most PwS were not able to recover balance loss at higher perturbation intensities. Since data were nonnormally distributed, group effect, direction effect, and group-by-direction interaction were tested using the generalized estimating equations for continuous variables, with Gamma link function, with direction as within-subjects effect and group as between-subjects effect. Significance levels were set at P < .008 in order to adjust for multiple comparisons.
All comparisons were repeated using the Mann-Whitney U test for group effects and the Wilcoxon signed-rank test for direction effects yielding similar results.
Cohen’s d effect size (ES) of group difference was calculated by taking the difference between the means of both groups divided by the average population standard deviation. The following guidelines were used when interpreting effect size magnitudes: 0.2 was considered small, 0.5 was considered medium, 0.8 was considered large, 1.2 was considered very large, and 2.0 considered huge. 41
Results
A total of 478 balance recovery trials in PwS and 359 in healthy controls were analyzed. In the stroke group, 6 trials were not analyzed; 4 due to technical difficulties in the motion capture system and 2 as the participant asked to stop before test completion due to fatigue. In the healthy control group, one trial was unavailable for data analysis due to technical difficulties in the motion capture system. Twenty-five PwS fell into harness system during the experiment and according to protocol we did not continue to higher intensities than the intensity that resulted in a fall. Thus, they did not complete all 24 perturbations (Table 3).
Frequencies of Falls Into Harness, That Is, Failed Balance Recovery Responses and Number of Persons With Stroke Who Fell, by Perturbation Intensity and Direction.
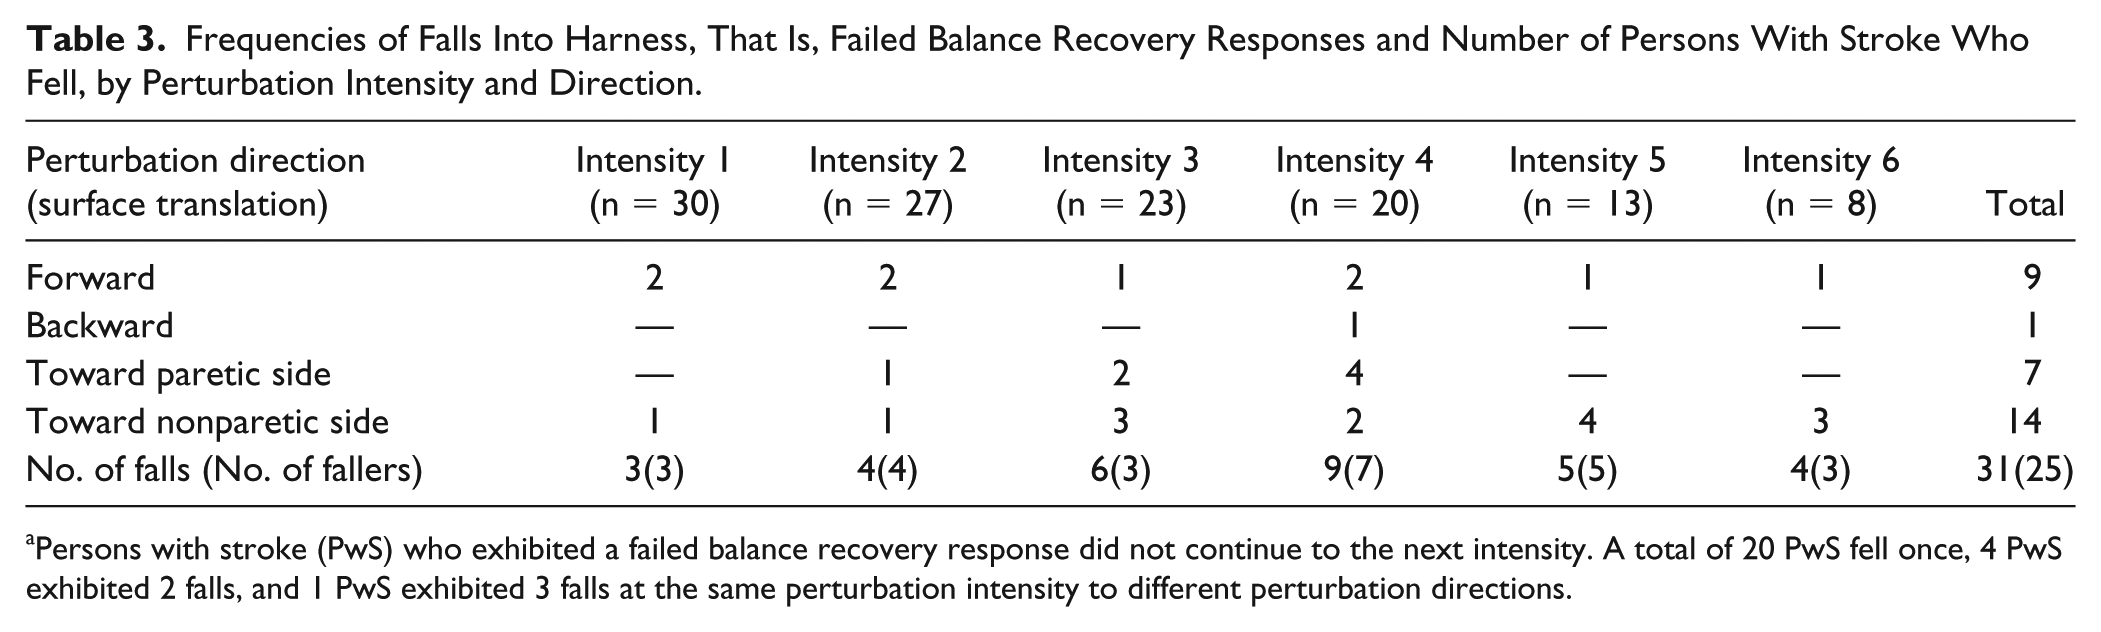
Persons with stroke (PwS) who exhibited a failed balance recovery response did not continue to the next intensity. A total of 20 PwS fell once, 4 PwS exhibited 2 falls, and 1 PwS exhibited 3 falls at the same perturbation intensity to different perturbation directions.
Fall Threshold
Thirty-one falls were observed in 25 of 30 PwS (83.3%), and none in healthy controls. Frequencies of falls in PwS by perturbation intensity and direction are presented in Table 3. Fall threshold was significantly lower in PwS compared with healthy controls, B = 4.3, Wald χ2(1) = 14.6, P < .001; ES = 1.63. Significant differences were found in falls direction in PwS, χ2(3) = 11.194, P = .011, demonstrating higher frequency of falls in response to surface translations toward the nonparetic side (ie, falling toward the paretic side) and lower frequency of falls in response to backward surface translations.
Multiple Step Threshold
In response to forward and backward surface translations, significant main effects of group, B = 2.8, Wald χ2(1) = 13.1, P < .001, and direction, B = −1.1, Wald χ2(1) = 6.9, P = .009, were found. PwS demonstrated significantly lower multiple step thresholds compared with healthy controls. Multiple step thresholds were lower in response to forward compared with backward surface translations. A trend toward significant group-by-direction interaction was found, B = −1.4, Wald χ2(1) = 5.9, P = .015 (Table 4). Simple effects analysis revealed that the difference between groups was larger in response to backward compared with forward surface translations (P < .001 and P = .042, respectively).
Comparisons of Multiple Step Thresholds and Single Step Thresholds by Group and Direction of Surface Translations.
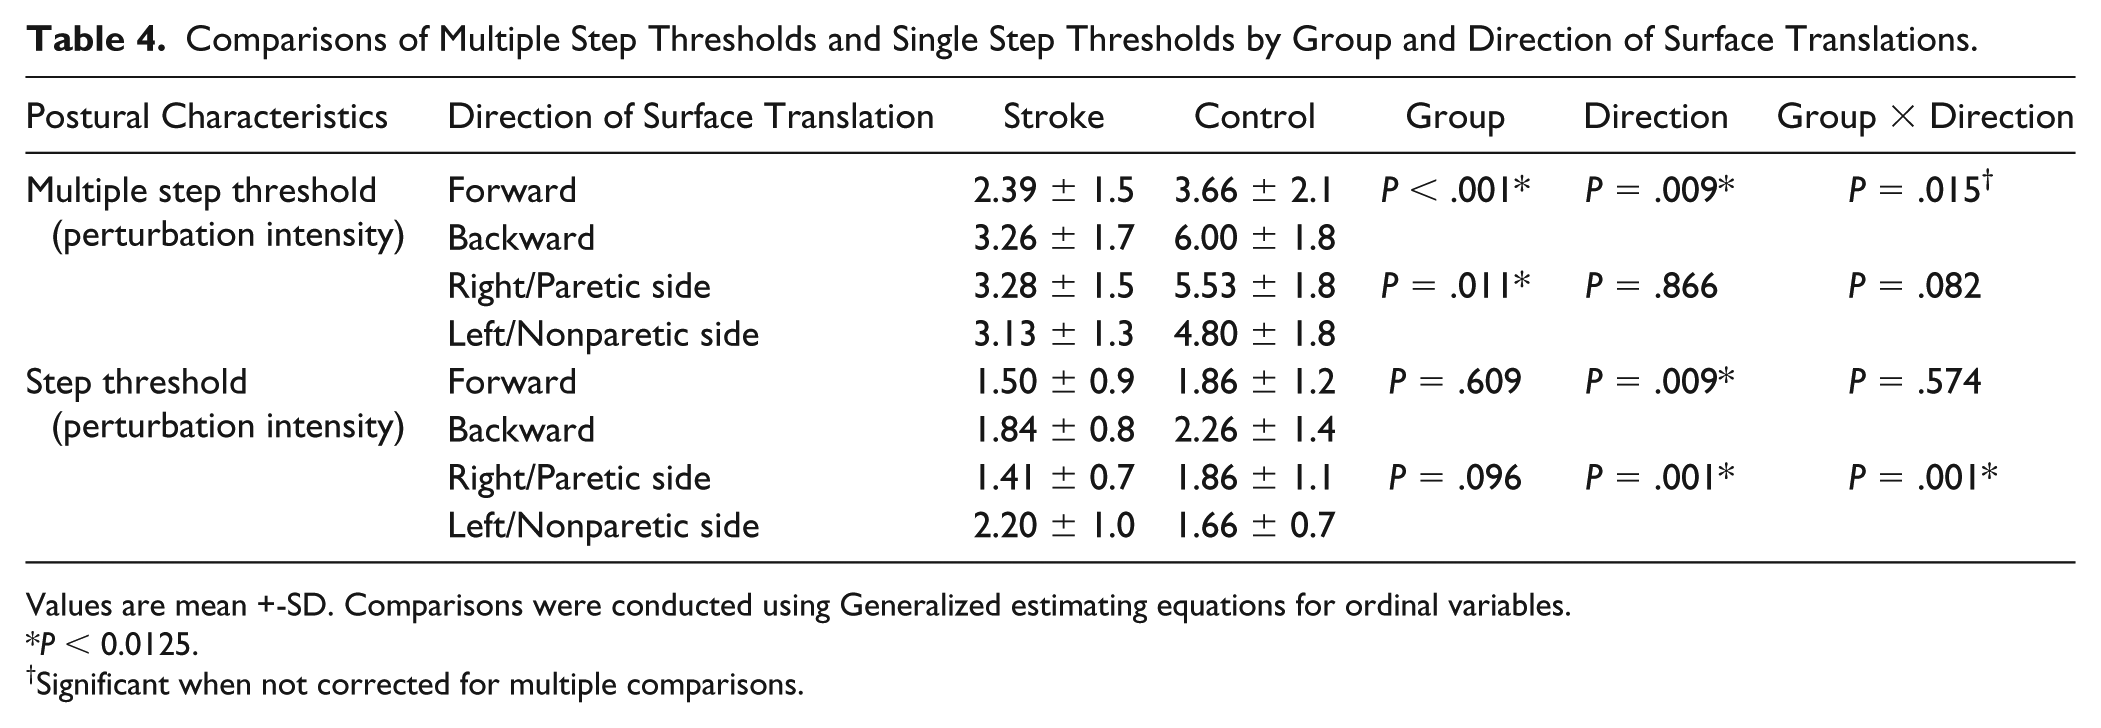
Values are mean +-SD. Comparisons were conducted using Generalized estimating equations for ordinal variables.
P < 0.0125.
Significant when not corrected for multiple comparisons.
In response to lateral surface translations, significant main effect of group was found, B = 1.6, Wald χ2(1) = 6.5, P = .011, demonstrating lower multiple step thresholds in PwS versus healthy controls regardless of direction (P = .001 and P = .006 in response to surface translations toward the paretic side vs right side and toward the nonparetic side vs left side, respectively). No significant main effect of direction or group-by-direction interaction were found, B = 0.09, Wald χ2(1) = 0.03, P = 0.866 and B = 1.4, Wald χ2(1) = 3.0, P = .082, respectively (Table 4).
Also, large effect sizes for multiple step threshold were found in response to forward (ES = 0.69), backward (ES = 1.26), to right/paretic side (ES = 1.07), and to left/nonparetic side (ES = 0.95).
Single Step Threshold
In response to forward and backward surface translations, significant main effect of direction was found, B = −1.0, Wald χ2(1) = 6.8, P = .009. Participants initiated a step response at lower perturbation intensities (ie, lower step threshold) in response to forward versus backward surface translations. No significant main effect of group and group-by-direction interaction were found, B = 0.3, Wald χ2(1) = 0.2, P = .609 and B = 0.3, Wald χ2(1) = 0.3, P = .574, respectively.
In response to lateral surface translations, significant main effect of direction, B = −1.8, Wald χ2(1) = 10.9, P = .001, and significant group-by-direction interaction, B = 2.047, Wald χ2(1) = 10.344, P = .001, were found. Simple effects analysis revealed that PwS demonstrated lower step threshold in response to surface translations toward the paretic side compared with the nonparetic side (P = .001) while step threshold did not differ between directions (right vs left) in healthy controls (P = .542).
Small to medium effect sizes were found for single step threshold in response to forward (ES = 0.35), backward (ES = 0.40), right/toward the paretic side (ES = 0.51), and left/toward the nonparetic side (ES = 0.58).
Spatiotemporal Parameters of Recovery Step
Step Initiation
A trend toward significant main effect for direction was found in response to lateral surface translations, B = −47.5, Wald χ2(1) = 5.5, P = .019 (Table 5). Participants initiated a reactive step response earlier in surface translations toward the paretic/right side versus nonparetic/left side. No significant main effect for group or group-by-direction interaction were found, B = 8.5, Wald χ2(1) = 0.1, P = .720 and B = −5.9, Wald χ2(1) = 0.03, P = .851, respectively. Effect sizes were small for forward (ES = 0.32), backward (ES = 0.05), toward right/paretic side (ES = 0.03), and toward left/nonparetic side (ES = 0.12).
Comparisons of Reactive Step Kinematics by Group and Direction of Surface Translations. a
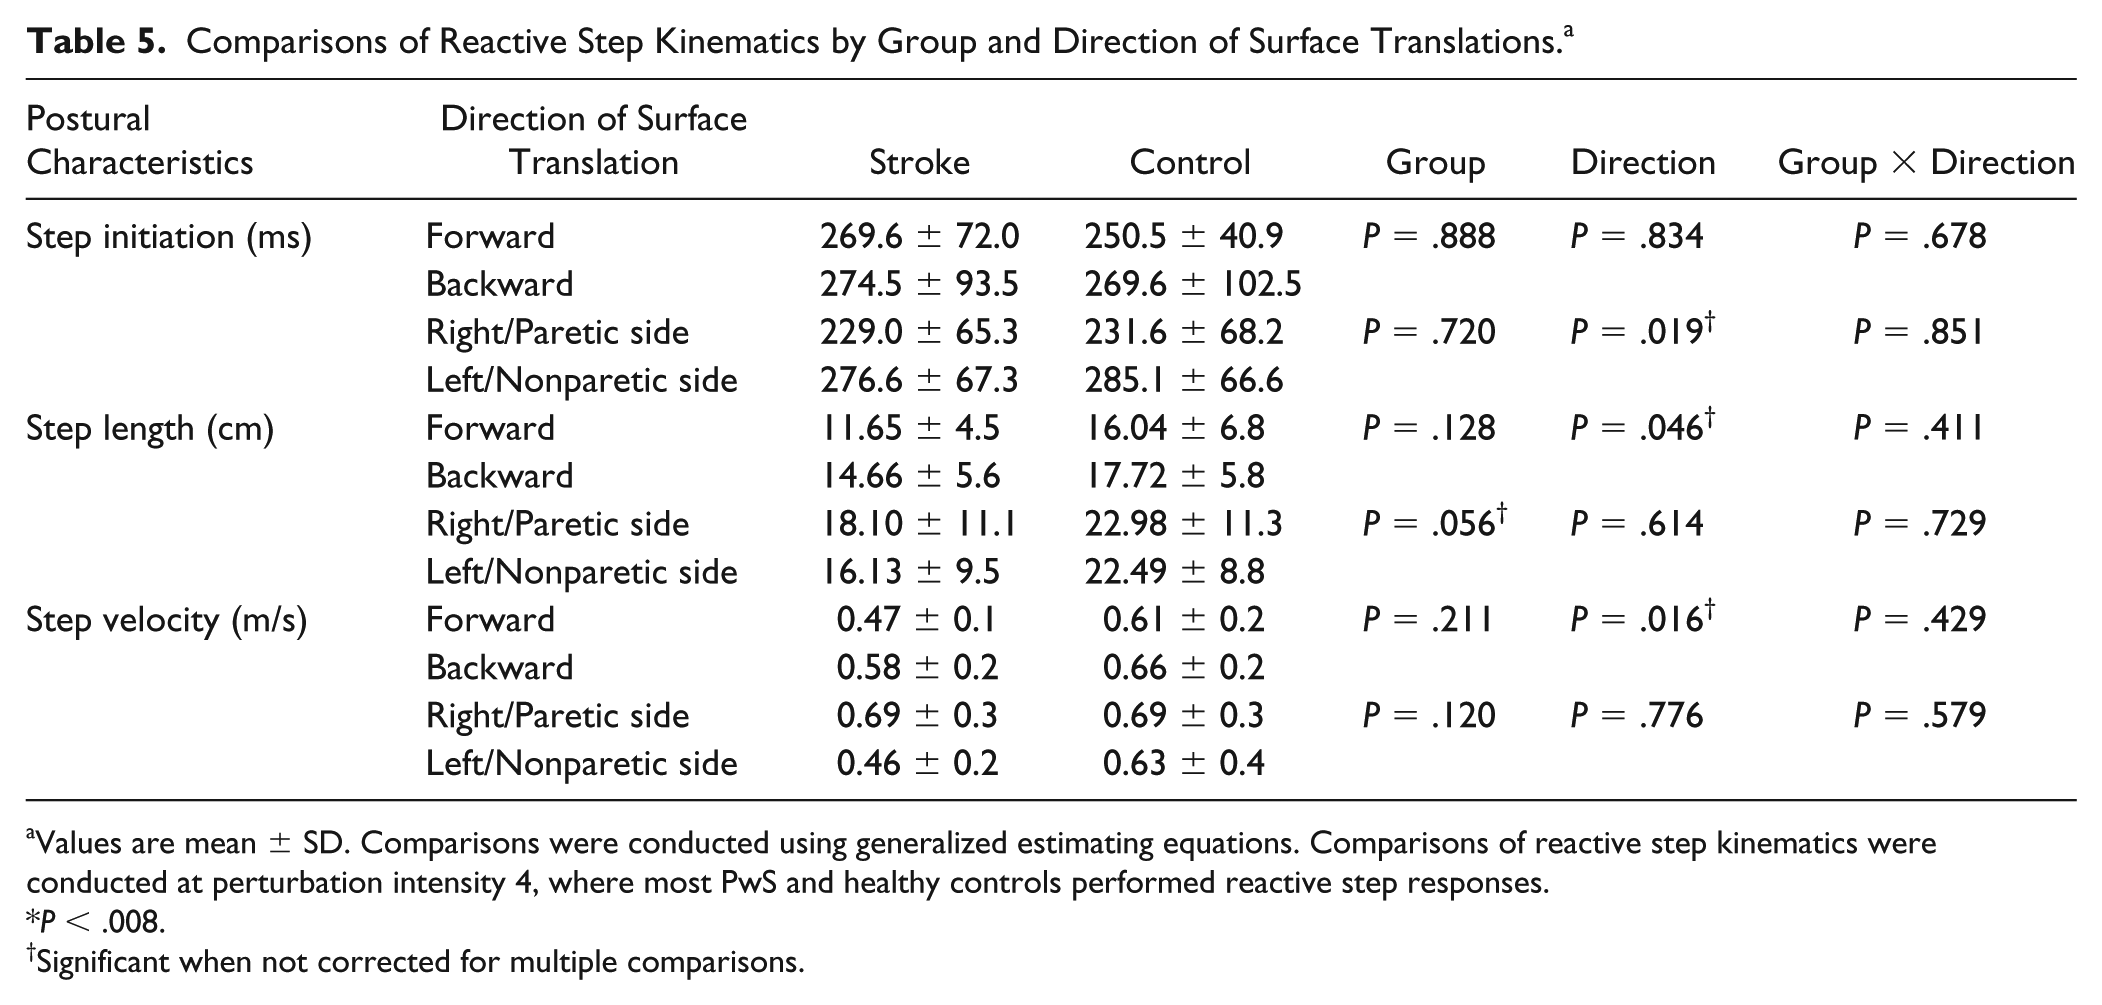
Values are mean ± SD. Comparisons were conducted using generalized estimating equations. Comparisons of reactive step kinematics were conducted at perturbation intensity 4, where most PwS and healthy controls performed reactive step responses.
P < .008.
Significant when not corrected for multiple comparisons.
Step Length
A trend toward significant main effect for direction was found in forward and backward surface translations, B = −0.230, Wald χ2(1) = 3.964, P = .046 (Table 5). Participants performed a shorter step in response to forward versus backward surface translations. No significant main effect for group or group-by-direction interaction were found, B = 0.1, Wald χ2(1) = 2.3, P = .128 and B = 0.1, Wald χ2(1) = 0.676, P = .411.
In response to lateral surface translations a trend toward significant group effect was found, B = 0.333, Wald χ2(1) = 3.641, P = .056. Step length was shorter in PwS compared with healthy controls. Analysis of group effect within each direction showed significant shorter step for PwS compared with healthy controls in response to surface translations toward the nonparetic side/left side (P = .048). No significant effect for direction or group-by-direction interaction were found, B = 0.11, Wald χ2(1) = 0.25, P = .614 and B = −0.09, Wald χ2(1) = 0.120, P = .729. Small to medium effect sizes were found in response to forward (ES = 0.72), backward (ES = 0.52), right/paretic (ES = 0.43), and left/nonparetic surface translations (ES = 0.66).
Step Velocity
A trend toward significant main effect for direction was found in response to surface translations to forward and backward directions, B = −0.111, Wald χ2(1) = 5.794, P = .016 (Table 5). Participants performed a slower step in response to forward versus backward surface translations. No significant main effect for group or group-by-direction interaction were found, B = 0.08, Wald χ2(1) = 1.5, P = .211; B = 0.06, Wald χ2(1) = 0.6, P = .429). Medium to large effect sizes were found in response to forward (ES = 0.82), backward (ES = 0.44), right/paretic (ES = 0.75), and left/nonparetic (ES = 0.56) surface translations.
Observations of the video recordings showed that in response to forward and backward surface translations most reactive step responses were initiated with the nonparetic leg (78.9% and 73.7%, respectively). In response to surface translations toward the nonparetic side (ie, the nonparetic leg was unloaded), 89.5% of recovery step responses were initiated with the nonparetic leg. However, in response to surface translations toward the paretic side (ie, the paretic leg was unloaded), 70% of reactive step responses were initiated by the paretic leg.
Discussion
Our results are in line with previous studies demonstrating lower ability to recover balance and prevent falls in response to laboratory-induced perturbations in PwS.30,35,42-44 We have extended previous findings by (1) examining reactive balance in response to multidirectional perturbations, with an emphasis on lateral perturbations, which might be more challenging for PwS suffering from unilateral hemiparesis and (2) identifying perturbation intensity leading to insufficient balance recovery (ie, fall threshold). We found that subacute PwS demonstrated impaired reactive balance control as shown by lower multiple step thresholds and fall thresholds. Multiple step threshold is considered as a strong predictor for falls in older adults. 26 PwS in our study performed more than one step to recover balance loss in response to forward, backward, and lateral unexpected surface translations (Table 4). This is in line with de Kam et al 32 who found similar results in chronic PwS.
In addition, we found significantly lower fall threshold in PwS. Assessing the perturbation intensity and direction that results in a failure to prevent a fall (ie, fall threshold) has not yet been studied in PwS. Lower fall threshold in PwS may serve as a more direct measure of the inability to prevent a fall during loss of balance in real-life. Eighty-three percent of PwS (25 of 30) experienced a fall into harness system during the examination, especially during loss of balance toward the paretic side (45% of falls, Table 2). No falls were observed in healthy controls (ES = 1.63). This is an important finding since Mansfield et al11,44 found that measures of reactive balance control in the laboratory predict falls in subacute PwS.
The high laboratory fall rates observed in our study may be a result of shorter step length (marginally significance for group effect, Table 5) and lower reactive step velocity (medium to large effect sizes) in PwS rather than delayed step initiation time (Table 5). This indicates that PwS are able to initiate recovery step rapidly, but fail to execute the step effectively, which may be the main reason for many of the falls in PwS. This is consistent with Salot et al 30 who found no significant difference in step initiation time, that is, the time from perturbation to foot lift, between PwS and age-matched controls. Other studies, however, have shown that PwS have delayed paretic leg muscle onset latencies following perturbations while standing compared with their nonparetic limb and compared with healthy controls.32,45-48 These studies used EMG analysis while we and Salot et al 30 used kinematic analysis of limb movement. Thus, differences in measurement methods can explain these differences. Our results suggest that although motor nerve conduction velocities might be slower in PwS,49,50 PwS initiated a step response comparable to healthy controls. Previous study showed that healthy individuals were able to “resist” stepping and thus demonstrated delay foot lift by decelerating the moving center of mass toward the base of support by a greater limb muscle strength and by performing arm and trunk movements. 9 Thus, unlike PwS, healthy controls might have delayed the initiation of reactive step response. In the current study, 70% of steps in response to surface translations toward the paretic side were initiated with the paretic leg. The ability to swing the paretic leg rapidly (ie, step velocity) to the target location depends on neuro-motor mechanisms related to the build-up of muscle force and power generation. A decreased muscle force and power generation capacity of the paretic leg muscles was found previously. 51 This may be a consequence of reduction in muscle cross sectional area and impaired ability to recruit large amount of motor units in the paretic muscles after stroke.52-54
In response to forward, backward, and toward nonparetic side surface translations, most step responses were initiated with the nonparetic leg (78.9%, 73.7%, and 89.5%, respectively). The medium effect size that was found in the current study for step length, especially in response to forward and backward perturbations (ES = 0.72 and ES = 0.52, respectively) and the trend toward significant shorter step length in response to surface translations to nonparetic side in PwS compared with healthy controls (Table 5) suggests difficulty to fully bear weight on the paretic leg while executing a long recovery step with the nonparetic leg. Hsiao et al 55 demonstrated deficits in lateral weight transfer in PwS, which was related to propulsive lower limb muscle force capacity. This was supported by Kirker et al 56 who found weak gluteus medius hemiparetic muscle response during self-initiated sideways movement before stepping with the nonparetic leg. The higher fall rates in response to nonparetic surface translations, that is, when fall was initiated toward the paretic side and the higher single step threshold in response to nonparetic versus paretic surface translations further suggest difficulty to accept full body weight on the paretic leg when initiating a step with the nonparetic leg. This was supported by de Kam et al 57 demonstrating that weightbearing asymmetry in favor of the nonparetic leg in PwS, increased the step threshold in response to lateral surface translation toward the nonparetic side.
Balance recovery impairments in PwS were more pronounced in response to forward surface translations (ie, backward loss of balance) compared with backward surface translations (ie, forward loss of balance). Multiple step thresholds and single step thresholds were significantly lower in response to forward versus backward surface translations in PwS and healthy controls (Table 4). PwS also experienced higher fall rates in response to forward versus backward surface translations (9 falls vs 1 fall, Table 3). This was also found previously in patients with Parkinson’s disease,36,37 multiple sclerosis, 38 and healthy subjects 58 and might be a result of less effective visual feedback and/or due to a smaller distance of the COM from base of support provided by the feet in backward than forward loss of balance.38,58 The high frequency of laboratory falls among PwS found in our study together with data indicating high fall rates especially during the first 6 months after discharge from hospitalization3-6 highlights the importance of reactive balance control assessment during this particular period. Assessing and training reactive balance abilities, especially in response to lateral perturbation is important since a sizeable proportion of falls involves falling toward the paretic side, which may result in severe injury such as hip fracture.4,6
This study has several limitations. First, our sample was fairly small and restricted to subacute PwS hospitalized in a rehabilitation setting who are able to walk independently, so results cannot be generalized to very high functioning community dwelling PwS or to PwS that need assistance during standing and walking. Also, it should be noted that the interpersonal variance of PwS in our study was relatively high in terms of brain lesion characteristics, severity of sensory-motor impairments and clinical measures of balance and gait, yet all PwS in our study were able to walk independently or under supervision (ie, wheelchair-bound patients were excluded) and so these are the patients who are more prone to falls and they are the ones with whom it is important to assess reactive balance abilities. Second, differences in spatiotemporal parameters of the step response were analyzed by perturbation direction, but we did not further classify responses by stepping leg or stepping strategy, that is, crossover step, loaded leg side step, and so on, since there were only few of each of these stepping strategies so a larger sample of PwS is required. Fourth, in the current study we did not examine the association between reactive balance capacity and clinical tests that also provide perturbations of balance such as the POMA and the miniBEST.
In conclusion, PwS demonstrated impairments in balance recovery capacity, that is, low multiple step thresholds and fall thresholds. Fall threshold is an important parameter that may serve as a more direct measure of inability to prevent a fall in real life in PwS. Also, reactive balance impairments were more pronounced when the unexpected loss of balance was toward the paretic side (ie, surface translation toward the nonparetic side) and toward backward (forward surface translation). Results highlight the importance of assessing reactive balance in response to different unexpected perturbation directions and intensities, which may better identify reactive balance impairments and may help target interventions aiming to improve reactive balance response and reduce falls in PwS. Further study is needed to explore the ability of reactive balance capacity assessment (ie, fall threshold and multiple step threshold) to predict future falls in PwS and to examine whether reactive balance capacity and reactive step length and velocity can be improved by specific training in subacute PwS.
Footnotes
Declaration of Conflicting Interests
The author(s) declared no potential conflicts of interest with respect to the research, authorship, and/or publication of this article.
Funding
The author(s) disclosed receipt of the following financial support for the research, authorship, and/or publication of this article: The study was partially supported by a grant from the Ben-Gurion University, by the Helmsley Charitable Trust through the Agricultural, Biological and Cognitive Robotics Initiative of Ben-Gurion University of the Negev, by a trust from the Loewenstein Rehabilitation Hospital for the doctoral program (Shirley Handelzalts) and by Raphael Rozin prize for excellent study in rehabilitation.