
Abstract
Background. Humans typically walk in ways that minimize energy cost. Recent work has found that healthy adults will even adopt new ways of walking when a new pattern costs less energy. This suggests potential for rehabilitation to drive changes in walking by altering the energy costs of walking patterns so that the desired pattern becomes energetically optimal (ie, costs least energy of all available patterns). Objective. We aimed to change gait symmetry in healthy adults and persons poststroke by creating environments where changing symmetry allowed the participants to save energy. Methods. Across 3 experiments, we tested healthy adults (n = 12 in experiment 1, n = 20 in experiment 2) and persons poststroke (n = 7 in experiment 3) in a novel treadmill environment that linked asymmetric stepping and gait speed—2 factors that influence energy cost—to create situations where walking with one’s preferred gait symmetry (or asymmetry, in the case of the persons poststroke) was no longer the least energetically costly way to walk. Results. Across the 3 experiments, we found that most participants changed their gait when experiencing the new energy landscape. Healthy adults often adopted an asymmetric gait if it saved energy, and persons poststroke often began to step more symmetrically than they prefer to walk in daily life. Conclusions. We used a novel treadmill environment to show that people with and without stroke change clinically relevant features of walking to save energy. These findings suggest that rehabilitation approaches aimed at making symmetric walking energetically “easier” may promote gait symmetry after stroke.
Introduction
Humans are essentially walking experts by adulthood. Our walking patterns are suitable for nearly any terrain or situation: we can walk on sand or ice, walk while wearing sandals or high heels, and navigate steep hills or narrow balance beams. Despite this flexibility in locomotor control, each person’s gait is so distinct that we can recognize friends simply by how they walk. 1
One reason that we walk in such stereotyped ways is that humans (and many other animals2-6) tend to walk in ways that conserve energy. Our gait parameters—speed,7,8 cadence,9,10 step length, 11 and step width 12 —appear tuned to minimize the energy used to walk a certain distance (ie, cost of transport) within the constraints of our musculoskeletal system. 13 Indeed, people adjust gait parameters to minimize energy expenditure when they walk in new environments. 14 While the precise role of energetics in locomotor control remains debatable—other objectives (eg, maintaining stability, avoiding pain) also influence locomotion—many studies suggest that energy optimization is important for gait parameter selection.14-20
Walking often costs more energy after injury21,22 or disease, 23 including stroke. 24 Accordingly, interest in understanding how to manipulate or leverage cost of transport to improve patient walking has grown rapidly.25-27 Most rehabilitation studies consider cost of transport as an outcome measure of exercise interventions or device implementation. As examples, prior studies have asked questions about whether locomotor training 28 or a robotic exoskeleton 29 may decrease cost of transport after stroke. Studies of this type aim to make walking energetically “easier” by changing movement to decrease cost of transport.
Here we suggest that rehabilitation may also benefit from the reverse approach where cost of transport is leveraged to change movement. 14 In other words, cost of transport should not only be considered as an outcome of rehabilitation but potentially a driving force behind it. Consider that several neurologic populations exhibit gait asymmetry30-32 and restoration of gait symmetry is a common goal for rehabilitation.33,34 Prior work has found that cost of transport increases with gait asymmetry in persons poststroke.35,36 However, recent findings suggest that asymmetric walking may be energetically costly after stroke, but not necessarily energetically suboptimal. 37 Furthermore, persons poststroke can often walk more symmetrically than they do in daily life.33,37 This led us to ask: Will persons poststroke walk more symmetrically if symmetric walking costs less energy than asymmetric walking?
We aimed to study whether healthy adults and persons poststroke would change gait symmetry to save energy. In experiments 1 and 2, we asked whether energy cost could drive healthy adults to adopt an unusual asymmetric gait. To test this, we developed a novel treadmill controller that linked foot placement asymmetry to gait speed. This created an environment wherein participants must deviate from their preferred gait symmetry to achieve the least energetically costly pattern. We hypothesized that healthy adults would walk asymmetrically when doing so cost less energy than walking symmetrically. In experiment 3, we explored whether energy cost could drive changes in foot placement asymmetry in persons poststroke with gait asymmetry. We hypothesized that persons poststroke would adopt a more symmetric pattern when symmetric walking cost less energy than asymmetric walking.
Materials and Methods
General Methods
Data Collection and Analysis
All participants provided written informed consent in accordance with the Johns Hopkins Medicine Institutional Review Board prior to participating, participated in only 1 of the 3 experiments, and received monetary compensation. The participants reported no neurological (other than stroke in experiment 3), musculoskeletal, or cardiovascular conditions. Participants walked on a treadmill with 2 belts (1 for each foot) moving at the same speeds (Woodway USA, Waukesha, WI). A thin partition approximately 12-inch tall ran between the belts to prohibit stepping on both belts simultaneously, allowing accurate heel-strike detection. Participants held onto handrails and wore a safety harness that did not provide body weight support. We measured self-selected walking speed as the mean speed of either 5 (experiments 1 and 2) or 3 (experiment 3) overground 10-m walk tests prior to treadmill walking. In experiment 3, we also measured fast walking speed as the mean of 3 overground 10-m walk tests where participants walked at their fastest comfortable pace.
We recorded kinematic data using an Optotrak Certus system (Northern Digital, Waterloo, Ontario, Canada; 100 Hz). We placed markers bilaterally over the fifth metatarsal head, lateral malleolus, lateral femoral epicondyle, greater trochanter, iliac crest, and acromion process. All participants wore comfortable shoes and form-fitting clothing. We calculated foot placement relative to the body by calculating the sagittal angle between vertical and a vector connecting the hip and ankle markers at heel-strike (ie, alpha angle). We calculated foot placement asymmetry as the difference between the alpha angle of the limb stepping further ahead and the alpha angle of the contralateral limb.
We collected metabolic data using a TrueOne 2400 system (Parvomedics, Sandy, UT). The system warmed up for at least 30 minutes before data collection and was calibrated to manufacturer specifications. We sampled oxygen consumption breath-by-breath and calculated the rate of oxygen consumption. We used the short form of a traditional equation 38 to calculate metabolic power by normalizing rate of oxygen consumption to body mass and total cost of transport (herein referred to as cost of transport) by normalizing rate of oxygen consumption to body mass and treadmill speed. We analyzed the last 2 minutes of each 5-minute trial (in experiments 1 and 2) and last minute of each 4-minute trial (in experiment 3) to ensure steady-state measurement.
Visual Display
Our visual feedback display (WorldViz, Santa Barbara, CA; Figure 1A) showed 16 vertically arranged virtual targets on a 56-inch television in front of the treadmill. 39 Red and blue circles moved up and down the left and right halves of the display, respectively, to show real-time anterior-posterior positions of the left and right ankle markers. The left and right ankle markers could be up to 10 cm apart and remain inside the same target. The virtual targets spanned the length of the treadmill with numbers ascending from back (target 0) to front (target 15). When participants stepped to a particular target, the white number centered inside the target changed color (red at left heel-strike, blue at right heel-strike) to indicate which target had been stepped to with each foot (Figure 1B).
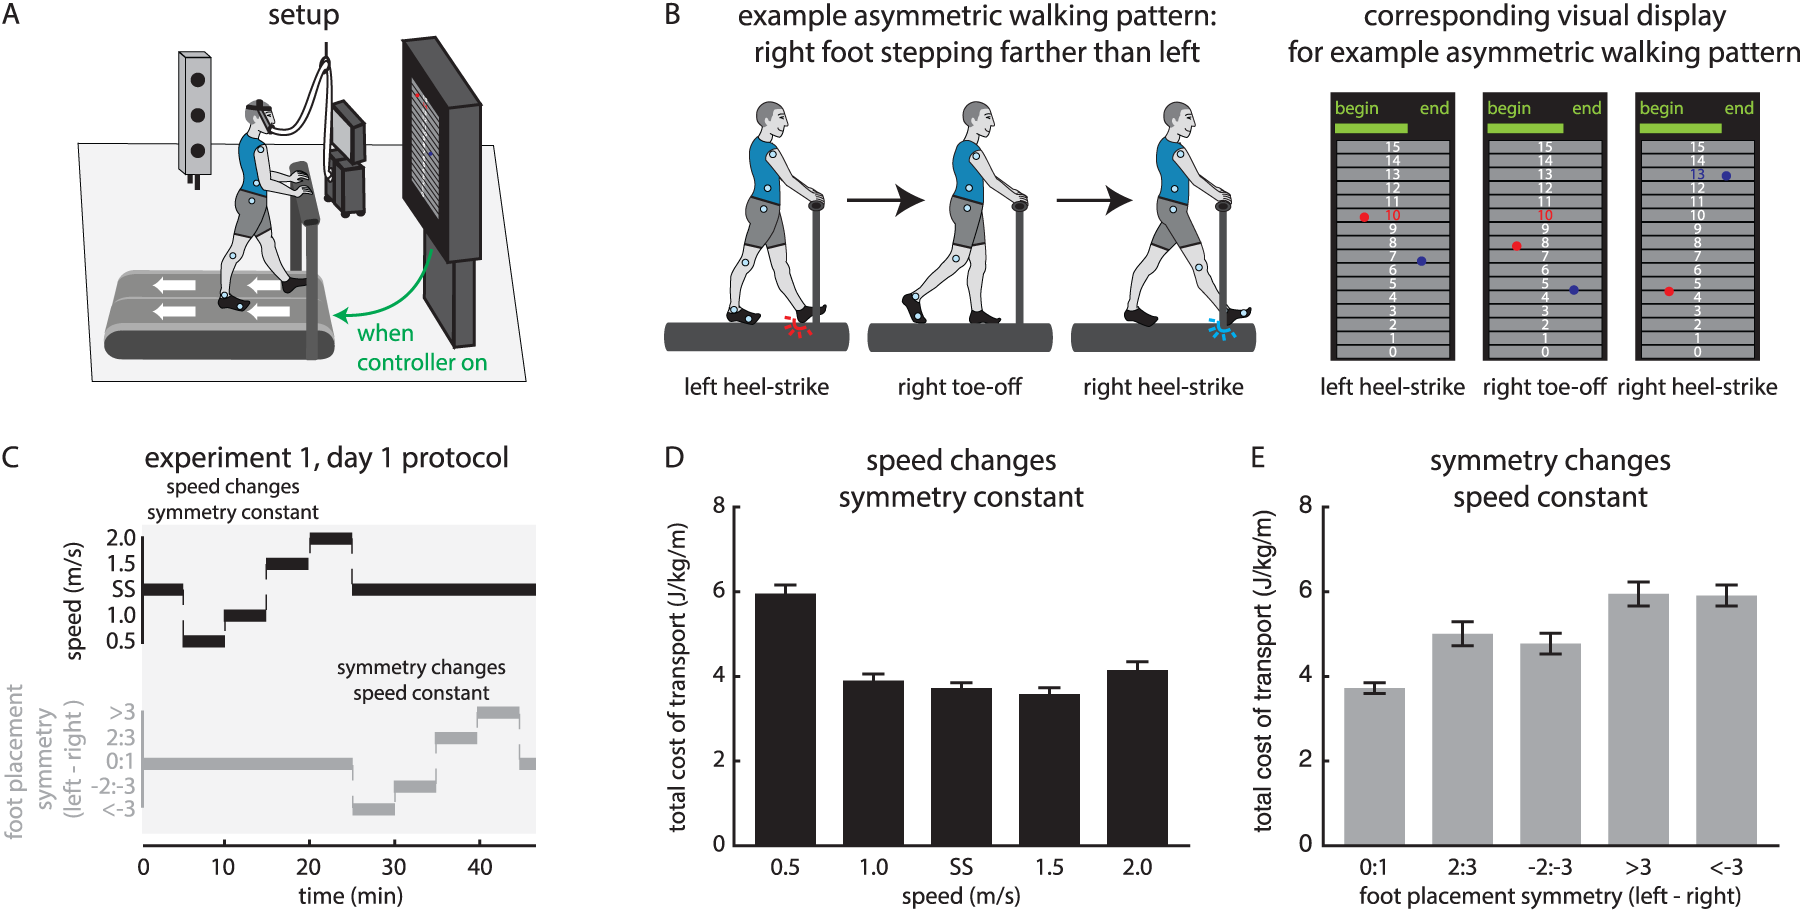
(A) Experimental setup for kinematic and metabolic testing. When the controller was activated, participants used the visual feedback to control their stepping patterns and manipulate the treadmill speed. (B) An example asymmetric walking pattern (left) and corresponding visual display (right) that participants used to control foot placement. The green distance bar along the top of the display was visible only during experiments 2 and 3. (C) Day 1 protocol for experiment 1 showing treadmill speeds (top, black) and foot placement asymmetry (ie, difference in the targets stepped to with each foot; bottom, gray). Positive values of foot placement symmetry indicate that the participant stepped further with the left foot than the right (eg, a value of 3 indicates that the left foot stepped 3 targets ahead of the right; a value of −3 indicates the opposite). Gray shading indicates that the treadmill speed was set by the experimenter. Costs of transport for (D) symmetric walking at different speeds and (E) different asymmetries at self-selected (SS) speed (mean ± standard error of the mean [mean ± SEM]).
In experiment 3, we also used a similar display that provided step length feedback. The left and right ankle markers could again be up to 10 cm apart and remain inside the same target. We detected heel-strikes in real time using the force plates under each treadmill belt.
Experiment 1
Protocol
The objective of experiment 1 was to understand whether healthy young adults would adopt an asymmetric gait over a fixed time interval if asymmetric walking cost less energy than symmetric walking. Twelve healthy adults participated in experiment 1 (3 male, 9 female, age [mean ± standard deviation] 26 ± 4 years, self-selected walking speed 1.34 ± 0.18 m/s) over 2 testing days. On day 1, participants walked for 5 minutes at self-selected speeds followed by 5 minutes at 0.5 m/s, 1.0 m/s, 1.5 m/s, and 2.0 m/s (display off, order randomized). Participants rested after each trial and breathing returned to baseline. We then turned on the display and participants tested it briefly by stepping with the treadmill stationary. We then set the treadmill speed to the self-selected speed for the remainder of day 1 and participants performed 4 asymmetric walking patterns for 5 minutes each (order randomized). The instructions were: Walk so that your right (left) foot lands at least four targets ahead of the left (right) Walk so that your right (left) foot lands two or three targets ahead of the left (right)
Day 1 concluded with 2 minutes of walking at self-selected speed with the display turned off and without instruction to investigate aftereffects following the asymmetric walking patterns.
On day 2, we paired each speed with a specific target asymmetry:
Symmetric walking: difference of 0 or 1 target, speed = 0.5 m/s
Small left limp: left foot 2 or 3 targets ahead of right, speed = 2.0 m/s
Small right limp: right foot 2 or 3 targets ahead of left, speed = 1.0 m/s
Large left limp: left foot at least 4 targets ahead of right, speed = 1.5 m/s
Large right limp: right foot at least 4 targets ahead of left, speed = self-selected
Participants walked with each asymmetry while an investigator set the treadmill at its paired speed for 5 minutes each. We then activated our treadmill controller that changed the treadmill speed to the speed paired with the asymmetry used most frequently over the prior 10 strides (this ensured that the speed did not change if the participants made a misstep).
Participants then explored the controller-driven landscape for 10 minutes. Participants did not wear the metabolic equipment during the exploration periods of experiments 1 to 3 so that they could ask questions during their initial experience with the controller. We guided the participants through the combinations (eg, “walk so that both feet land in the same target . . . now walk with the right foot landing at least four targets ahead of the left . . .”) for the first 5 minutes. During the final 5 minutes, we asked participants to try the combinations at their own paces and discover which combination they preferred, as they would later walk for 5 minutes using their preferred combination. Following exploration, the controller remained active and participants walked for 5 minutes using their preferred combination (test period). After the test period, we turned the display off and told participants to walk however felt comfortable for five minutes with the speed set to that picked during the test period.
Statistical Analysis
We performed repeated-measures analyses of variance (ANOVAs) to compare cost of transport among the 5 different asymmetry/speed combinations set by the treadmill controller (Shapiro-Wilk tests were not significant). Sample sizes in experiments 1 to 3 were determined by the number of participants required to observe a significant reshaping of the energy landscapes by pairing asymmetry and speed. In all experiments, we set α ≤ .05, performed Mauchly’s tests of sphericity (Greenhouse-Geisser corrections were applied when sphericity was violated), and applied Bonferroni corrections for multiple comparisons where appropriate.
Experiment 2
Protocol
We also considered that, in daily life, people walk to travel a set distance. We posited that the 5-minute time limit in Experiment 1 could have affected the participant choices during the test period if they chose to minimize total energy cost (ie, cost per time) rather than cost of transport (ie, cost per distance). In experiment 2, we investigated how participants preferred to walk in a reshaped energy landscape when required to walk a set distance. Twenty healthy adults participated in experiment 2 (8 male, 12 female, age 24 ± 5 years, self-selected walking speed 1.26 ± 0.14 m/s). In experiment 2, the protocol was similar to day 2 of experiment 1 except that we reorganized the asymmetry/speed combinations and participants walked for 1.0 km instead of 5 minutes during the test period. The new target asymmetry/speed combinations were:
Symmetric walking: difference of 0 or 1 target, speed = 0.5 m/s
Small left limp: left foot 2 or 3 targets ahead of right, speed = 2.0 m/s
Small right limp: right foot 2 or 3 targets ahead of left, speed = 1.5 m/s
Large left limp: left foot at least 4 targets ahead of right, speed = 1.0 m/s
Large right limp: right foot at least 4 targets ahead of left, speed = self-selected
We showed participants the distance traveled during the exploration and test periods by displaying a horizontal green bar that began adjacent with the word “BEGIN” in the upper left corner of the display. The bar grew from left to right to indicate total distance walked. The bar reached the word “END” at the right edge of the display after participants walked 1 km.
Before the experiment, we informed participants that they would neither receive additional compensation for extending the experiment by walking slowly nor leave the experiment sooner by walking fast. Participants did not wear the metabolic equipment during the test period of experiment 2 to minimize the possibility that the equipment might influence the combination picked (eg, we considered that participants may walk faster to complete the experiment and remove the equipment sooner). Following each combination, we recorded perceived exertion using the Borg Rating of Perceived Exertion Scale (RPE) 40 to assess whether perceived exertion influenced the combination picked during the test period.
Statistical Analysis
We performed repeated-measures ANOVAs to compare cost of transport among the 5 different asymmetry/speed combinations set by the treadmill controller (Shapiro-Wilk tests were not significant). We performed Pearson’s correlations to assess relationships between Borg RPE and cost of transport and between Borg RPE and metabolic power.
Experiment 3
Protocol
The objective of experiment 3 was to understand whether persons poststroke would walk more symmetrically if symmetric walking cost less energy than asymmetric walking. Seven persons poststroke participated in experiment 3 over 2 days (Table 1). One participant wore a functional electrical stimulation device (tibialis anterior of paretic leg). On day 1, participants walked for 4 minutes at 3 speeds (all with the display turned off, order randomized): self-selected, slow (0.4 m/s), and fastest comfortable. Participants rested after each trial and breathing returned to baseline.
Participant Demographics, Walking Speeds, and Clinical Scores (Experiment 3).
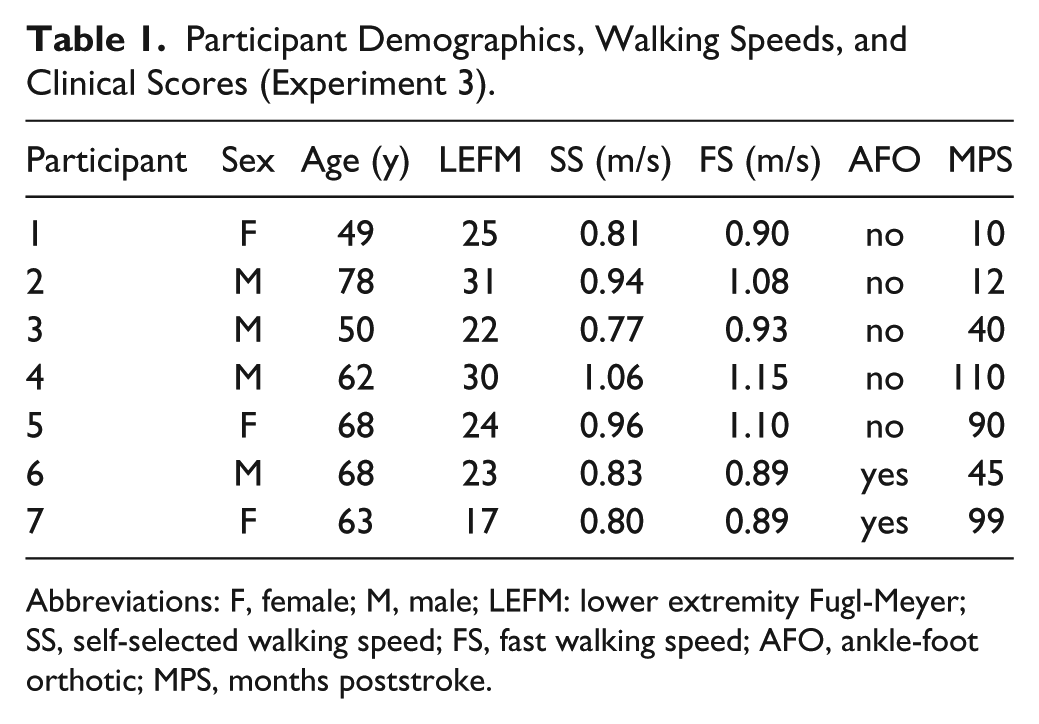
Abbreviations: F, female; M, male; LEFM: lower extremity Fugl-Meyer; SS, self-selected walking speed; FS, fast walking speed; AFO, ankle-foot orthotic; MPS, months poststroke.
After the speed manipulation trials, we turned on the foot placement feedback and participants tested it briefly (similar to experiments 1 and 2). We set the treadmill speed to the self-selected walking speed for the remainder of day 1 and participants performed 3 patterns for 4 minutes each (order randomized): walking with preferred asymmetry (measured during the self-selected speed trial), more symmetric than preferred, and less symmetric than preferred. Participants were not informed about their preferred symmetry and its relationship to the visual feedback. For example, if a participant walked with the right foot stepping 1 target ahead of the left (unseen by the participant as the feedback was turned off) during self-selected walking, the 3 conditions would be “walk with your right foot landing one target ahead of the left” (preferred), “walk with both feet landing inside the same target” (more symmetric), and “walk with your right foot landing two targets ahead of the left” (less symmetric). Participants in experiment 3 also underwent a similar protocol using step length feedback. We added the step length asymmetry manipulation because step length asymmetry is a common target in poststroke rehabilitation and its effect on cost of transport may differ from that of foot placement asymmetry. We calculated step length as the anterior-posterior distance between the ankle markers at heel-strike and step length asymmetry as:
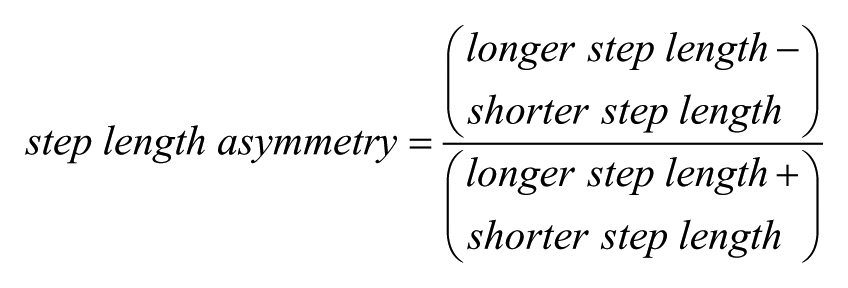
where the longer and shorter step lengths were defined based on the average step length of each limb over the four minutes of walking at self-selected speed.
Day 2 of experiment 3 began with 4 minutes of walking at self-selected speed. Each speed was then paired with a specific foot placement asymmetry. Participants first walked with each asymmetry while an investigator set the treadmill at its paired speed for 4 minutes each. The target asymmetry/speed combinations were as follows:
Preferred symmetry: baseline asymmetry, speed = 0.4 m/s
More symmetric: more symmetric than baseline, speed = self-selected
Less symmetric: less symmetric than baseline, speed = fast
We chose foot placement because (a) foot placement and step length asymmetries showed similar costs of transport on day 1 and (b) online feedback was easier for participants to control.
We then activated the controller and participants explored the landscape for 10 minutes. Following exploration, participants walked 0.25 km using their preferred combination during the test period. Similar to experiment 2, we showed participants the real-time distance traveled during the exploration and test periods. Participants did not wear the metabolic equipment during the test period.
Statistical Analysis
We performed Friedman tests to compare costs of transport among the 3 walking speeds, as the results of the Shapiro-Wilk test of normality were significant for these data. We performed repeated-measures ANOVAs on (a) mean alpha angle difference over the last 30 strides of the 3 foot placement asymmetry patterns on day 1, (b) mean step length asymmetry over the last 30 strides of the 3 step length asymmetry patterns on day 1, (c) costs of transport among the 3 foot placement asymmetry patterns on day 1, (d) costs of transport among the 3 step length asymmetry patterns on day 1, and (e) costs of transport among the 3 different asymmetry/speed combinations set by the treadmill controller on day 2. Shapiro-Wilk tests were not significant for these data.
Results
Experiment 1
On day 1 of experiment 1 (Figure 1C), we confirmed that cost of transport was lowest near self-selected walking speeds (Figure 1D) and increased with asymmetry (Figure 1E). On all relevant figures, asymmetry is shown as the left target minus the right target. The prescribed asymmetric patterns were distinct from normal walking (Figure 2). We collected 3382 total strides across all 12 participants’ 5-minute self-selected speed walking trials. Participants walked with one foot 2 or 3 targets ahead of the other in only 13 strides (~0.4%) and one foot more than 3 targets ahead of the other in only 3 strides (~0.09%).
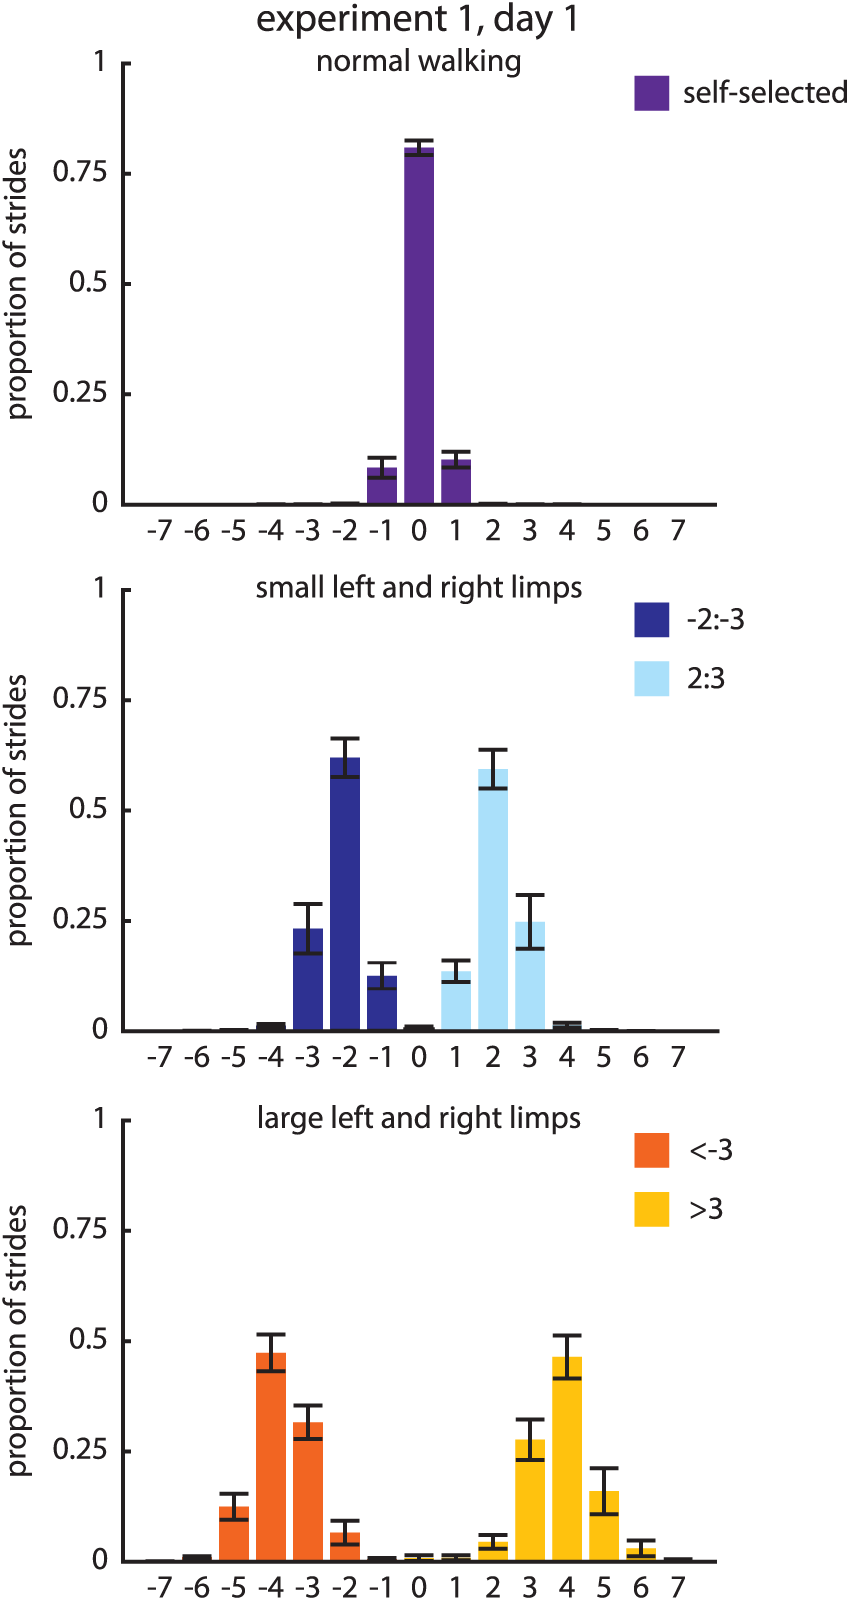
Histograms of the proportion of strides within foot placement asymmetry bins for self-selected (SS) walking and foot placement asymmetry manipulations.
We then used the day 1 findings to design the day 2 controller combinations (Figure 3A). The participants performed all combinations well (ie, hit the desired difference in targets at each speed with above the 50% accuracy needed to change the speed using the controller). We designed the day 2 asymmetry/speed combinations so that those with the lowest cost of transport required asymmetry and nonpreferred speeds (Figure 3B). The small right limp + 1.0 m/s and small left limp + 2.0 m/s combinations showed lower costs of transport than all other combinations: F(4, 44) = 13.494, all Ps <.05 except P = .076 for small right limp + 1.0 m/s versus large left limp + 1.5 m/s; P = 1.00 between the 2 low-cost combinations.
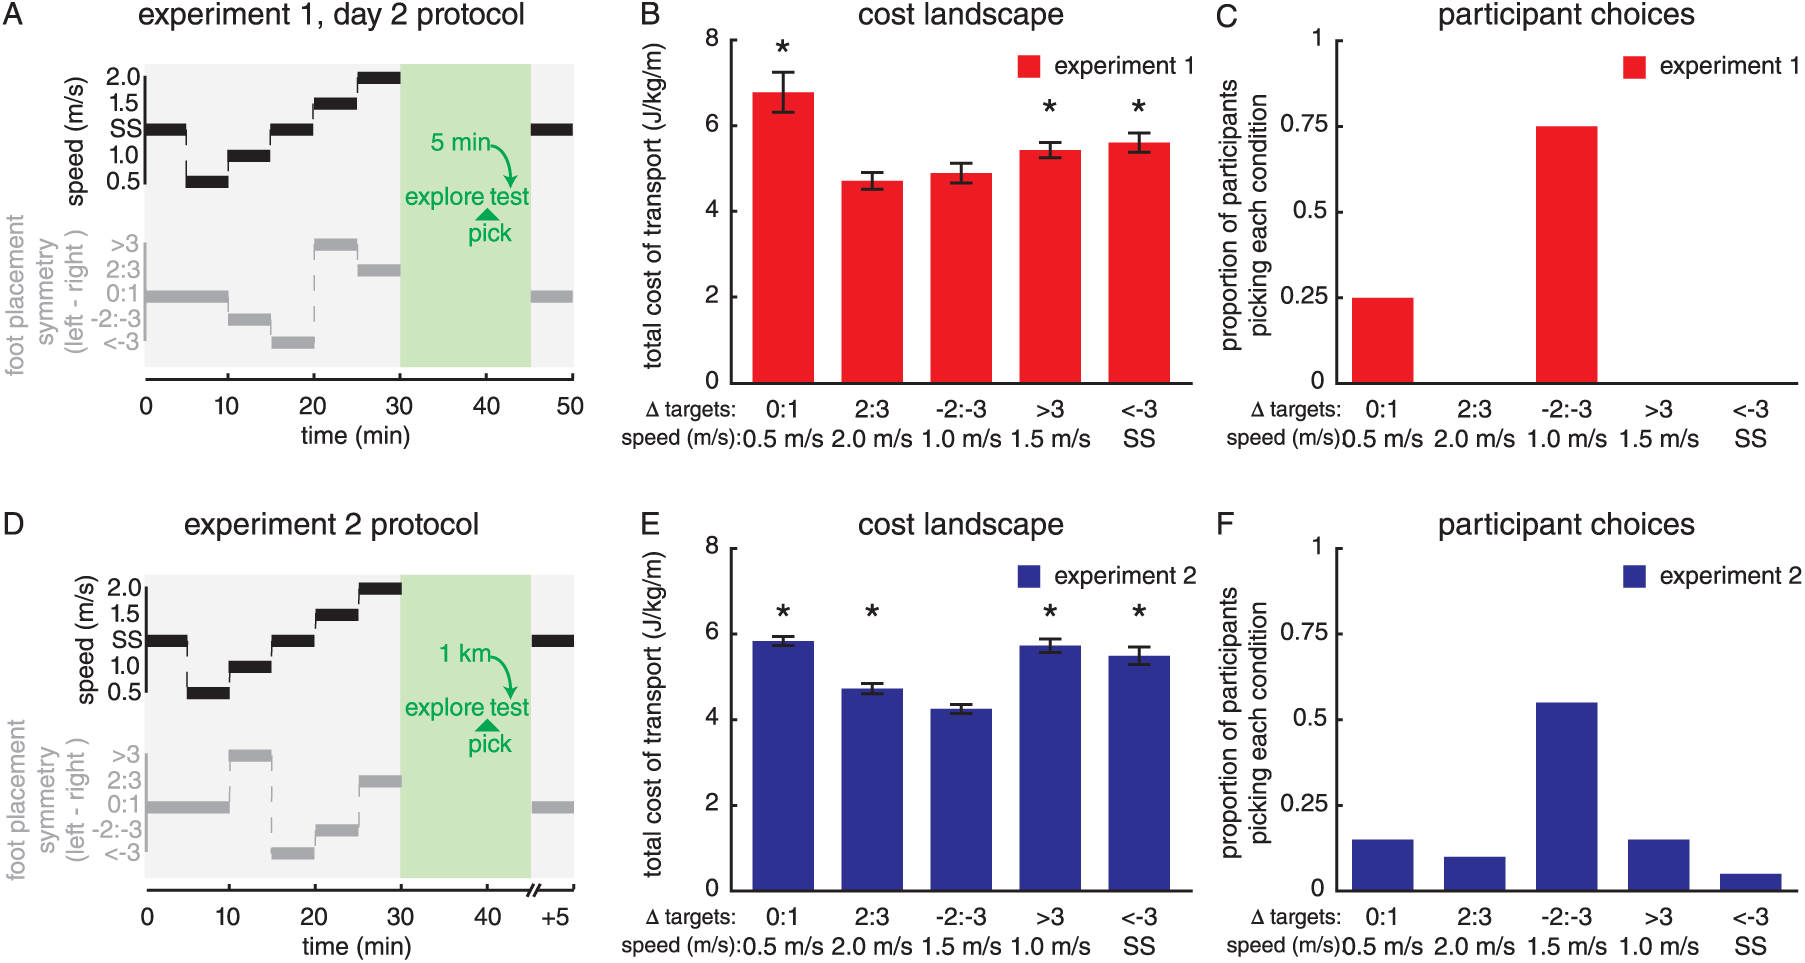
(A) Day 2 protocol for experiment 1. Line color conventions are consistent with Figure 1. Green text indicates that the controller was active. Gray shading indicates that the treadmill speed was set by the experimenter; green shading indicates that the speed was set by the controller. (B) Costs of transport for asymmetry/speed combinations prescribed by the experiment 1 controller (mean ± standard error of the mean [mean ± SEM]). *Indicates difference compared with least costly condition with P < .05. (C) Proportion of participants picking each combination during the experiment 1 test period. (D) Protocol for experiment 2. (E) Costs of transport for asymmetry/speed combination prescribed by the experiment 2 controller (mean ± SEM). *Indicates difference compared to least costly condition with P < .05. (F) Proportion of participants picking each combination during the experiment 2 test period.
Following controller activation and the subsequent exploration periods, participants performed the test period where the controller remained active and they walked for 5 minutes using the combination that felt most comfortable. Nine of 12 participants picked the low-cost small right limp + 1.0 m/s combination (Figure 3C), even though it required a limp and a nonpreferred speed. The 3 remaining participants picked the symmetric + 0.5 m/s combination. On follow-up questioning, all participants in experiments 1 to 3 said they would not change the selected combination if they were to repeat the test period.
Experiment 2
The single-day experiment 2 protocol was identical to day 2 from experiment 1 with 2 exceptions: (a) we reorganized the asymmetry/speed combinations to test whether participants would still converge on a low-cost combination under different conditions and (b) participants walked for 1 km rather than 5 minutes during the test period (Figure 3D). Participants again performed the combinations well. The small right limp + 1.5 m/s combination showed lower cost of transport than all other combinations (Figure 3E); F(4, 76) = 37.127, all Ps <.01.
In Experiment 2, participants again tended to prefer low-cost, asymmetric patterns. Eleven of 20 participants picked the lowest cost combination (small right limp + 1.5 m/s) and 2 picked a similarly low-cost combination (small left limp + 2.0 m/s; Figure 3F). Three participants picked the symmetric + 0.5 m/s combination. The remaining participants picked more costly combinations (3 participants picked the large left limp + 1.0 m/s combination, 1 participant picked the large right limp + self-selected speed combination). Across experiments 1 and 2, all participants that picked an asymmetric pattern during the test period reported that the symmetric combination was “too slow” when asked after the experiment. We did not observe aftereffects following the test period in experiments 1 and 2, as participants only walked asymmetrically when they achieved an energy benefit (ie, when the controller was on).
We then wondered why a few participants picked costly patterns in experiment 2. The four participants that picked either the symmetric combination or the self-selected speed combination were among the 7 slowest walkers studied. Some people may prefer a slow walking speed at the expense of high energy cost, a finding supported by work on cost of transport in persons poststroke. 41
Perceived exertion did not influence how the participants preferred to walk during the test period. Cost of transport and perceived exertion were weakly related (r = −0.27, P = .007; Figure 4A), suggesting that cost of transport actually decreases as perceived exertion increases. Unsurprisingly, perceived exertion was positively associated with metabolic power, a measure of energy expenditure per unit time (r = 0.76, P < .001; Figure 4A). Because pilot testing revealed that some participants desired to change the combination on seeing the distance traveled, we allowed participants to change their gait during the test period in experiment 2. Only 5 of 20 participants changed their walking during the test period (Figure 4B). When this occurred, we determined the combination picked to be the combination used to walk the majority of the kilometer.
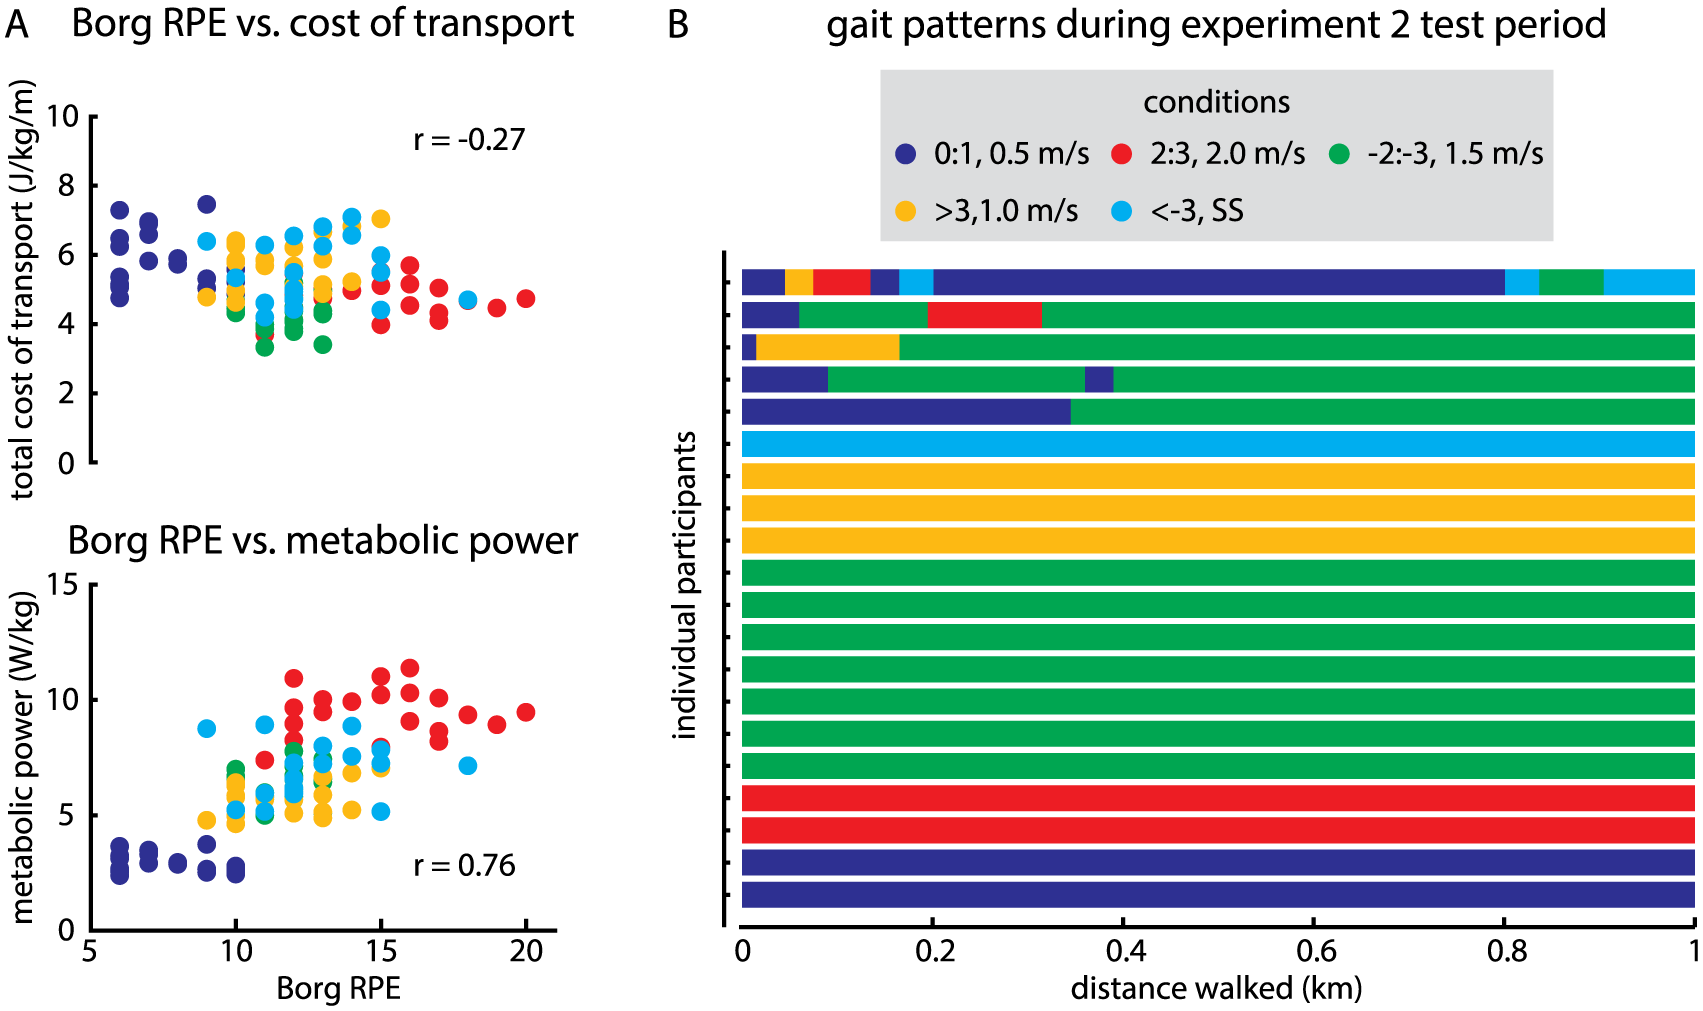
(A) Relationships between Borg Rating of Perceived Exertion (RPE) and total cost of transport (top) and metabolic power (bottom) for each asymmetry/speed combination in experiment 2. Cost of transport showed a weak negative association with Borg RPE while metabolic power showed a strong positive association with Borg RPE (both Ps <.05). (B) Asymmetry/speed combinations used by each participant during the experiment 2 test period along the kilometer walked.
Experiment 3
In Experiment 3, we asked whether persons poststroke would also change foot placement symmetry if doing so reduced cost of transport (day 1 protocol shown in Figure 5A). First, we observed a significant effect of walking speed on cost of transport, χ2(2) = 10.571, P < .01; representative participant data shown in Figure 5B, group data shown in Figure 5C. Post hoc analyses revealed marginally significant increases in cost of transport during slow walking as compared to preferred or fast speeds (both Ps =.018; significance level set at P < .017 after Bonferroni correction).
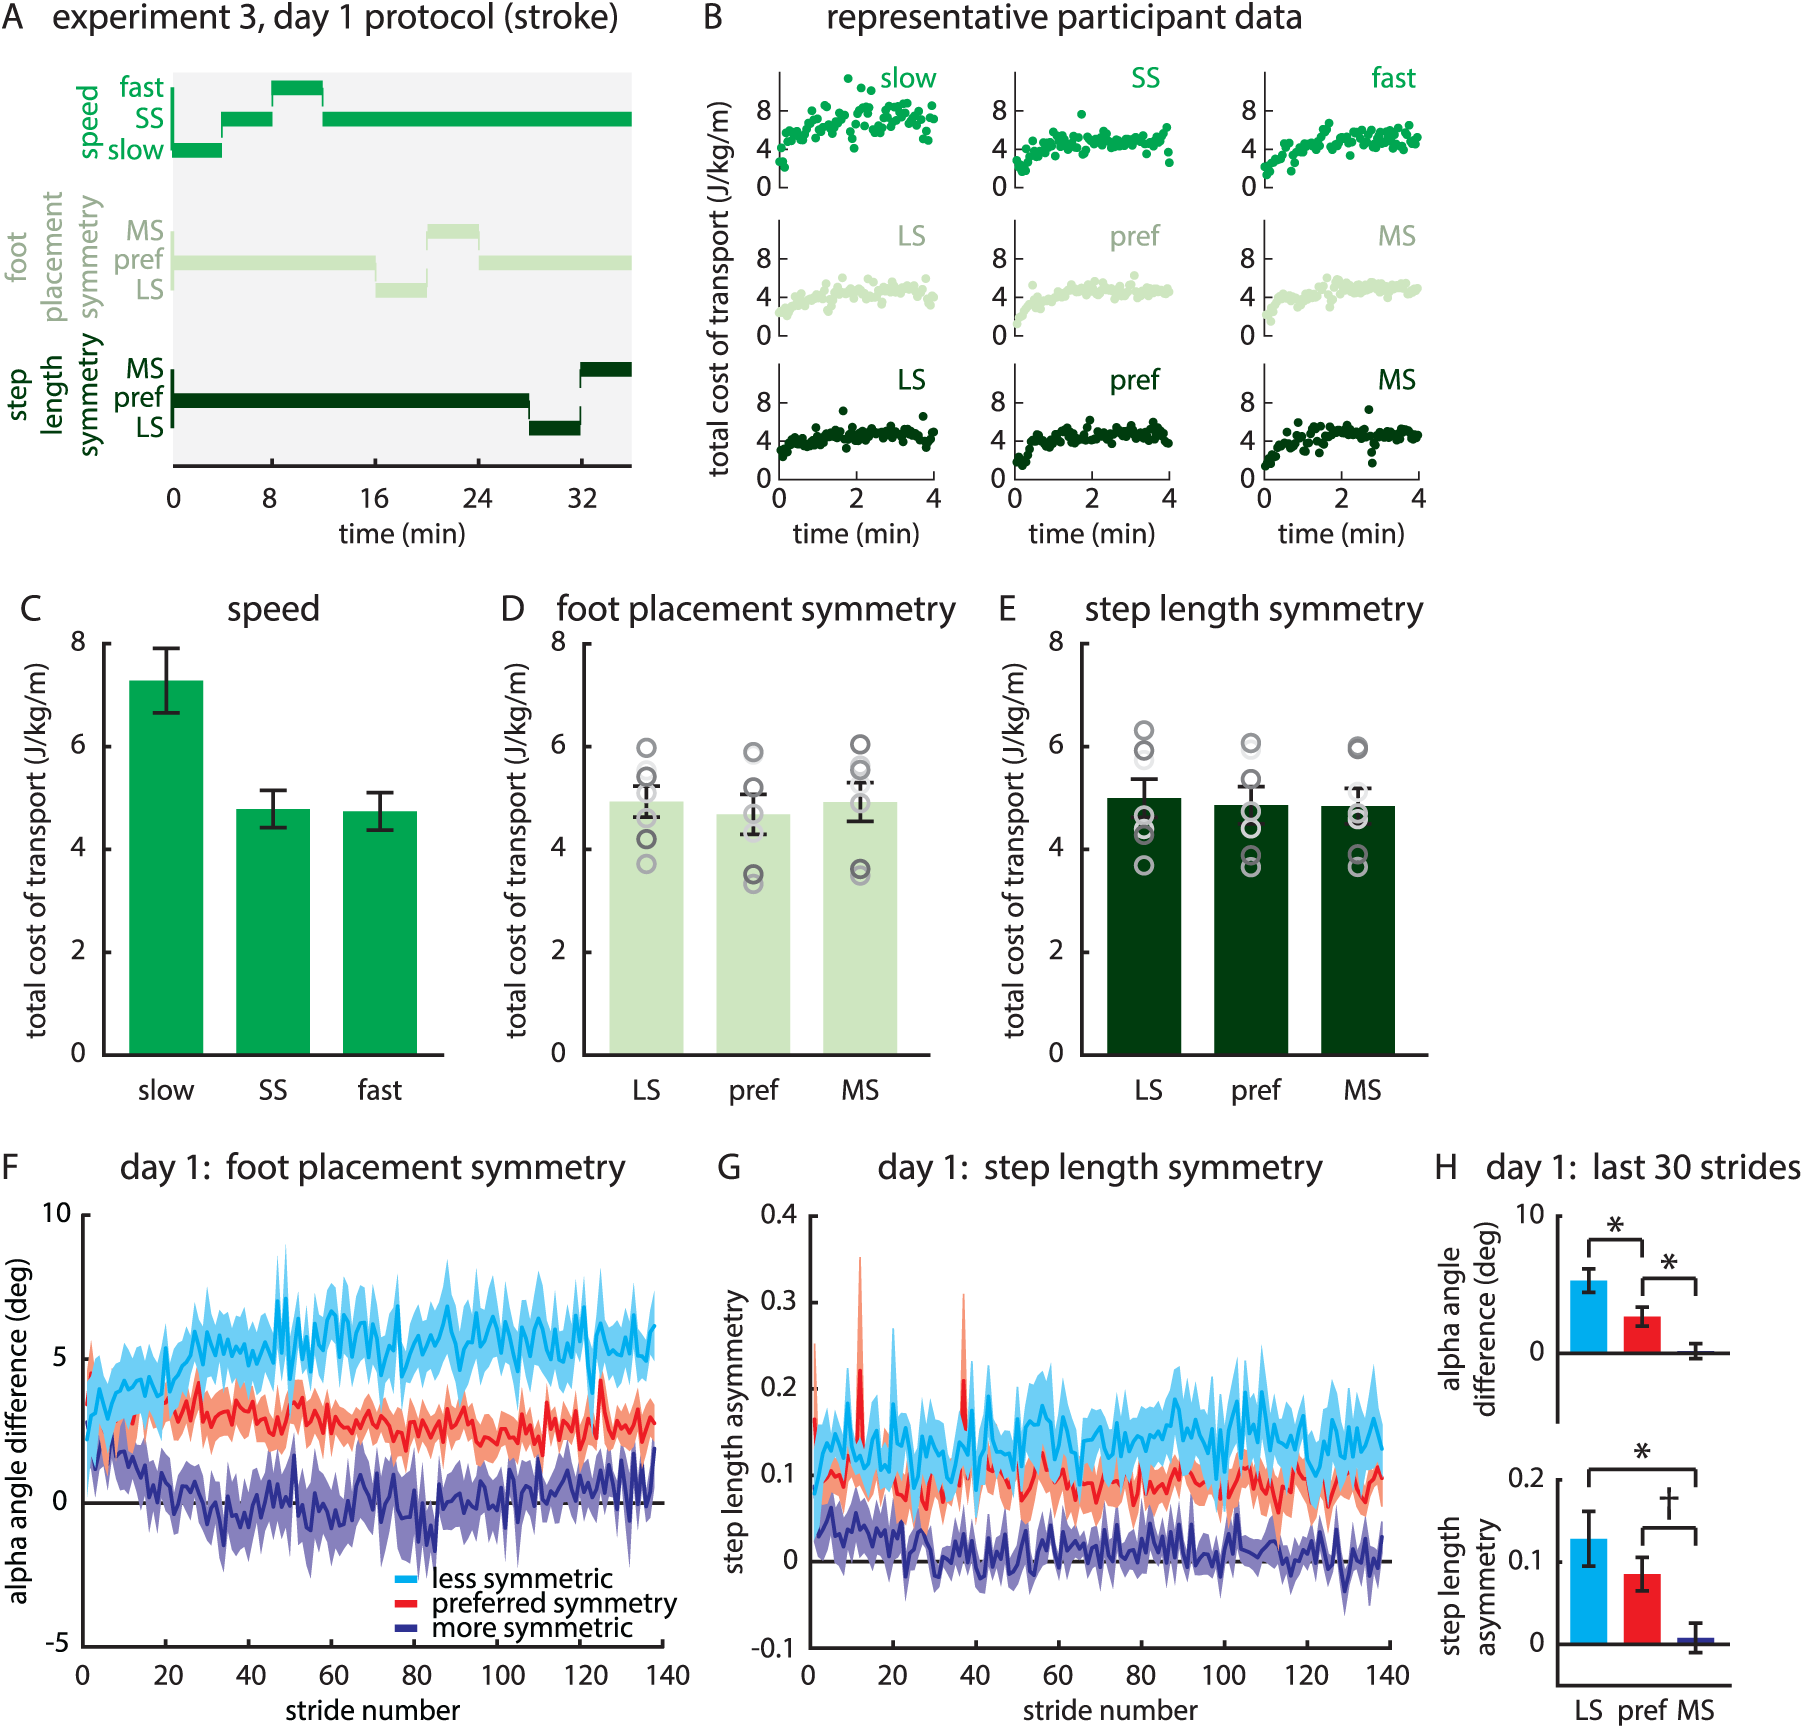
(A) Day 1 protocol for experiment 3. Green lines indicate treadmill speed, light dark green lines indicate foot placement, and dark green lines indicate step length asymmetry. Gray shading indicates that the treadmill speed was set by the experimenter. (B) Representative participant data showing costs of transport for walking across all conditions. (C) Costs of transport for walking with preferred asymmetry at different speeds. (D) Costs of transport for foot placement asymmetry patterns at self-selected (SS) speed. Gray circles show individual data. (E) Costs of transport for step length asymmetry patterns at SS speed. (F) Foot placement asymmetry (mean ± standard error of the mean [mean ± SEM]) and G) step length asymmetry (mean ± SEM) when the participants used online foot position feedback or step length feedback, respectively, to manipulate gait symmetry. (H) Foot placement asymmetry (top) and step length asymmetry (bottom) over the last 30 strides of each condition. *Indicates P < .05. †Indicates P = .074. LS, less symmetric than preferred; pref, preferred asymmetry; MS, more symmetric than preferred. All bar graphs show mean ± SEM.
Unlike in healthy adults, cost of transport was unaffected by foot placement or step length symmetry in persons poststroke, 37 We observed similar costs of transport when persons poststroke walked with preferred asymmetry or with patterns that were more/less symmetric than preferred. This was consistent across asymmetries in foot placement, F(2, 12) = 1.036, and step length, F(2, 12) = 0.887, P > .40 for all foot placement or step length asymmetry comparisons (Figure 5D and E). We confirmed that participants manipulated foot placement (Figure 5F) and step length (Figure 5G) asymmetry in accordance with the instructions, F(2, 12) = 44.333, P < .01 for all foot placement comparisons; F(2, 12) = 9.807, P = .045 for more symmetric versus less symmetric step length comparison, P = .169 for less symmetric versus preferred step length comparison, and P = .074 for more symmetric versus preferred step length comparison (Figure 5H).
We then designed the day 2 combinations so that those with the lowest cost of transport required the poststroke participants to adopt a new foot placement symmetry (day 2 protocol shown in Figure 6A). Similar to experiments 1 and 2, participants performed all combinations well (Figure 6B). The more symmetric + self-selected speed and less symmetric + fast speed combinations showed lower costs of transport than the preferred asymmetry + slow speed combination, F(2, 12) = 9.160, P = .036 for more symmetric + self-selected speed versus preferred asymmetry + slow speed comparison, P = .101 for less symmetric + fast speed versus preferred asymmetry + slow speed comparison, P = 1.0 between the 2 low-cost combinations (Figure 6C). We then activated the controller and participants explored the landscape for 10 minutes. During exploration, they were informed that they would later walk 0.25 km using the most comfortable pattern. Participants then walked for 0.25 km using the preferred combination during the test period.
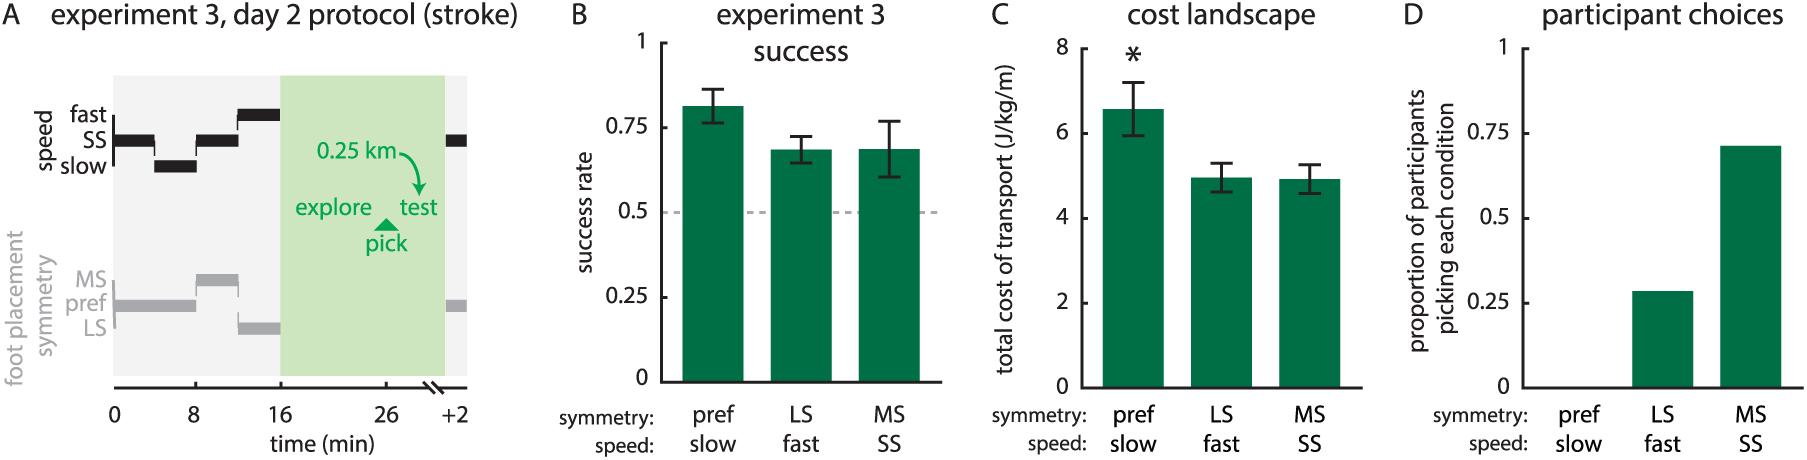
(A) Day 2 protocol for experiment 3. Gray shading indicates that the treadmill speed was set by the experimenter; green shading indicates that the speed was set by the controller. (B) Success rates for each of the combinations tested in minutes 4 to 16 of the experiment 3 protocol. Here success rate was calculated as the proportion of strides during each 4-minute period that participants hit the desired difference in targets (ie, desired limping pattern; mean ± standard error of the mean [mean ± SEM]). (C) Costs of transport for each foot placement asymmetry/speed combination prescribed by the experiment 3 controller (mean ± SEM). *Indicates difference compared to the least costly condition with P < .05 (P = .101 for preferred asymmetry + slow speed vs less symmetric + fast speed condition). (D) Proportion of participants picking each combination during the experiment 3 test period.
During the test period, all 7 participants adopted one of the low-cost combinations that deviated from their preferred foot placement symmetry. Five of the 7 participants walked with the more symmetric + self-selected speed combination and 2 walked with the less symmetric + fast speed combination (Figure 6D). Similar to the healthy adults in experiments 1 and 2, persons poststroke did not show aftereffects once the controller was turned off.
Discussion
It has become clear that the nervous system will change the fundamental nature of walking to save energy. 14 Here we asked whether we could leverage cost of transport to drive changes in gait symmetry in healthy adults and persons poststroke. We observed that (a) most healthy adults (75% in experiment 1, 65% in experiment 2) walk asymmetrically when asymmetric walking costs less energy than normal walking and (b) persons poststroke change their gait symmetry to walk faster with a lower cost of transport.
The results of experiments 1 and 2 reveal that the human preference for symmetric walking is not strong. Most healthy participants tested here readily adopted asymmetric walking patterns when asymmetric walking cost less energy than symmetric walking. This occurred regardless of whether participants were asked to walk for a set time or set distance, suggesting that people optimize energy spent per unit distance regardless of the parameters of the walking task (ie, they would have picked the slowest walking speed in experiment 1 had they aimed to minimize total energy expenditure). These findings are consistent with prior work that revealed the people will change how they walk to minimize energy expenditure. 14
We are particularly interested in the potential clinical implications of our findings. Our results may offer an explanation as to why some patients settle on certain abnormal walking patterns. Persons poststroke can often walk faster 41 or more symmetrically33,37 than they do in daily life, as observed in Experiment 3. Why then do persons poststroke walk in seemingly undesirable ways when they are capable of “better” patterns? There are many objectives that can influence human locomotor control (eg, stability maximization, 42 energy optimization, 14 pain avoidance43-46). These factors are likely weighted differently among different patients. Patients with balance impairment may prioritize stability, and those with pain may adopt patterns that are less painful. However, we and others 47 suggest that minimizing cost of transport may strongly influence walking in patients that are minimally affected by these other confounding issues.
In experiment 3, we found that manipulating foot placement or step length symmetry had little effect on cost of transport in persons poststroke within a single walking session. These data are consistent with recent findings 37 and conflict with a long-standing assumption that asymmetric walking after stroke is energetically suboptimal. This assumption is drawn largely from work indicating that cost of transport increases after stroke24,48 and from between-subject comparisons showing that patients with larger asymmetry exhibit higher costs of transport.35,36 Given the asymmetric neuromuscular impairments commonly observed after stroke, we considered that persons poststroke may experience energy landscapes similar to those we designed in experiments 1 and 2 where cost of transport is elevated but an asymmetric pattern is the least costly option. We did not find this to be the case exactly—cost of transport was similarly high no matter how persons poststroke manipulated foot placement or step length symmetry—but the data confirmed that more symmetric stepping is not less costly for persons poststroke with hemiparesis within a single walking session.
Importantly, when we reshaped the energy landscape so that walking more/less symmetrically than preferred reduced the cost of transport in experiment 3, all 7 poststroke participants changed their foot placement symmetry to a less costly pattern. No participant chose the combination that allowed for walking with preferred asymmetry and also likely posed the least challenging demands on balance. We suggest that rehabilitation approaches for stroke and other neurological disorders may be most successful when the desired walking pattern becomes energetically optimal.
Restoring “normal” function is a common goal of rehabilitation. Our findings support the idea that it is important for “normal” movement patterns to have value to the patient. 49 If the desired gait pattern saves energy, this may lead to longer-lasting improvements than conventional therapy because the desired pattern now benefits the patient. After stroke, designing rehabilitation to reshape the energy landscape so that symmetric walking (which was, on average, approximately 35% more costly at self-selected speeds compared to healthy adults) is energetically optimal may incentivize more symmetric walking.
It is important to note that this approach is unlikely to benefit all patients. The persons poststroke included in this study exhibited mild-to-moderate disability, relatively fast gait speeds, and capacity to change their walking patterns. Subgroups of persons poststroke with balance impairment, slow gait speeds, deconditioned cardiovascular fitness, or lower functional capacity may not benefit from energy-driven approaches. For example, it is unlikely that a patient with poor balance would minimize cost of transport at the expense of stability. However, if therapy can first address primary deficits (eg, balance, fitness), an energy-driven approach may become useful. It is also possible that some participants in experiment 3 changed their gait asymmetry during the test period to achieve their preferred walking speeds rather than to minimize cost of transport. Given that this did not occur in experiments 1 and 2—and some participants in experiment 3 picked a low-cost pattern that was not paired with preferred walking speed—we consider this unlikely.
Moving forward, it will be important to understand how the nervous system computes cost of transport during walking. Our findings demonstrate that people walk in ways that save energy but do not feel easiest. Therefore, people must compute cost of transport more objectively. Physiological measures that correlate with gait speed (eg, respiratory rate or heart rate) may influence ratings of exertion whereas objective measurements from physiological sensors may provide information about cost of transport, though this process may be complex. 50 Understanding how the nervous system computes cost of transport and uses this signal to adjust walking patterns will be critical for leveraging energetics to improve rehabilitation.
This study was not without limitations. The energy landscapes designed in experiments 1 to 3 resulted in new walking patterns becoming energetically optimal; however, all the available patterns cost more energy than preferred symmetry at preferred speed (which was no longer an option in any of the altered landscapes). Whether people would prefer a new, less costly pattern over their habitual gait pattern is unknown. Use of the handrails may have provided the poststroke participants with additional stability that would not be available during overground walking and, in turn, may have made them more likely to change their gait pattern during the test period on the treadmill. This study included a relatively small sample size of persons poststroke who, as mentioned above, exhibit only mild-to-moderate impairment.
Conclusions
Healthy adults and persons poststroke adjusted gait symmetry away from their preferred symmetry when new gait patterns reduced the cost of transport during walking. We find these results exciting because they raise questions about how energetics can influence gait patterns and rehabilitation in clinical populations. Future work will aim to understand how energetics can be leveraged to improve rehabilitation and will pursue training mechanisms targeted at reshaping energy landscapes during walking.
Footnotes
Acknowledgements
Declaration of Conflicting Interests
The authors declared no potential conflicts of interest with respect to the research, authorship, and/or publication of this article.
Funding
The authors disclosed receipt of the following financial support for the research, authorship, and/or publication of this article: This work was supported by National Institutes of Health grants R21AG059184 to RTR and R37NS090610 to AJB.