
Abstract
Background. High-intensity, variable stepping training can improve walking speed in individuals poststroke, although neuromuscular strategies used to achieve faster speeds are unclear. We evaluated changes in joint kinetics and neuromuscular coordination following such training; movement strategies consistent with intact individuals were considered evidence of recovery and abnormal strategies indicative of compensation. Methods. A total of 15 individuals with stroke (duration: 23 ± 30 months) received ≤40 sessions of high-intensity stepping in variable contexts (tasks and environments). Lower-extremity kinetics and electromyographic (EMG) activity were collected prior to (BSL) and following (POST) training at peak treadmill speeds and speeds matched to peak BSL (MATCH). Primary measures included positive (concentric) joint and total limb powers, measures of interlimb (paretic/nonparetic powers) and intralimb compensation (hip/ankle or knee/ankle powers), and muscle synergies calculated using nonnegative matrix factorization. Results. Gains in most positive paretic and nonparetic joint powers were observed at higher speeds at POST, with decreased interlimb compensation and limited changes in intralimb compensation. There were very few differences in kinetic measures between BSL to MATCH conditions. However, the number of neuromuscular synergies increased significantly following training at both POST and MATCH conditions, indicating gains from training rather than altered speeds. Despite these results, speed improvements were associated primarily with changes in nonparetic versus paretic powers. Conclusion. Gains in locomotor function were accomplished by movement strategies consistent with both recovery and compensation. These and other data indicate that both strategies may be necessary to maximize walking function in patients poststroke.
Introduction
Increasing walking speed is a primary goal of rehabilitation for individuals poststroke1,2 and can be achieved by increasing stride length, cadence, or both. 3 Increasing stride length requires greater propulsive forces at the ankle and hip to accelerate and redirect the center of mass during step-to-step transitions.4,5 Similarly, greater hip flexor power is required at higher cadences or with longer steps.6,7 In intact individuals, joint powers increase proportionally with speeds, 8 with appropriate neuromuscular coordination to ensure rapid phase transitions.
In patients poststroke, walking speeds are markedly reduced, in part because of alterations in neuromuscular activation and coordination.9,10 Reduced volitional activation of the paretic limb results in reduced stability in stance and decreased propulsive forces during walking. These deficits result in asymmetric gait patterns, and patients with hemiparesis often compensate by capitalizing on the force-generating capabilities of the nonimpaired limb. 11 In addition, impairments in neuromuscular control of the distal lower limb are compensated for by greater proximal (hip and knee) joint forces. 12 Although these strategies allow individuals to temporarily achieve greater walking speeds, such compensatory patterns may limit the maximal speeds that could be achieved over the course of recovery. 13 Traditional rehabilitation strategies focus largely on mitigating the impairments underlying gait dysfunction by attempting to reestablish appropriate neuromuscular activation and coordination without allowing compensation.14,15 Unfortunately, such interventions have been used clinically for decades and have demonstrated limited efficacy. 16
More recent data suggest that interventions that maximize the amount and intensity of stepping practice in challenging environments, with limited attention toward gait kinematics, can elicit clinically and statistically significant gains in locomotor function.17-19 Such training is performed at high intensities (70%-85% maximum heart rate [HR]) and in variable contexts (tasks/environments), with a primary focus on successfully completing walking tasks but without focus on “normalizing” kinematics.18,20 Despite the observed gains in walking function compared with conventional interventions (see also Munari et al 21 and Boyne et al 22 ), these strategies represent a significant departure from traditional rehabilitation paradigms. More directly, attempts to perform variable, difficult stepping tasks, particularly at higher intensities that can elicit short-term increases in spastic motor activities, 23 has been theorized to reinforce abnormal movement strategies. 14
Previous work has attempted to classify neuromuscular strategies underlying functional recovery following neurological injury. Specifically, Levin et al 24 posited that individuals poststroke often utilize movement strategies similar to those observed in able-bodied individuals, which represents neurological recovery, or restoration of previous neurological function. Conversely, in those without sufficient neurological restitution postinjury, alternative movement strategies may be required, and are defined as compensation. 24 Performance of high-intensity stepping training has, for example, been shown to mitigate specific impairments (strength, balance)18,25 that correlate with walking improvements. Conversely, despite improved spatiotemporal symmetry, 17 compensatory kinematic strategies such as increased swing-phase circumduction are observed in a subset of participants following such training. 26 Potential strategies for further identifying patterns of neuromuscular recovery versus compensation are the assessments of locomotor kinetics and muscle activity patterns. Specific analyses of joint powers and neuromuscular coordination prior to and following high-intensity stepping training has not been performed but would provide insight into whether walking improvements were a result of recovery of “normal” neuromuscular strategies or increased use of compensatory patterns. For example, greater reliance on the nonparetic limb during walking at faster speeds would represent a compensatory strategy, whereas improved neuromuscular activation and coordination of the paretic limb would indicate recovery of strategies used prior to stroke.
In the present study, we evaluated changes in sagittal-plane joint and whole limb kinetics and neuromuscular coordination in participants with gait deficits poststroke prior to and following an 8- to 10-week bout (up to 40 sessions) of high-intensity stepping training. Using a pretest versus posttest design, we hypothesized that high-intensity variable training would result in substantial improvements in joint powers of the paretic hip, knee, and ankle joints as well as improvements in neuromuscular coordination, representing measures of neuromuscular recovery. 24 We also hypothesized that high-intensity training in variable contexts would not result in substantial increases in compensatory strategies. 24 Changes in neuromuscular activation and coordination poststroke as measures of recovery and compensation can provide insight into the strategies utilized by patients to achieve greater functional walking gains poststroke.
Methods
Participants
The present study describes a secondary analysis of sagittal-plane lower-limb kinetics and electromyographic (EMG) activity in individuals with chronic (>6 months) or subacute (1-6 months) stroke following high-intensity stepping training, with comparisons prior to training (ie, baseline [BSL]) and posttraining (POST).20,25 Specific inclusion criteria were as follows: 18 to 75 years of age; self-selected velocity during overground walking <0.9 m/s, with up to moderate assistance from a physical therapist as needed; ability to sit unsupported for 30 s; Mini Mental Status Exam Score ≥23/30; Patient Health Questionnaire <10; and medical clearance to participate. Exclusion criteria included the following: presence of contractures that limited lower-limb range of motion; cardiovascular, respiratory, or metabolic instability, including unstable angina or hypertension (above 200/110 at rest), uncontrolled diabetes, or severe respiratory disorders that limited exercise participation 27 ; inability to ambulate >150 feet prior to stroke; and previous history of peripheral or central nervous system (CNS) injury. An additional requirement for evaluation of gait kinetics and EMG activity was the ability to walk on the treadmill (TM) for 1 minute at 0.1 m/s with use of a handrail as needed. 26 All participants gave written informed consent, and the local institutional review board approved all procedures.
Experimental Intervention
Training sessions included up to 40 minutes of high-intensity variable stepping over ≤40 sessions of 1 hour each, completed within 10 weeks. Stepping intensity and patient safety were monitored using a pulse oximeter to ensure target HRs were ~85% of maximum HR.18,20 The first 2 training weeks (8-10 sessions) consisted solely of speed-dependent TM training, where forward stepping was performed at the highest possible speed while maintaining HRs within prescribed limits. Body weight support and swing assistance from a single therapist or elastic bands were applied as needed to reach a minimal speed of 0.5 km/h (0.14 m/s), with speed increased as tolerated. Gait kinematics were not a focus during training, with feedback or assistance to ensure that patients were performing the minimal demands of stepping, including bilateral positive step lengths, maintaining postural stability, and stepping in a specific direction. Participants wore a safety harness throughout and were encouraged to minimize handrail use as possible.
The remaining 6 to 8 weeks consisted of individual sessions divided into 10-minute tasks, including speed-dependent TM training (described above), skill-dependent TM training, stair climbing, and overground training. Skill-dependent walking involved application of various challenges, including paretic limb weights, obstacle avoidance, weighted vest, and inclined and backward/side stepping. Stair climbing occurred over static or rotating stairs at the highest possible speeds and/or with additional challenges (eg, weighted vest, leg weight, or multiple directions). Overground training included walking over compliant, uneven, or narrow surfaces and obstacle avoidance, in addition to tasks performed during TM activities (please see the appendix in Holleran et al 20 ).
Data Collection
Kinematic, kinetic, and EMG data were collected during graded TM assessments at BSL and following up to 40 training sessions over 10 weeks (POST). Assessments were performed on a motorized, split-belt TM with bilateral, embedded 6-degree-of-freedom force plates (Bertec Corporation, Columbus, OH). The TM was surrounded by an 8-camera motion capture system (Motion Analysis Corporation, Santa Rosa, CA), and 32 reflective markers were placed bilaterally on the lower limbs using a modified Cleveland Clinic marker set. Kinematic and kinetic data were sampled at 100 Hz. Upper-extremity forces on the handrails were evaluated with embedded 6-degree-of-freedom load cells (JR3 Incorporated, Woodland, CA) to estimate vertical and propulsive upper-limb forces. A total of 12 EMG electrodes (Ag/AgCl Noraxon USA Inc, Scottsdale, AZ) were placed bilaterally on the medial gastrocnemius (MG), medial hamstring (MH), vastus lateralis (VL), rectus femoris (RF), tibialis anterior (TA), and soleus (SOL) and sampled at 1000 Hz. Graded assessments were performed, with the participants wearing a safety harness attached to a suspension system over the TM. Testing started with participants walking at 0.1 m/s for 2 minutes, with speed increased in 0.1 m/s increments every 2 minutes until the participants reached 85% of age-predicted maximum HR, had evidence of gait instability, or refused to continue. Data were collected for 1 continuous minute at each speed, beginning 30 s after speed changes to allow for accommodation. The highest speed that participants could walk for >1 minute was considered peak speed.
Data Analysis
A bilateral 6-degree-of-freedom model of each participant’s lower limbs was created from the reflective marker data collected during static standing using Visual3D (C-Motion Incorporated, Germantown, MD). The inertial properties of the lower limbs were estimated based on the subject model (described above), using normative values to estimate limb dimensions and joint centers. Kinematic data were filtered (low-pass, second-order Butterworth filter, cutoff frequency 10 Hz), and sagittal plane ankle, knee, and hip angles were calculated from the transformations between model segments. Sagittal plane joint moments were calculated using inverse dynamics using filtered ground reaction force data (low-pass, second-order Butterworth, cutoff frequency 20 Hz) and joint angle measurements. Sagittal plane joint powers were calculated as the product of joint moment and joint angular velocity and normalized to body weight. Stance was identified as the period when vertical ground reaction force data crossed a minimum threshold of 0.1 N. Kinetic data were normalized to percentage of gait cycle (GC), and average step cycle profiles were created for all complete steps.
Kinetic metrics included average positive and negative sagittal joint power for the ankle, knee, and hip, calculated by integrating joint power within the stride when power values were positive (or negative) 8 :

Joint powers for the ankle, knee, and hip joint were presented separately, and the total limb power was determined by summing these average powers across the GC.
Individual positive and negative joint powers were further analyzed (Figures 1A, 1C, and 1E) during specific phases of the GC, consistent with power generation in unimpaired participants as defined previously. 28 Given the potential variability in magnitude and timing of joint powers across individuals poststroke, data were analyzed only during specific ranges (ie, percentages) of the GC when peak powers are typically observed. For example, negative ankle power between 0% and 60% GC (A1) is associated with eccentric plantar flexor activity during stance, and positive power generation (A2) from 40% to 80% is associated with concentric power during push-off; only negative values between 0% and 60% were used to calculate A1, and only positive values between 40% and 80% were used to calculate A2. Knee powers were calculated in 4 separate bins: negative power from 0% to 25% GC associated with knee extensor eccentric activity during loading (K1), positive power from 10% to 50% GC with concentric knee extension (K2), and 2 more negative power bins (K3: 50%-75%; K4: 75%-100%) associated with eccentric knee extensor and eccentric knee flexor activity, respectively. Total hip power was calculated as follows: H1: 0% to 30%, hip extensor concentric activity during loading; H2: 25% to 75%, hip flexor eccentric activity; and H3: 50% to 100%, hip flexor concentric power during preswing and throughout swing (H3).
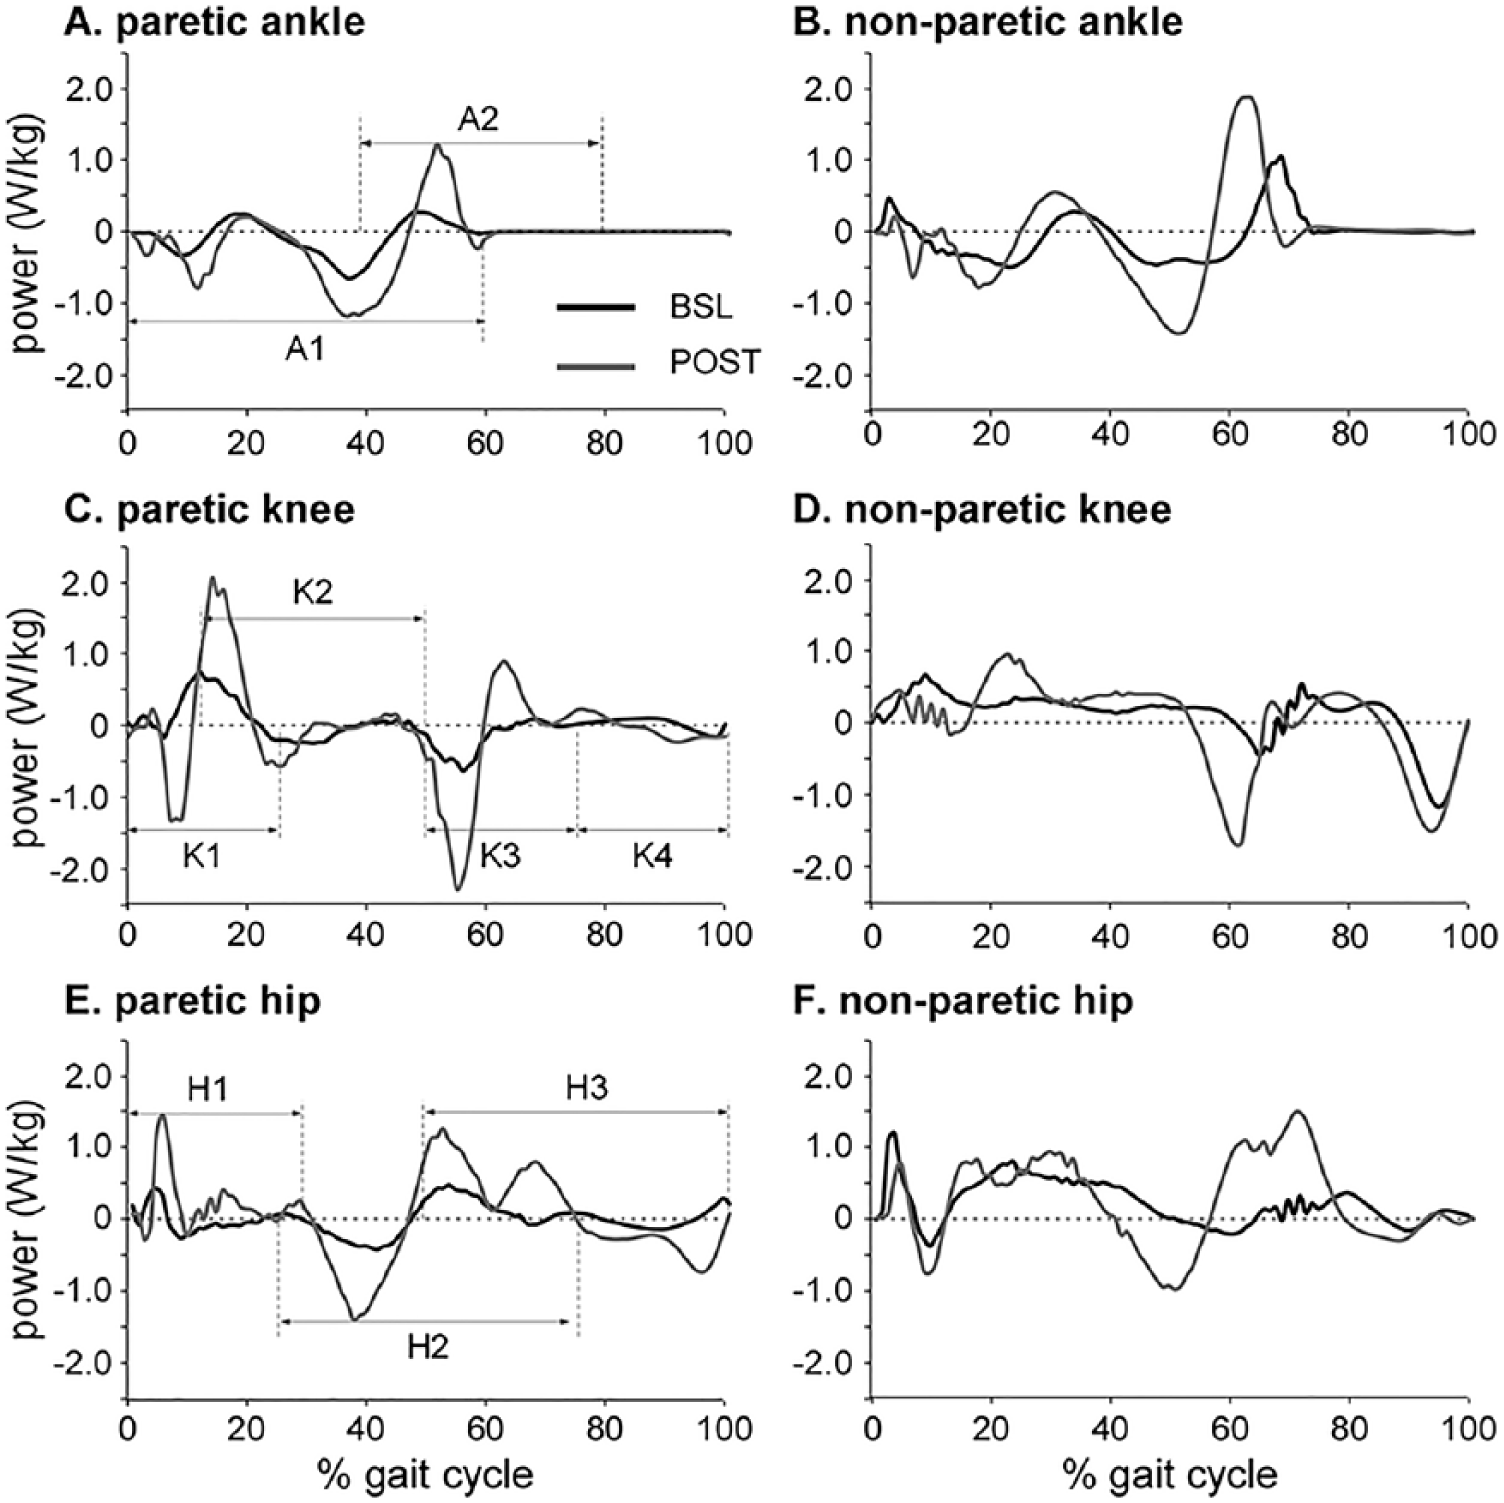
Single-subject example of joint powers at baseline (BSL, black) and following training (POST, gray) in paretic and nonparetic limbs normalized to percentage gait cycle. In paretic limb figures (A, C, E), specific phases of the gait cycle during which average powers were analyzed are depicted, with illustration of positive (concentric) and negative (eccentric) powers for each joint. Specific phases for nonparetic limbs (B, D, F) are similar to those for paretic limbs but not shown.
To calculate compensatory behaviors both between paretic and nonparetic limbs (interlimb), and within the paretic limb (ie, proximal vs distal; intralimb), 3 primary variables were calculated. The primary measure to evaluate interlimb compensation was the ratio of total limb nonparetic to paretic concentric power (nonparetic/paretic), defined as a sum of average positive powers of the hip, knee, and ankle. Secondary measures of interlimb compensation were the ratios of nonparetic/paretic powers for each phase of the GC as described above. To estimate intralimb compensation, the primary variables of interest were the ratios of paretic limb concentric hip-ankle or knee-ankle powers across the GC (ie, hip/ankle and knee/ankle). In able-bodied individuals, ankle and hip average powers are nearly equivalent, with average positive knee power approximately 50% of total positive ankle power 29 ; lower scores toward 1.0 and 0.5, respectively, were indicators of reduced intralimb compensation. Secondary intralimb compensatory variables included similar ratios for negative powers and for nonparetic hip-to-ankle and knee-to-ankle powers.
EMG signals were band-pass filtered with a finite impulse response filter (Lancosh type 79-point window filtering, band-pass range from 30 to 450 Hz), rectified, and smoothed using root mean square calculations over a 50-ms window. 30 All EMG waveforms were visually inspected, with removal of GCs with substantial movement artifact or low signal-to-noise ratio, and at least 15 GCs were considered for each participant. EMGs were amplitude normalized to the corresponding average of their peak values across all available cycles.
Nonnegative matrix factorization (NNMF) was used to evaluate neuromuscular synergies from normalized EMG envelops. 31 The concept of synergy refers to the synchrony of neural commands to execute each phase of a GC and the groups of muscles that are activated together in response to a neural command (coordination). 32 The averaged, normalized EMG data were organized as a matrix (100 × 6), which was then imported into the NNMF algorithms to be factorized into 2 matrices, including neural commands (W) and coordination of muscles in response to the neural commands (C) such that the product of neural commands and muscle coordination reconstruct the experimental EMG signals:

where “n” refers to the size of factorization. Considering the redundancy of the neuromuscular system, the size of factorization (n) can vary between 1, when assuming that all muscles were activated simultaneously with a single neural command, to 6, when assuming that each muscle is activated with a separate neural command. The NNMF determines the smallest size of factorization (n) to minimize the Euclidian distance between experimental EMG and W × C, such that the latter explains at least 90% of the variance in experimental EMG, defined as the variance accounted for (VAF), calculated as follows:
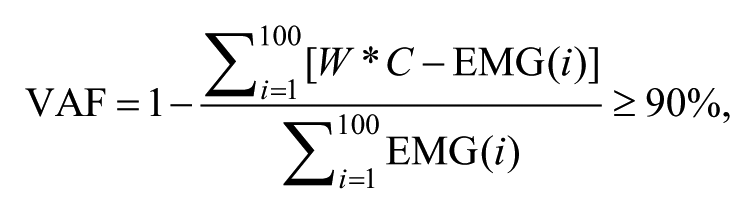
where i refers to every 1% increment in normalized GC. In this study, the size of factorization was the variable of interest. This variable indicates the number of neural commands recruited by the CNS during a GC and, hence, demonstrates the underlying complexity of the nervous system. Previous studies demonstrated that higher complexities (ie, larger n) are often associated with higher function and better coordination in patients with or without neurological damage.33,34 Figure 2 demonstrates an example of a participant with 3 independent synergies accounting for at least 90% of the variance prior to training.
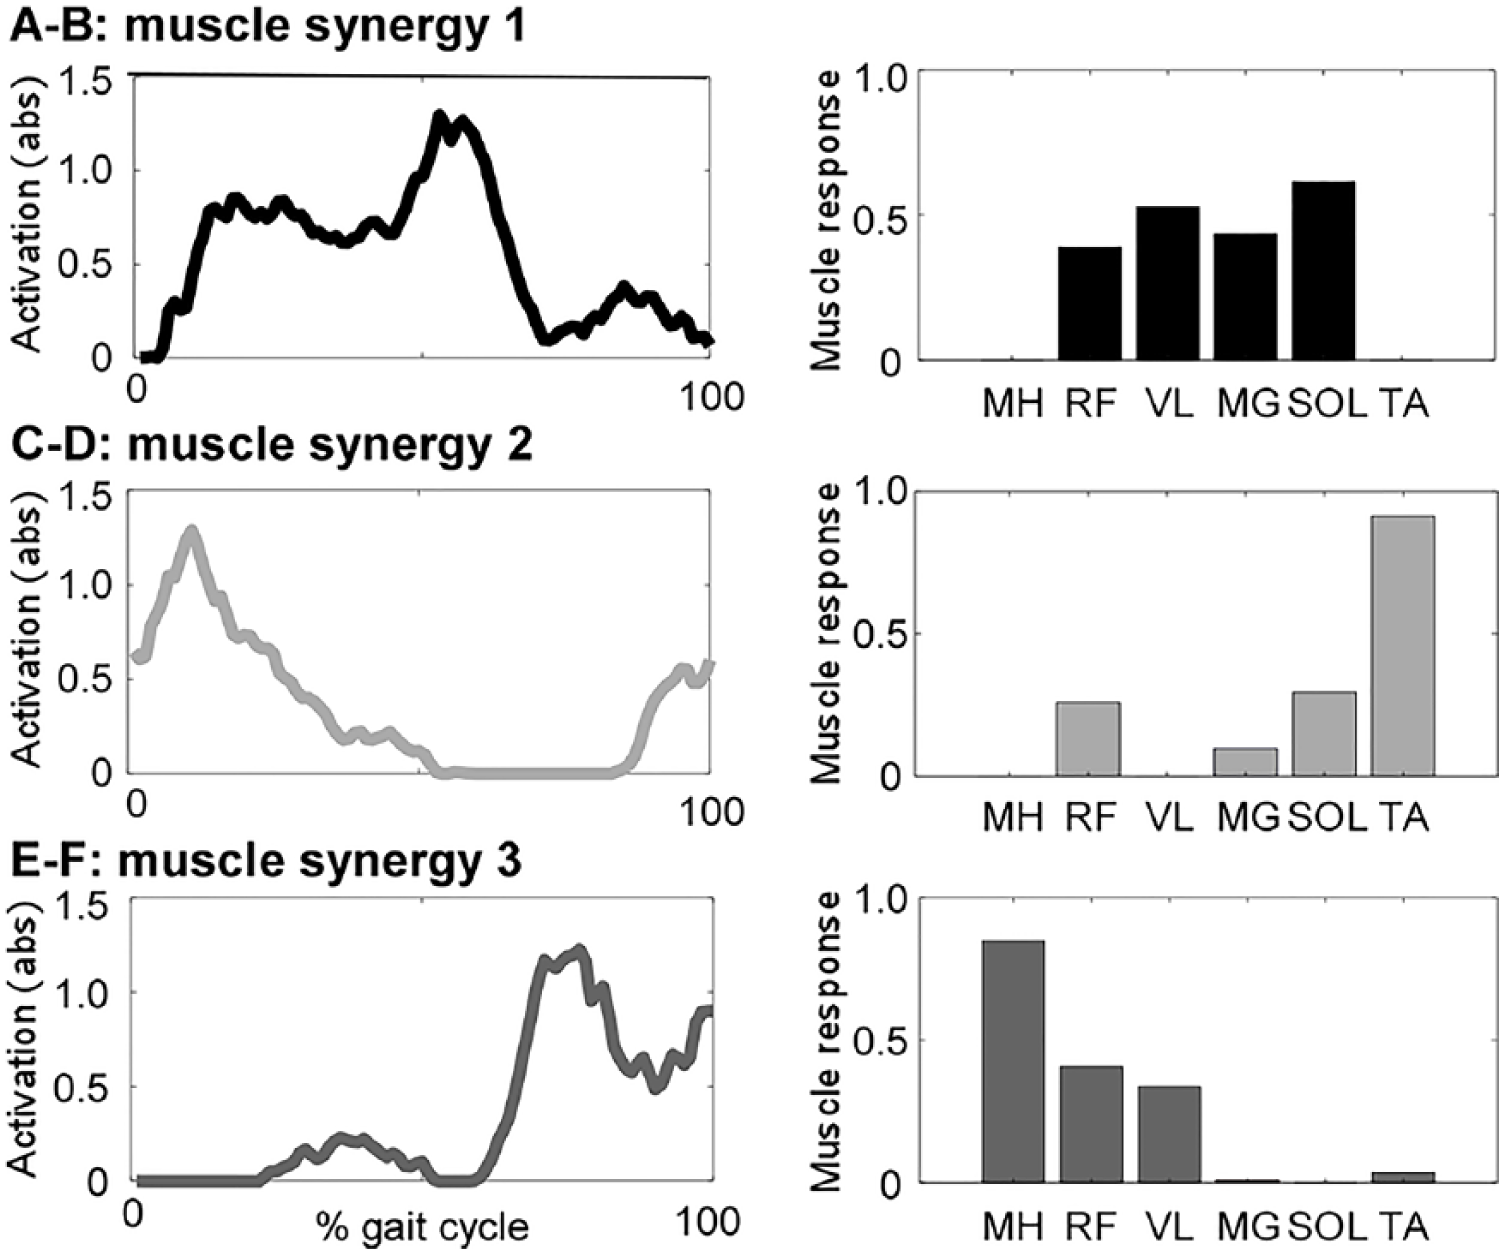
Single-subject example of muscle synergy analyses at baseline, with both total activations (A, C, E) and individual muscle responses (B, D, F). Data for posttraining are not shown but are detailed in text.
Statistical Analysis
The primary analyses focused on comparisons of spatiotemporal and kinetic measures collected at BSL and POST peak TM speed using paired t-test comparisons (BSL vs POST). Analysis of EMG complexity was also treated as ratio data, and paired t-tests were used to compare number of synergies present at BSL versus POST. To control for the influence of speed, separate t-tests were also performed between measures obtained at BSL and those obtained at POST TM speeds matched to BSL peak speeds (ie, BSL vs MATCH). These analyses were performed with a primary goal of evaluating potential changes in interlimb and intralimb compensatory behaviors and EMG activity caused by training itself, rather than changes in speeds. Data were also compared for selected measures of ankle power in patients with and without the use of an ankle-foot orthosis (AFO).Analyses were not controlled for multiple comparisons given the pilot nature of the study. Pearson correlation analyses were used to investigate potential associations between improvements in locomotor metrics (speed) as the dependent variables and joint kinetics, with subsequent use of stepwise multiple linear regression analyses to determine the primary contributors to changes in speed.
Results
Two of 22 participants could not walk for >1 minute at 0.1 m/s and were excluded from this analysis. In addition, 5 of 20 patients could walk on the TM but could not accurately place each limb on the separate TM belts, which resulted in 15 participants with valid kinematic/kinetic/EMG data. Demographics of these participants were as follows: age = 53.5 ± 11.0 years old; duration postinjury = 22.6 ± 30 months; 8/7 male/female; 7/8 chronic/subacute; and 9/6 with right/left hemiparesis. Nine of 15 participants wore AFOs during testing and training. The average number of training sessions within the 10 weeks was 38 ± 5.9 sessions, although 1 participant needed to terminate testing at 17 sessions because of a family emergency. All participants achieved the targeted intensity range during the first (n = 13) or second (n = 2) training session (ie, HR > 70% HRmax or rating of perceived exertion (RPE) > 14), which was maintained during all subsequent sessions and tolerated by participants. Three individuals experienced a fall outside of training, although all continued with the intervention. One participant presented with diastolic pressures ranging from 100 to 110 mm Hg prior to training sessions, which limited the ability to achieve higher intensities until medically controlled. There were otherwise no significant adverse events during training.
Changes in Gait Spatiotemporal Variables
Peak TM speeds increased from BSL to POST (0.60 ± 0.39 to 1.0 ± 0.41 m/s; P < .01), with significant gains in cadence (83 ± 18 to 99 ± 18 steps/min, P < .01) and stride length (0.82 ± 0.42 to 1.2 ± 0.36 m, P < .01). Comparisons of BSL with MATCH revealed small but significant (P < .05) changes in cadence (83 ± 18 to 78 ± 18 steps/min) and stride length (0.82 ± 0.42 to 0.87 ± 0.41 m). Handle forces revealed decreased vertical force from BSL (0.48 ± 0.27 N/kg) to MATCH (0.35 ± 0.19, P < .01) and POST (0.34 ± 0.19 N, P < .05), whereas propulsive forces demonstrated a significant increase only from BSL to POST (0.07 ± 0.09 to 0.14 ± 0.09 N, P < .05).
Changes in Kinetic Variables
Following high-intensity training, comparisons of kinetic data at peak speeds collected at BSL and POST indicate significant bilateral increases in concentric and eccentric powers (Table 1). Average gains in paretic and nonparetic concentric total limb powers were 121% and 63% of BSL (both P < .01), respectively, and improvements of 70% and 76% for eccentric paretic and nonparetic limb powers (P < .01). For joint-level changes, a single-subject example is provided in Figure 1, demonstrating trends of increased powers consistent with the sample population. For concentric (positive) powers, significant increases were observed at nearly all joints, including bilateral hip extensors at initial loading (H1) and hip flexors at preswing to initial swing (H3), knee extensors at midstance (K2), and plantar flexors at terminal stance/preswing (A2). Only changes in nonparetic concentric knee powers were not significant. Participants who wore an AFO showed smaller positive ankle power at BSL compared with those without AFOs (BSL, 0.018 ± 0.015, vs without AFO, 0.055 ± 0.030 W/Kg, respectively). With training, however, changes in positive ankle power were not significantly different between AFO users when compared with nonusers (POST: 0.048 ± 0.041 vs 0.082 ± 0.056 W/kg).
Changes in Average Total Limb, Hip, Knee, and Ankle Concentric and Eccentric Powers at Specific Gait Phases Across the Gait Cycle for Both Paretic and Nonparetic Limbs (All Units Are W/kg).
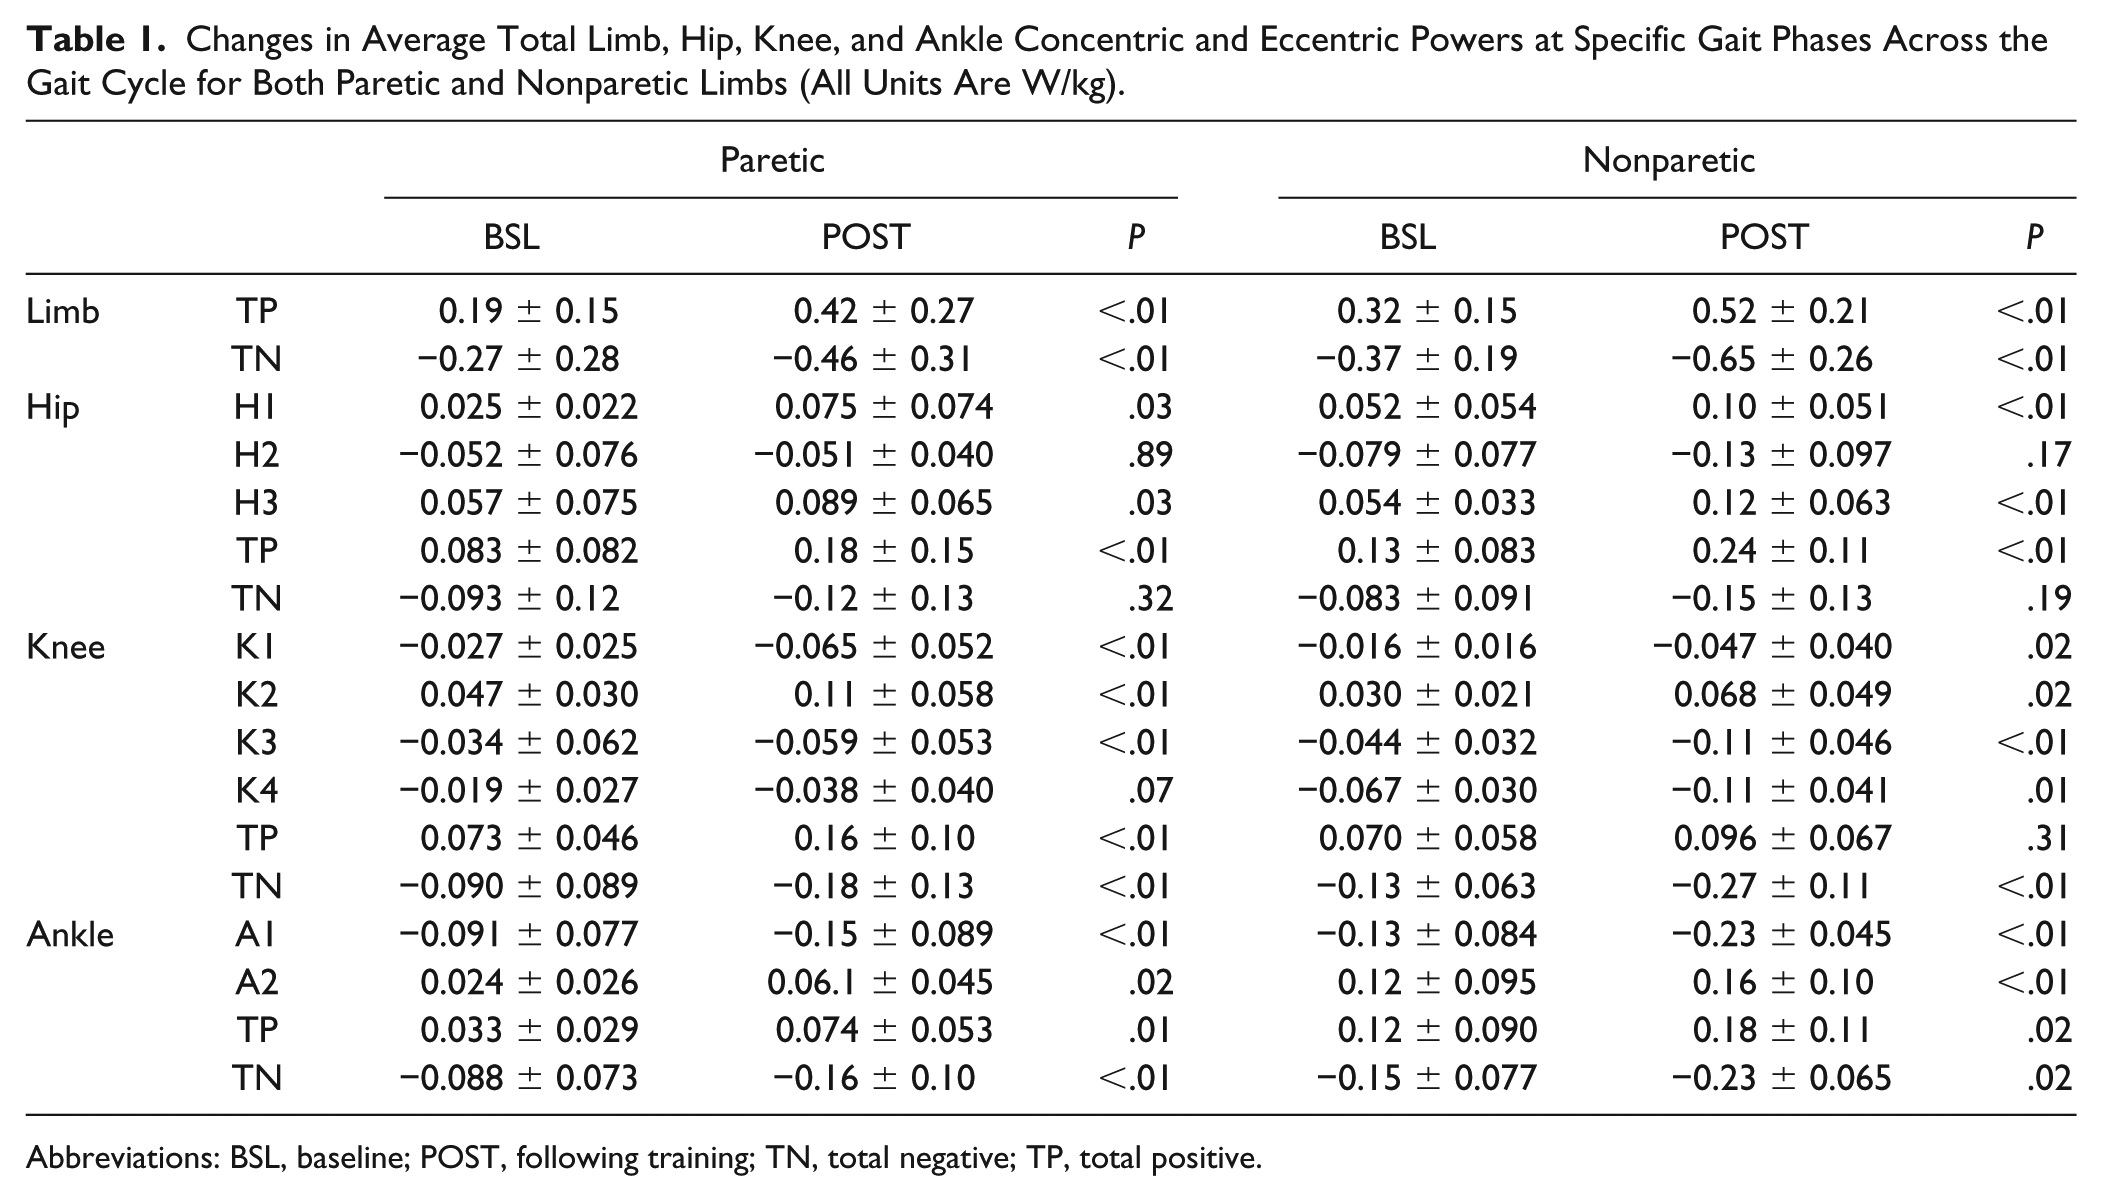
Abbreviations: BSL, baseline; POST, following training; TN, total negative; TP, total positive.
Differences in negative (ie, eccentric) power at the paretic limb from BSL to POST indicate significant increases at all phases of all joints except for the knee at late swing (K4, P = .07) and the hip at midstance to terminal stance (H2, P = .89). Similarly, all nonparetic joints demonstrated increases in eccentric power at all phases, except for the hip during midstance to terminal stance (H2, P = .17). Patients who wore AFOs also demonstrated smaller eccentric ankle power at BSL (−0.046 ± 0.032 vs −0.15 ± 0.076 W/kg) with no differences between changes (POST: −0.11 ± 0.073 vs −0.21 ± 0.090 W/kg).
When controlling for speed (ie, BSL to MATCH), changes in total limb powers were not significant (Appendix A), with the exception of total limb paretic eccentric power (P = .03). Specific joint-level changes that approached significance included a small reduction in total negative paretic hip (P = .07) and knee powers (P = .04), negative nonparetic knee powers in late stance/early swing and late swing (K3: P = .06; K4: P = .08), and reduced nonparetic ankle powers at push-off (A2; P = .05).
Interlimb concentric compensation (nonparetic/paretic powers) decreased significantly from BSL (2.3±1.4) to POST (1.5±0.75); P < .01 (Table 2). This finding appears to be primarily a result of improved symmetry (ie, values closer to 1.0) of ankle powers (ie, push-off; A2, P = .04) and nonsignificant improvements in knee (K2, P = .48), with negligible changes in hip interlimb symmetry (H1, P = .95). In contrast, changes in interlimb eccentric compensation were not significantly different from BSL to POST (2.4 ± 1.6 to 1.8 ± 0.90; P = .08), with the largest improvements in knee extensor symmetry during late swing (K4; P = .03).
Changes in Interlimb Compensations in Power Output (Ratio of Nonparetic to Paretic Powers) and Intralimb Compensations (Hip/Ankle and Knee/Ankle). a
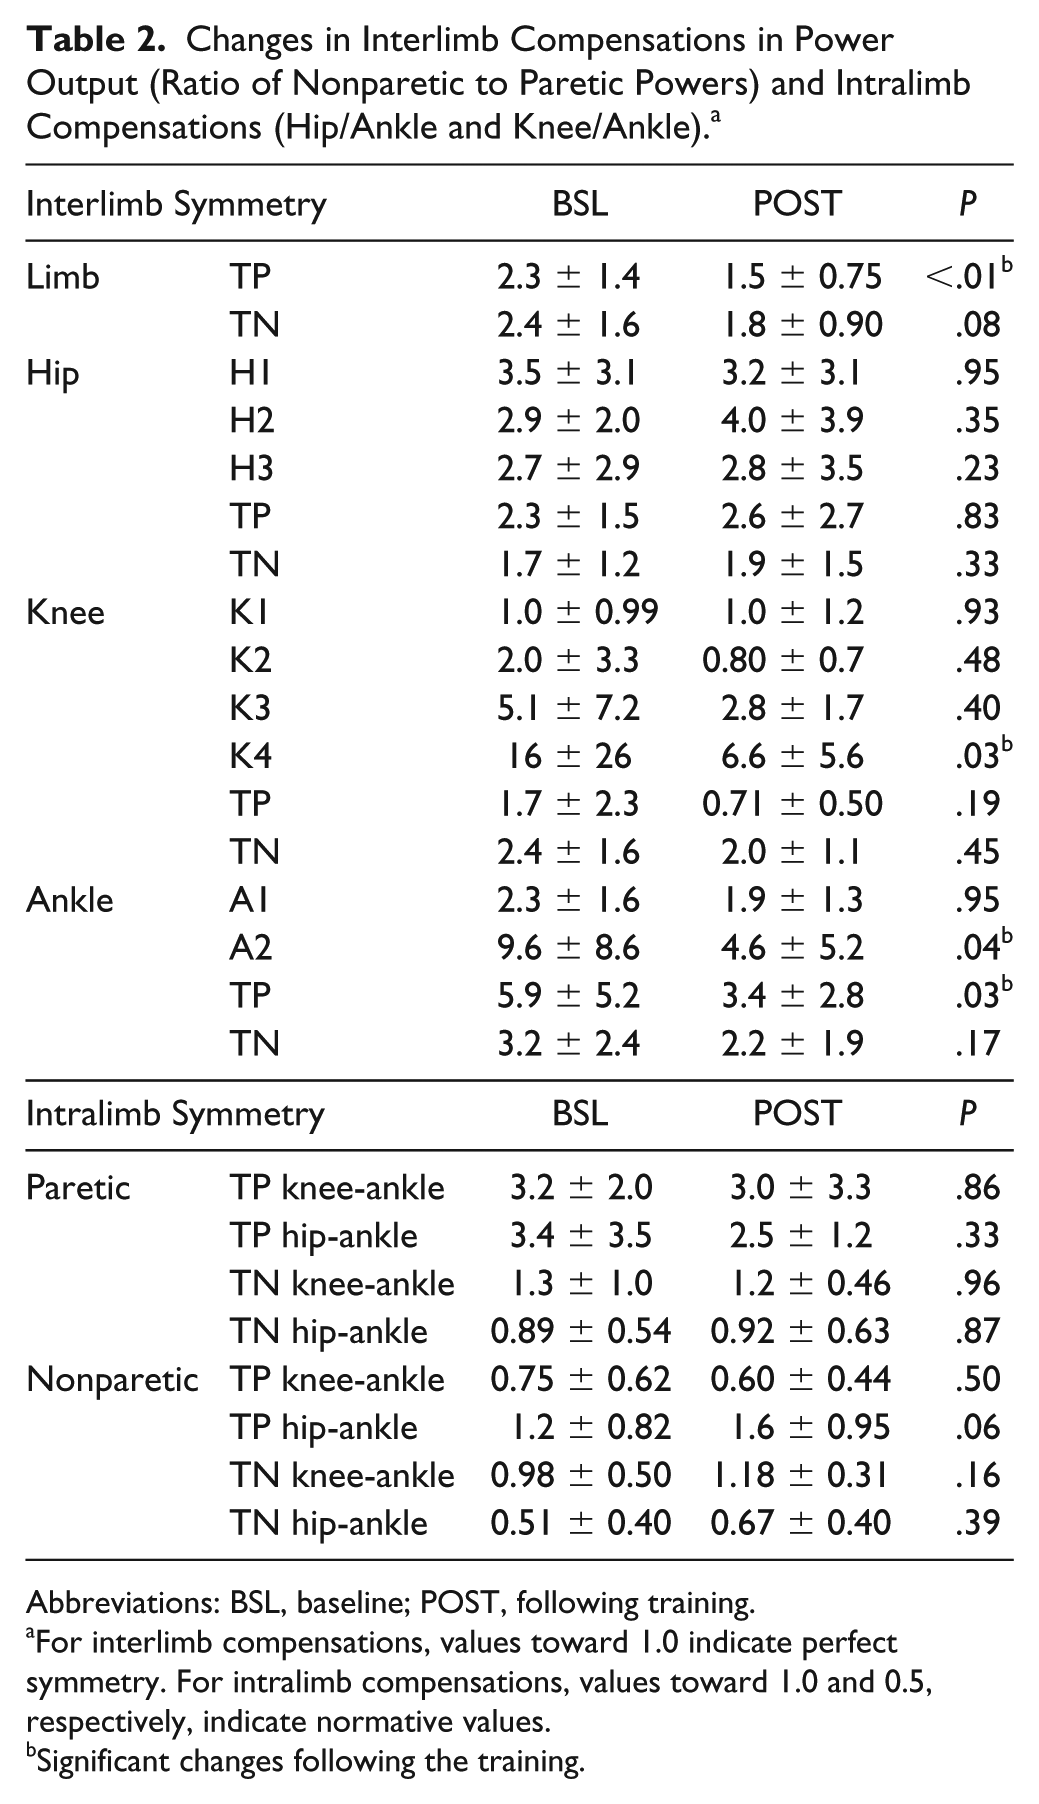
Abbreviations: BSL, baseline; POST, following training.
For interlimb compensations, values toward 1.0 indicate perfect symmetry. For intralimb compensations, values toward 1.0 and 0.5, respectively, indicate normative values.
Significant changes following the training.
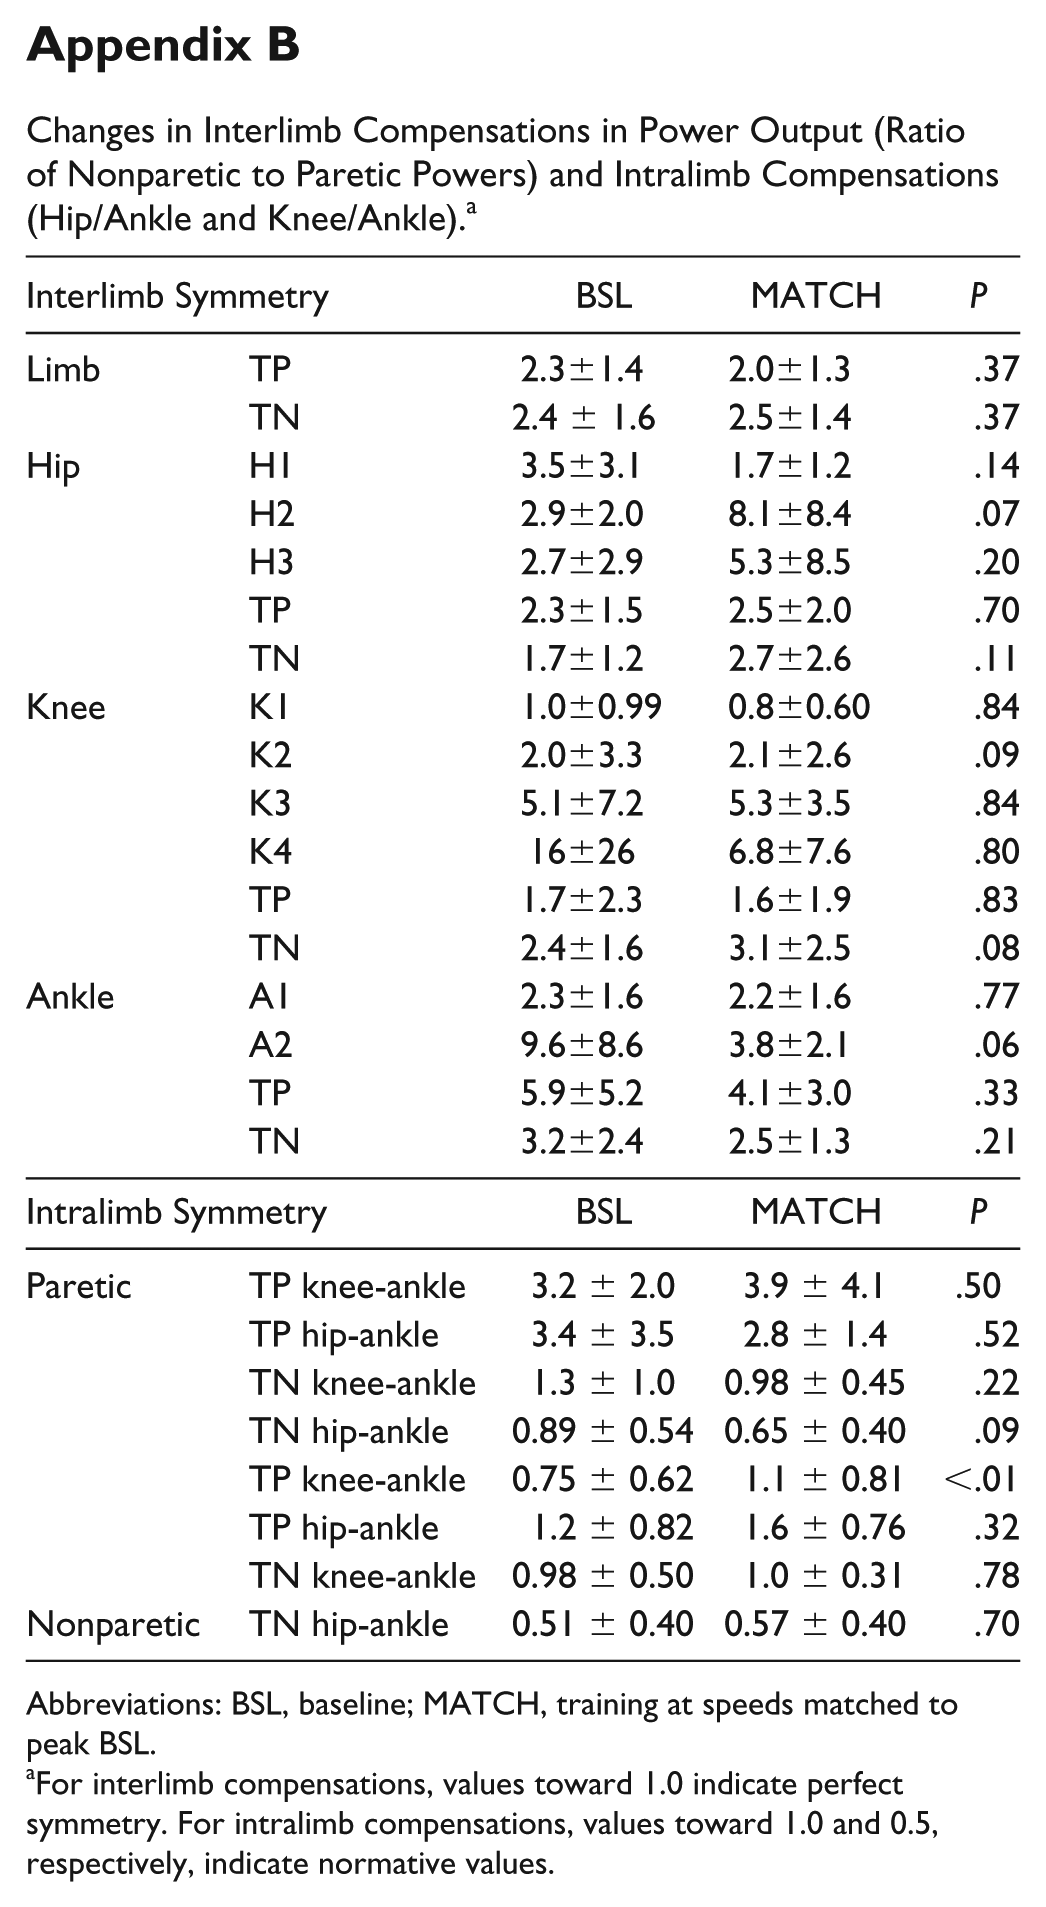
Comparisons of interlimb concentric compensation from BSL to MATCH revealed very few changes (Appendix B), with trends of improved interlimb symmetry at the ankle (A2; P = .06). Conversely, nonsignificant increases (ie, higher values or decreased symmetry) in negative hip eccentric (H2; P = .07) and total knee (P = .08) interlimb compensation were observed.
Evaluation of intralimb compensatory behaviors were largely unchanged throughout training. More directly, intralimb concentric compensation (ie, knee-to-ankle and hip-to-ankle powers) at either the paretic or nonparetic limb were not different from BSL to POST (Table 2). However, intralimb compensation of nonparetic hip-ankle approached significance (P = .06) because of the larger relative increases in positive hip powers.
Comparisons of BSL versus MATCH also demonstrated few significant changes, although general trends indicate nonsignificant decreases in paretic intralimb compensation, except for the knee-ankle concentric power ratio, which increased because of large increases in knee power. For the nonparetic limb, most changes were also not significant, but all suggested greater proximal versus distal limb strategies (ie, higher values). However, nonparetic, intralimb compensation between the knee-ankle was significantly increased (P < .01), indicating more proximal versus distal contributions.
Changes in Neuromuscular Synergies
Using NNMF to evaluate changes in neuromuscular complexity, 65% of participants’ nonparetic limb required 4 modules to account for at least 90% of the variance in EMG activity at BSL, whereas ~50% of the paretic limbs demonstrated 2 to 3 modules. A single-subject example of paretic limb synergies at BSL is provided in Figure 2, with 3 synergies (C1-C3) observed. Specifically, C1 was active throughout initial to terminal stance phases, with strong responses from the quadriceps (RF and VL) and plantar flexors (MG/SOL). The next synergy (C2) was evident in late swing to early stance from TA, RF, and SOL, with smaller responses from MG. The third neural command (C3) was active during swing, with strong responses from MH and some activity from RF/VL.
At POST assessment, however, the complexity observed in the paretic limb often increased to 4 synergies (C1-C4). Typical neuromuscular synergies were as follows: C1, midstance and early swing with VL/RF and TA; C2, late swing/early stance with activity primarily from MH and RF/VL; C3, midstance to terminal stance (VL, MG/SOL); and C4, late stance/early swing (MH, RF, and MG/SOL). Across all participants, the complexity of neuromuscular synergies increased significantly in the paretic limb (3.3 ± 0.60 to 4.0 ± 0.54; P < .05) at POST, with 71% of participants demonstrating 4 synergies at POST. Conversely, complexity was unchanged in the nonparetic limb (3.6 ± 0.50 to 3.8 ± 0.60; P = .23) at POST. Figure 3 indicates the percentage VAF of 1 to 4 muscle synergies in the paretic limb at BSL and POST, indicating that each muscle synergy at POST accounted for less variance than at BSL. Comparisons of the number of synergies at speed-matched trials (BSL vs MATCH) revealed greater number of synergies on the paretic limb with training (3.2 ± 0.30 vs 4.0 ± 0.3; P < .05), with similar changes in specific muscle activity patterns as described above for POST.
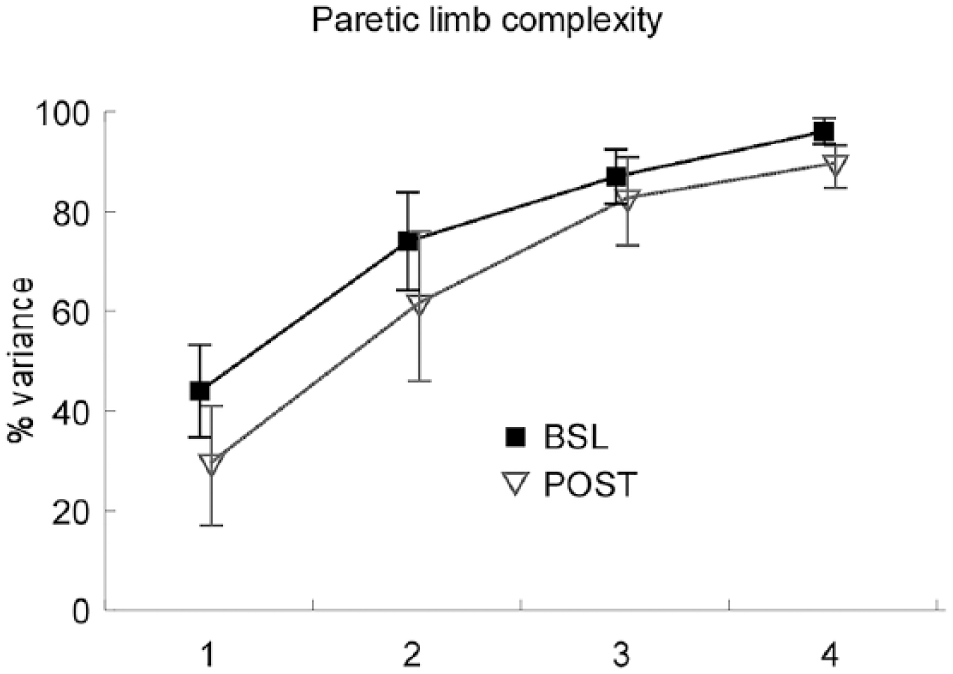
The average total variance accounted for (VAF) by 1 to 4 synergies is depicted at baseline (BSL) and posttraining (POST); reduced VAF is observed at POST versus BSL, indicating that a greater number of synergies are needed to account for a similar VAF threshold of 90% (as used in the present study).
Associations Between Kinetics, Synergies, and Peak Speeds
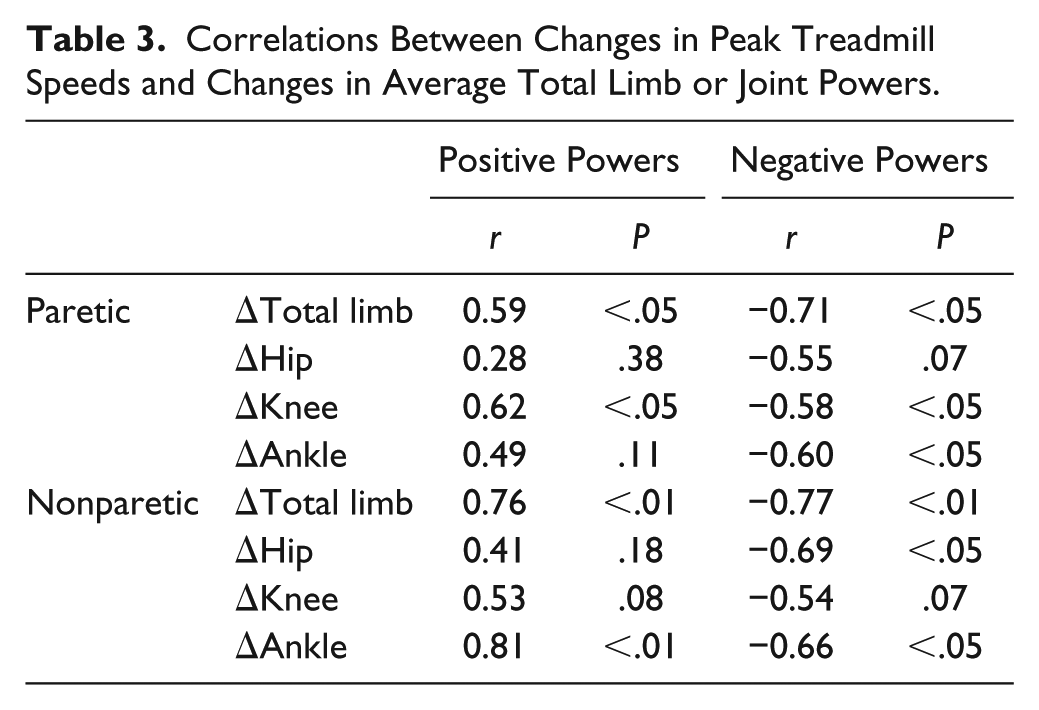
Correlation and regression analyses were utilized to investigate potential associations between changes in joint powers and synergies to improvements in peak TM speeds. Limited associations were observed between peak TM speeds and increased neuromuscular complexity (ie, number of synergies; P > .10). Conversely, changes in nonparetic total limb and joint powers were moderately to strongly correlated with speed increases (r = 0.41-0.81; Table 3), whereas smaller associations were observed with paretic joint and total limb powers (r = 0.28-0.62). Subsequent multiple linear regression analyses indicated that changes in peak TM speed were determined primarily by concentric powers of the nonparetic ankle (r = 0.81; P < .01) and the paretic knee (r = 0.62; P < .05).
Correlations Between Changes in Peak Treadmill Speeds and Changes in Average Total Limb or Joint Powers.
Discussion
In the present study, substantial increases in paretic and nonparetic total limb and joint powers were observed in individuals with chronic and subacute stroke following high-intensity variable stepping training. Evaluation of compensatory strategies indicate reduced interlimb compensation (ratios of nonparetic to paretic powers) at POST, with limited changes in intralimb compensation (proximal to distal power ratios). There were very few changes in kinetics or measures of compensation between BSL and MATCH conditions. The data also suggest improved neuromuscular complexity (ie, number of synergies) in the paretic limb at POST and MATCH. However, changes in peak TM speeds were associated primarily with changes in positive nonparetic ankle powers, with additional significant contributions from increased paretic knee powers.
Improvements in paretic concentric ankle and hip joint powers observed at POST are consistent with increased neuromuscular activation to achieve higher speeds, as observed in intact individuals.5,6,8,10,29 However, the magnitude of changes in paretic ankle power were limited as compared with paretic hip and knee powers, suggesting that altered neuromuscular strategies (ie, compensatory behaviors) were utilized. 29 Smaller gains at the paretic ankle may be a result of reduced distal recovery, but also a result of use of an AFO in some participants, which restricted ankle motion and power generation. Elastic rebound of the AFOs could potentially generate propulsive ankle forces, although power generation in these participants was also small. The combined data suggest that limited ankle recovery required greater proximal paretic power generation, even with nonsignificant changes in intralimb compensation (ie, ratios of hip-ankle or knee-ankle powers). These latter measures are likely not different because of the initially low values for ankle power at BSL (ie, small denominator), such that small changes are magnified when calculating ratios.
Similarly, the significant reduction in interlimb compensation between paretic and nonparetic ankle joints or across both limbs may also be a result of the relatively low values of paretic limb powers observed at BSL. More directly, very small changes in positive paretic ankle power resulted in significant decreases in ankle interlimb compensation, even with large absolute gains observed in the nonparetic ankle. Similarly, the significant reduction in interlimb compensation across all joints was likely a result of the small values for paretic total limb powers, and absolute changes between limbs were similar.
Improvements in neuromuscular complexity (ie, number of synergies) are also of interest and could be interpreted as an indicator of improved recovery with high-intensity stepping training (ie, greater neuromuscular activation and coordination). More directly, BSL assessments revealed abnormal coactivation of selected muscles or the absence of specific patterns of muscle cocontraction that are typically observed during gait. For example, increased TA activity was observed during midstance, which is a hallmark characteristic of inappropriate distal limb activation following neurological injury.35,36 Furthermore, prominent coactivation of MG/SOL during midstance to late stance to assist with propulsion was absent at BSL. At POST and MATCH conditions, however, both these patterns of muscle activity were more consistent with locomotor strategies observed in able-bodied individuals. A caveat of neuromuscular synergy analysis is that these measures of complexity (ie, number of synergies) may be partly a result of greater EMG signal-to-noise ratios between testing conditions, rather than improved timing. Indeed, other measures of muscle timing generally show little improvement in patients poststroke with recovery or training.37,38 Further work should attempt to understand the relative contributions of changes in neuromuscular activation and coordination underlying changes in neuromuscular complexity following high-intensity training.
The present and previous findings indicate that improvements in neuromuscular recovery and use of specific compensatory strategies are both observed following high-intensity variable stepping. For example, improvements in neuromuscular coordination (ie, complexity) and proximal paretic limb power generation observed here is consistent with other studies demonstrating amelioration of selected impairments (eg, paretic limb isometric torques or balance 25 ) or kinematic strategies, such as improved spatiotemporal symmetry18,20 and hip-knee kinematic consistency. 26 However, increased proximal paretic limb power generation is also a compensatory mechanism for reduced recovery of distal motor function and consistent with other kinematic compensatory patterns observed posttraining (eg, circumduction). 26 A potential hypothesis is that gains in recovery and increased compensatory strategies may both be necessary to achieve substantial increases in walking speeds poststroke. More directly, specific neuromuscular limitations, such as proximal weakness, may be mitigated by plastic changes in residual spinal or supraspinal structures to augment neuromuscular activation with training. 25 Alternatively, other neuromuscular constraints, including distal weakness, may be less amenable to change, and patients may need to utilize alternative movement strategies to accomplish specific task demands.39,40 Remaining questions include whether similar gains in walking function can be achieved without use of compensatory patterns and, if possible, what interventions would be required to elicit those changes. The negative consequences of performing compensatory movement strategies should also be delineated and weighed against the potential benefits of enhanced locomotor function, including increased cardiopulmonary fitness, 41 community mobility,18-20 and quality of life.17,18
Specific limitations of the current study include the limited sample size and the lack of a control group to evaluate comparative changes in neuromuscular activation and coordination. In a subsequent randomized trial comparing this training paradigm with conventional physical interventions, 18 similar improvements in TM speed were observed as reported here. 26 However, in this latter study, EMG was not collected, and joint kinetics could not be accurately assessed because of participants’ inability to maintain foot placement on each TM belt during testing. Although similar changes may be expected, more rigorous assessment of biomechanical parameters underlying gait improvements are necessary.
Further limitations include the use of multiple paired comparisons, although the preliminary nature of this study was designed to identify all potential changes. Additional limitations include data collection on a motorized TM with use of handrails, which may alter selected locomotor strategies as compared with overground walking (see, however, Lee and Hidler 42 ). Additional concerns with interpretation of neuromuscular synergies are described above, and further work should be directed toward normalization of EMG recordings to better estimate improvements in neuromuscular activation versus coordination.
In conclusion, substantial gains in locomotor speeds following higher-intensity stepping practice provided to participants poststroke resulted in changes in movement strategies that reflect both improved neuromuscular recovery and increased compensation. Future work should attempt to delineate whether walking improvements can be elicited without use of compensatory patterns, interventions that facilitate these improvements, or if these compensations result in adverse biomechanical consequences that lead to further injury.
Footnotes
Appendix
Changes in Interlimb Compensations in Power Output (Ratio of Nonparetic to Paretic Powers) and Intralimb Compensations (Hip/Ankle and Knee/Ankle). a
| Interlimb Symmetry | BSL | MATCH | P | |
|---|---|---|---|---|
| Limb | TP | 2.3±1.4 | 2.0±1.3 | .37 |
| TN | 2.4 ± 1.6 | 2.5±1.4 | .37 | |
| Hip | H1 | 3.5±3.1 | 1.7±1.2 | .14 |
| H2 | 2.9±2.0 | 8.1±8.4 | .07 | |
| H3 | 2.7±2.9 | 5.3±8.5 | .20 | |
| TP | 2.3±1.5 | 2.5±2.0 | .70 | |
| TN | 1.7±1.2 | 2.7±2.6 | .11 | |
| Knee | K1 | 1.0±0.99 | 0.8±0.60 | .84 |
| K2 | 2.0±3.3 | 2.1±2.6 | .09 | |
| K3 | 5.1±7.2 | 5.3±3.5 | .84 | |
| K4 | 16±26 | 6.8±7.6 | .80 | |
| TP | 1.7±2.3 | 1.6±1.9 | .83 | |
| TN | 2.4±1.6 | 3.1±2.5 | .08 | |
| Ankle | A1 | 2.3±1.6 | 2.2±1.6 | .77 |
| A2 | 9.6±8.6 | 3.8±2.1 | .06 | |
| TP | 5.9±5.2 | 4.1±3.0 | .33 | |
| TN | 3.2±2.4 | 2.5±1.3 | .21 | |
| Intralimb Symmetry | BSL | MATCH | P | |
| Paretic | TP knee-ankle | 3.2 ± 2.0 | 3.9 ± 4.1 | .50 |
| TP hip-ankle | 3.4 ± 3.5 | 2.8 ± 1.4 | .52 | |
| TN knee-ankle | 1.3 ± 1.0 | 0.98 ± 0.45 | .22 | |
| TN hip-ankle | 0.89 ± 0.54 | 0.65 ± 0.40 | .09 | |
| Nonparetic | TP knee-ankle | 0.75 ± 0.62 | 1.1 ± 0.81 | <.01 |
| TP hip-ankle | 1.2 ± 0.82 | 1.6 ± 0.76 | .32 | |
| TN knee-ankle | 0.98 ± 0.50 | 1.0 ± 0.31 | .78 | |
| TN hip-ankle | 0.51 ± 0.40 | 0.57 ± 0.40 | .70 | |
Abbreviations: BSL, baseline; MATCH, training at speeds matched to peak BSL.
For interlimb compensations, values toward 1.0 indicate perfect symmetry. For intralimb compensations, values toward 1.0 and 0.5, respectively, indicate normative values.
Declaration of Conflicting Interests
The authors declared no potential conflicts of interest with respect to the research, authorship, and/or publication of this article.
Funding
The authors disclosed receipt of the following financial support for the research, authorship and/or publication of this article: The study was funded by NIDRR/RRTC-H133B031127.