
Abstract
Background. There is mounting evidence that the central nervous system utilizes a modular approach for neuromuscular control of walking by activating groups of muscles in units termed muscle synergies. Examination of muscle synergies in clinical populations may provide insights into alteration of neuromuscular control underlying pathological gait patterns. Previous studies utilizing synergy analysis have reported reduced motor control complexity during walking in those with neurological deficits, revealing the potential clinical utility of this approach. Methods. We extracted muscle synergies on a stride-to-stride basis from 20 children with cerebral palsy (CP; Gross Motor Function Classification System levels I-II) and 8 children without CP, allowing the number of synergies to vary for each stride. Similar muscle synergies across all participants and strides were grouped using a k-means clustering and discriminant analysis. Results. In total, 10 clusters representing 10 distinct synergies were found across the 28 individuals. Relative to their total number of synergies deployed during walking, synergies from children with CP were present in a higher number of clusters than in children with typical development (TD), indicating significantly greater stride-to-stride variability. This increased variability was present despite reduced complexity, as measured by the mean number of synergies in each stride. Whereas children with CP demonstrate some novel synergies, they also deploy some of the same muscle synergies as those with TD, although less frequently and with more variability. Conclusion. A stride-by-stride approach to muscle synergy analysis expands its clinical utility and may provide a method to tailor rehabilitation strategies by revealing inconsistent but functional synergies in each child with CP.
Introduction
Gait patterns in children with cerebral palsy (CP) can be influenced by muscle weakness, spasticity, poor selective motor control, sensory abnormalities, and secondary musculoskeletal changes.1,2 Abnormal patterns also arise from altered projections from the motor cortex to spinal motor neurons. 3 Functional limitations may worsen over time, especially after adolescence and in less-functional individuals, 4 resulting in diminished mobility with age. 5
Walking is a complex motor task that requires coordination of many degrees of freedom. Previous studies suggest that the central nervous system controls gait with a modular approach,6,7 whereby groups of muscles are recruited and activated as a single unit 8 referred to as a synergy.7,9 Studies in healthy populations report that a small set of synergies can describe muscle activity during walking6,10-13 and that individuals consistently recruit the same muscle synergy during each gait phase. The activation profile and synergy structure—that is, the relative weighting of the muscles that comprise each synergy—have also been reported to be consistent across studies,9,13 revealing that a small number of synergies (4-6) can account for greater than 90% of the variance observed from individually recorded electromyography (EMG) during walking. Similar synergies may be deployed across related tasks that exhibit distinct kinematics (eg, running vs walking) or kinetics (eg, with or without body weight support), suggesting a neural origin to their organization.9,11,14,15
In individuals with neurological deficits—for example, stroke and CP—the same level of variance in EMG is accounted for by a lower synergy number than in those without deficits,16-20 and the variance accounted for (VAF) by a single synergy was significantly higher in CP than in controls with typical development (TD). 18 These findings were correlated with clinical measures of decreased function 16 and increased spasticity 19 and have been attributed to merging of synergies21,22; however, the evidence for merging of synergies in those with neurological deficits is not conclusive. Cluster analysis of synergy structures extracted from 22 muscles showed that the same optimal number of clusters (4) described EMG patterns in children with CP and typical development (TD), although the activation profile of each synergy appeared to be broader in CP than TD, suggesting less precise control of timing. 23 Comparable structures were also found in those with subacute stroke and healthy controls 24 and in backward walking in those with CP and TD. 25 Thus, the effect of brain injury on the number and structure of synergies deployed during walking remains an open question.
Beyond assessing motor complexity across groups, synergy analysis has also shown promise as a clinical measure. The response to treadmill training in individuals poststroke was related to synergy number before therapy. 26 Similarly, a retrospective synergy analysis in children with CP indicated that dynamic complexity was associated with better treatment outcomes. 27 Yet these findings may be merely a glimpse into this technique’s potential. We recently demonstrated that stride-to-stride muscle synergy analysis can reveal reliable synergies not detected by traditional synergy analyses based solely on a VAF threshold. 28 It is also possible that only examining reliable synergies, regardless of whether they meet the threshold VAF, may omit clinically relevant information. Inconsistent synergies—those with low repeatability—may not constitute spurious noise but instead could have true neurological underpinnings and clinical relevance—that is, be indicative of reflex responses or sporadic involuntary movements. Reducing or eliminating this “noise” through intervention may lead to functional benefits. Conversely, inconsistent synergies demonstrating more functional activation profiles and muscle weightings may represent targets for training paradigms, which could seek to improve their robustness. Differentiating between synergies that arise from noise and those with physiological underpinnings remains a challenge. One potential solution, which we implemented here, is to eschew aggregation of strides (eg, averaging or concatenating), which filters out stride-specific features, and instead extract synergies from individual strides. The stride-specific synergies could be inspected based on their structure and activation timing, either manually or algorithmically, to verify that they are physiologically meaningful and then compared across a bout of walking to assess the consistency of the underlying neuromotor control strategies.
Given the high stride-to-stride motor variability exhibited in immature gait, 29 combined with the irregular synchrony of motor units 30 and loss of selective motor control 31 in children with CP, muscle synergies underlying gait in this population may be substantially more variable across strides compared with those in typically developing peers. A more in-depth analysis of these synergies is, therefore, likely to reveal useful clinical insights. Our aim was to investigate the variability of muscle synergy number and structure during walking in children with CP and those with TD using an approach different to that utilized previously. We extracted muscle synergies from individual strides, allowing the number of synergies to vary for each stride. Then, clustering and discriminant analyses were used to identify similar synergies across strides. Based on observed motor variability in CP and other brain injuries,30,32 we hypothesized that children with CP would exhibit a larger number of unique muscle synergy structures during walking than children with TD. We also evaluated whether stride-to-stride variability of individual muscle activations differed between children with CP and TD. Finally, we examined whether stride-to-stride variability of synergies was correlated with functional mobility.
Methods
Participants
Participants in this study included 20 children with CP (11 male; mean age, 12.5 ± 3.3 years; body mass, 43.9 ± 14.5 kg; height, 149.6 ± 16.3 cm) and 8 with TD (3 male; mean age, 12.0 ± 2.6 years; body mass, 45.1 ± 9.8 kg; height, 150.4 ± 11.4 cm). A total of 17 children had a diagnosis of hemiplegia, and 3 had diplegia; 12 were Gross Motor Function Classification System (GMFCS) level I, and 8 were level II. All participants were able to walk independently. Data were collected during the baseline visit for a planned intervention study, with exclusion criteria for that study including an equinus deformity (less than 0° ankle dorsiflexion with knee extension), botulinum toxin injection within 4 months, or orthopedic surgery on the legs within a year. The institutional review board approved the study protocol (#90-CC-0168). Informed consent and assent were obtained from a legal guardian and each participant, respectively.
Procedures
Participants completed 5 overground walking trials at a self-selected pace while synchronized EMG (Trigno, Delsys, Boston, MA) and joint (hip, knee, and ankle) kinematic data using 10 motion capture cameras (Vicon, Denver, CO) were collected. Bipolar surface electrodes recorded EMG from the tibialis anterior (TA), medial gastrocnemius (MG), rectus femoris (RF), and medial hamstrings (MH) bilaterally. The EMG sampling rate was 960 Hz, with a fixed low-pass filter at 450 Hz within the hardware. Placement of EMG electrodes was per SENIAM guidelines, and signals were verified by manual muscle testing to ensure proper location. Kinematic data were used to determine the time point of heel contact in the dominant or less-impaired leg during each trial as the start and end of a single stride or gait cycle. Five gait cycles of EMG data were randomly selected per participant for analysis. Data were analyzed using Visual3D (C-Motion, Germantown, MD) and MATLAB (Mathworks, Natick, MA) software.
Muscle Synergy Analysis
EMG signals were high-pass filtered (third-order Butterworth) at 35 Hz, full-wave rectified, and low-pass filtered (third-order Butterworth) with a cutoff of 5 Hz. Then, EMG data were time interpolated to 100 points over a gait cycle and normalized by the maximum activation value in each gait cycle, resulting in Muscle × Time matrices (EMG0) ranging from 0 to 1. Nonnegative matrix factorization was used to extract muscle synergies from EMG0 for single-gait cycles. 33 This linear decomposition technique computed muscle synergies according to the following formula:
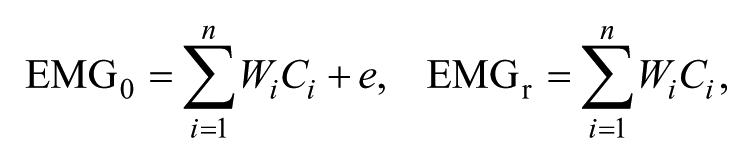
where n is the number of synergies ranging from 1 to 8, W is a synergy structure (Muscle × n) indicating weighting values of individual muscles for each synergy, C is a synergy activation (n × Time) indicating time-varying synergy activation profiles, and e is residual error. EMGr is a reconstructed EMG matrix (Muscle × Time) calculated from the multiplication of W and C. To determine the number of muscle synergies, we calculated the VAF as follows:
The VAF threshold was set at 90% as in previous studies 28 for our primary analysis. For each gait cycle, we identified the lowest number of synergies that resulted in >90% total VAF. To assess the sensitivity of our stride-to-stride variability outcome measures, we repeated the analysis for VAF thresholds of 75%, 80%, 85%, and 95%. We also computed the VAF by 1 synergy and the z-score of the unaccounted variance by a single synergy termed walk-DMC. 18
Stride-to-Stride Variability
The stride-to-stride variability of muscle synergies was examined using synergy structures (W) from the 5 strides for each subject. The number of muscle synergies required to reach the VAF threshold can vary between strides even in healthy individuals, 34 and likely also in children with CP, making it impracticable to analyze stride-to-stride variability using conventional methods such as intraclass correlation coefficient (ICC) alone. Thus, we combined iterative k-means clustering with ICC analyses 28 to assess the stride-to-stride variability of muscle synergies during walking while allowing the number of synergies to differ between strides. Synergies from individual strides were mapped to the multidimensional (n = 8) parameter space based on their structure matrices and were then clustered into groups using k-means. ICC was then computed for each cluster to assess the similarity of synergies within it. For an individual, the number of clusters in which their synergies were present provided a measure of synergy variability across strides because disparate synergy structures between strides were grouped into different clusters. For instance, if 5 gait cycles each required 4 muscle synergies to satisfy the VAF threshold and each of those 4 synergy structures was strongly consistent across the 5 gait cycles, these synergies would be assigned to 4 clusters. Conversely, if the 4 synergy structures were highly variable across the 5 gait cycles, these synergies would be assigned into as many as 20 distinct clusters.
The size of the data matrix for clustering was 8 muscles × ∑nW, where ∑nW is the total number of synergies across the 5 strides in all participants. k-Means clustering was performed with 10 replicates to avoid local minima. 28 The initial value of k (the number of clusters) was set as the maximum number of synergies extracted from a single stride across all individuals. Clustering was repeated with a sequential increase in k and proceeded until the sum of the square of the distances between all points in the cluster and the cluster center were minimized. The value of k was increased if synergy structures extracted from the same gait cycle were not assigned to different clusters. Next, a discriminant analysis was used to revise cluster assignment if necessary. In this supervised learning process, each synergy structure matrix and its cluster assignment were used to optimize the separation between clusters by projecting the data into a subspace that maximized the variance between means of projected classes (clusters) and minimized the variance within each class (cluster). 35 The discriminant method was determined by the equality of cluster covariance matrices assessed using the Bartlett test. 36 If covariance matrices were equal, linear discriminant analysis was used, otherwise quadratic discriminant analysis was used. 35 Next, the ICC 37 was used to quantify the similarity of the synergy structures assigned to each cluster by discriminant analysis. Those iterative processes were repeated 1000 times, and we selected the case showing the most frequent k and the highest mean ICC value across the clusters. Finally, the number of clusters was determined for each person, and this number was normalized by their total synergy number across all 5 strides to compute the normalized cluster number for each individual (ie, Normalized cluster number = Number of clusters/Total number of synergies).
The stride-to-stride variability of individual muscle EMG and joint angles were also examined using variance and ICC analysis. First, EMG linear envelopes and joint angles were time interpolated to 100 points over a gait cycle. Next, the variance of each time point was computed for each EMG envelope (8 muscles) and joint angle (6 joints) across the 5 strides. Then, the mean variance across the 100 time points was computed.
Statistical Analysis
The total number of synergies, mean number of synergies per stride, number of clusters, and normalized cluster number were compared between groups using an independent t-test. For muscle activation and joint angles, variance and ICC across the 5 strides were compared between groups using a 2-way mixed analysis of variance (ANOVA) using SPSS version 19.0 (IBM, Armonk, NY). Complexity measures were compared between groups using independent t-tests. To identify whether these data were related to functional mobility, Spearman’s correlation coefficients were computed between these and GMFCS. 38 Data were presented with mean ± SD. Statistical significance was set at α = .05.
Results
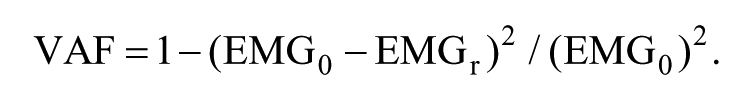
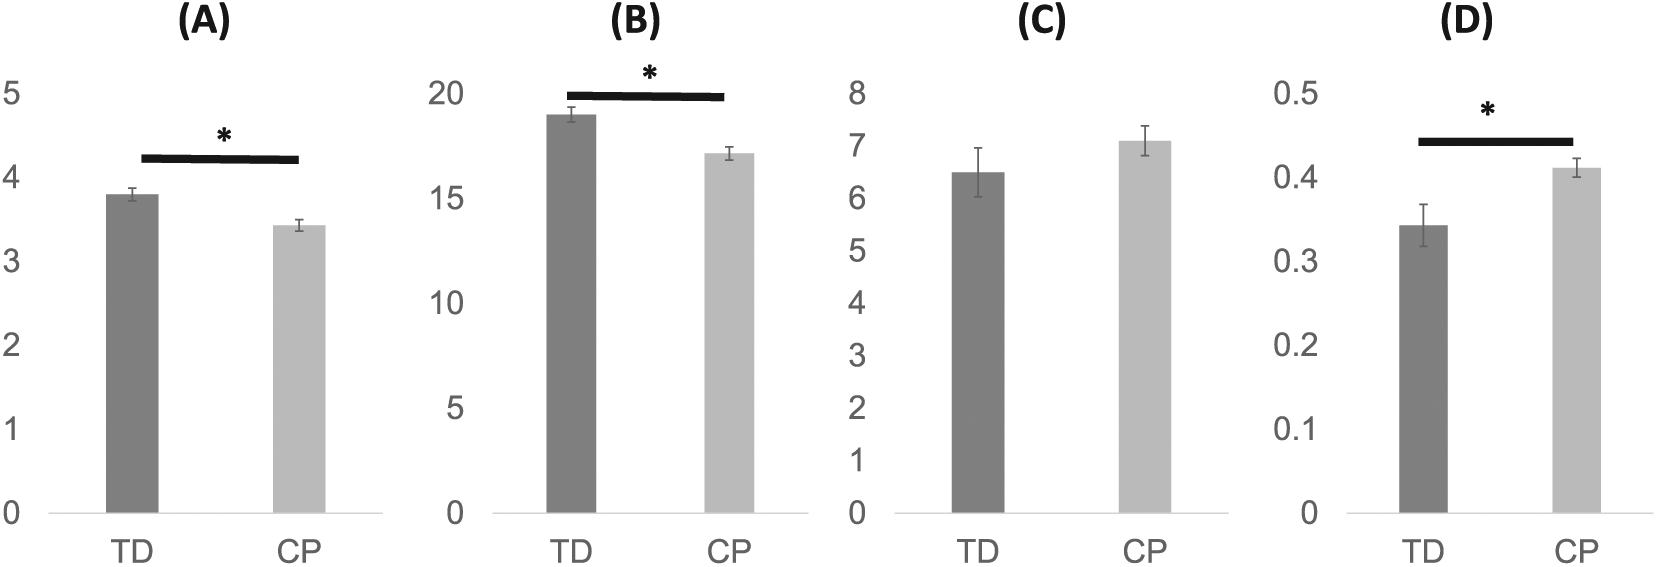
Mean age was not significantly different between groups (P = .72). The mean total number of synergies extracted across the 5 strides was significantly higher (P = .004) in children with TD (19.0 ± 1.0, range: 17-20) compared with CP (17.2 ± 1.5, range: 14-20). On a per stride basis, the mean number of synergies was significantly higher (Figure 1, P = .004) in the TD group (3.80 ± 0.21) than in the CP group (3.43 ± 0.30). The mean variance in the number of synergies per stride was not significantly different between the TD (0.15 ± 0.13) and CP (0.23 ± 0.11) groups (P = .13). The mean number of synergy clusters per individual was slightly higher in the CP group compared with the TD group, but the difference was not significant (Figure 1; TD: 6.5 ± 1.3, CP: 7.1 ± 1.3, P = .300). However, the mean normalized cluster number—that is, the ratio of number of clusters to number of synergies for an individual—was significantly higher in the CP than in the TD group (Figure 1; TD: 0.34 ± 0.07, CP: 0.41 ± 0.05, P = .012). Significantly lower mean number of synergies per stride and significantly greater normalized cluster number for those with CP compared with TD were also found for VAF threshold values of 80%, 85%, and 95%, consistent with the results at the 90% threshold level (Table 1). However, there were no significant differences in these measures between groups when the VAF threshold was 75% (Table 1), with only 1 or 2 synergies extracted from all strides in 25 of 28 children at this threshold value.
Mean number of synergies per stride (A), total number of synergies (B), number of clusters (C), and normalized cluster number of muscle synergies (D) in 5 strides. Data are presented as means and standard errors. An asterisk (*) indicates a significant difference (P < .05) between children with typical development (TD) and cerebral palsy (CP).
Comparison of Mean Number of Synergies Per Stride, Number of Clusters, and Normalized Cluster Number Using Different VAF Thresholds. a
Abbreviations: CP, cerebral palsy; TD, typical development; VAF, variance accounted for threshold.
Statistically significant differences between groups are presented in bold (P < .05, independent t-test).
The higher normalized cluster number in children with CP shows that their synergies were distributed into more clusters relative to the number of muscle synergies they produced during walking (Figure 2) and is indicative of higher stride-to-stride variability. In total, 10 distinct clusters, constituting 10 different muscle synergy structures, were found across the 28 participants (8 TD and 20 CP). Several synergy structures were observed mostly (clusters 8 and 9) or only (cluster 10) in those with CP (Figure 2). Whereas no cluster contained only synergies from children with TD, clusters 1 and 6 contained synergies from all children with TD. There were no clusters that contained synergies from all children with CP.
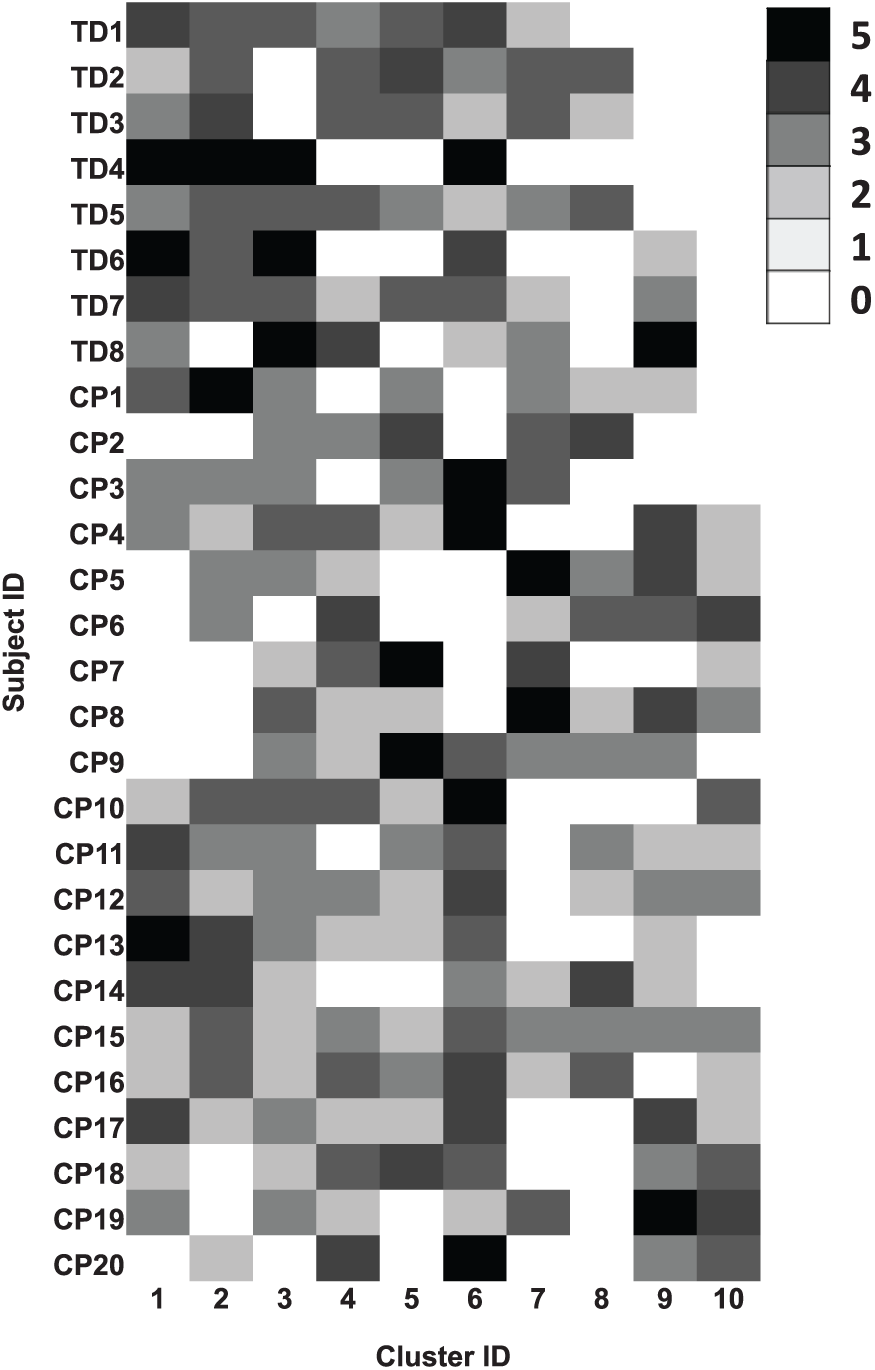
Distribution of similar synergies across individual participants. Muscle synergies in children with typical development (TD) and cerebral palsy (CP) were extracted from individual 5 strides, and similar synergies were assigned into the same clusters. Row and column are identification (ID) of participants and clusters, respectively. Note that the same cluster ID between participants indicates similar synergies. Cluster ID is ordered by most prevalent assignment of synergies in children with TD, such that no synergies for children with TD were assigned to cluster 10. Brightness scale presents the number of synergies in a cluster.
The mean synergy activation and structure from each cluster are shown in Figure 3. Cluster 10, which contains only synergies from children with CP, demonstrated a broad level of muscle activation, including coactivation of TA and RF in the nondominant (more affected) side and TA, RF, and MH in the dominant (less affected) side. Cluster 6, which contained muscle synergies from all children with TD, and Cluster 2 were active around double stance and reflected similar structures across the limbs. Cluster 6, active around nondominant heel strike, contained nondominant TA and MH and dominant MG, whereas cluster 2, active around dominant heel strike, consisted of dominant TA and MH and nondominant MG. Cluster 1, also containing synergies from all children with TD, was active during the nondominant swing phase and loading response, and mainly consisted of nondominant TA and RF. The mean ICC values of muscle synergy structures across the 10 clusters were 0.64 ± 0.07, with a range of 0.53 to 0.70.
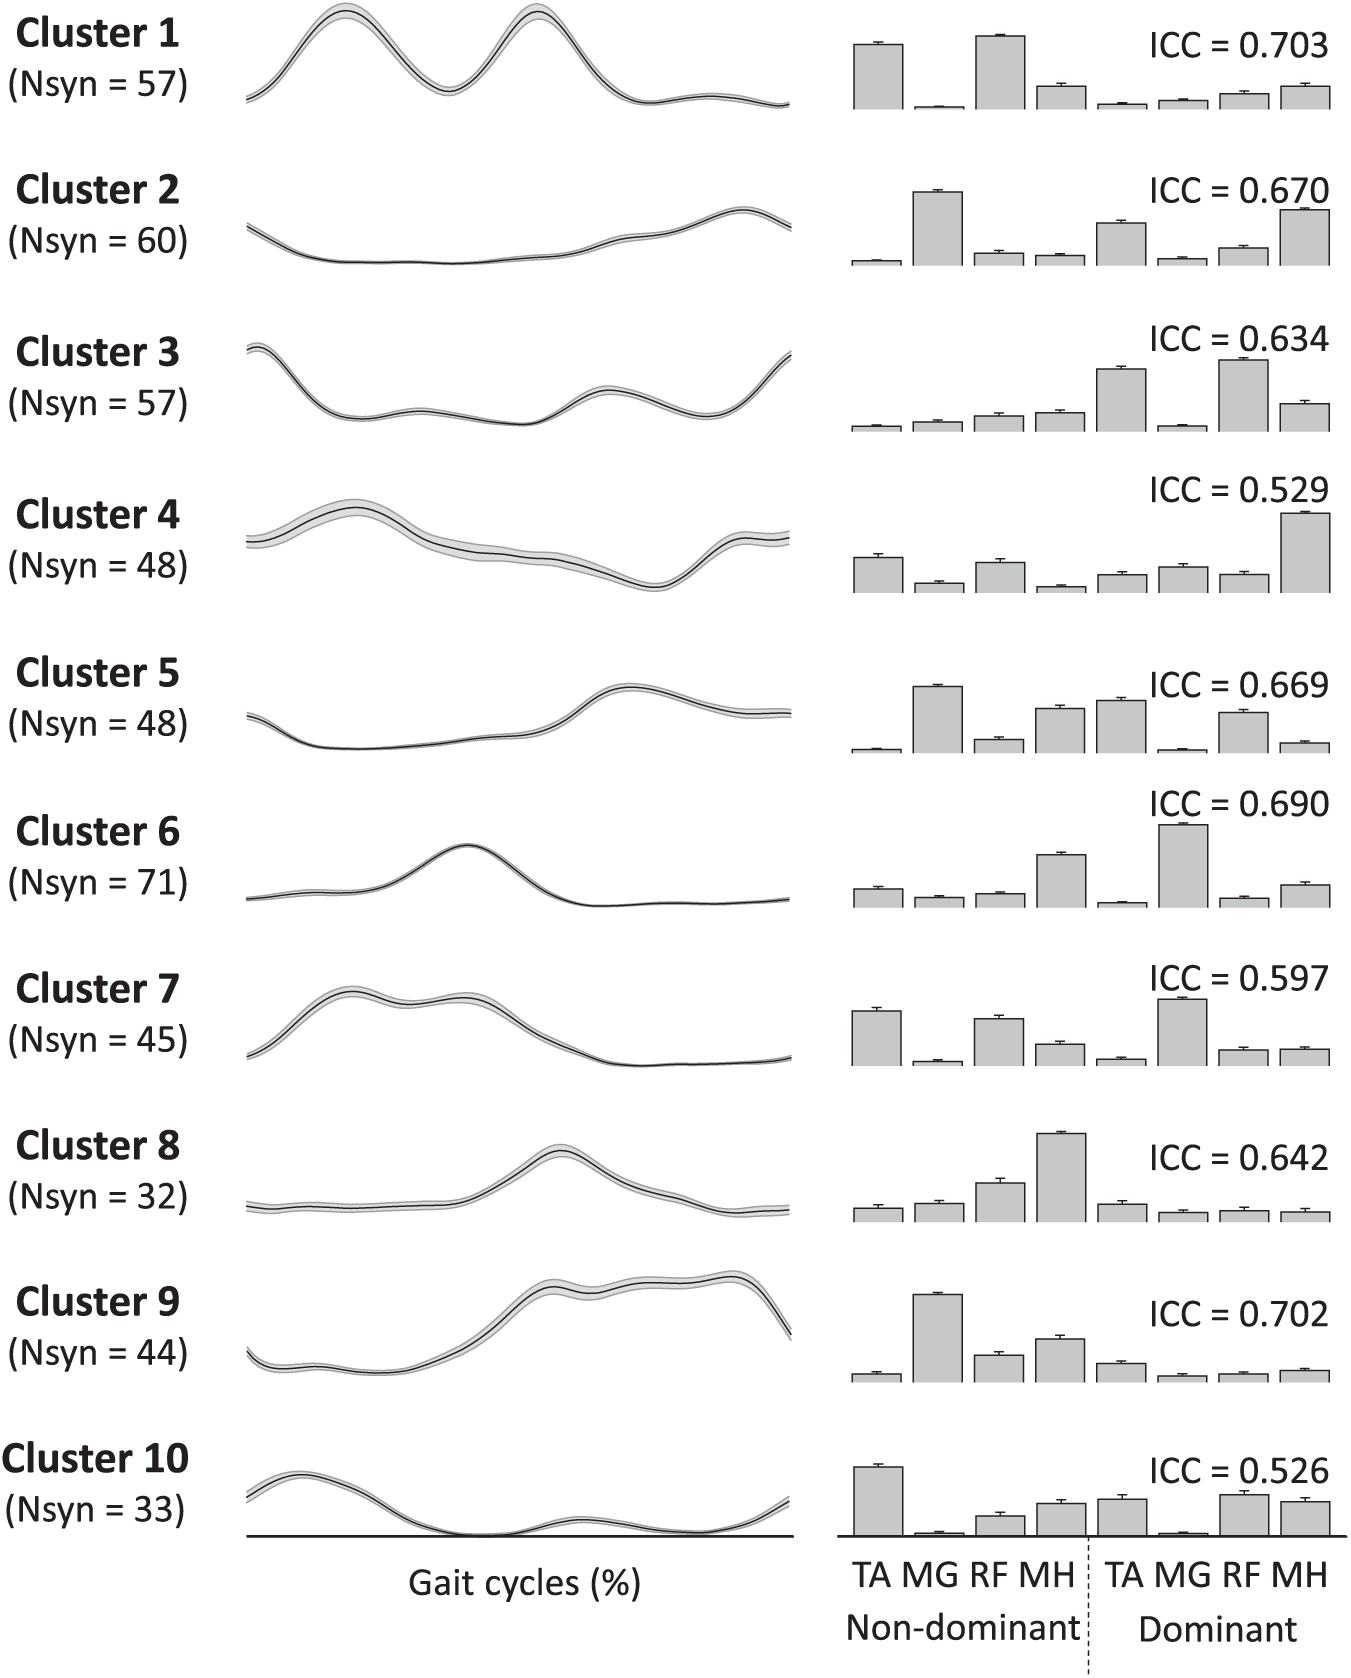
Muscle synergies assigned to individual clusters. The gait cycle is defined based on heel strike of the dominant leg. Line (left) and bar (right) plots present synergy activations and structures, respectively. Each cluster number corresponds to the cluster ID in Figure 2.
Sample synergies from 1 participant with TD and 1 participant with CP are shown in Figure 4. The TD participant was very consistent, with the same 4 synergies present in all 5 gait cycles. In contrast, participant CP 15 demonstrated variability in both the number of synergies extracted across gait cycles and the clusters to which those synergies were assigned—that is, muscle synergies for each of 5 strides were assigned to clusters 1-4-6-9, 2-6-9-10, 2-6-8-10, 2-3-7-8, and 4-5-7, respectively.
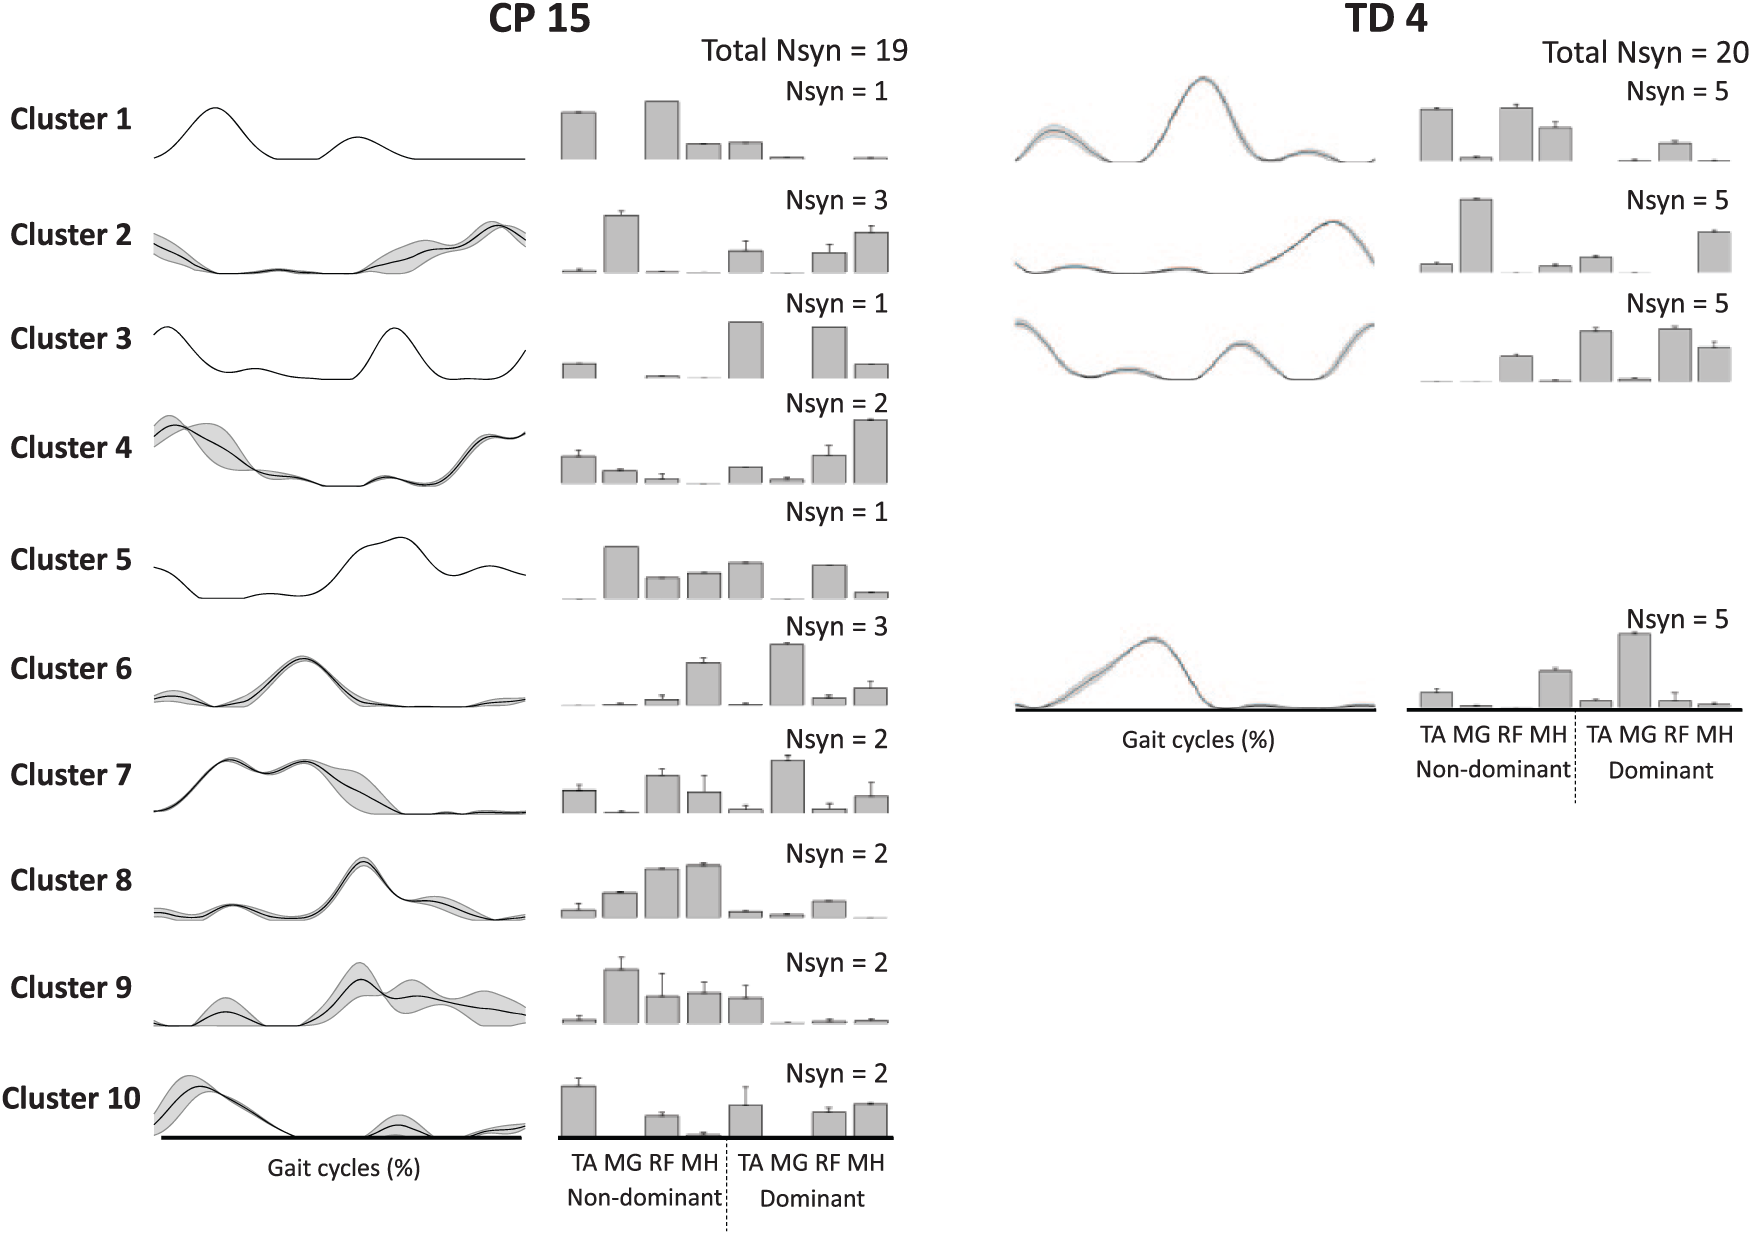
Samples of muscle synergies extracted from 5 individual strides in CP 15 and TD 4 (refer to Figure 3). Line and bar plots present synergy activations and structures, respectively. Synergies in TD 4 were assigned into 4 clusters indicating low stride-to-stride variability, whereas those of CP 15 were assigned into 10 clusters indicating high variability. Data are presented as means and standard errors.
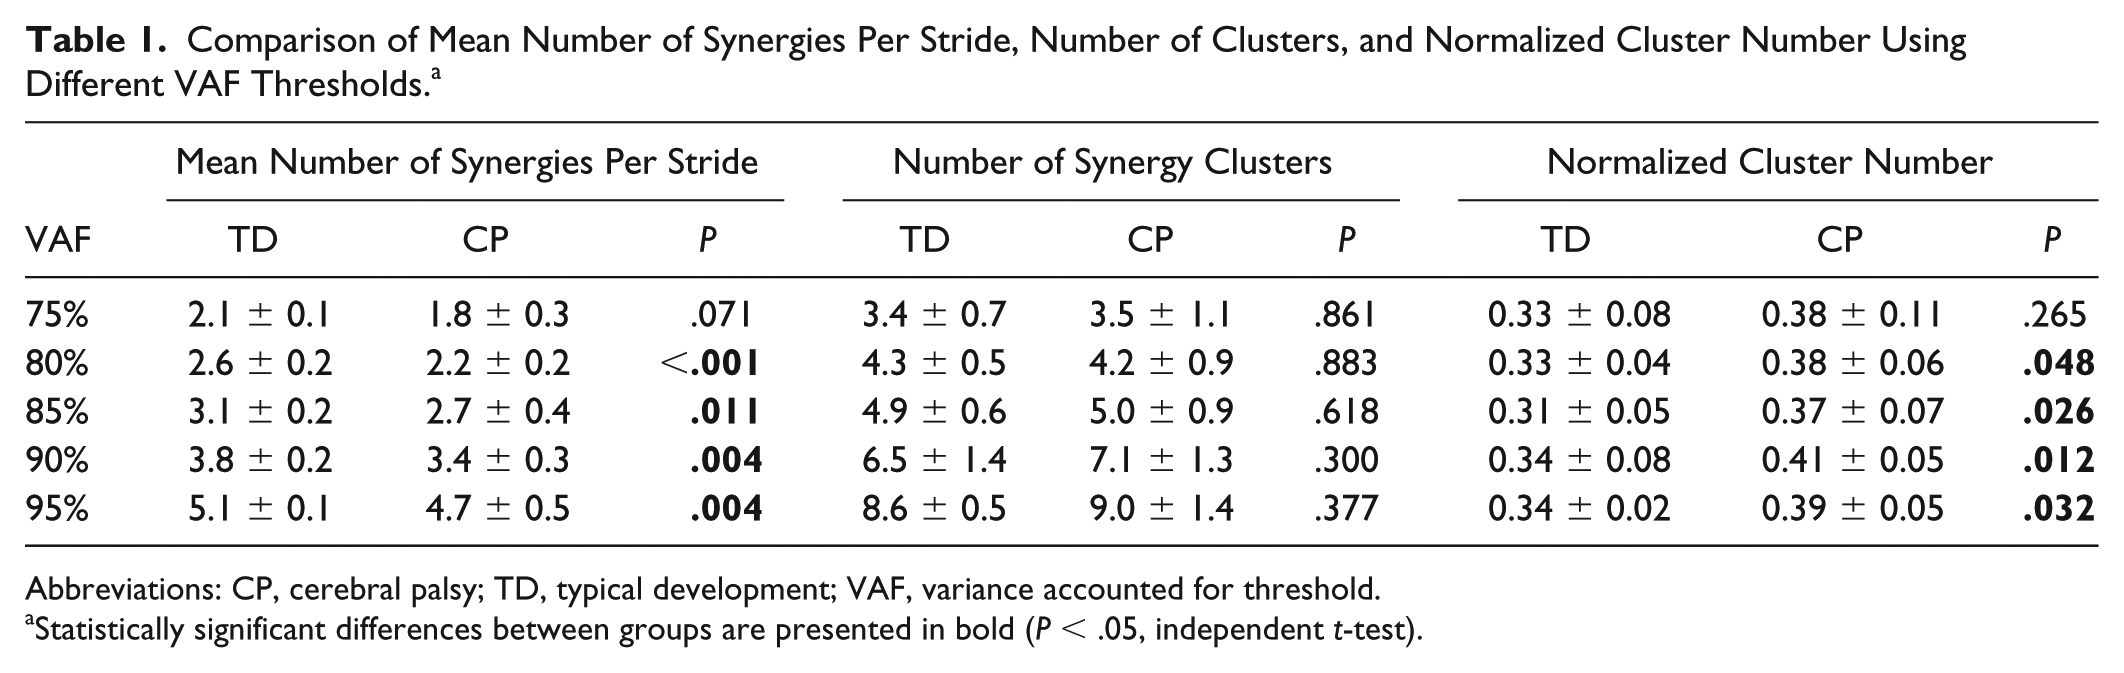
Interstride variability of EMG channels and joint angle data across the 5 strides (Figure 5) showed no significant differences between CP and TD groups (EMG: P = .84; joint angle: P = .70). ICC values for EMG and joint angles were also not significantly different between groups (P = .48 and P = .69, respectively).
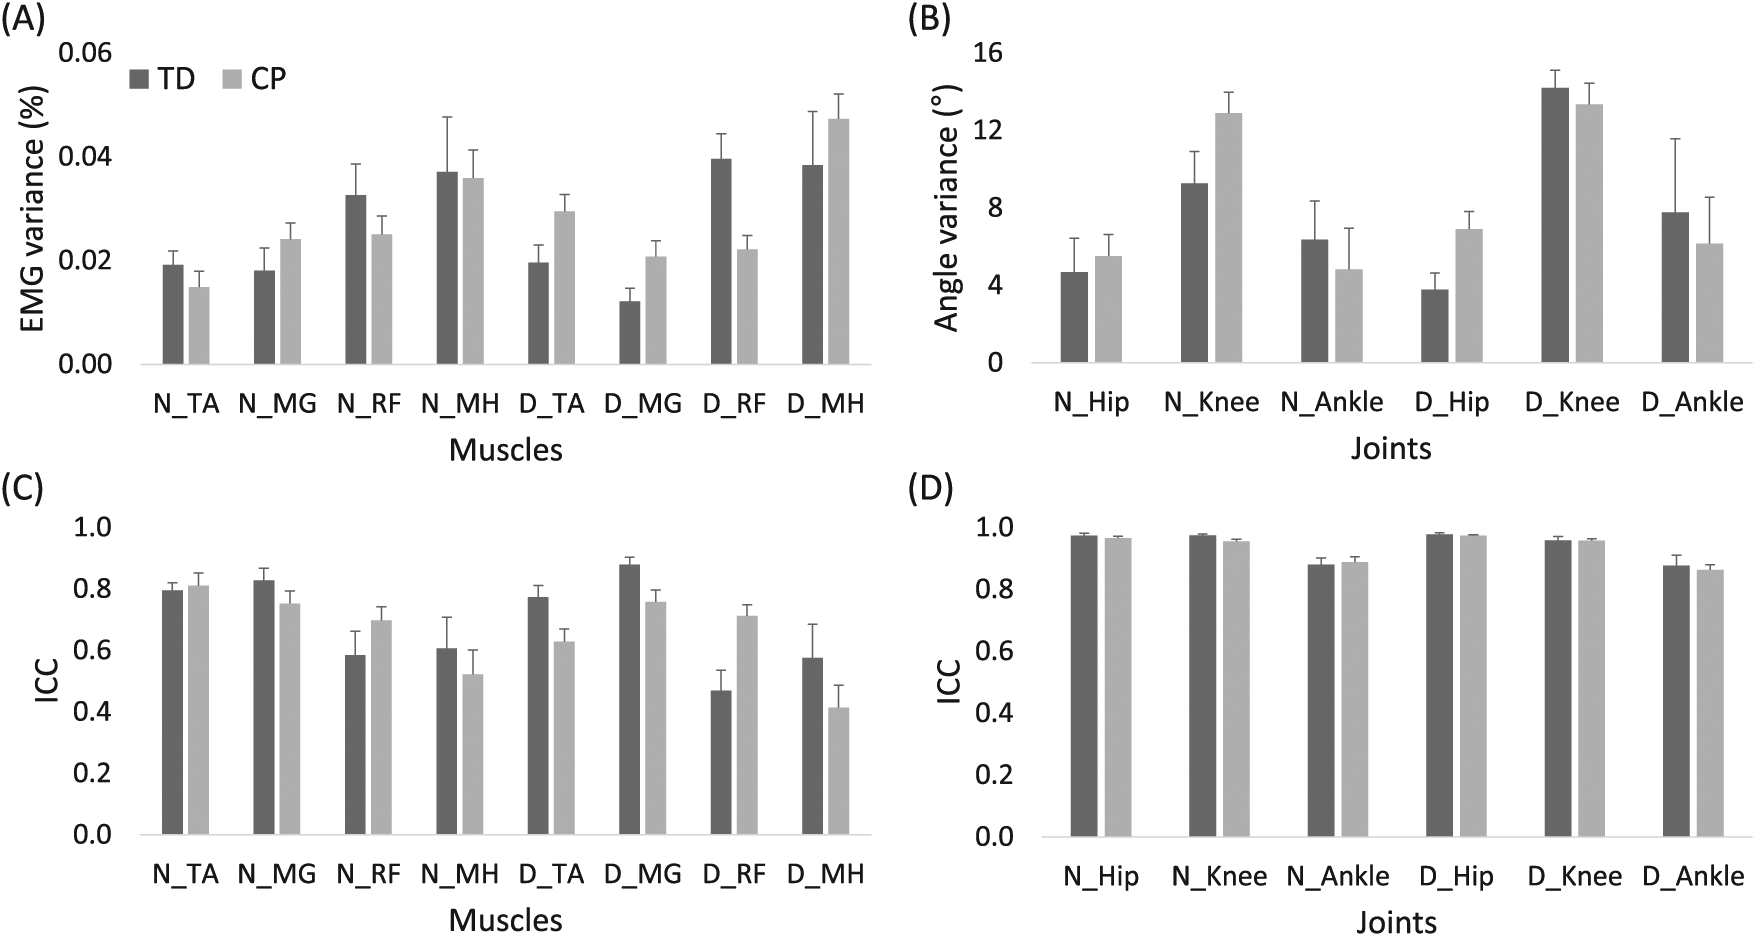
Variance (A, B) and ICC (C, D) values of EMG (A, C) and kinematic variables (B, D) across 5 strides in children with TD (dark gray) and CP (light gray). Data are presented as means and standard errors.
Mean VAF by 1 synergy was significantly higher (P < .001) in children with CP (0.71 ± .04; range: 0.36-0.78) compared with TD (0.61 ± 0.03; range: 0.57-0.65). Similarly, walk-DMC values in children with CP (65.0 ± 14.2; range: 40.2-91.3) were significantly lower (P < .001) than in TD (100 ± 10; range: 85.10-113.0), suggesting less complexity. In children with CP, GMFCS level was correlated only with normalized cluster number (r = 0.54; P = .01), with no significant correlation with total number of synergies, number of clusters, or complexity measures.
Discussion
Our results show that children with CP exhibit more variability in muscle synergies deployed during walking than those with TD. Interestingly, we found that children with CP utilize the same synergies as those with TD in some strides, whereas at other times, they exhibit distinct synergies not present in those with TD. Our results confirm previous findings that the number of muscle synergies required to account for a set threshold of variance varies across strides in both normal and pathological gait. 28 We extracted between 3 and 4 synergies from each gait cycle for those with TD and between 2 and 4 synergies for those with CP at a VAF threshold of 90%.
Across the 5 gait cycles, we extracted more synergies on average from children with TD than those with CP, a result in line with previous studies.18,39 However, unlike previous studies that have extracted synergies from a random single stride 18 or concatenated strides,13,23 or averaged synergies across strides, 16 we extracted synergies required to meet the 90% VAF threshold from each stride. The variable number of synergies for each stride makes conventional correlation analysis for repeatability difficult. Previous studies have evaluated variability between synergy structures across strides and visits by varying the number of synergies extracted from each stride (eg, n = 1-5) and then computing the correlation between the mean structure and each stride for a given value of n. 20 Some studies have divided walking into small groups of strides and then extracted the same number of synergies from each subgroup, all with VAF greater than 90%. 40 One drawback of these approaches is that they do not identify the correct synergy level (value of n) for each individual or stride, which we contend is an important step given that spurious synergies can be included if the number of synergies from each stride is not properly determined. 28 To overcome these limitations, we extracted synergies on a stride-to-stride basis and then used clustering and discriminant analyses to group similar synergy structures across the entire set of synergies extracted from all strides and participants into the same clusters.
The number of clusters to which a participant had a synergy assigned provides a measure of stride-to-stride variability of the muscle synergies underpinning their gait. However, the number of clusters is also affected by the total number of synergies extracted from an individual. Thus, we used the normalized cluster number to represent the stride-to-stride variability of muscle synergies for each participant, with a larger normalized cluster number indicating increased variability. We found that while children with CP generated fewer total number of synergies across the 5 strides, they did so with higher stride-to-stride variability. This higher variability may be indicative of a more immature gait pattern because mature gait is characterized by lower variability between strides. 41 Our results are similar to a study demonstrating that synergy structures for walking on a narrow beam were more consistent in experts compared with novices. 15 Given that walking may be more challenging in children with CP than in those with TD, 42 this may explain their higher stride-to-stride variability of muscle synergies. This notion is consistent with earlier studies that reported an increase in variability of motor coordination patterns across multiple trials associated with more difficult tasks, 43 insufficient practice, 44 or brain injury. 45
Despite the increased variability, children with CP generated the same synergies as those with TD in many strides, while in other strides they did not (Figure 2). As a group, the children with CP exhibited 9 synergy patterns in common with children with TD, whereas only 1 synergy was not seen in any child with TD. This information could be useful in developing individualized rehabilitation strategies for gait training. For an individual who utilizes typical synergies in some strides—for example, CP 15 (Figure 4)—the focus could be on making the typical synergies more reliable and repeatable during training. There are several ways in which this could be implemented. Muscle synergies could be computed for each gait cycle in real time and feedback on recruited synergies provided to reinforce successful motor execution. Another method would be to utilize modeling tools to predict the limb motion created by the participant’s execution of the more typical synergy and then to train the individual by having them repetitively perform and reinforce that movement. With practice, they may recalibrate their walking pattern to deploy the trained synergy more frequently. The absence of more typical synergies may also be useful information for rehabilitation. For instance, many participants with CP did not exhibit synergies in cluster 1, which is present in all children with TD. This synergy is responsible for nondominant hip flexion and ankle dorsiflexion in swing and leg stabilization during loading. The most expedient course of therapy for these children may be to optimize their limb motion during these phases given their learned synergy rather than attempting to train the pattern of children with TD. Our results may also provide insight into why some children may respond better to training. If the available synergy repertoire of a child with CP is similar to that of TD prior to training, he/she may have more capacity to improve by increasing the frequency of their occurrence rather than having to develop a specific synergy de novo, which may not even be possible in some given the brain injury.
Stride-to-stride variability of individual muscle EMG was not significantly different between groups, indicating that it is the pattern of how muscles are recruited or activated together that is more variable in children with CP. Our results do not address the question of whether synergies reflect the underlying neuromotor control modules or are instead reflective of biomechanical and/or task constraints. 46 Thus, the more variable structures extracted across strides in our CP cohort may reflect variable patterns of activation caused by spasticity, muscle tightness, or weakness, all of which are common impairments in CP. Several studies have shown similar stride-to-stride variability in gait parameters, 47 joint angular displacements,48,49 and ground reaction forces 50 in CP versus peers or between more and less affected legs. Increased muscle coactivation and abnormal timing of activation have also been demonstrated in CP,1,51,52 the consequence of altered supraspinal control or maladaptive plasticity throughout the motor system, including spinal interneurons, in response to brain injury during development. 53 Nevertheless, children with CP demonstrated considerable similarity in synergy structures with children with TD, with only 1 truly aberrant pattern (cluster 10) common in our cohort with CP but not seen in TD.
A majority of previous studies have extracted synergies from aggregated EMG data (eg, averaged or concatenated strides), a process that filters the extracted synergies to remove stride-specific EMG features but may discard potentially meaningful stride-to-stride variability. 28 Variability may arise from physiological or nonphysiological sources, and the challenge is to retain only the former. We utilized a clustering and discriminant analysis across all individuals to identify reliable synergy structures based on ICC, suggesting that these were not a result of nonphysiological noise. In line with studies that aggregate EMG across strides for synergy extraction,18,19,39 our results show that the mean number of synergies within strides is less in CP than TD, and VAF for a single synergy is larger on average. Given previous results of similar synergy structures during walking in those with CP and TD,23,25 it is not surprising that we found that children with CP may exhibit the same structures as those with TD. It was surprising that deployment of these structures was less consistent stride-to-stride and that, relative to the number of synergies per stride, this group of children with CP exhibited more structures than those with TD. Taken together, these results provide a more nuanced view of motor control in those with CP—that is, although motor control of walking in those with CP may be diminished compared with those with TD on average, it is not necessarily less complex in terms of available synergy structures.
Although our cluster analysis was performed using synergy structures, the resultant activation profiles did not overlap within a stride, indicating that timing may be preserved across strides despite modularity in muscle grouping. For example, in CP 15 (Figure 4) synergies from clusters 8 and 9 have similar activation profiles but distinct muscle patterns, particularly inclusion (or lack) of dominant TA. Both synergies were expressed in 2/5 strides examined, but they were mutually exclusive—that is, they were never deployed in the same stride. Although it is possible that this could be interpreted as a noisy controller attempting to implement the same synergy in all 4 strides, by definition, the additional TA activity constitutes a different synergy structure. Their repeated and exclusive emergence across multiple strides suggests that these variants reflect modular complexity in this individual; additional studies examining activation profiles across more strides should be undertaken to confirm this finding.
It is also possible that greater stride-to-stride synergy variability in CP, and in other neurological disorders, may explain the lower number of synergies identified when applying the same VAF threshold and the greater amount of variance explained by 1 synergy when these measures are computed across single, averaged, or concatenated strides. Although performing muscle synergy analysis at these broad scales may have value at the group level, our results demonstrate the potential clinical utility of stride-to-stride analysis of muscle synergies, which highlights individual motor control capabilities in children with CP. Regardless of the scale of synergy analysis, it should be noted that methodological and experimental choices, in particular the VAF threshold value 28 and the number of muscles, 54 can influence the number of synergies extracted during walking. To evaluate the sensitivity of our methods to choice of VAF threshold, we varied the value from 75% to 95% in 5% increments. We found that the VAF threshold had little effect on mean number of synergies per stride and normalized cluster number for the range of 80% to 95% (Table 1), supporting the sensitivity of our stride-to-stride variability outcomes. At the VAF threshold of 75%, significant differences in stride-to-stride variability were not found between groups, which is not surprising given that only 1 to 2 synergies were extracted at this level for both TD and CP groups.
A limitation of our study is the relatively small number (8) of bilateral EMG channels. Yet our finding of between 2 and 4 synergies required to meet the 90% VAF criteria agrees with recent studies of gait in children with TD and hemiplegic and diplegic CP utilizing 22 channels of EMG, which found the same range was sufficient to account for 80% of EMG variance of the larger muscle set. 23 The same study utilized cluster analysis of synergies extracted from concatenated strides to identify 4 basic structures across all strides, with the remaining structures combined into an additional cluster. Although their modules were extracted based on limb-specific gait cycles, whereas we extracted synergies across limbs within the same gait cycle (dominant heelstrike to dominant heelstrike), there were similarities in the structures and activations of their 4 identified synergies and those we identified from a more limited muscle set. For example, both studies report synergies that featured hamstrings that were active during late swing and early stance in dominant and nondominant limbs, respectively (synergies 2 and 6 in Figure 3). Both studies also report synergies involving plantarflexors for forward propulsion (synergies 7 and 9 in Figure 3). These similarities combined with the high repeatability of the synergies extracted across our cohort as measured by ICC suggest that the additional synergies observed in the CP group have a physiological basis. The fact that increased synergy structure variability is present despite there being no difference in kinematic variability suggests that motor control complexity, as measured by synergy repertoire, may be increased or at least similar in some individuals with CP. However, given the possibility that a reduced muscle set may overestimate VAF, 54 future studies are necessary with larger muscle sets to confirm our findings of enhanced stride-to-stride variability of synergy structures utilized during walking in children with CP. Also, as previous studies have shown that the choice of EMG processing parameters—for example, normalization procedures, filter type, and cutoff frequencies—may affect muscle synergy extraction, 55 future work should examine the effects of these on stride-to-stride variability of muscle synergies.
Other limitations in this study include the possibility that fatigue, common in CP, 56 may have influenced stride-to-stride variability results despite our decision to extract synergies from 5 random gait cycles to reduce this effect. A greater number of gait cycles may improve the robustness of stride-to-stride variability analysis. Although we found that variability measured by normalized cluster number was correlated with GMFCS level, the complexity measures were not, a result that differs from previous work.18,27 However, correlation analyses can be sensitive to range and sample size; thus, our relatively small cohort and lack of children with GMFCS III and above may explain this discrepancy. Nevertheless, translating our results to less functional individuals should be done with caution. Our CP cohort contained 20 individuals, similar to previous observational synergy studies in CP,19,23,25,39 although notably less than some retrospective studies. 18 Given the heterogeneity of the CP population, the impact of cohort size and functional level should be carefully considered. It is possible that a larger group with a broader representation of age, CP subtype, and functional mobility would identify more individuals who expressed fewer synergies because lower synergy number has been shown to be associated with higher (less functional) GMFCS levels. 18
Footnotes
Declaration of Conflicting Interests
The author(s) declared no potential conflicts of interest with respect to the research, authorship, and/or publication of this article.
Funding
The author(s) disclosed receipt of the following financial support for the research, authorship, and/or publication of this article: This work was support by the intramural research program of the NIH Clinical Center. YK was also supported by a grant of the Korea Health Technology R&D Project through the Korea Health Industry Development Institute (HI14C1155), funded by the Ministry of Health & Welfare, Republic of Korea.