
Abstract
Background. Damage to the callosal motor fibers (CMFs) may affect motor recovery in patients with stroke. However, whether the severity of CMF impairment varies with lesion locations remains unclear. Objective. To investigate (1) whether CMF impairment occurs after stroke and whether the impairment varies with lesion locations and (2) the associations of CMF impairment and upper extremity (UE) motor impairment. Methods. Twenty-nine patients with lesions involving the corticospinal tract (CST) were categorized into 2 groups: lesions involving the CMFs (CMF group, n = 15), and lesions not involving the CMFs (non-CMF group, n = 14). Thirteen healthy adults served as the control group. Tract integrity, assessed by the mean generalized fractional anisotropy (mGFA) using diffusion spectrum imaging, of the CMFs and the CST above the internal capsule (CSTABOVE) of the ipsilesional hemisphere were compared. Results. After accounting for the effect of lesion load on the CST, the CMF group exhibited a significantly lower mGFA of the CMFs than did the control and non-CMF groups (post hoc P = .005 and .001, respectively). No significant difference was observed between the non-CMF and control groups (post hoc P = .999). The CST and CMF impairment accounted for 56% of the variance of UE motor impairment in the CMF group (P = .007), whereas no significant association was observed in the non-CMF group (P = .570). Conclusions. CMF impairment after stroke depends on lesion locations and CMF integrity has an incremental contribution to the severity of UE motor impairment in the CMF group.
Introduction
Callosal motor fibers (CMFs) are the principal structure connecting the primary motor cortices (M1) of bilateral hemispheres1,2 and play an important role in modulating motor performance.3,4 Damage to the CMFs may occur after a stroke and may affect motor recovery in patients with stroke.2,5 In addition, interventions that modulate interhemispheric excitation or inhibition rely on the intact function of the CMFs.6,7 Therefore, knowledge about the change in CMF integrity after stroke is essential for clinical decision making, such as prognosis prediction and intervention selection.
Currently, information regarding the effects of stroke location on CMF integrity is scant. One study found CMF impairment at 6 months after stroke when a lesion directly involves the CMFs. 8 Gupta et al 8 reported a significant temporal decline in fractional anisotropy (FA), an index indicating microstructural integrity of white matter, in the corpus callosum in patients with large middle cerebral artery stroke. In another study, Radlinska et al 9 showed that CMF impairment may also occur when a stroke lesion does not directly involve the CMFs but involves other tracts connected to cortical motor neurons such as lesions involving the corticospinal tract (CST) at a level below the corpus callosum. The authors hypothesized that even if a stroke lesion is located in the CST, CMF impairment occurs because of trans-synaptic degeneration. However, some participants in that study exhibited lesions involving the centrum semiovale, which is a white matter region superior to the corpus callosum that contains the CMFs, CST, and superior longitudinal fasciculus. The CMF impairment that Radlinska et al 9 observed may be due to ischemic lesion or other pathophysiological changes (eg, delayed neuronal death, Wallerian degeneration, or neuroinflammation) rather than trans-synaptic degeneration. Although trans-synaptic degeneration has been observed in the visual system,10,11 evidence of such degeneration in the motor system is currently unavailable. Liang et al 12 reported retrograde degeneration in the CST in patients with pontine infarction. However, the authors did not investigate whether retrograde degeneration of the CST continued to damage the CMFs through trans-synaptic degeneration. Therefore, further investigation is warranted to clarify the impact of lesion locations on CMF impairment.
The aims of the present study were to investigate the following: (1) whether CMF impairment occurs after stroke and whether the impairment varies with lesion locations and (2) the associations of CMF impairment and upper extremity (UE) motor impairment in 2 stroke groups. Specifically, we recruited patients with stroke who had lesions involving the CST. We categorized the patients into two groups, one group with lesions that involved the CMFs (CMF group), and another group with lesions that did not involve the CMFs (non-CMF group). We used diffusion spectrum imaging (DSI) tractography to segment the CST and CMFs and compared tract integrity among the 2 patient groups and a healthy control group. We hypothesized that tract integrity of the CMFs would be lower in both stroke groups than in the healthy control group. Given that both patient groups exhibited damage to the CST, we expected that trans-synaptic degeneration would reduce CMF integrity in the non-CMF group. Hence, we expected that CMF integrity would not differ significantly between the 2 patient groups.
Methods
Participants
All participants were recruited from a medical center in Taiwan. The inclusion criteria for the enrollment of patients with stroke were as follows: (1) age ⩾ 40 years to satisfactorily represent the clinical population, 13 (2) a history of ischemic stroke of at least 6 months, (3) right handedness before stroke, (4) unilateral UE motor impairment at the moment of stroke onset, and (5) confirmation of unilaterality of lesions involving the CST through magnetic resonance imaging (MRI). The exclusion criteria were as follows: (1) MRI contraindications such as claustrophobia and implanted pacemakers and (2) a history of other neurologic diseases such as brain tumor or neurodegenerative disease.
Healthy adults who were right handed and aged ⩾ 40 years were recruited as a control group. The exclusion criteria were the same as for the patients with stroke. The study was approved by the research ethics committee of the institute. Written informed consent was obtained from participants before the study.
Division of the CMF and Non-CMF Groups
The CMF and non-CMF group were divided according to whether lesions involved the CMFs. The involvement of the CMFs was confirmed by T2-weighted images and verified by the tractogram of the CMFs. The detailed lesion locations of the participants are provided online as supplementary material (Supplementary Table 1).
MRI Data Acquisition
MRI data were acquired on a 3-T MRI system (TIM Trio, Siemens, Erlangen, Germany) with a 32-channel phased-array head coil. DSI was performed using a single-shot spin-echo echo-planar imaging sequence with twice-refocused balanced diffusion encoding gradients.14 -16 Data acquisition parameters were as follow: repetition time (TR) = 9600 ms; echo time (TE) = 130 ms; field of view (FOV) = 200 × 200 mm2; matrix size = 80 × 80; in-plane resolution = 2.5 × 2.5 mm2; slice thickness = 2.5 mm; 56 axial slices covering the whole brain.15,16 Diffusion-weighted images were acquired with 102 diffusion-encoding gradient directions that corresponded to the grid points in the half sphere of the 3-dimensional (3D) diffusion-encoding space (q-space). 15 The maximal diffusion sensitivity bmax was 4000 s/mm2.
T1-weighted and T2-weighted images were acquired to serve as an anatomical guide and to confirm the lesion locations, respectively. T1-weighted images were acquired using a 3D magnetization-prepared rapid gradient echo sequence: TR = 2530 ms; TE = 4.19 ms; flip angle = 7°; FOV = 256 × 192 × 208 mm3; matrix size = 256 × 192 × 208; isotropic resolution = 1 × 1 × 1 mm3. Multiple trans-axial T2-weighted images were acquired using a fast-spin echo sequence, TR = 7240 ms; TE = 101 ms, FOV = 230 × 230 mm2; matrix size = 256 × 256; in-plane spatial resolution = 0.9 × 0.9 mm2; slice thickness = 3.5 mm. The entire data acquisition time was approximately 25 minutes.
Reconstruction of DSI Signals
We implemented the mean apparent propagator (MAP) MRI method, 17 which uses a linear combination of Hermite functions to model the 3D q-space MR signals within each voxel. After applying MAP MRI to the 102 q-space samples, we obtained the coefficients of the Hermite functions from which the orientation distribution function (ODF) can be reconstructed. The ODF contains orientational information regarding water molecule displacement; therefore, the orientations corresponding to the local maxima of the ODF were able to estimate local fiber orientations with reasonable accuracy. The resultant local fiber orientation maps were used to reconstruct the CMFs and CST through a deterministic fiber-tracking algorithm. 18
The microstructural integrity of the CMFs and CST was quantified using the generalized fractional anisotropy (GFA), which was defined as the ratio of the standard deviation to root mean square of the ODF. 19 By definition, GFA is equivalent to FA in the diffusion tensor imaging (DTI) model. Several studies have demonstrated that GFA is highly correlated with FA.20,21 All GFA values sampled on the reconstructed CMFs or CST were averaged to obtain the mean GFA (mGFA) of the tract.
DSI Tractography
The DSI method has been validated to be superior to DTI in resolving crossing fibers, 22 allowing us to reconstruct the tractogram accurately, especially for the tracts that cross each other. 16 The UE CMFs are known to cross the CST in the lateral portion of the CMFs. It is impossible to successfully reconstruct the tractogram of the UE CMFs using DTI because DTI can only resolve a single fiber orientation within individual voxels. Therefore, we used DSI rather than DTI to overcome this problem.
Callosal Motor Fibers
Three regions of interest (ROIs) were used to reconstruct the CMFs, specific of UE portion (Figure 1). The first ROI was a square region covering the posterior two-thirds of midsagittal corpus callosum. 23 The other 2 ROIs were placed at M1 covering the UE part of the bilateral hemispheres. M1 ROI was defined within four borders shown on the GFA map. The posterior border was the anterior bank of the central sulcus. The anterior border was a line along the precentral sulcus. The medial border was a line along the superior frontal sulcus, and the lateral border was the lateral boundary of the individual’s brain. Each M1 ROI covered the middle one third (5-6 slices) of the slices from the top of the corpus callosum to the vertex. The corpus callosum ROI served as the seed region. To avoid false tracking, an exclusion slice was placed in the axial plane caudal to the corpus callosum.
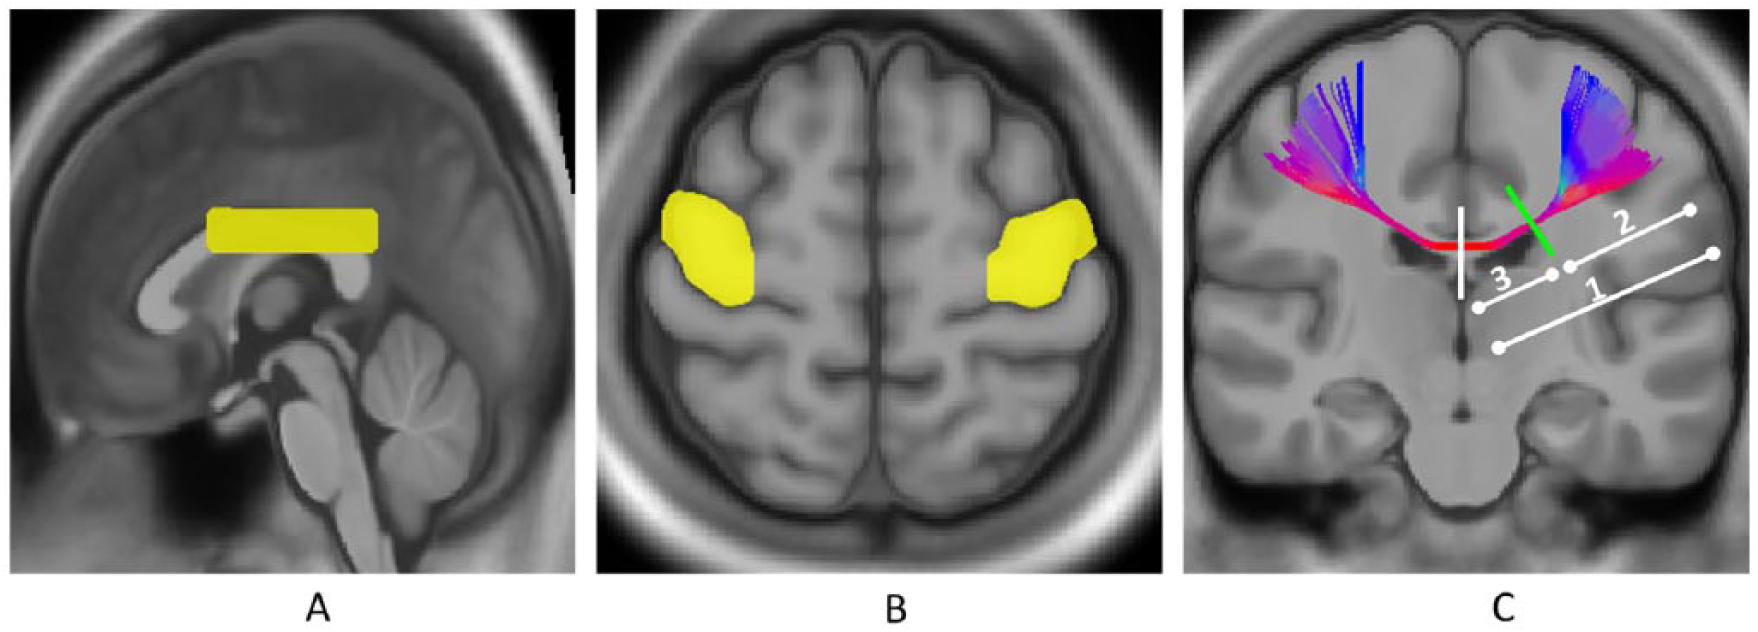
Tractography for the callosal motor fibers (CMFs). Three regions of interest are located in (A) the mid-sagittal plane covering the posterior two thirds of the corpus callosum and at (B) bilateral motor areas covering the upper extremity. (C) With these 3 regions, all the CMFs were reconstructed; the mean generalized fractional anisotropy (mGFA) values of 3 segments of the CMF tractogram were obtained from the lesion-affected hemisphere in patient groups: the whole (1), lateral (2), and medial (3) segments. For the healthy group, the mGFA values of the 3 corresponding segments were obtained by averaging the mGFA values from both hemispheres. The midline (white segment) and the lateral tip of the anterior horn of the lateral ventricle (green segment) on the coronal view were used as anatomic landmarks to divide the CMFs into the lateral and medial parts.
Corticospinal Tract
The UE-specific CST was reconstructed by placing 3 ROIs at M1, the posterior limb of the internal capsule (PLIC), and the cerebral peduncle (CP) (Figure 2). The ROI for M1 was the same as that for the CMFs described previously. The ROI for the PLIC was drawn on the slice that showed the clearest PLIC region. If the stroke lesion involved the PLIC, the PLIC ROI was drawn on the unaffected side, and then flipped to the affected side. The ROI of the CP was defined in 2 slices containing the CP in the midbrain. The seed regions were placed at the CP and M1 ROI. An exclusion slice was placed in the midsagittal plane to avoid false tracking.
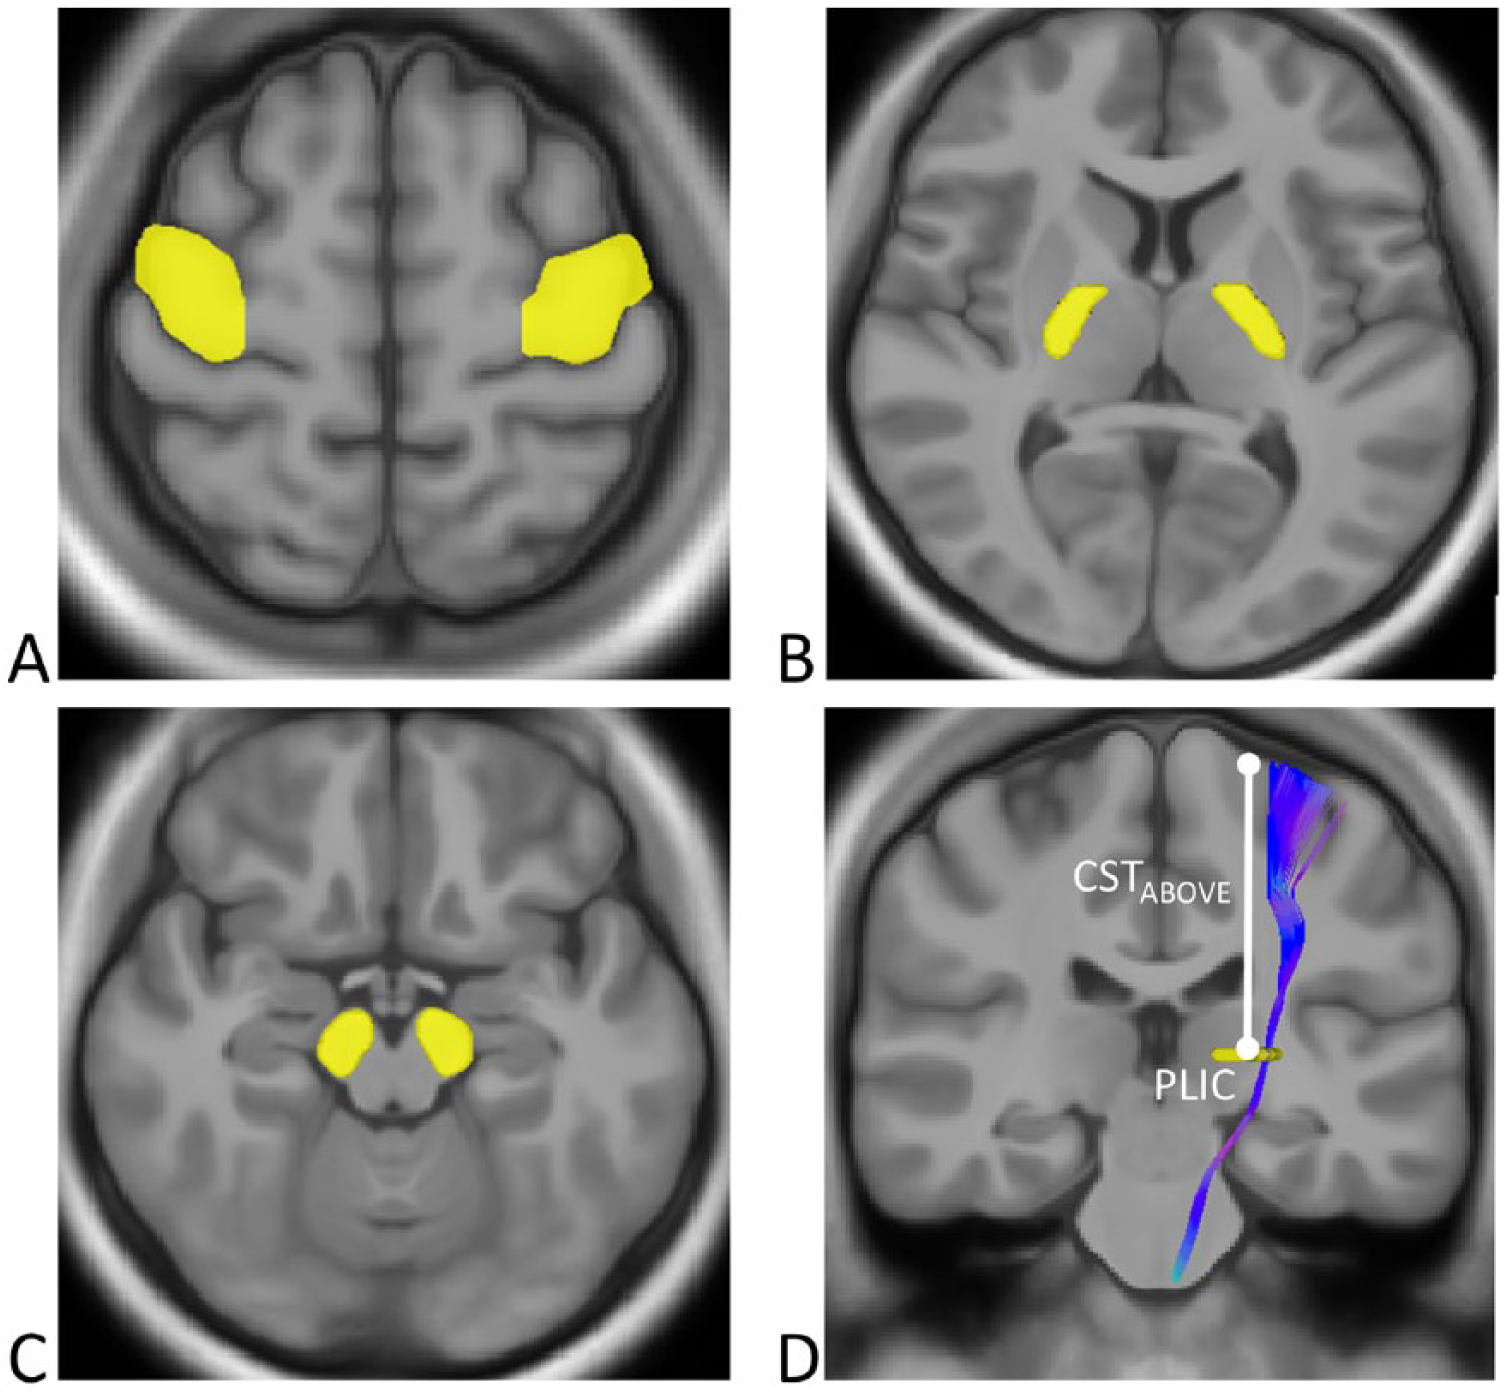
Tractography for the corticospinal tract (CST). Three regions of interest were placed at (A) the motor area covering the upper extremity, (B) the posterior limb of the internal capsule, and (C) the cerebral peduncle on each side. (D) With these 3 regions, the entire CST required for upper extremity motor control was reconstructed; the mean generalized fractional anisotropy (mGFA) values of the CST tractogram from the posterior limb of internal capsule (PLIC) level up to the gray matter–white matter boundary of motor cortex (CSTABOVE) was obtained. The mGFA values of the CSTABOVE were computed in the lesion-affected hemisphere for the patient groups. For the healthy group, mGFA of the CSTABOVE was computed by averaging the mGFA values of both hemispheres.
Callosal Occipital Fibers
To confirm that our findings are CMF specific, the callosal occipital fibers (COFs) were selected as the control tract. The online figure (Supplementary Figure 1) shows the 2 ROIs for the tractogram of the COFs. The first ROI was a square region in the mid-sagittal plane covering the splenium of the corpus callosum. 24 The second ROI was a coronal slice positioned at the apices of bilateral parieto-occipital sulci shown on the parasagittal view (ie, the first coronal slice that starts to cover the occipital lobe). The first ROI served as the seed region.
Tractography Parameters
For all 3 tracts, a streamline-based deterministic fiber-tracking algorithm was performed based on the resolved local tract directions. 25 We set 4 criteria for the tractography parameters: (1) angular thresholds for the CMFs, CST, and COFs were 50°, 60°, and 50°, respectively26,27; (2) the tract lengths for the CMFs and COFs were set from 100 mm to 180 mm, and from 110 mm to 150 mm for the CST; (3) the tracking was terminated if GFA was less than 0.08; and (4) only fibers that passed through the predefined ROIs were retained. The number of streamlines for each targeted tract bundle was set to 450 to 500. DSI tractography was performed using DSI Studio (http://dsi-studio.labsolver.org).
Tract-Specific Analysis
In patients with stroke, the tractograms of the CMFs and COFs were divided by the mid-sagittal plane, and the mGFA values of these 2 tracts in the lesion-affected hemisphere were calculated. Because the CST has potential overlap with the CMFs in the lateral portion of the CMFs, we divided the CMFs into a lateral segment (segment with overlap) and a medial segment (segment without overlap) by a vertical line tangential to the edge of the anterior horn of the lateral ventricle on a coronal view (Figure 1C). For the healthy group, the mGFA value of the CMFs was determined by computing the averaged mGFA values in both hemispheres for each corresponding segment, including the whole (CMF-total), lateral (CMF-lateral), and medial (CMF-medial) segments. For the COFs, the mGFA values in both hemispheres were averaged.
To assess the residual structural integrity of the CST, the CSTABOVE was defined as the CST from the PLIC level up to the gray matter–white matter boundary of M1 (Figure 2). Because the CST of the PLIC segment alone was unable to distinguish the CST fibers controlling UE from the fibers controlling lower extremity, 28 we selected the CSTABOVE, instead of the CSTPLIC, to specifically select the segment corresponding to UE control. 29 The mGFA values of the CSTABOVE were computed in the lesion-affected hemisphere for the patient groups. For the healthy group, mGFA of the CSTABOVE was computed by averaging the mGFA values of the CSTABOVE segments in both hemispheres (Figure 3).
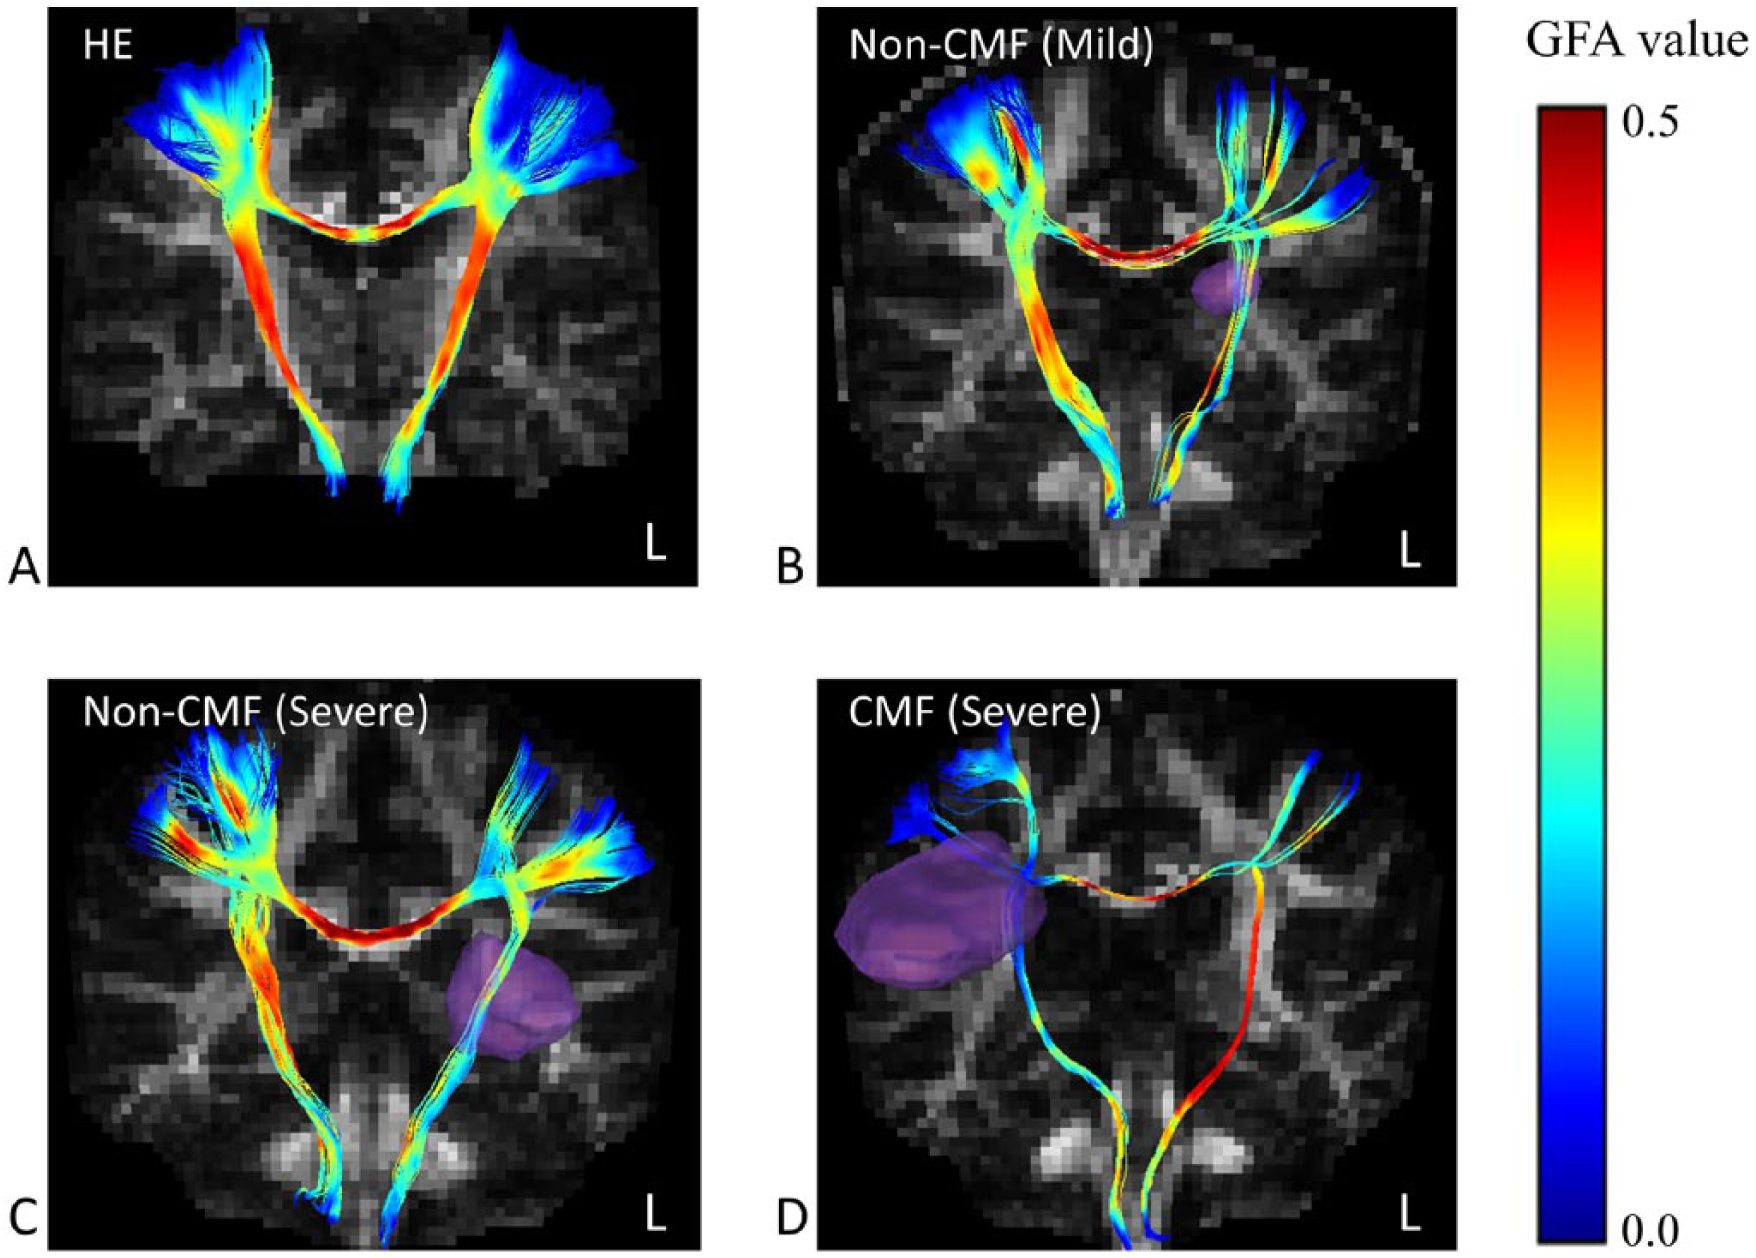
Reconstructed tractograms of the callosal motor fibers and the corticospinal tract of a healthy adult (A) and patients with stroke with mild (B, Fugl-Meyer motor assessment, upper extremity [FMA-UE] = 65) and severe (C, FMA-UE = 29; D, FMA-UE = 24) UE motor impairment. Generalized fractional anisotropy (GFA) is color-coded along the tracts. Purple regions indicate the locations of the stroke lesions. CMF = patients with stroke lesions involving the callosal motor fibers. Non-CMF = patients with stroke lesions not involving the callosal motor fibers.
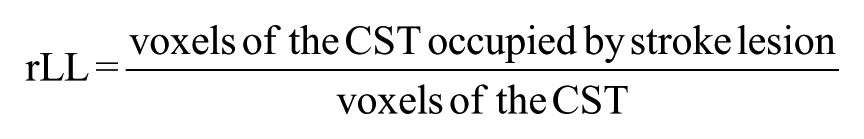
Relative lesion load (rLL) of the CST was calculated individually to indicate the ratio of an individual’s CST that was occupied by the stroke lesion:
Quality Control of DSI Data
The quality of the DSI data of each participant was visually inspected slice by slice for motion-induced signal drop-out. 30 If there were more than 30 images with signal drop-out in an individual’s DSI dataset, the participant was excluded from the analysis. In our experience, a signal drop-out of 30 images leads to approximately 4.5% error of the GFA value and does not significantly affect the accuracy of the tractogram. After the quality control process, none of the participants were excluded because none of them had more than 30 images with signal drop-out.
Because microvascular changes in white matter are more often observed in older people and often manifested as hyperintense lesions on T2-weighted images, and because such changes may have a direct effect on mGFA measurements, 31 we assessed the abnormal hyperintensities based on T2-weighted images using the Fazekas scale. 32 The Fazekas scale provides 2 scores on a scale of 0 to 3 for various hyperintensities in periventricular and deep white matter areas. Grade 0 indicates absence of lesions. In periventricular white matter, grade 1 indicates presence of pencil-thin lining around the lateral ventricles, grade 2 indicates progression of the thin lining to a smooth “halo,” and grade 3 indicates extension of irregular periventricular signal into deep white matter. In deep white matter, grade 1 indicates presence of punctate foci, grade 2 indicates beginning confluence of the foci, and grade 3 indicates large confluence of the foci. For each participant, we averaged the 2 Fazekas scores to obtain an overall score.
Motor Impairment Assessments
The level of UE motor impairment was assessed using the Fugl-Meyer motor assessment UE subscale (FMA-UE). 33 The FMA-UE is a 3-point standardized scale with a maximum score of 66. High scores represent low UE motor impairment. The FMA-UE test has been shown to exhibit satisfactory reliability and validity in patients with stroke.34,35
Statistical Analysis
Demographic data were analyzed using the chi-square test for categorical variables and the analysis of variance for continuous variables. We used analysis of covariance (ANCOVA) to examine the differences in mGFA of the CMFs (including the total, medial, and lateral segment), CSTABOVE, and COFs among the 3 groups (the CMF, non-CMF and control groups). The signal drop-out counts of DSI data were calculated for each participant. Both rLL and signal drop-out counts served as covariates. Post hoc analysis was conducted using the Bonferroni correction for the pairwise comparisons. Multiple regression analyses were conducted to examine contributions of tract integrity to UE motor impairment in each patient group. Since we considered the CSTABOVE as the primary contributor and the CMFs as an indirect contributor to UE motor impairment, the mGFA value of the affected CSTABOVE was put into the regression model as the first independent variable and mGFA of the CMFs as the second independent variable. Using the forward selection method, 36 the contribution of affected CMF integrity to UE motor impairment was estimated in addition to the contribution of affected CST integrity. To clarify the contribution of the CMFs alone, we examined the relationship between CMFs and UE motor impairment using Pearson’s correlation. All statistical analyses were conducted using IBM SPSS Statistics Version 20.0 (IBM Corporation, Armonk, NY).
Results
Twenty-nine patients with stroke and 13 healthy adults remained in the final analysis (Table 1). No differences were observed among the 3 groups in terms of age, sex, signal drop-out, averaged Fazekas score, or CMF tractogram volume (P ⩾ .229). The poststroke time and the side of the affected hand did not differ between the CMF and non-CMF groups (P = .646 and P = .876, respectively). The CMF group exhibited significantly large rLL on the CST and lower FMA-UE scores than did the non-CMF group (P ⩽ .003).
Participant Characteristics.
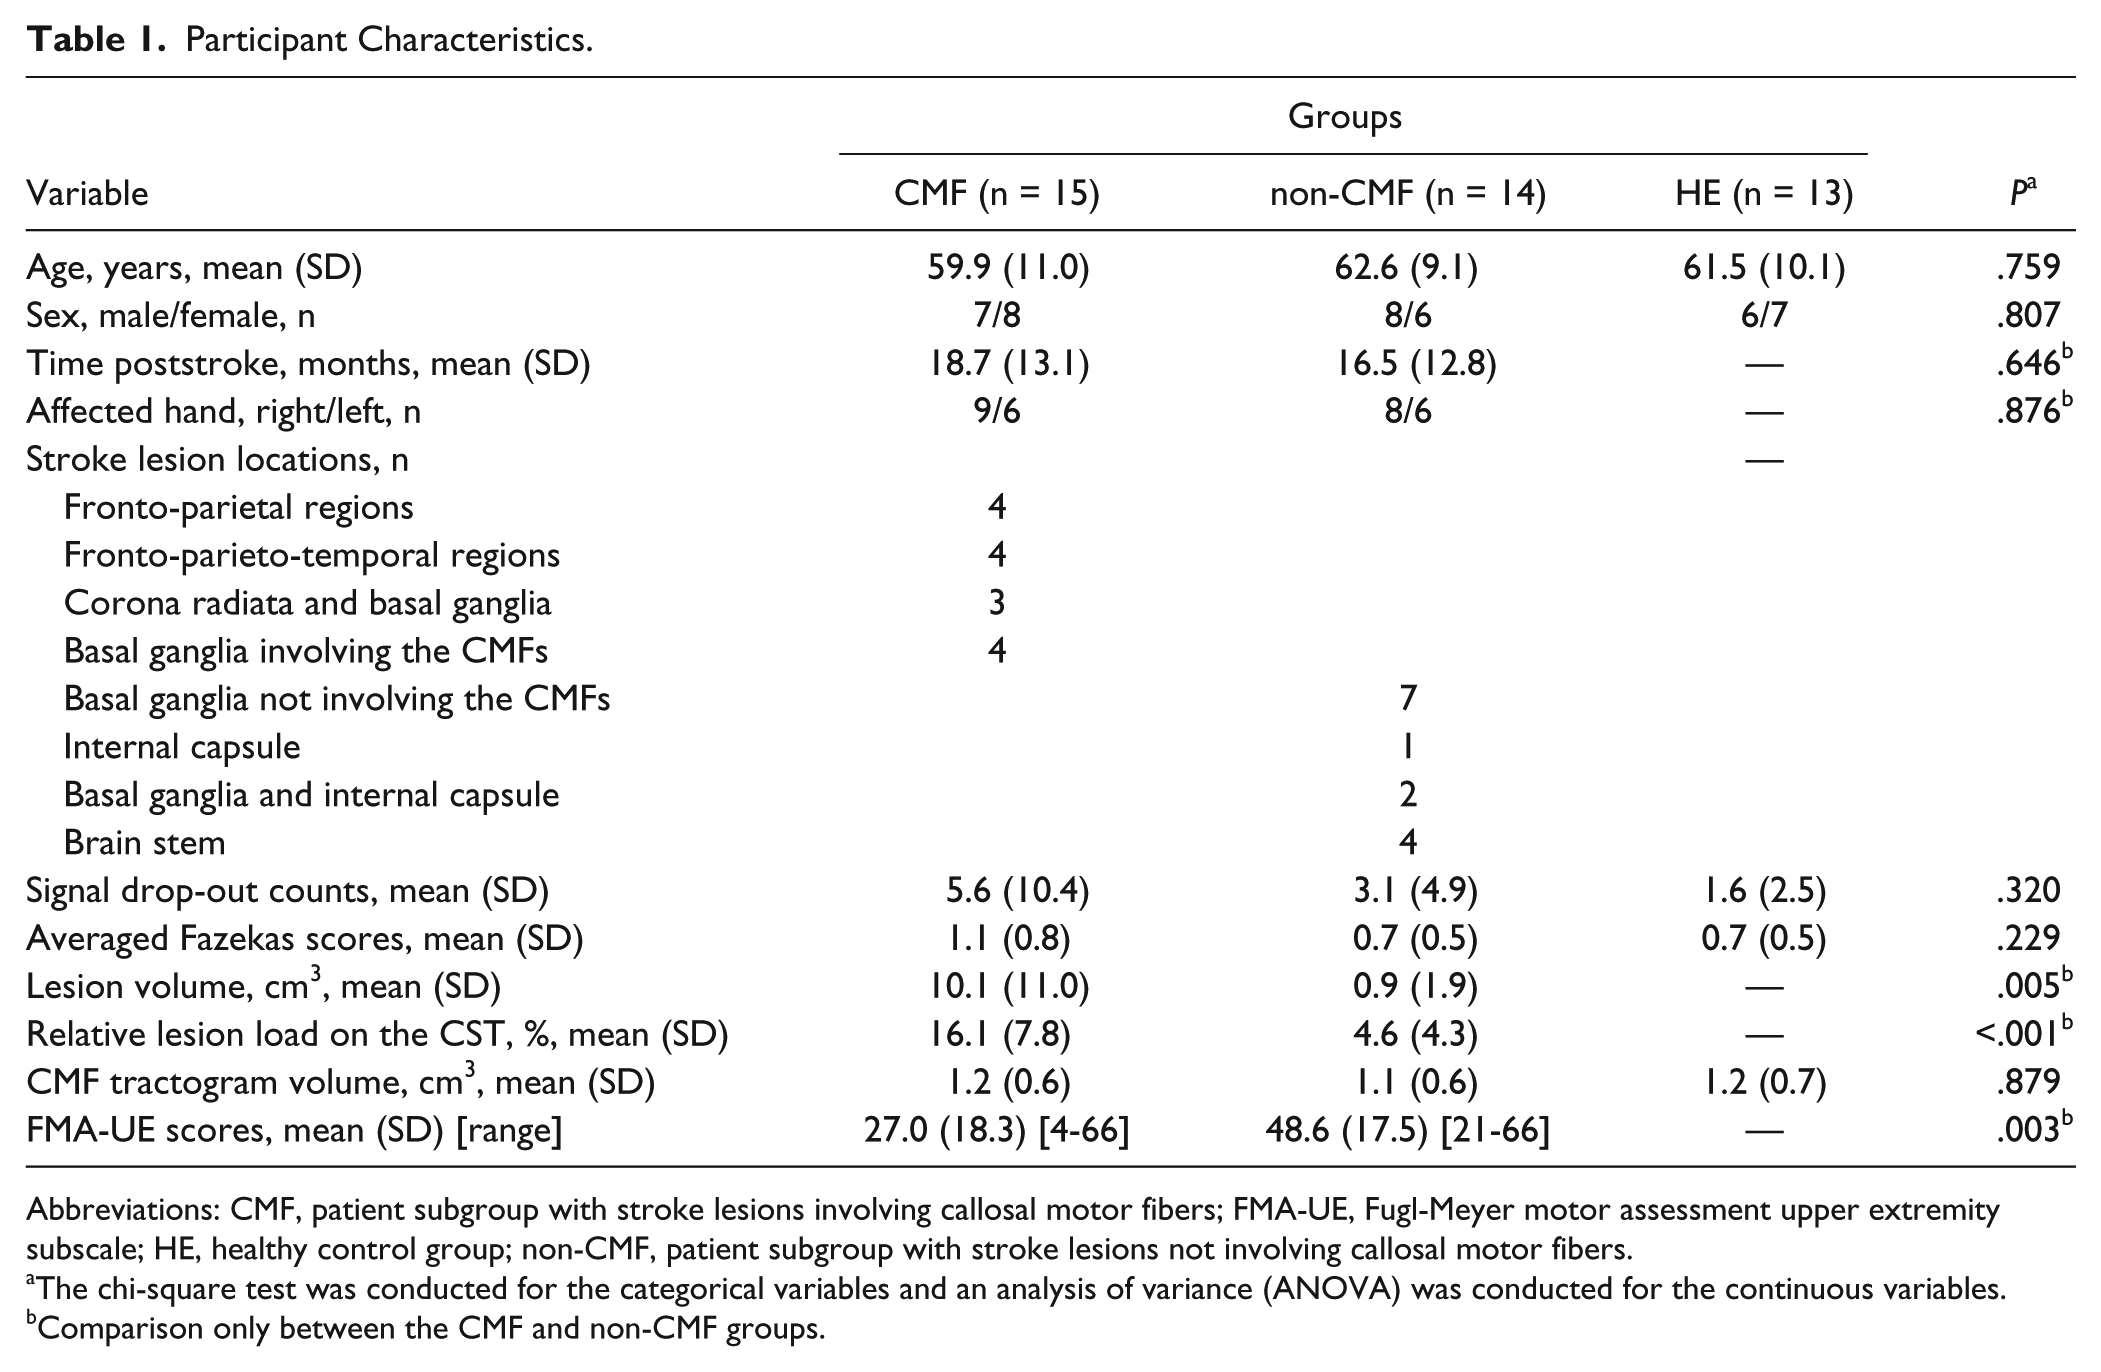
Abbreviations: CMF, patient subgroup with stroke lesions involving callosal motor fibers; FMA-UE, Fugl-Meyer motor assessment upper extremity subscale; HE, healthy control group; non-CMF, patient subgroup with stroke lesions not involving callosal motor fibers.
The chi-square test was conducted for the categorical variables and an analysis of variance (ANOVA) was conducted for the continuous variables.
Comparison only between the CMF and non-CMF groups.
Comparison of Tract Integrity Among the CMF, Non-CMF, and Healthy Control Groups
Table 2 shows the comparison of mGFA of the CMFs, CSTABOVE, and COFs among the 3 groups based on ANCOVA controlling for the rLL on the CST. Significant differences were observed between the CMFs (total, lateral, and medial) in the three groups (P < .004). For the CMF-total in the CMF group, mGFA was 0.40, which was significantly lower than that in the healthy control (post hoc P = .005) and non-CMF groups (post hoc P = .001). No significant differences were observed between the non-CMF (mGFA = 0.52) and healthy control (mGFA = 0.52) groups (post hoc P = .999).
Comparison of Tract Integrity Among the CMF, Non-CMF, and Healthy Control Groups.
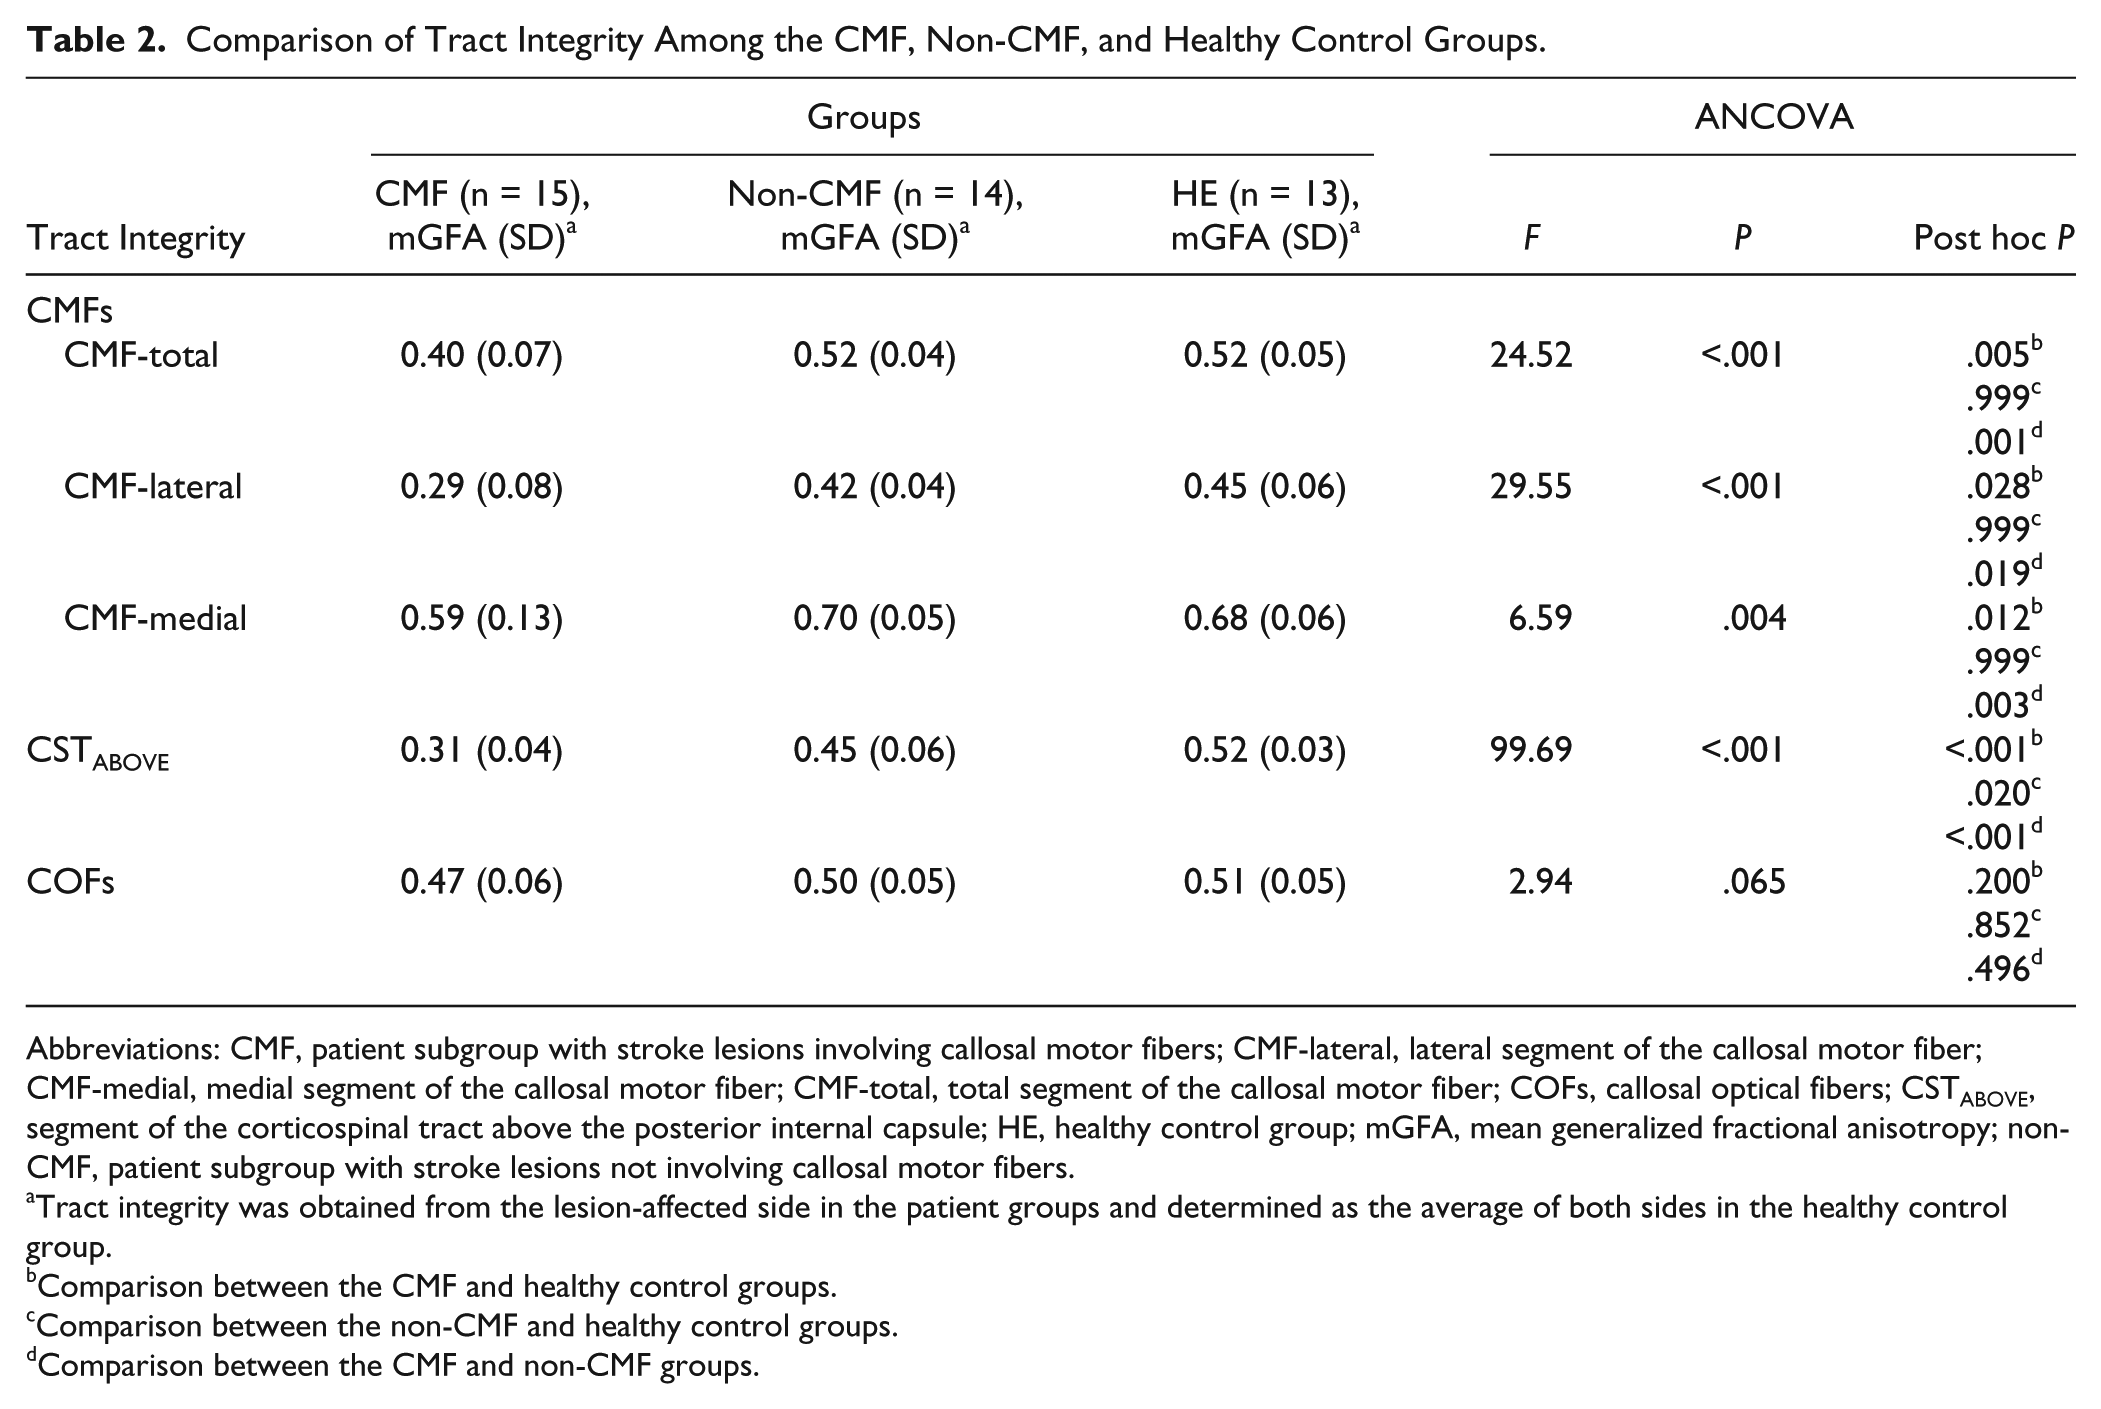
Abbreviations: CMF, patient subgroup with stroke lesions involving callosal motor fibers; CMF-lateral, lateral segment of the callosal motor fiber; CMF-medial, medial segment of the callosal motor fiber; CMF-total, total segment of the callosal motor fiber; COFs, callosal optical fibers; CSTABOVE, segment of the corticospinal tract above the posterior internal capsule; HE, healthy control group; mGFA, mean generalized fractional anisotropy; non-CMF, patient subgroup with stroke lesions not involving callosal motor fibers.
Tract integrity was obtained from the lesion-affected side in the patient groups and determined as the average of both sides in the healthy control group.
Comparison between the CMF and healthy control groups.
Comparison between the non-CMF and healthy control groups.
Comparison between the CMF and non-CMF groups.
Similar results were observed for the CMF-lateral comparison. The CMF group exhibited a significantly lower mGFA than did the healthy control (post hoc P = .028) and non-CMF groups (post hoc P = .019); however, no significant difference was observed between the non-CMF and healthy control groups (post hoc P = .999). Regarding the CMF-medial comparison, the CMF group exhibited a significantly lower mGFA than did the healthy control (post hoc P = .012) and non-CMF groups (post hoc P = .003), and the non-CMF group was not significantly different from the healthy control group (post hoc P = .999).
The mGFA values of the CSTABOVE were 0.31, 0.45, and 0.52 for the CMF, non-CMF, and healthy control groups, respectively. The ANCOVA analysis revealed significant differences among the 3 groups (P < .001). In the CMF group, mGFA was significantly lower than that in the healthy control (post hoc P < .001) and non-CMF (post hoc P < .001) groups. The non-CMF group had significantly lower mGFA than the healthy control group (post hoc P = .020).
In the CMF, non-CMF, and healthy control groups, the mGFA values of the COFs were 0.47, 0.50, and 0.51, respectively. No significant differences were observed among the 3 groups (post hoc P = .200 - .852).
Associations Between Tract Integrity and UE Motor Function
The CMF and non-CMF groups were independently subjected to multiple regression analysis (Table 3). In the CMF group, a significant regression model was obtained if mGFA of the CSTABOVE was used as the only independent variable (P = .004); the independent variable accounted for 48% of the variance. If mGFA of the CMF-total was added as the second independent variable, the regression model remained significant (P = .007) and the 2 independent variables accounted for 56% of the variance. A borderline but nonsignificant moderate association was found between CMF integrity and UE motor impairment in the CMF group (Pearson’s r = 0.50, P = .059).
Multiple Regression Analysis of Upper Extremity Motor Impairment.
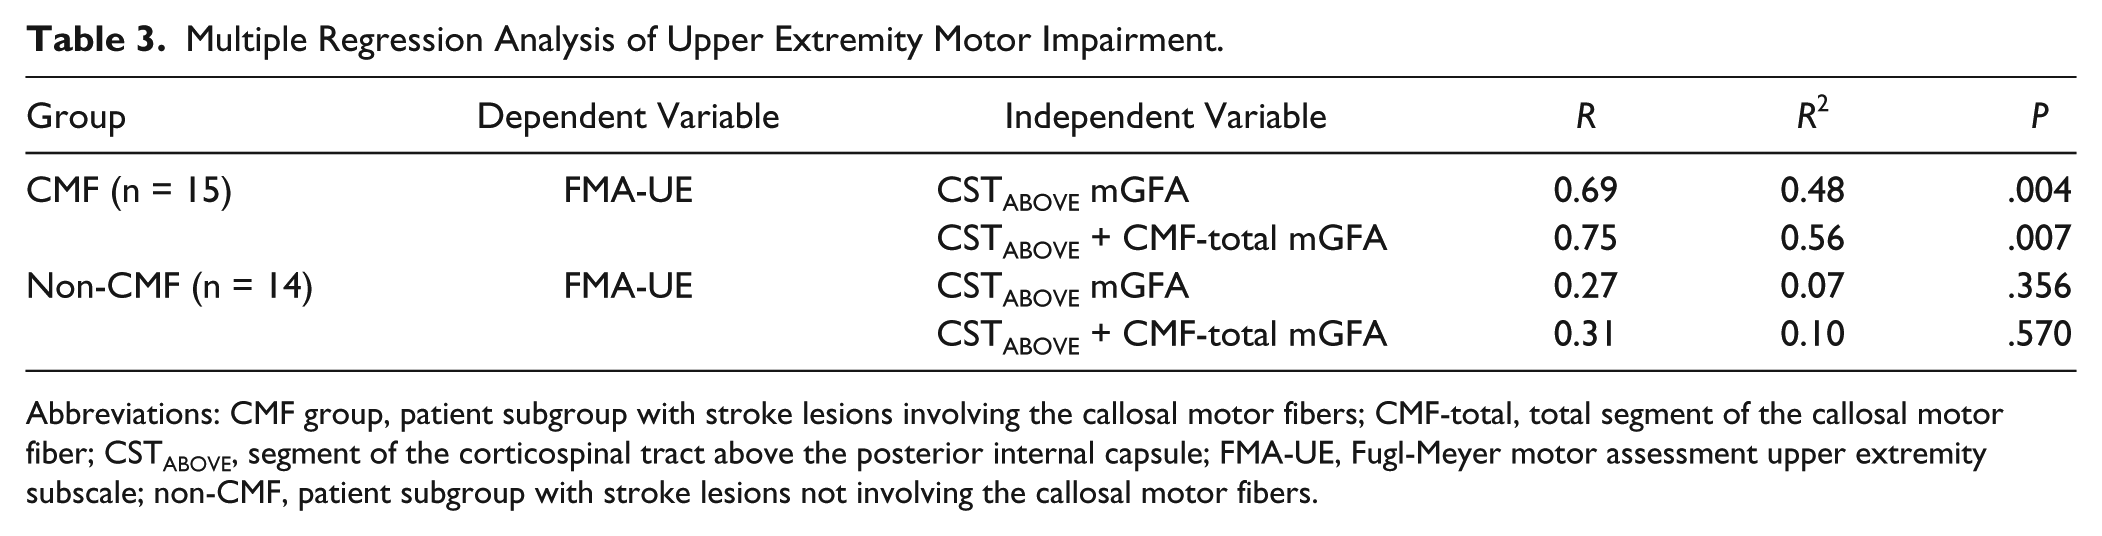
Abbreviations: CMF group, patient subgroup with stroke lesions involving the callosal motor fibers; CMF-total, total segment of the callosal motor fiber; CSTABOVE, segment of the corticospinal tract above the posterior internal capsule; FMA-UE, Fugl-Meyer motor assessment upper extremity subscale; non-CMF, patient subgroup with stroke lesions not involving the callosal motor fibers.
In the non-CMF group, the regression models were not statistically significant when mGFA of the CSTABOVE was the only independent variable (P = .356) or when mGFA of the CMF-total was added as the second independent variable (P = .570). There was no significant association between CMF integrity and UE motor impairment (Pearson’s r = 0.12, P = .681).
Discussion
In this study, we found that mGFA of the CMFs (including total, lateral, and medial segments) was significantly lower in the CMF group but not in the non-CMF group compared with the healthy control group. These results indicate that the microstructure of the CMFs deteriorated in the CMF group but not in the non-CMF group. The reduction in the mGFA of the medial CMFs in the CMF group could have been due to a combination of several pathophysiological changes following ischemic stroke. Selective neuronal loss (i.e., the death of single neurons with preserved extracellular matrix and tissue bulk) is speculated in peri-infarct cortex and in remotely connected regions after an ischemic stroke. 37 This procedure is correlated with callosal atrophy. 38 Wallerian degeneration could be another possible cause of CMF impairment. 8 Finally, inflammation contributes to tissue deterioration after ischemic stroke, 39 and this causes a reduction in mGFA of the peri-infarct areas. 39 By contrast, the presence of trans-synaptic-like retrograde degeneration is not supported by the results of the non-CMF group. If trans-synaptic retrograde degeneration had occurred, the non-CMF group would have exhibited a significant reduction in GFA in the CMFs. However, no significant difference was observed between mGFA of the non-CMF group and that of the healthy control group. In summary, our results suggest that CMF impairment occurs when directly involved by a stroke lesion and is less likely to occur via retrograde trans-synaptic degeneration.
We observed a significant correlation between white matter tracts and UE motor impairment in the CMF group but not in the non-CMF group. In the CMF group, mGFA of the CSTABOVE and CMFs collectively accounted for up to 56% of the variance in UE motor impairment, of which mGFA of the CSTABOVE alone accounted for 48% of the variance. The association between CST integrity and UE motor impairment was consistent with observations in previous studies.40,41 Our CMF group results indicated that the loss of CST integrity—the main motor efferent fibers—primarily accounted for UE motor impairment, whereas the loss of CMF integrity made a minor but incremental contribution. Notably, although the non-CMF group showed significant impairment of CST integrity, no significant association between CST integrity and UE motor impairment was found. Our finding is consistent with a recent study which assigned patients with stroke according to level of motor impairment. 42 In that study, no significant association was found between CST integrity and UE motor impairment in the high FMA-UE group, which happened to have similar mean FMA-UE scores as our non-CMF group. One possibility of this nonsignificant association is that the callosal fibers and neurons in the sensorimotor cortex are relatively intact in the non-CMF group. New rewiring or cortical remapping may occur to compensate for the damaged CST.43,44 Another possibility is the ceiling effect of the FMA-UE, which may not capture the difference in motor function in patients who had relatively mild motor impairment. In summary, our results highlight the dependence of lesion locations on the association between white matter integrity and UE motor impairment.
Unlike findings in the visual system, our results did not support the occurrence of trans-synaptic degeneration in the motor system. The main reason of the discrepancy might lie in the difference in synaptic architectures between the visual and motor systems. In the visual system, the axons of the retinal ganglion cells extend along the optic nerve and optic tract, and end in the lateral geniculate body. These axons form synapses with all postsynaptic neurons in the lateral geniculate body and project to the primary visual cortex. 45 Retrograde trans-synaptic degeneration as evidenced by the thinning of the retinal nerve fiber layer and the ganglion cell complex can be observed after damaging the postsynaptic axons.10,11 In the motor system, however, pyramidal neurons in the motor cortex exhibit a diverse and complex synaptic architecture. Multiple cortical and thalamic areas were found to innervate pyramidal neurons in mouse vibrissal motor cortex 46 ; in addition to the neurons in contralateral primary motor cortex, neurons in contralateral secondary motor cortex, ipsilateral primary and secondary somatosensory cortices, ipsilateral secondary motor cortex, and ipsilateral orbital cortex were found to target pyramidal cells in a layer-specific manner. 46 Despite that the synaptic architecture of human motor cortex remains unclear, callosal motor neurons are known to project to contralateral motor cortex in layer 2/3 and form synapses with pyramidal neurons in layer 5 through the interneurons. 6 Since retrograde trans-synaptic damage is considered to be caused by the loss of trophic support from an injured cell to the presynaptic dendritic tree, 47 the indirect connection between pyramidal neurons and callosal axons might account for the negative results of trans-synaptic degeneration in our study.
The novelty of the present study is that we categorized the patients by determining whether the lesions involved the CMFs. Thus, we can investigate the impact of lesions on both tract integrity and motor impairment in a more location-specific manner than the previous studies.9,48 Our results are supported by neurophysiologic findings using transcranial magnetic stimulation; intracortical inhibition remains in patients with subcortical stroke lesions (lesions below the corpus callosum), whereas intracortical disinhibition is present in patients with cortical stroke lesions (lesions above the corpus callosum).49 -51 The intracortical disinhibition after cortical lesions may be caused by the disruption of transcallosal inhibition 51 that results from deterioration of the callosal fibers. The remaining intracortical inhibition after subcortical stroke implies the absence of trans-synaptic degeneration in the callosal fibers. 51 The suggestion of trans-synaptic degeneration of the CMFs in the previous studies9,48 may be confounded by the fact that patients with lesions involving the CMFs and those with intact CMFs were combined into one group. Therefore, we suggest that future studies regarding stroke recovery should carefully select patients by considering their lesion locations. Furthermore, CMF integrity should be considered when investigating treatment effects of interventions that modulate interhemispheric balance.
To control interindividual variation in FA within a clinical sample, previous studies normalized the FA values of the affected side with the unaffected side to represent the structural integrity of a lesion-affected fiber tract. For example, the laterality index (ie, the asymmetry of the FA values between the affected and unaffected tracts divided by the sum of the FA values of the affected and unaffected tracts) 41 and the ratio index (i.e., the ratio between FA of a tract in the affected hemisphere over FA of the homologous tract in the unaffected hemisphere) 52 are 2 commonly used indices. However, unlike the CST, which could be divided as unaffected and affected sides by the mid-sagittal plane, the degeneration of the CMFs may cross the mid-sagittal plane. Using the laterality index or the ratio index may underestimate the damage of CMF integrity when CMF degeneration crosses the midline. In this study, we investigated CMF integrity using the original GFA values to avoid the aforementioned bias.
This study has 2 limitations. First, the present study was a cross-sectional study. Our participants all had a history of stroke for >6 months before enrolling in the study; this is longer than the average time required for trans-synaptic degeneration to occur (approximately 30 days poststroke). 53 Therefore, our study period was sufficiently long to detect this effect. Nonetheless, our findings require further validation through longitudinal studies to delineate the temporal effect of CMF degeneration. Second, the GFA value is nonspecific for probing trans-synaptic degeneration. Although our results do not support the occurrence of retrograde trans-synaptic degeneration in the motor system, development of new imaging techniques providing specific information at the cellular level is required for further clarification.
Conclusions
As compared with the healthy controls, lower mGFA in the CMFs was only seen when the CMFs were affected by the stroke and that lower CMF integrity was related to UE motor impairment after correcting for the CST lesion load in the CMF group. The findings may be of value in differentiating motor recovery prognosis and in assessing individual therapy response based on lesion locations.
Footnotes
Supplementary material for this article is available on the Neurorehabilitation & Neural Repair website along with the online version of this article.
Declaration of Conflicting Interests
The authors declared no potential conflicts of interest with respect to the research, authorship, and/or publication of this article.
Funding
The authors disclosed receipt of the following financial support for the research, authorship, and/or publication of this article: The study was supported by the National Science Council (NSC 96-2628-B-002-034-MY3; NSC 101-2314-B-002-194-MY3, NSC 98-2314-B-002-016-MY3, NSC 101-2314-B-002-009) and the Ministry of Economy Affairs (101-EC-17-A-19-S1-175), Taiwan.