
Abstract
Background. There is growing interest to establish recovery biomarkers, especially neurological biomarkers, in order to develop new therapies and prediction models for the promotion of stroke rehabilitation and recovery. However, there is no consensus among the neurorehabilitation community about which biomarker(s) have the highest predictive value for motor recovery. Objective. To review the evidence and determine which neurological biomarker(s) meet the high evidence quality criteria for use in predicting motor recovery. Methods. We searched databases for prognostic neuroimaging/neurophysiological studies. Methodological quality of each study was assessed using a previously employed comprehensive 15-item rating system. Furthermore, we used the GRADE approach and ranked the overall evidence quality for each category of neurologic biomarker. Results. Seventy-one articles met our inclusion criteria; 5 categories of neurologic biomarkers were identified: diffusion tensor imaging (DTI), transcranial magnetic stimulation (TMS), functional magnetic resonance imaging (fMRI), conventional structural MRI (sMRI), and a combination of these biomarkers. Most studies were conducted with individuals after ischemic stroke in the acute and/or subacute stage (~70%). Less than one-third of the studies (21/71) were assessed with satisfactory methodological quality (80% or more of total quality score). Conventional structural MRI and the combination biomarker categories ranked “high” in overall evidence quality. Conclusions. There were 3 prevalent methodological limitations: (a) lack of cross-validation, (b) lack of minimal clinically important difference (MCID) for motor outcomes, and (c) small sample size. More high-quality studies are needed to establish which neurological biomarkers are the best predictors of motor recovery after stroke. Finally, the quarter-century old methodological quality tool used here should be updated by inclusion of more contemporary methods and statistical approaches.
Keywords
Introduction
There is growing interest in establishing stroke recovery biomarkers. Researchers define stroke recovery biomarkers as surrogate indicators of disease state that can have predictive value for recovery or treatment response. 1 Specifically, previous studies have suggested that better understanding of neurological biomarkers, derived from brain imaging and neurophysiological assessments, is likely to move stroke rehabilitation research forward.1,2
Recovery biomarkers acquired during the acute and subacute phases (acute—within 1 week after onset; subacute—between 1 week and 3 months after onset) may be vital to set attainable neurorehabilitation goals and to choose proper therapeutic approaches based on the recovery capacity. Furthermore, motor recovery prediction using neurological biomarkers in the chronic phase (more than 3 months after onset) can be useful to determine whether an individual will benefit from specific therapeutic interventions applied after the normal period of rehabilitation has ended. Hence, use of recovery biomarkers is likely to improve customization of physical interventions for individual stroke survivors regarding their capacity for recovery, and to facilitate development of new neurorehabilitation approaches.
There have been fundamental changes in recovery biomarkers from simple clinical behavioral biomarkers to brain imaging and neurophysiological biomarkers. In particular, a number of recent studies have shown that neurologic biomarkers (ie, neuroimaging and/or neurophysiological measures of brain) are more predictive of motor recovery than clinical behavioral biomarkers.3-5
Although there is some evidence that neurological biomarkers are more valuable as predictors of motor recovery than clinical behavioral biomarkers, there are significant gaps between the published evidence and clinical usage. First, there is no consensus on which specific neurological biomarkers would be best for prediction models.4,6,7 Viable neurological biomarker of motor recovery have evolved from lesion size and location, prevalent in the early 1990s 8 to more contemporary complex brain network analysis variables. 9 Despite this evolution, there is a paucity of high-level evidence for determining the most critical neurological biomarkers of motor recovery. A number of literature reviews and systematic reviews of studies published since the 1990s aimed to identify the most appropriate biomarkers of motor recovery or functional independence.8,10-12 Among these reviews, only one by Schiemanck and colleagues 8 assessed the evidence quality of neurologic biomarkers, while many focused on clinical measures (ie, clinical motor and/or functional measures). 11 Their review was limited to only 13 studies that employed structural magnetic resonance imaging (sMRI) measures of lesion volume as neurologic biomarkers. Besides lesion volume derived from structural MRI, there are other viable neurological biomarkers of brain impairment. Therefore, this systematic review includes a broad set of relevant biomarkers for consideration as critical predictors for inclusion in motor recovery prediction models.
Furthermore, there is some evidence to suggest that multivariate prediction models that use neurological biomarkers in addition to clinical outcome measures are more accurate than those that use clinical outcome measures alone.2,13 However there is still no consensus about whether incorporating behavioral and neurological predictors in a multimodal prediction model is superior (ie, more accurate) to a univariate model that includes either behavioral or neurological predictors alone.
Taken together, this systematic review has 2 aims. The first is to conduct a critical and systematic comparison of selected studies to determine which neurological biomarker(s) is likely to have sufficient high-level evidence in order to render the most accurate prediction of motor recovery after stroke. The second aim is to identify whether adding clinical measures along with neurological biomarkers in the model improves the accuracy of the model compared to the models that use neurological biomarkers alone.
Methods
Inclusion and Exclusion Criteria
Given the goal to predict motor recovery after stroke, the inclusion and exclusion criteria were adapted from a recent systematic review of the same topic (Table 1). 11 Major differences are that Chen and Winstein 11 used the International Classification of Functioning and Disability as an organizing framework for dependent measures (ie, behavioral outcomes), and they included clinical prognostic studies without neuroimaging/neurophysiological predictors.
Inclusion and Exclusion Criteria.
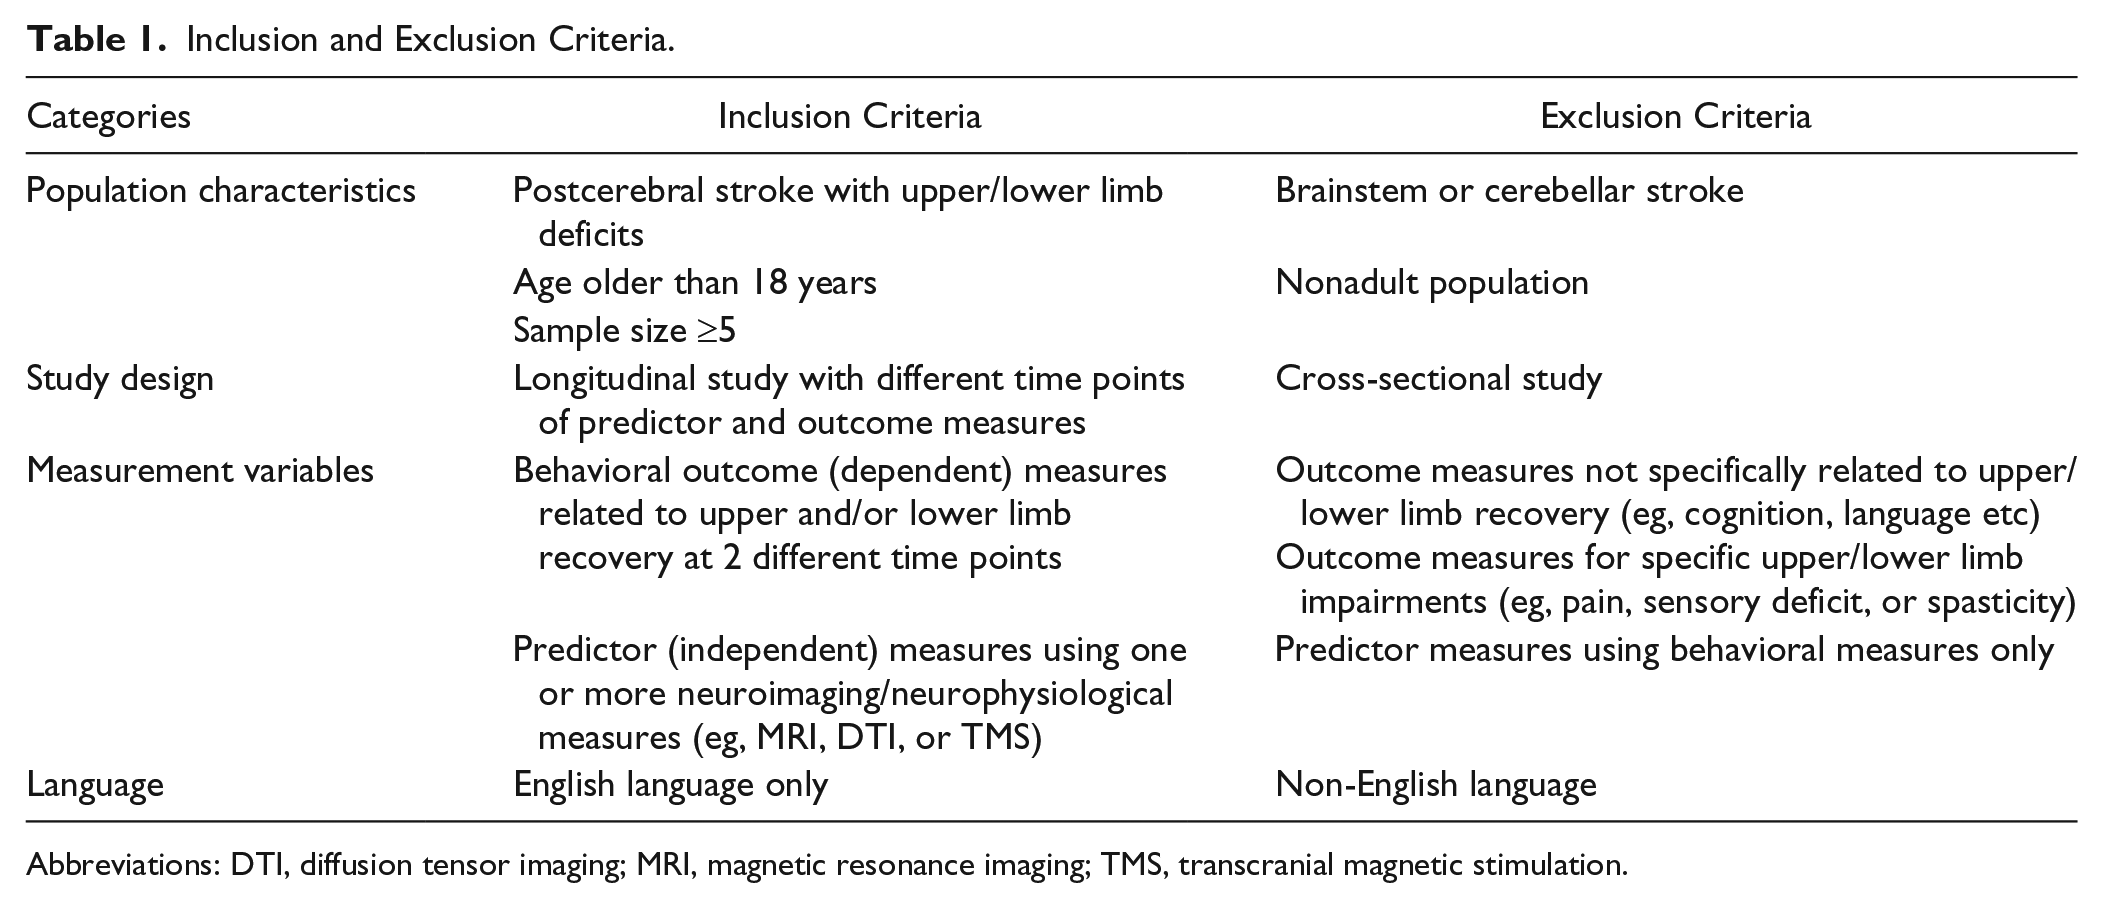
Abbreviations: DTI, diffusion tensor imaging; MRI, magnetic resonance imaging; TMS, transcranial magnetic stimulation.
Literature Search Strategy
Research articles published before December 2015 were searched for in PubMed, ISI Web of Knowledge, and Google Scholar. Search keywords included [“stroke” and “motor recovery” and “predict”] and one of the following keywords [“neuroimaging” or “neurophysiological measure” or “diffusion tensor imaging” or “magnetic resonance imaging” or “transcranial magnetic stimulation”].
Evidence Methodological Quality Evaluation
We evaluated 71 studies using the evidence methodological quality score (EQS). The methodological quality grading criteria were adapted from previous systematic reviews of a similar topic.8,11,14,15 This evaluation system includes 3 categories: internal validity, statistical validity, and external validity. Each category contains several items, and each item is scored using a binary system: yes (1) or no (0). The maximum EQS is 15 (Table 2; see the appendix for detail).
Evidence Quality Score (EQS) Evaluation Categories.
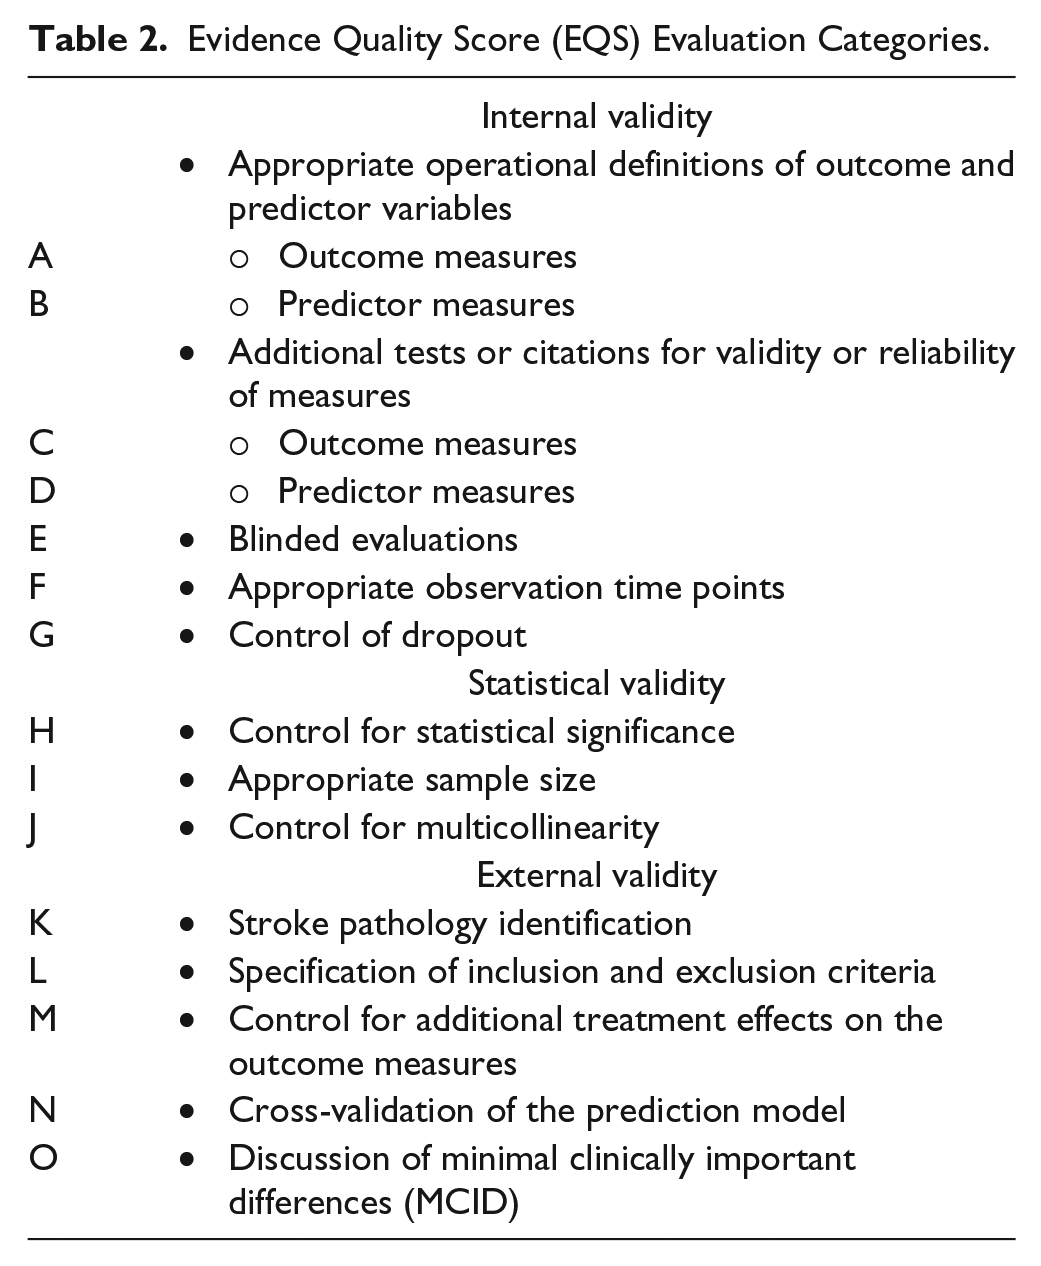
This evidence methodological quality scheme was developed based on the recommendations of the “Task Force on Stroke Outcome Research of Impairments, Disabilities and Handicap,” 16 and the methodological guidelines for stroke outcome research are consistent with these criteria.15,17
Overall Evidence Quality Evaluation
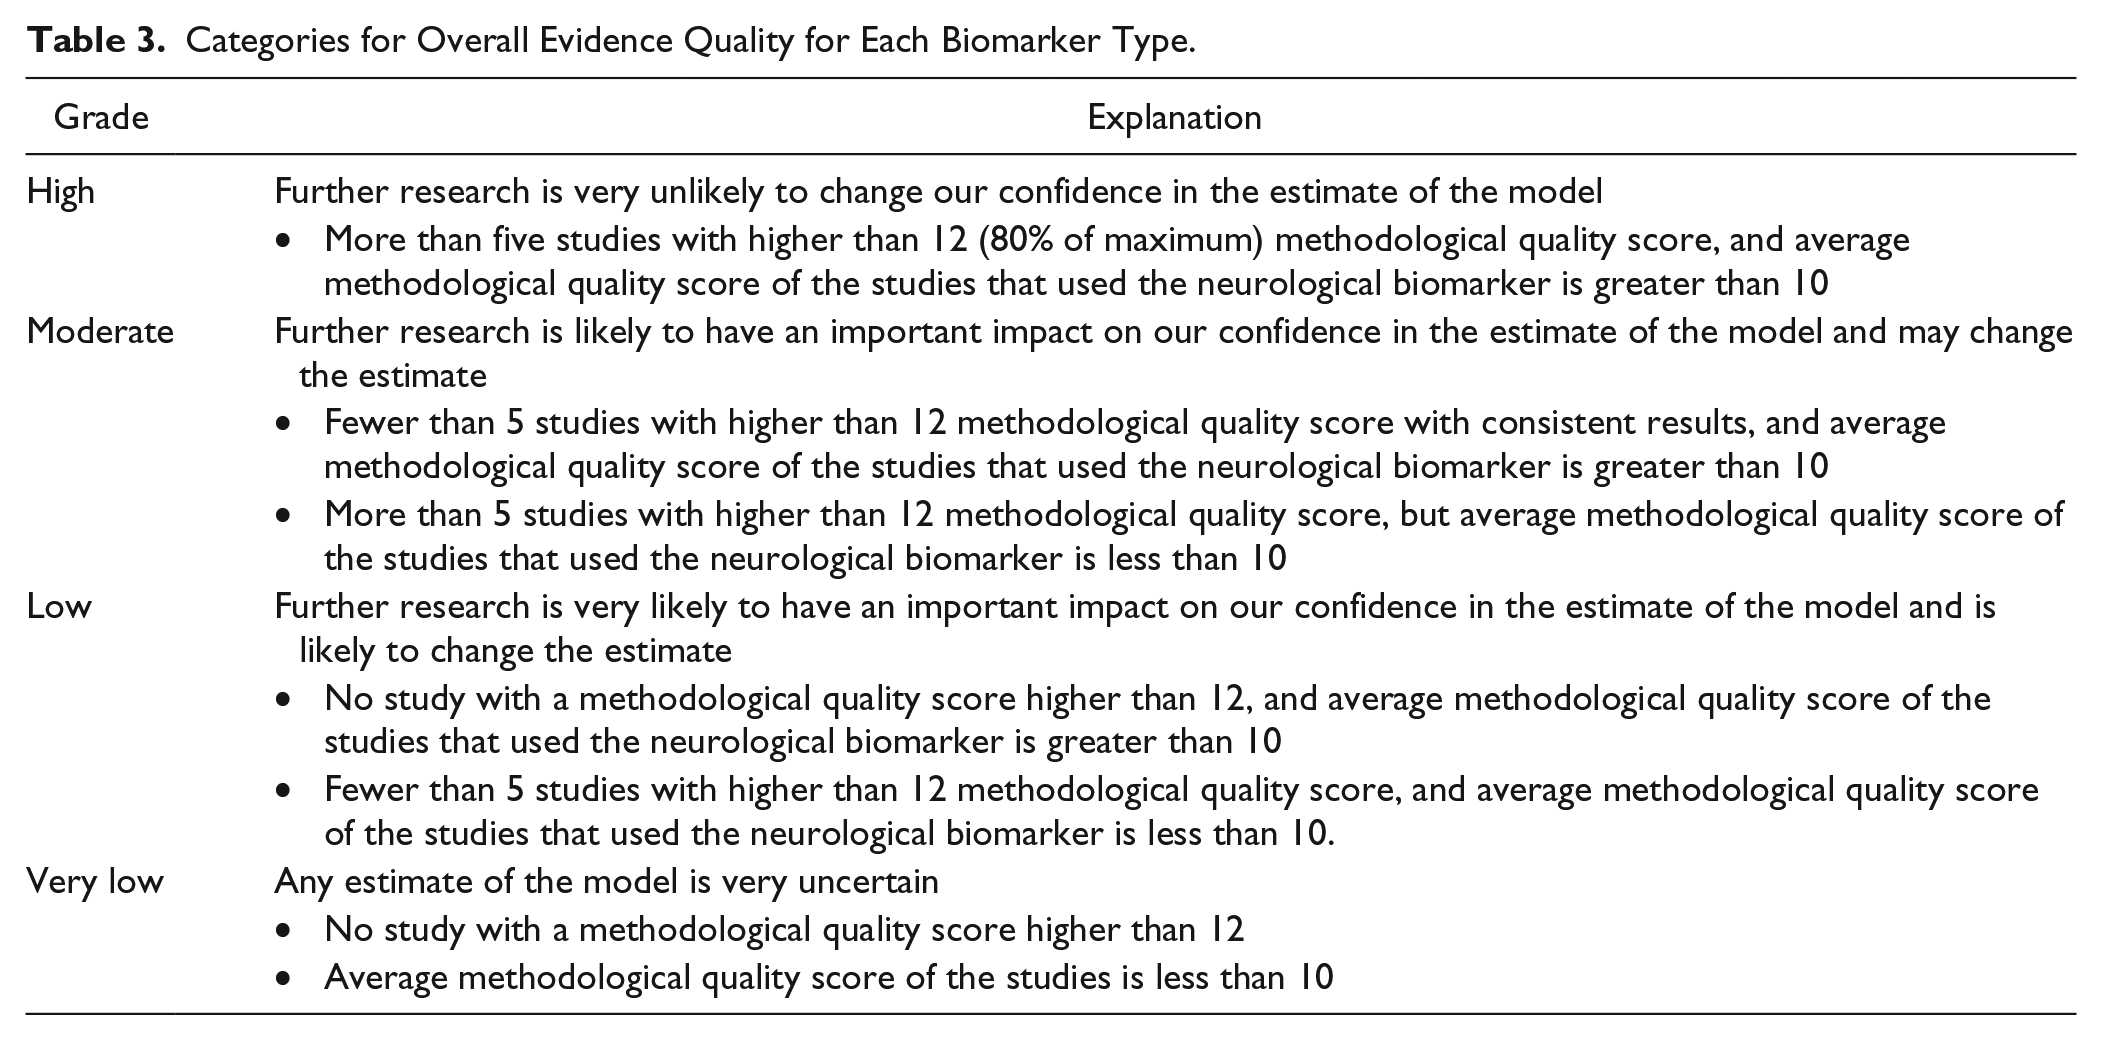
The evidence grading system from the GRADE Working Group 18 was adapted to evaluate the overall evidence quality for each neurological biomarker category. We graded the overall evidence quality using a 4-level system: “High,” “Moderate,” “Low,” and “Very low.” Table 3 describes the criteria for each level.
Categories for Overall Evidence Quality for Each Biomarker Type.
Prediction Regression Model Evaluation
To evaluate these models, we estimated effect size and statistical power of each model. We assume that the statistical power of each prediction model reflects the accuracy and robustness of the model. If the article reported more than one model, each model’s statistical power and effect size were calculated separately. We extracted the R2 value, significance level, and number of participants to calculate statistical power.19,20 To compare the prediction models with or without clinical measures or demographic predictors, models were separated into 2 groups: (a) regression models using neurological biomarkers alone and (b) regression models using neurological biomarkers in conjunction with clinical (or demographic) measures.
Results
Literature Search
In all, 452 English language articles were found from the 3 databases. By screening the title and abstract, 81 articles were selected for review based on inclusion and exclusion criteria. Of the articles selected from the screening, 10 were excluded. Finally, 71 articles were included in the evidence quality evaluation (Figure 1). Details of included studies are summarized in Table 4.
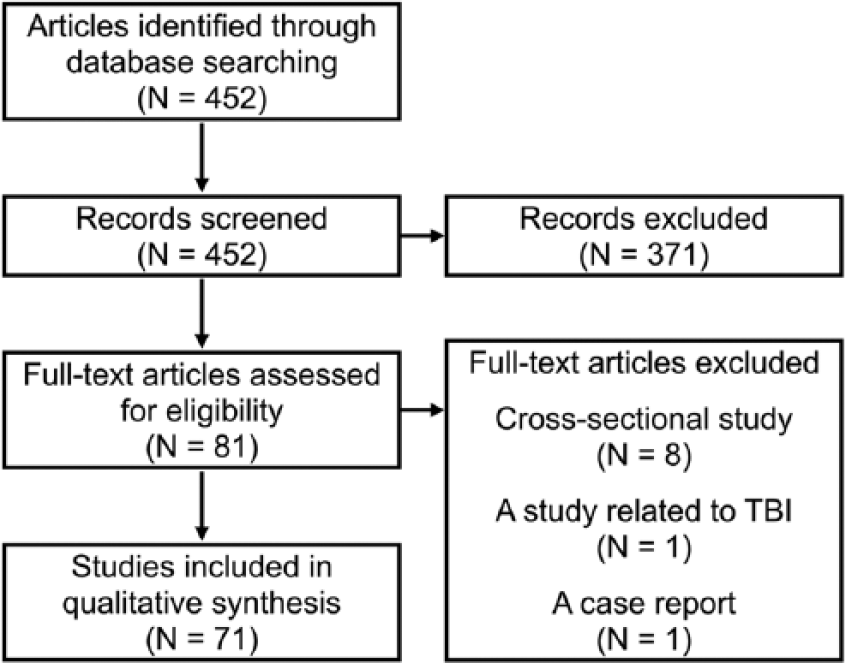
Evidence search strategy diagram.
Summary of Included Articles.
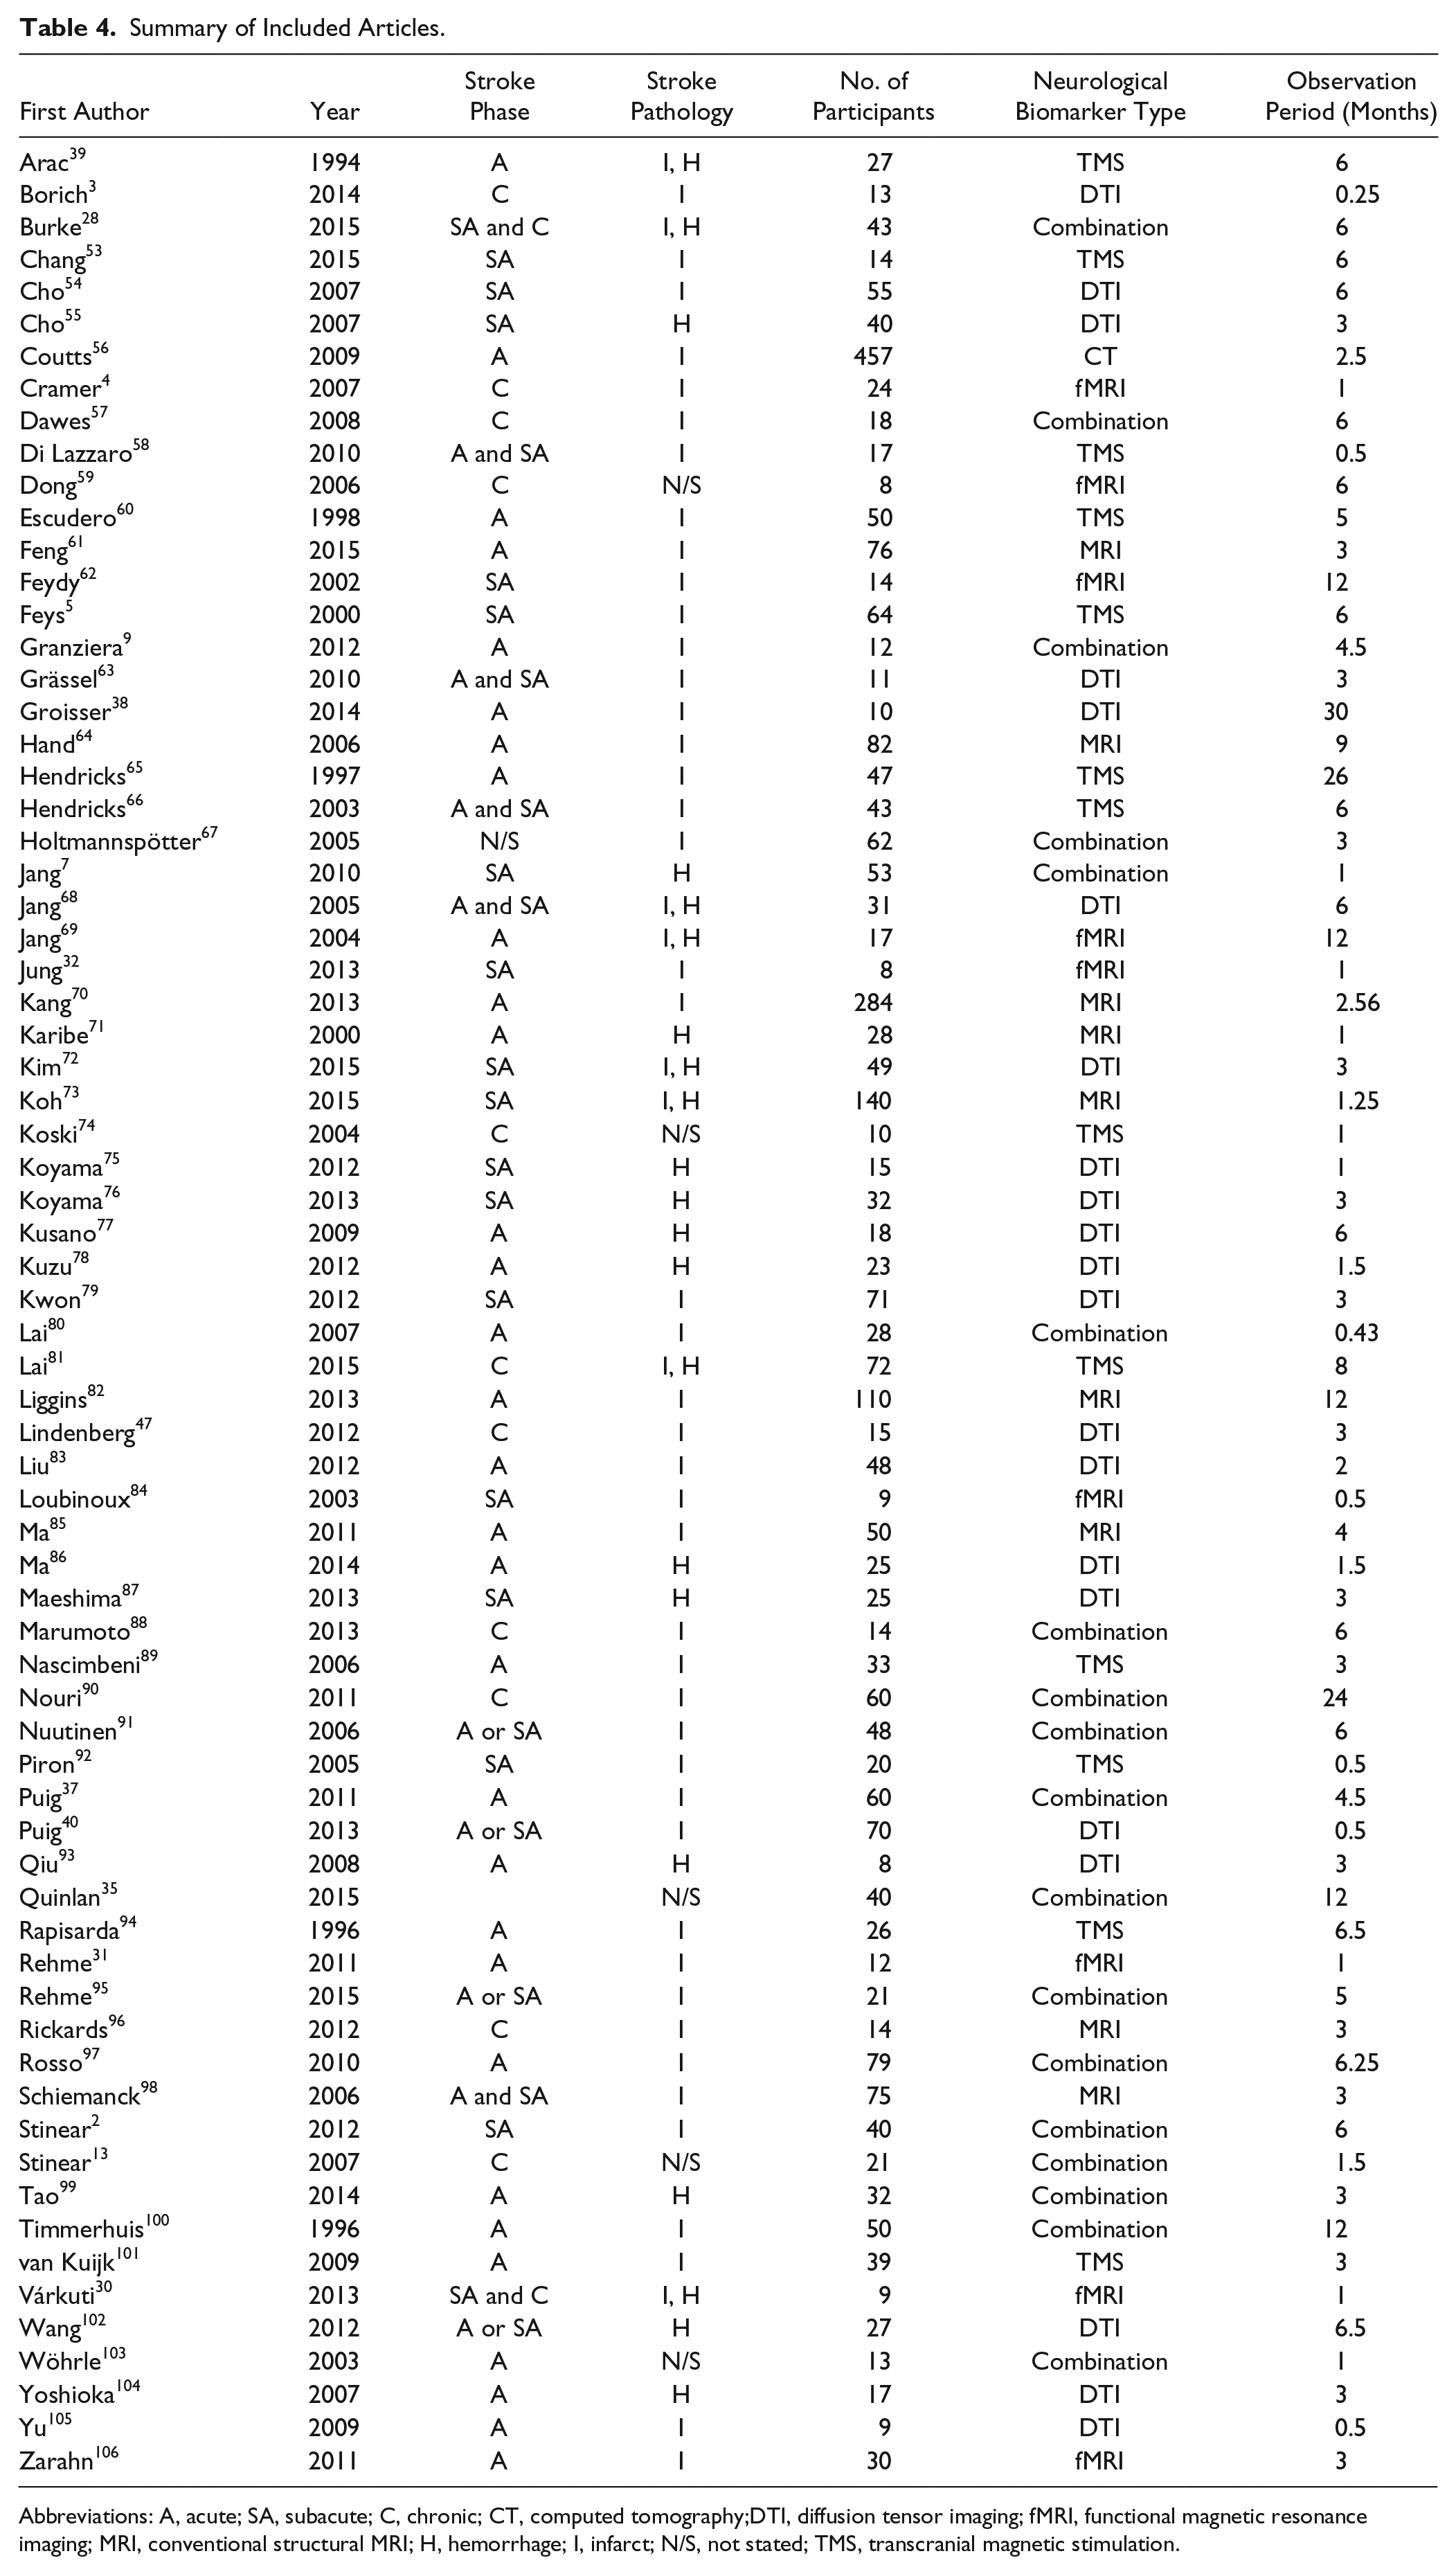
Abbreviations: A, acute; SA, subacute; C, chronic; CT, computed tomography;DTI, diffusion tensor imaging; fMRI, functional magnetic resonance imaging; MRI, conventional structural MRI; H, hemorrhage; I, infarct; N/S, not stated; TMS, transcranial magnetic stimulation.
Trend in Number of Publications by Year
The earliest study to meet our inclusion/exclusion criteria was published in 1994. Generally, there was an increasing trend in the number of publications over time (Figure 2). On average, every year between 1994 and 2015 there have been approximately 3 publications per year with a high of 9 in 2012.

Trend in number of publications per year. Most predictive studies using neurological biomarkers published after 2000. This trend is consistent with the development of noninvasive brain neuroimaging/neurophysiological assessment tools.
Stroke Pathology and Phases
A total of 3215 post–cerebral stroke individuals participated in the 71 studies included. The classification of pathology and stroke phase is summarized in Table 5. Among these participants, 1,800 (56%) from 31 studies were in the acute phase of recovery, 649 (20.2%) from 16 studies were in the subacute phase, and 269 (9.6%) from 12 studies were in the chronic phase when the neuroimaging/neurophysiological assessments occurred.
Number of Subjects by Across Studies by Stroke Pathology Type and Timing.
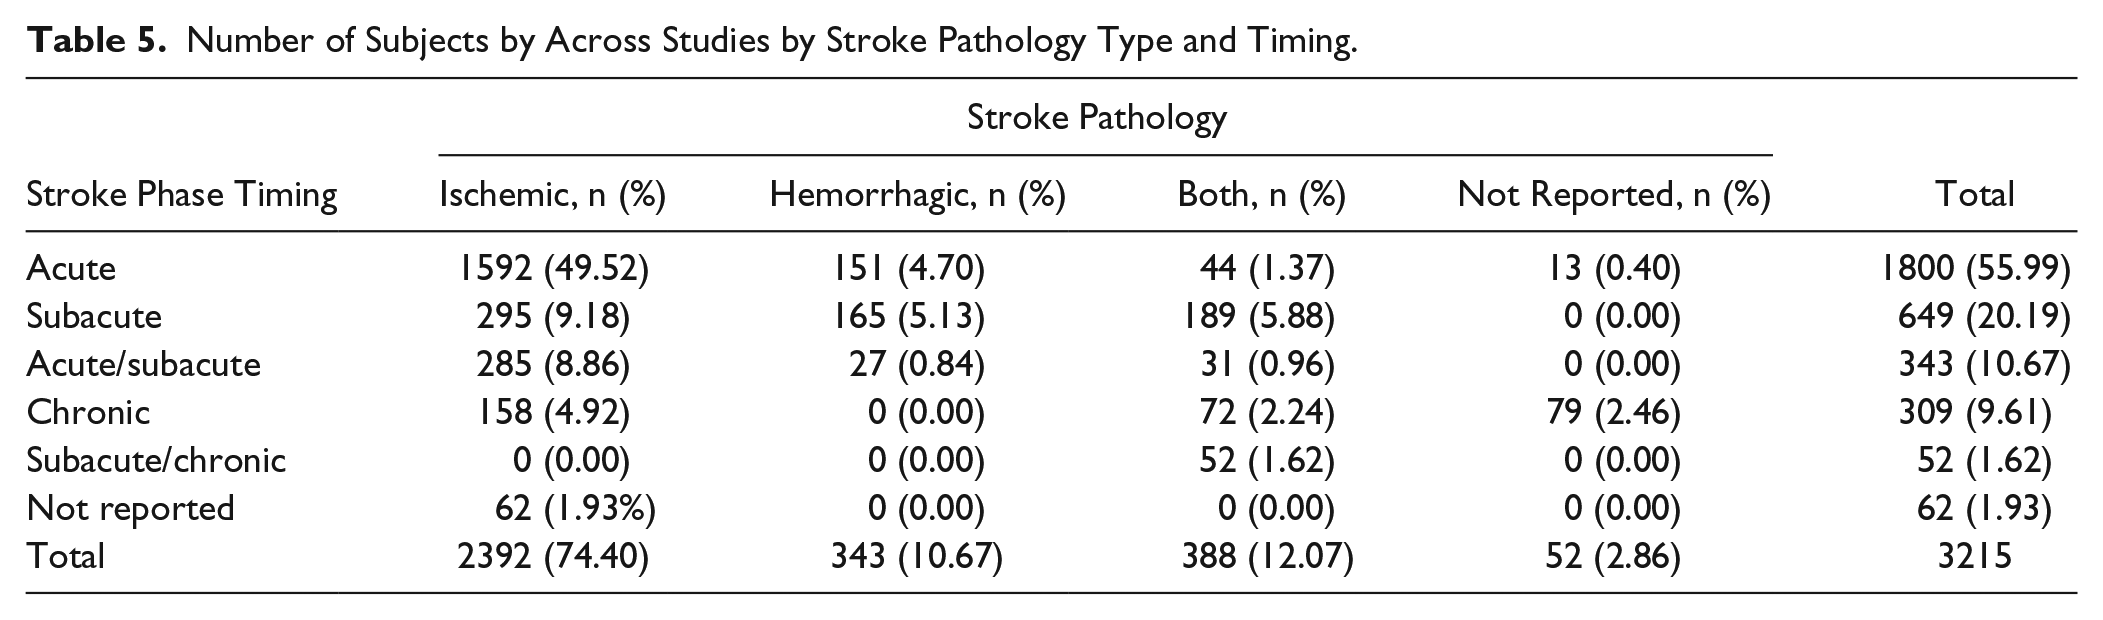
Most studies were conducted with ischemic stroke patients (2392 of 3215, 75%). Approximately 50% of patients were in an acute phase with ischemic brain damage (Table 5).
Types of Neurological Biomarkers
There were 5 main categories of neurological biomarkers: diffusion tensor imaging (DTI), transcranial magnetic stimulation (TMS), functional MRI (fMRI), structural MRI (sMRI), and a combination of these biomarkers. Eighteen studies utilized these biomarkers and other clinical measures together as predictors (Table 6)
Summary of 5 Types of Neurological Biomarkers.
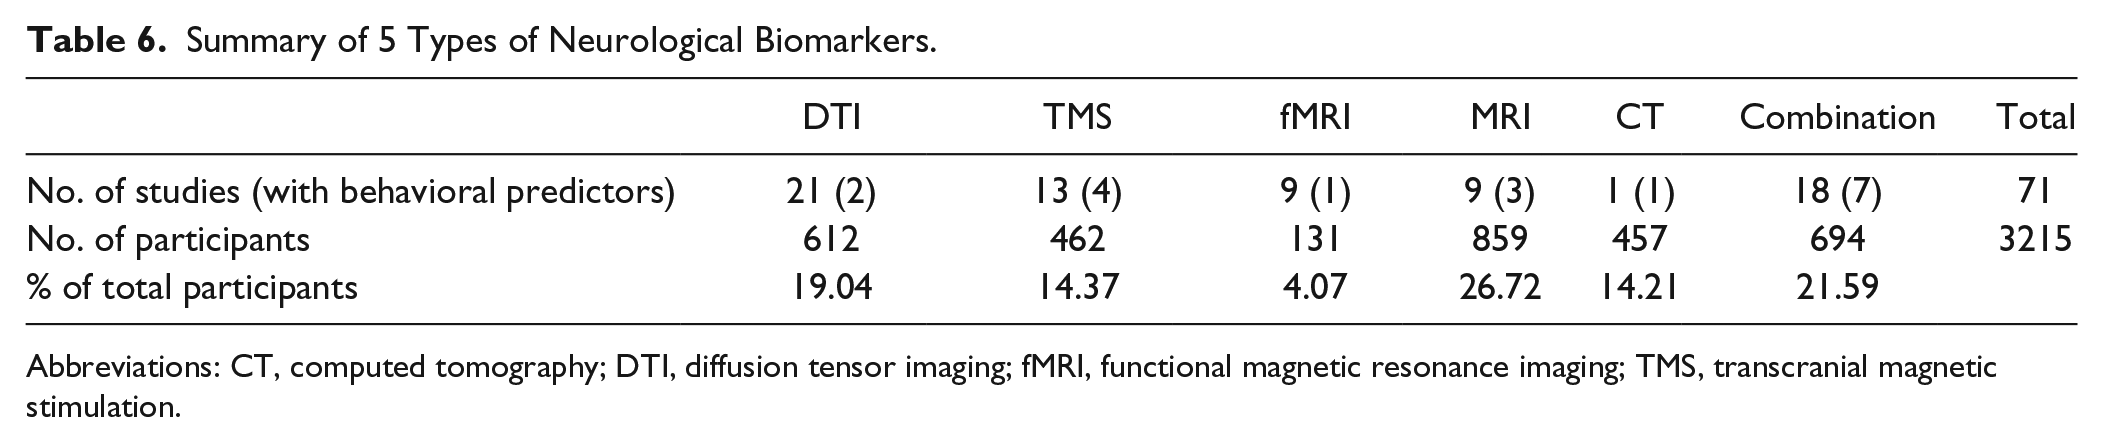
Abbreviations: CT, computed tomography; DTI, diffusion tensor imaging; fMRI, functional magnetic resonance imaging; TMS, transcranial magnetic stimulation.
In the acute phase, DTI, TMS, sMRI, and combination biomarker types were similarly employed for the prediction model. Functional MRI was the least frequently used type (3 of 31 studies with acute participants). In the subacute phase, DTI biomarker type was predominantly used (7 of 16 studies with subacute participants). In the chronic phase, combination type was the most frequent type (5 of 12 studies with chronic participants) (Figure 3).
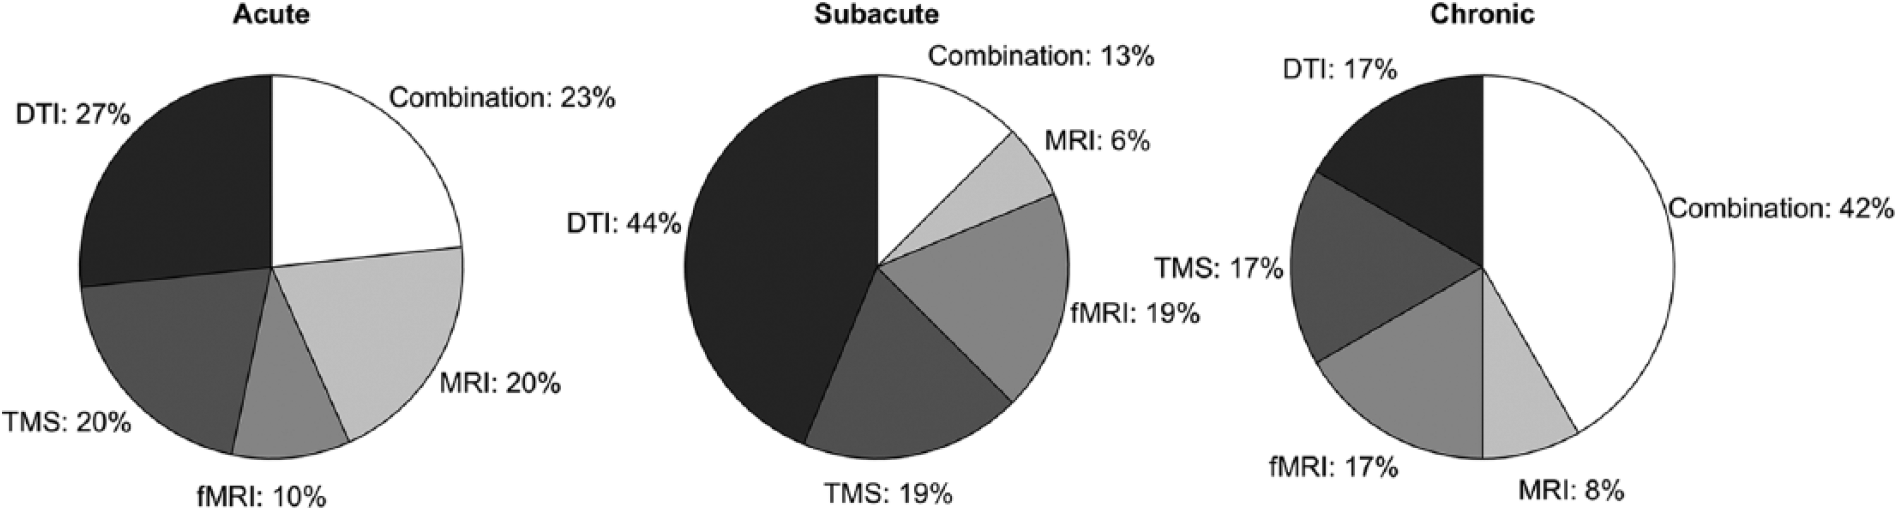
Frequency of each neurological biomarker type for each stroke phase.
As prevalence of CT biomarker was too low to discuss the methodological quality, we excluded the CT biomarker from the discussion (only 1 large-scale retrospective observational study used a CT biomarker).
We describe the details of predictor variables for each neurological biomarker type in the supplementary material.
Clinical Endpoints for Motor Recovery
There were approximately 35 different clinical measures to capture motor recovery after stroke (Figure 4). The most frequently (6 or more studies) utilized clinical endpoint measures were: National Institutes of Health Stroke Scale (NIHSS, including modified version), Rankin Scale (RS, including modified version), Barthel Index (BI), Fugl-Meyer Assessment (FMA, including upper and lower extremities, or separate versions), Motricity Index (MI), Medical Research Council (MRC) score, and Wolf Motor Function Test (WMFT) Time score.
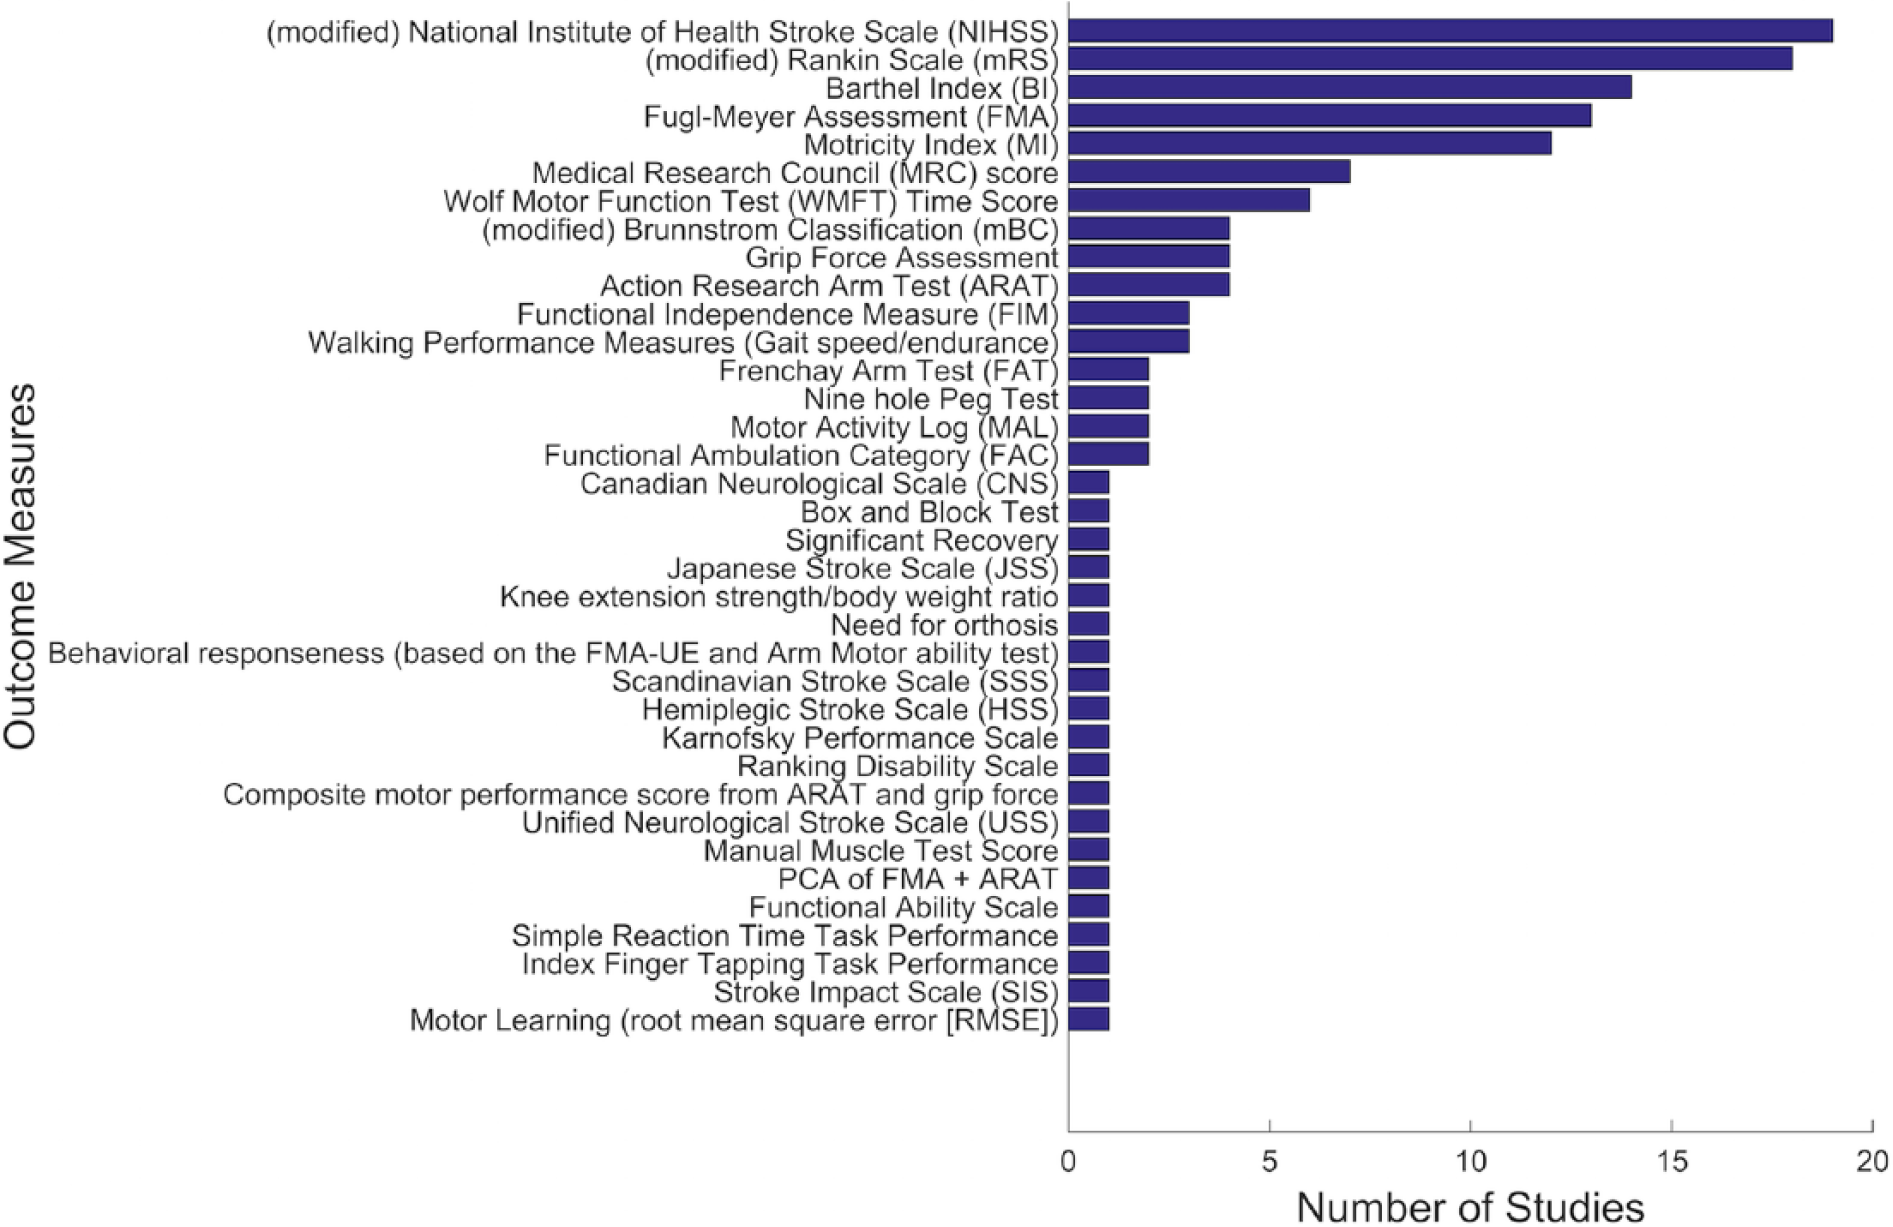
Summary of motor endpoint (dependent) measures. Most prediction studies used broadly defined clinical endpoints, such as the Rankin Scale or the National Institutes of Health Stroke Scale.
Evidence Methodological Quality
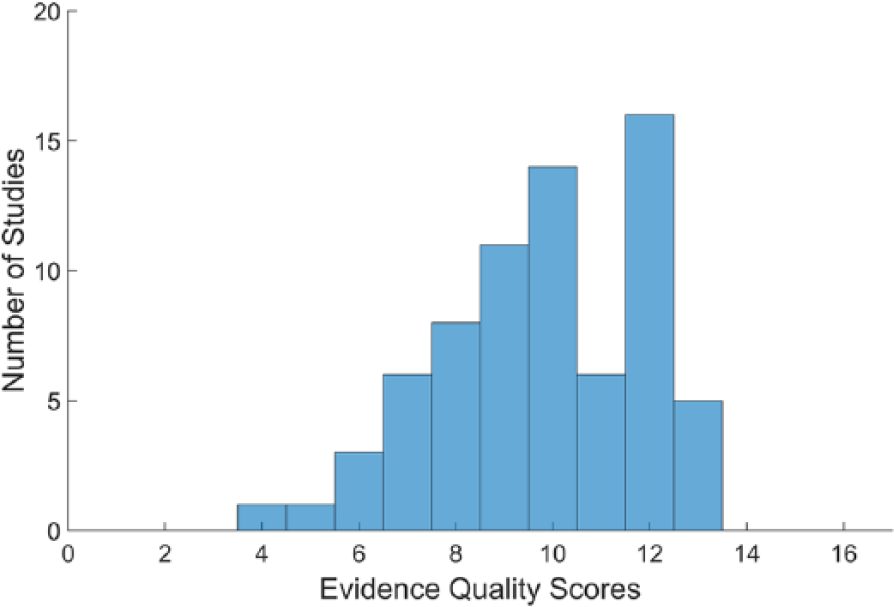
The results of the evidence methodological quality evaluation are summarized in Table 7. The mean EQS (mean ± SD = 9.79 ± 2.13) of all reviewed studies was relatively high (range 4-13; Figure 5). There were 21 out of 71 studies (30%) with an EQS score of 12 (80% of total score) or more, and these studies are highlighted in Table 7.
Summary of Evidence Methodological Quality Score Evaluation. a
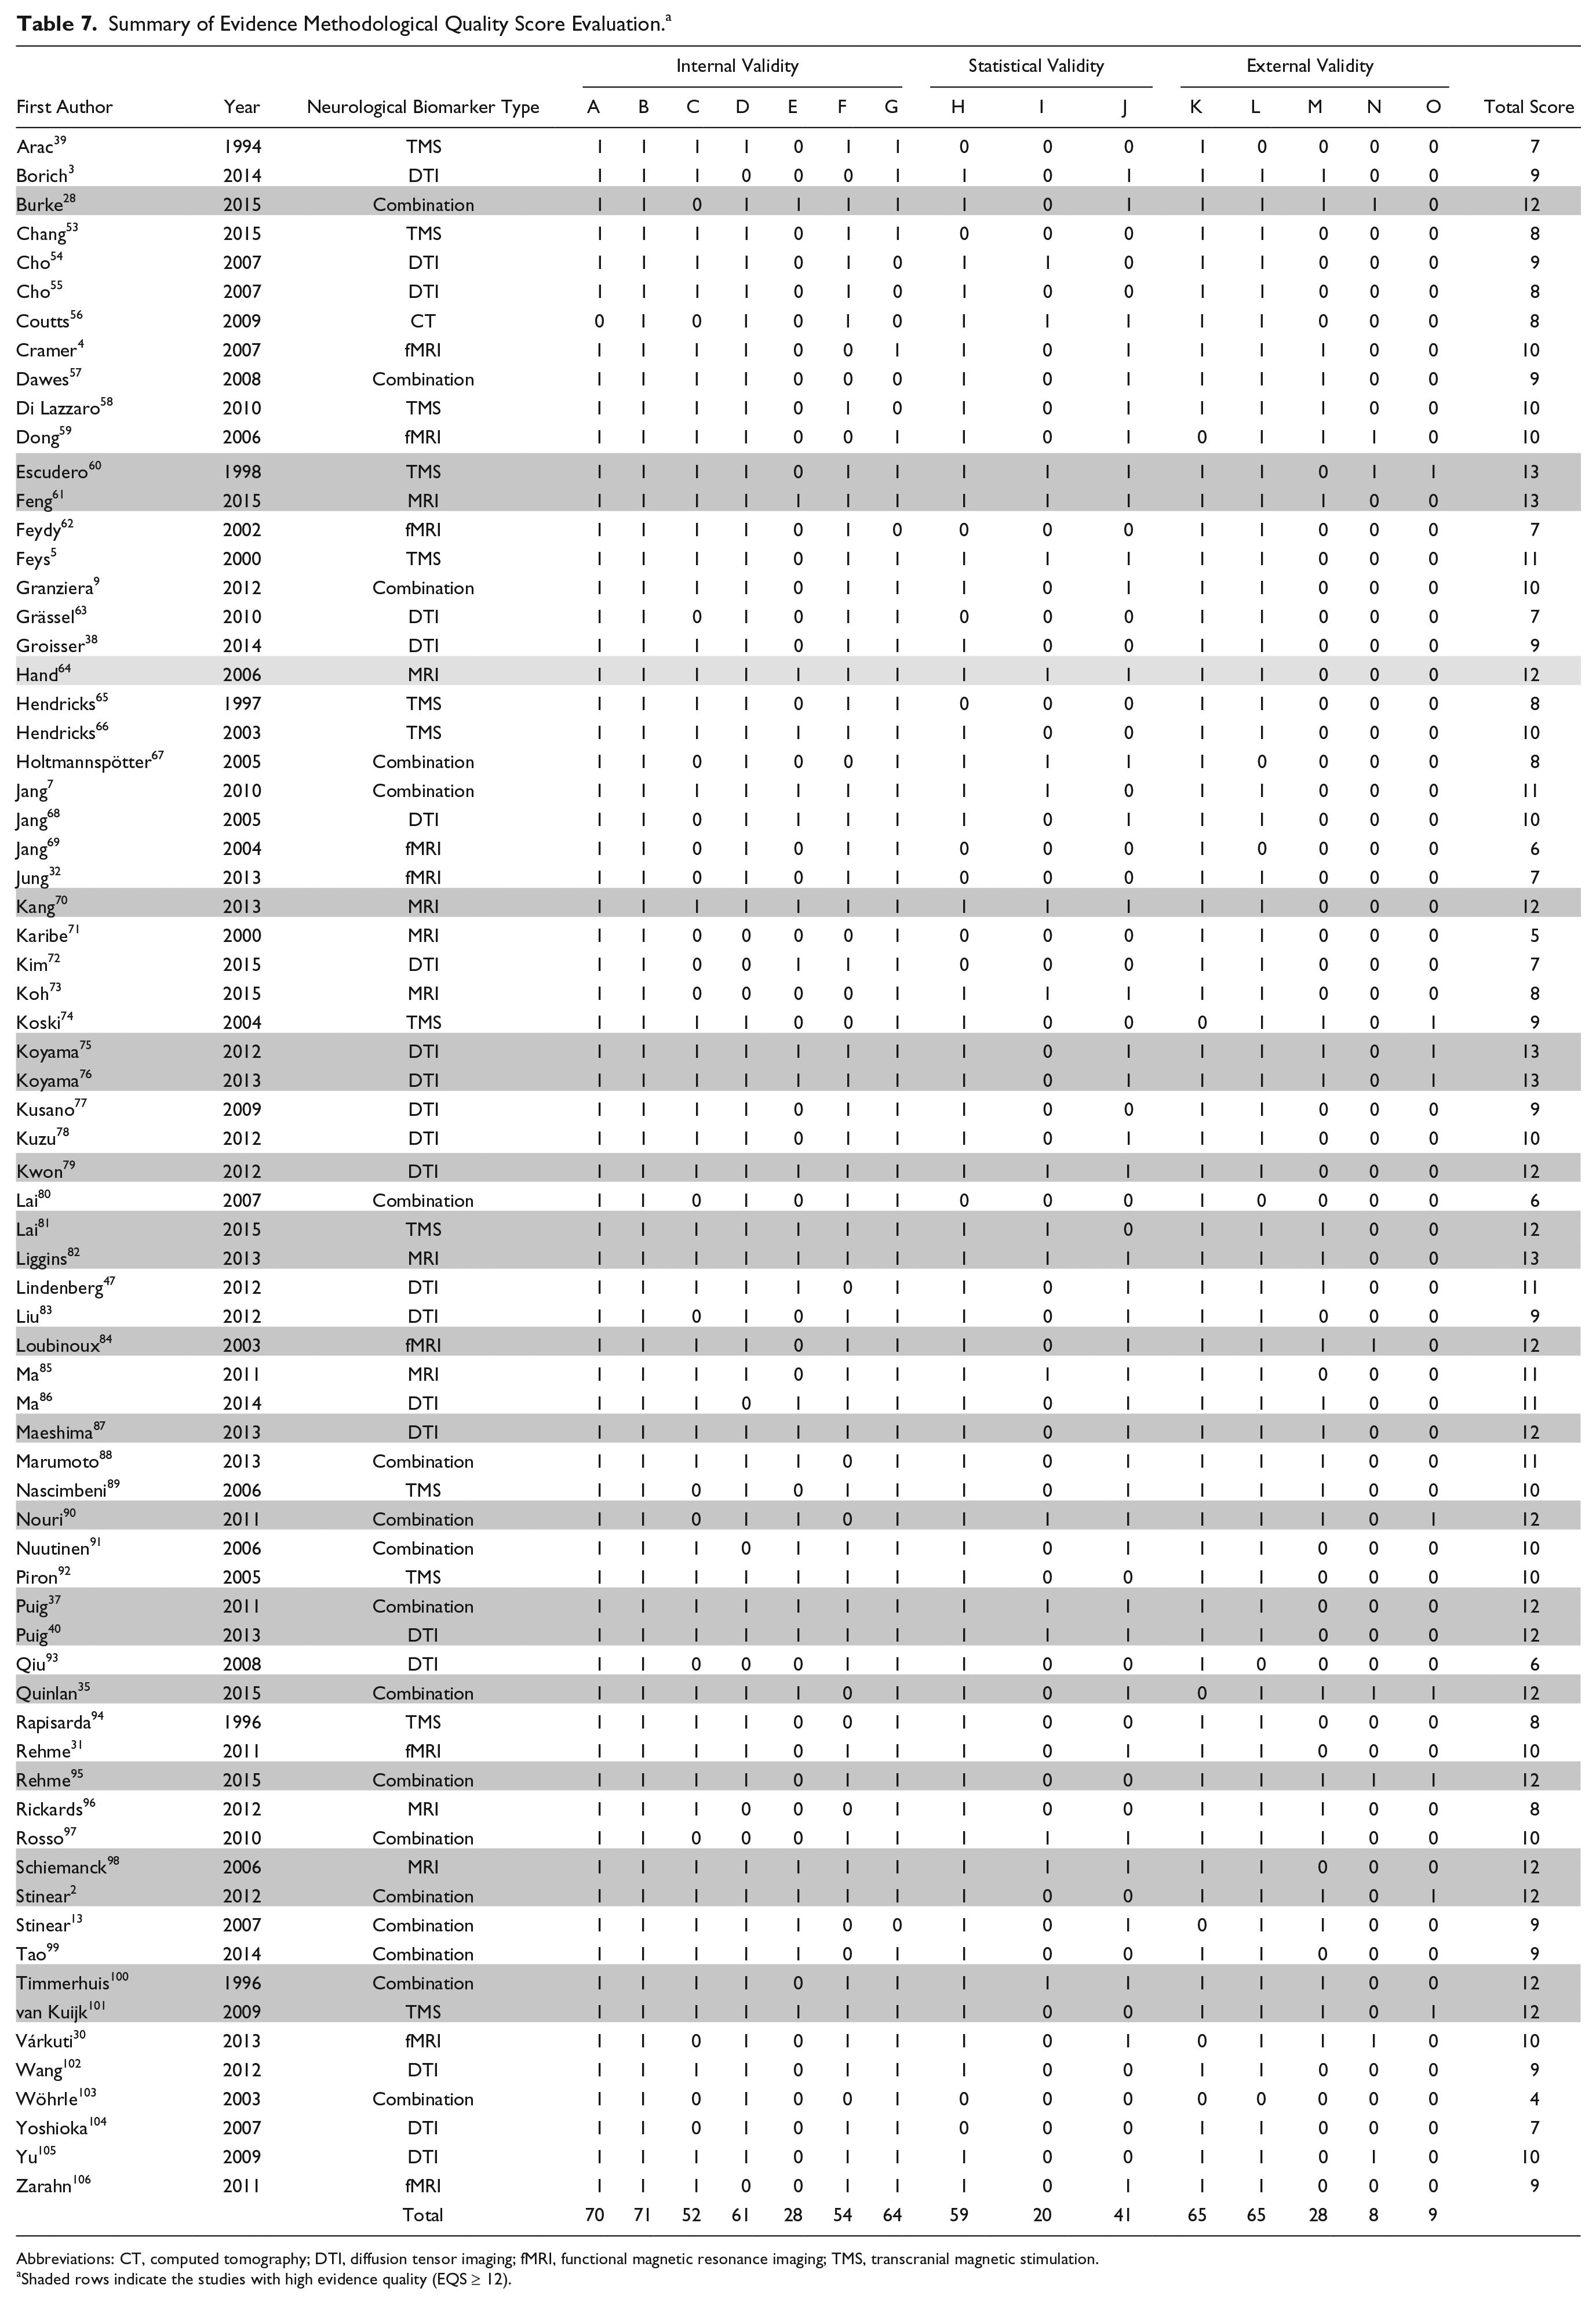
Abbreviations: CT, computed tomography; DTI, diffusion tensor imaging; fMRI, functional magnetic resonance imaging; TMS, transcranial magnetic stimulation.
Shaded rows indicate the studies with high evidence quality (EQS ≥ 12).
Distribution of evidence methodological quality scores.
Internal Validity
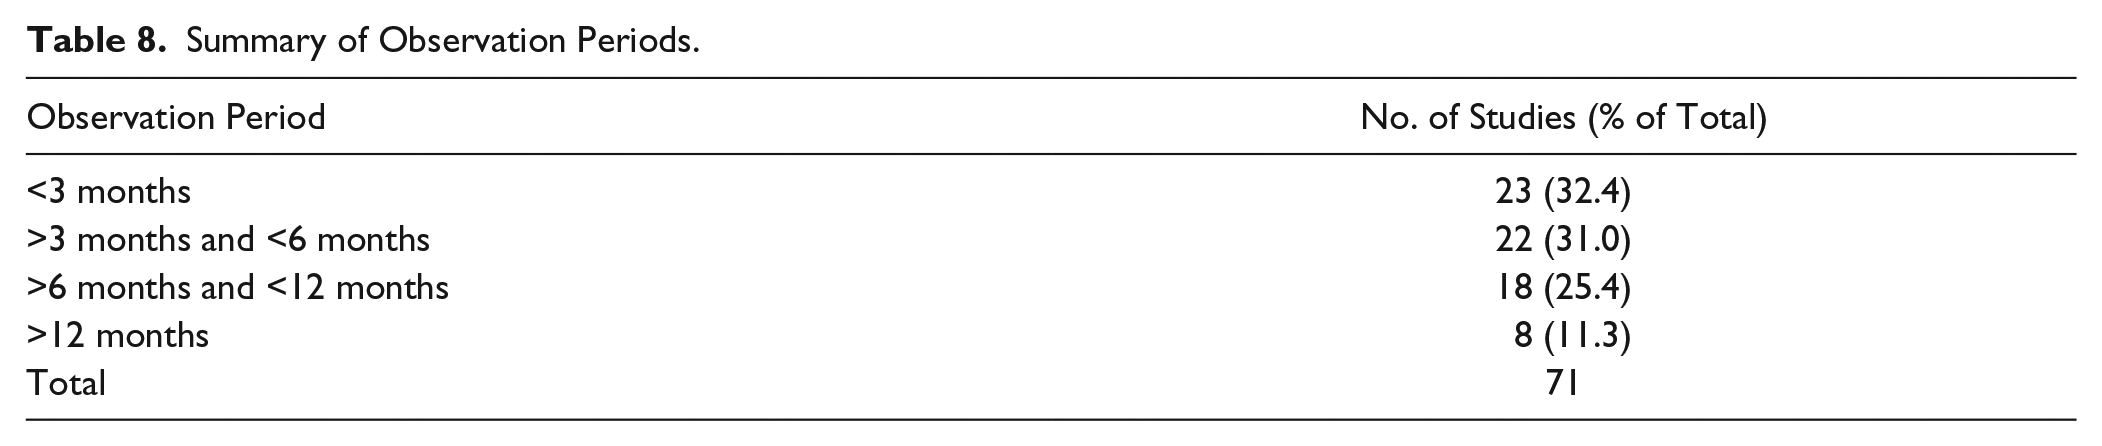
Most studies provided proper operational definitions of predictor and outcome measure variables. Fifty-two studies (73%) described validity and/or reliability of clinical endpoint measures, and 61 studies (86%) explained validity and reliability of their neurological measures. In 28 studies (39%), raters of predictor and outcome variables were blinded to the study purpose and other measures. In 54 studies (76%), the predictor variables were measured within 1 month after the index stroke, and the outcome measures were assessed at least 8 weeks after the measure of predictor variables. Among the 59 studies with poststroke individuals in the acute and subacute phases, the mean observation period was about 5 months after stroke (Table 8). Sixty-four studies (90%) described the number of and reasons for dropouts, or had no dropouts.
Summary of Observation Periods.
Statistical Validity
Most studies (59 of 71) applied appropriate statistical analyses. For the appropriate sample size, however, only 20 studies (~28%) met the appropriate sample size criteria. Furthermore, 41 studies (~58%) considered multicollinearity to control the effects of confounding variables on their correlation or regression analyses.
External Validity
Most studies (67 of 71) identified stroke pathology. Sixty-five studies (~92%) described inclusion and exclusion criteria. Six studies did not specify inclusion and exclusion criteria, or their descriptions of the criteria were insufficient to replicate the recruitment criteria. Only 28 studies (39%) discussed the effects of additional treatment on outcomes. Most of these studies described the treatments, such as physical therapy and/or occupational therapy, which were provided during study participation. Only 8 studies (~11%) performed the cross-validation of their prediction model using an independent group of participants with stroke. Nine studies (~13%) discussed clinically meaningful differences of predictors or outcome measures.
Overall Evidence Quality for Each Neurologic Biomarker Category
Table 9 summarizes the results of the overall quality grading. Conventional structural MRI and Combination biomarker types met the “High” grade criteria. DTI biomarker type met the “Moderate” grade criteria. TMS and fMRI met only the “Low” grade. The overall quality grade for the CT predictor was “Very low,” because there was only 1 study, which had a limited EQS score of eight.
Summary of Overall Evidence Quality of Each Biomarker Type.
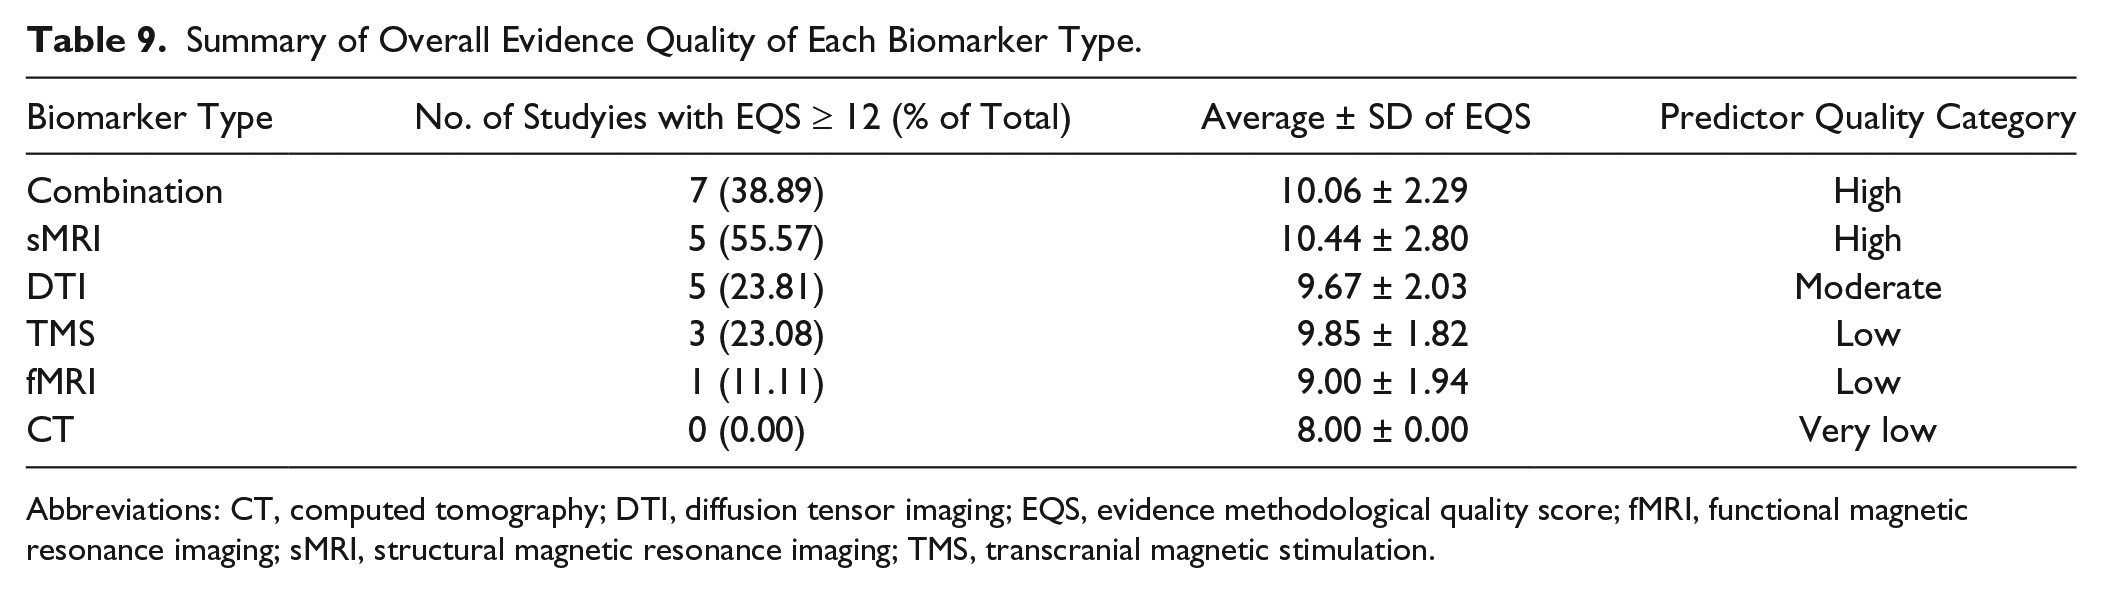
Abbreviations: CT, computed tomography; DTI, diffusion tensor imaging; EQS, evidence methodological quality score; fMRI, functional magnetic resonance imaging; sMRI, structural magnetic resonance imaging; TMS, transcranial magnetic stimulation.
Prediction Regression Models
Among 71 reviewed studies, 32 (~45%) conducted linear or nonlinear regression analyses to develop prediction regression models that included neurological biomarkers. Thirty studies (~42%) reported statistically significant neurological biomarkers as predictors in their regression models. Among these 30 studies, 22 (~31%) informed statistical details of their regression models.
From the 22 studies that reported details, 39 regression models were identified that used neurological biomarkers. Among these models, 20 (~50% of reported models) consisted of neurological biomarkers and clinical measures as statistically significant predictors (Table 10).
Summary of Regression Models. a
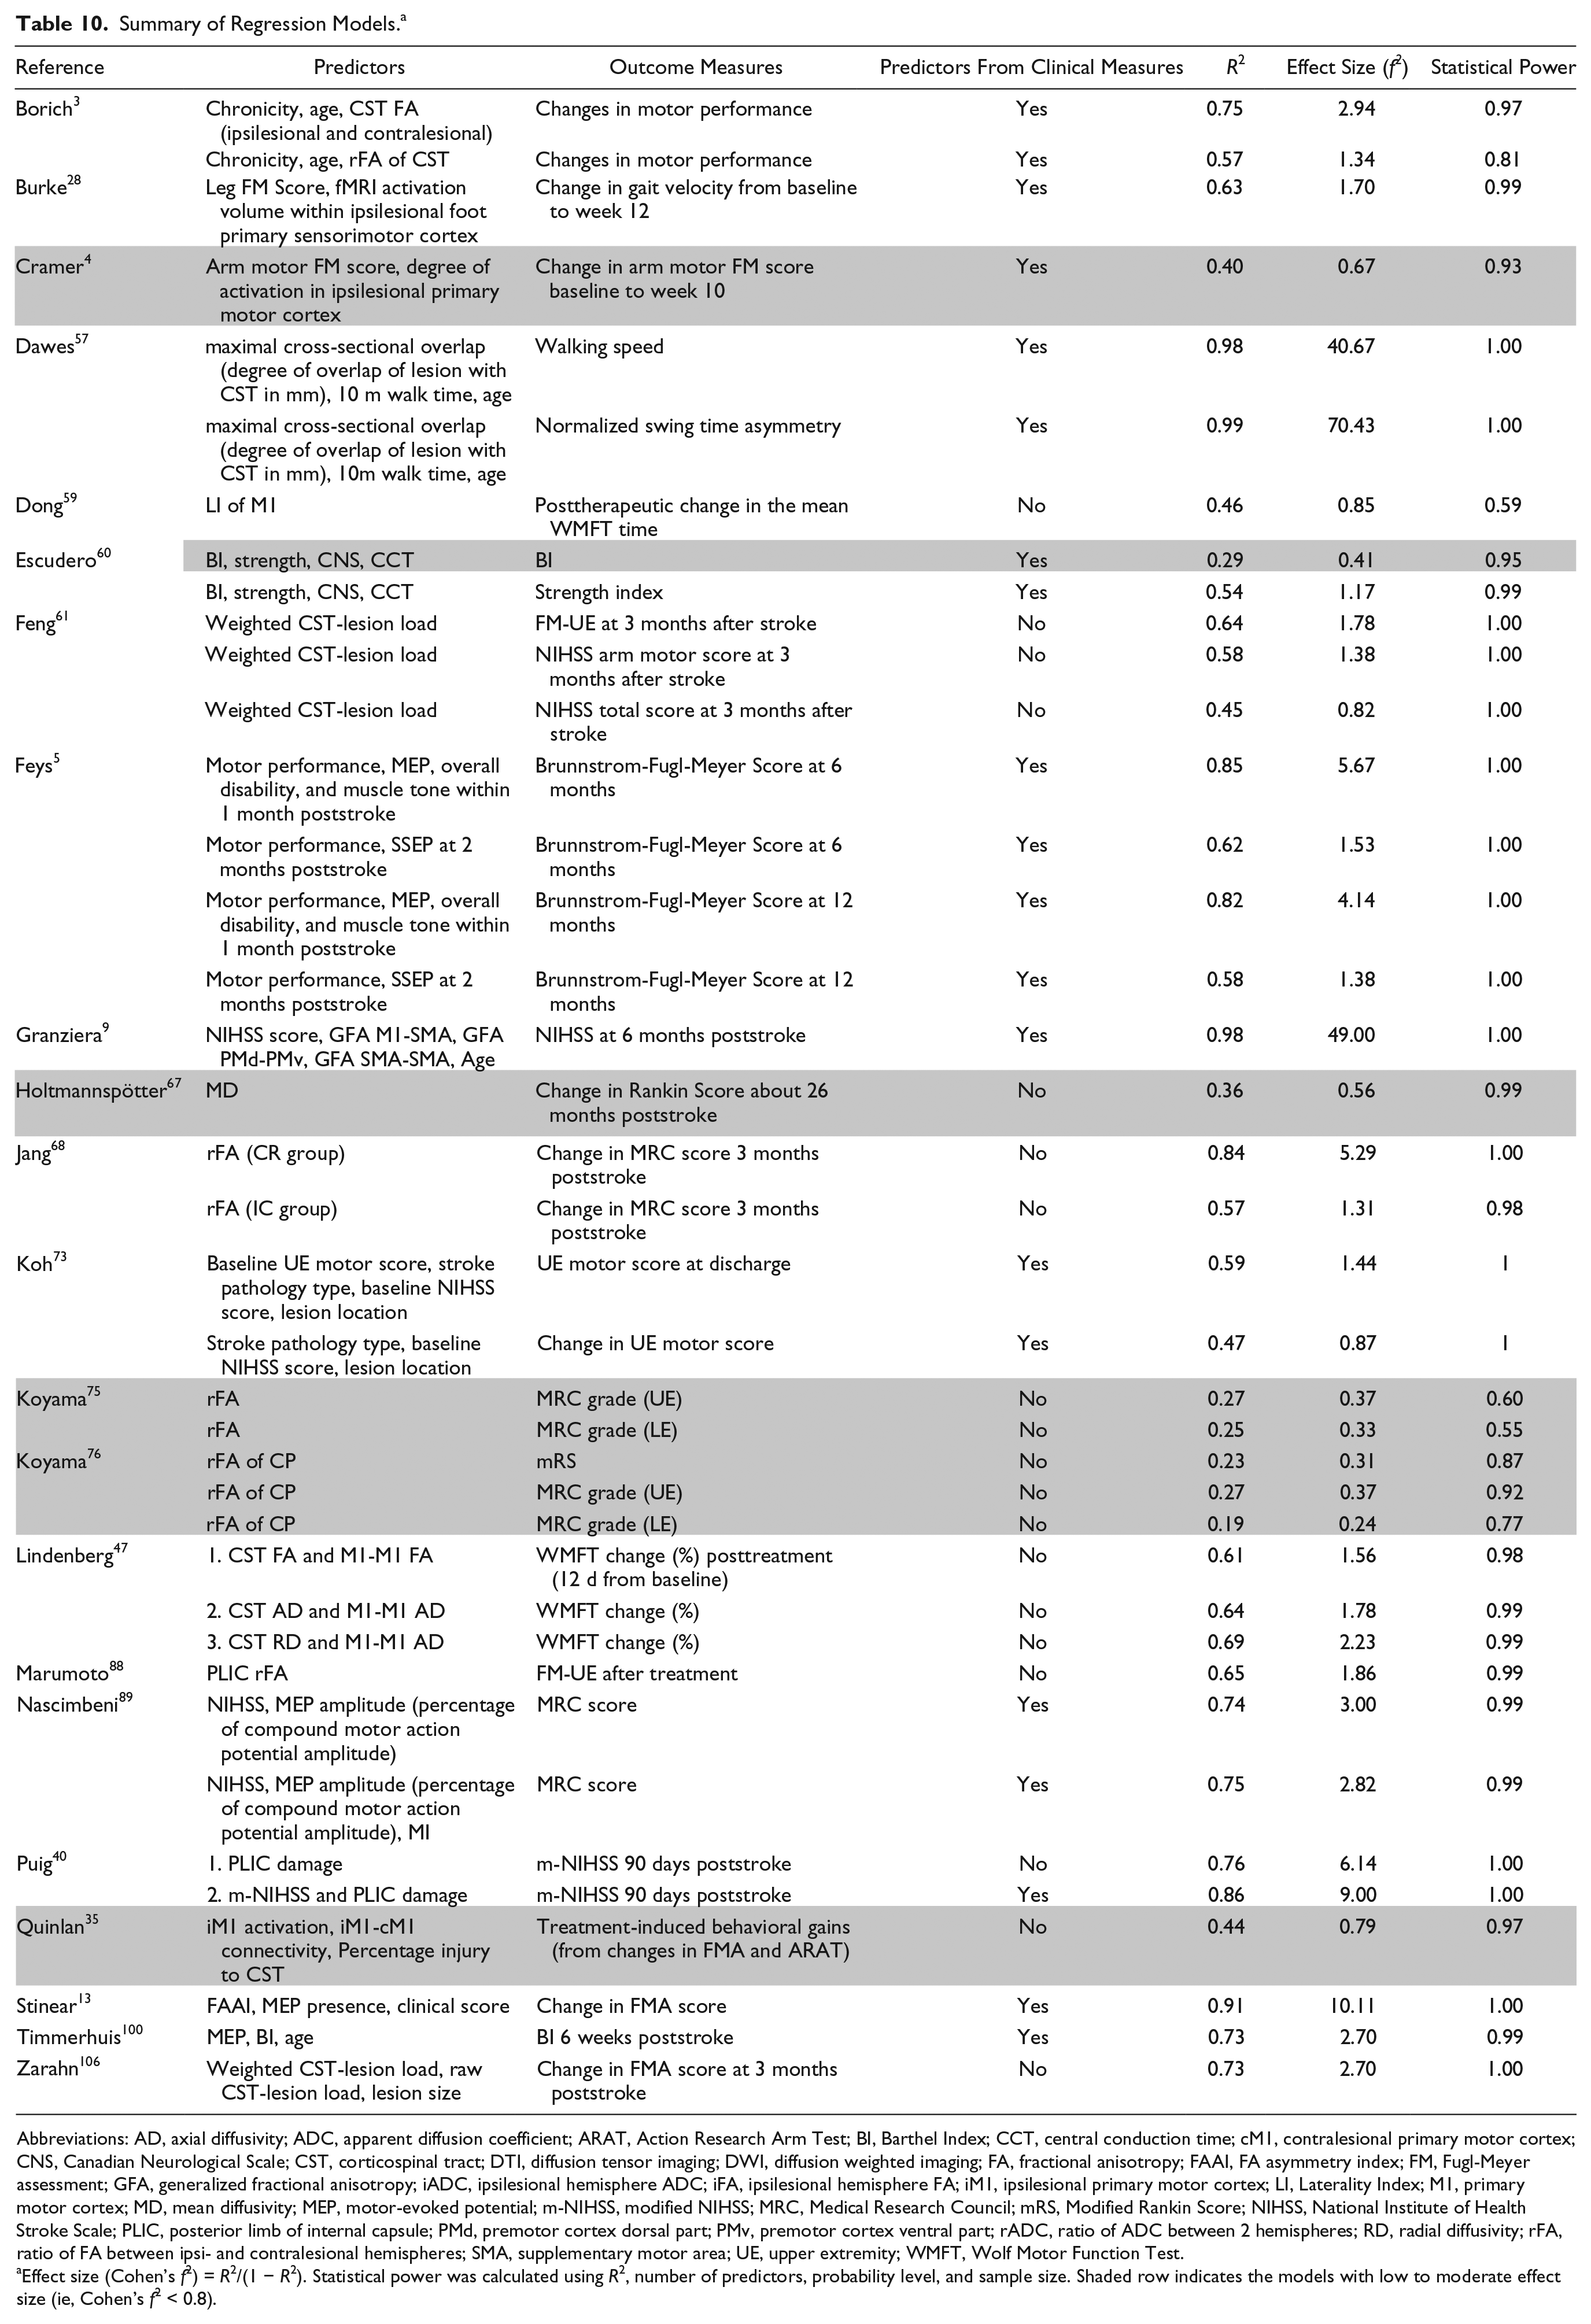
Abbreviations: AD, axial diffusivity; ADC, apparent diffusion coefficient; ARAT, Action Research Arm Test; BI, Barthel Index; CCT, central conduction time; cM1, contralesional primary motor cortex; CNS, Canadian Neurological Scale; CST, corticospinal tract; DTI, diffusion tensor imaging; DWI, diffusion weighted imaging; FA, fractional anisotropy; FAAI, FA asymmetry index; FM, Fugl-Meyer assessment; GFA, generalized fractional anisotropy; iADC, ipsilesional hemisphere ADC; iFA, ipsilesional hemisphere FA; iM1, ipsilesional primary motor cortex; LI, Laterality Index; M1, primary motor cortex; MD, mean diffusivity; MEP, motor-evoked potential; m-NIHSS, modified NIHSS; MRC, Medical Research Council; mRS, Modified Rankin Score; NIHSS, National Institute of Health Stroke Scale; PLIC, posterior limb of internal capsule; PMd, premotor cortex dorsal part; PMv, premotor cortex ventral part; rADC, ratio of ADC between 2 hemispheres; RD, radial diffusivity; rFA, ratio of FA between ipsi- and contralesional hemispheres; SMA, supplementary motor area; UE, upper extremity; WMFT, Wolf Motor Function Test.
Effect size (Cohen’s f2) = R2/(1 − R2). Statistical power was calculated using R2, number of predictors, probability level, and sample size. Shaded row indicates the models with low to moderate effect size (ie, Cohen’s f2 < 0.8).
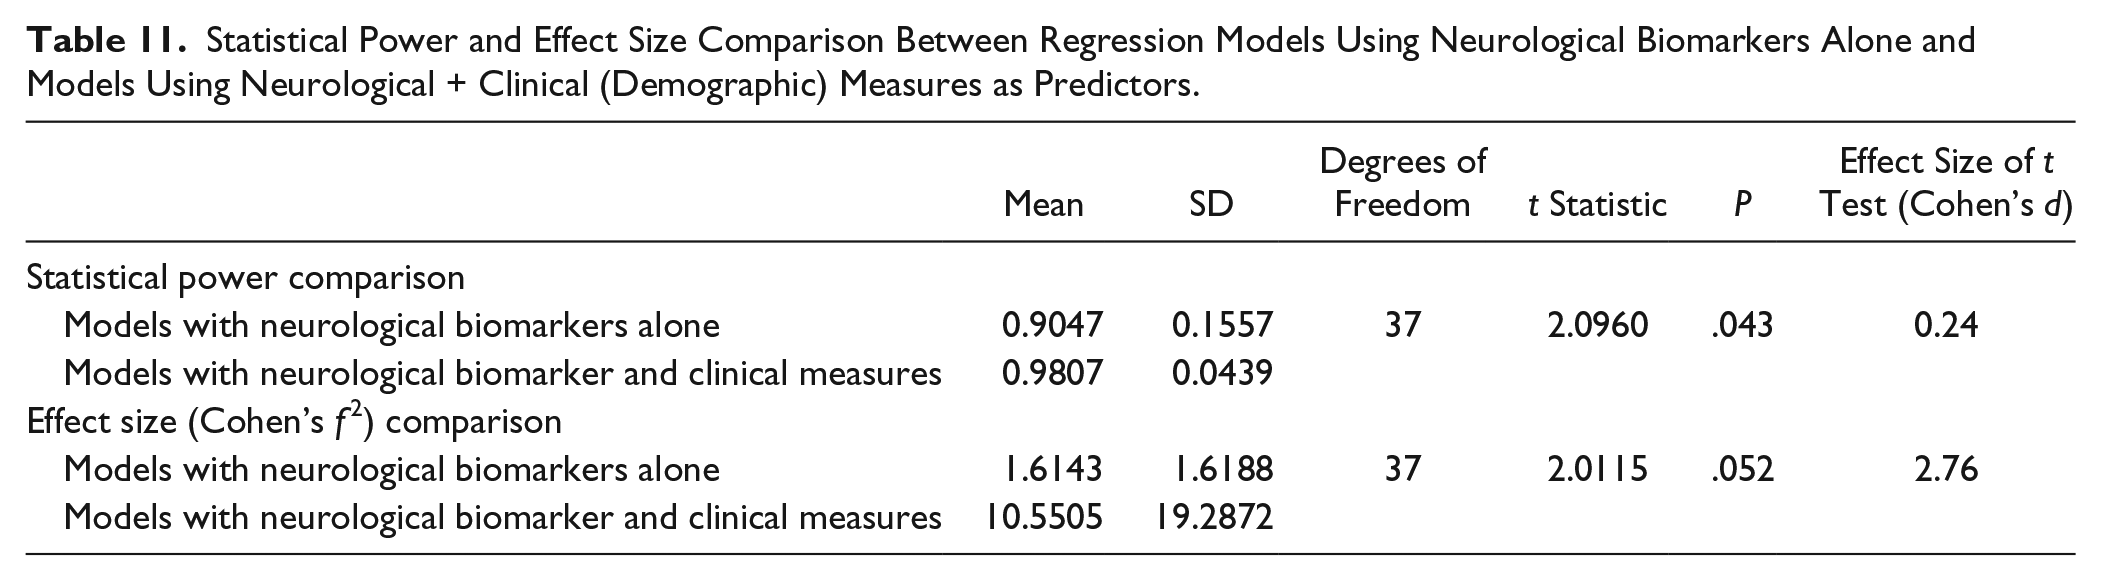
The mean statistical power and the mean effect size of the 39 prediction models was high (ie, 0.944 and 6.197, respectively). The statistical power and the effect size of multivariate models (ie, models using neurological biomarkers and clinical measures as predictors) were significantly greater than the power of the models using neurological biomarkers alone (Figures 6 and 7; Table 11). There were 4 studies that overestimated effect size (effect size is greater than 10), but removing these 4 studies did not influence the statistical results for comparing the effect sizes.
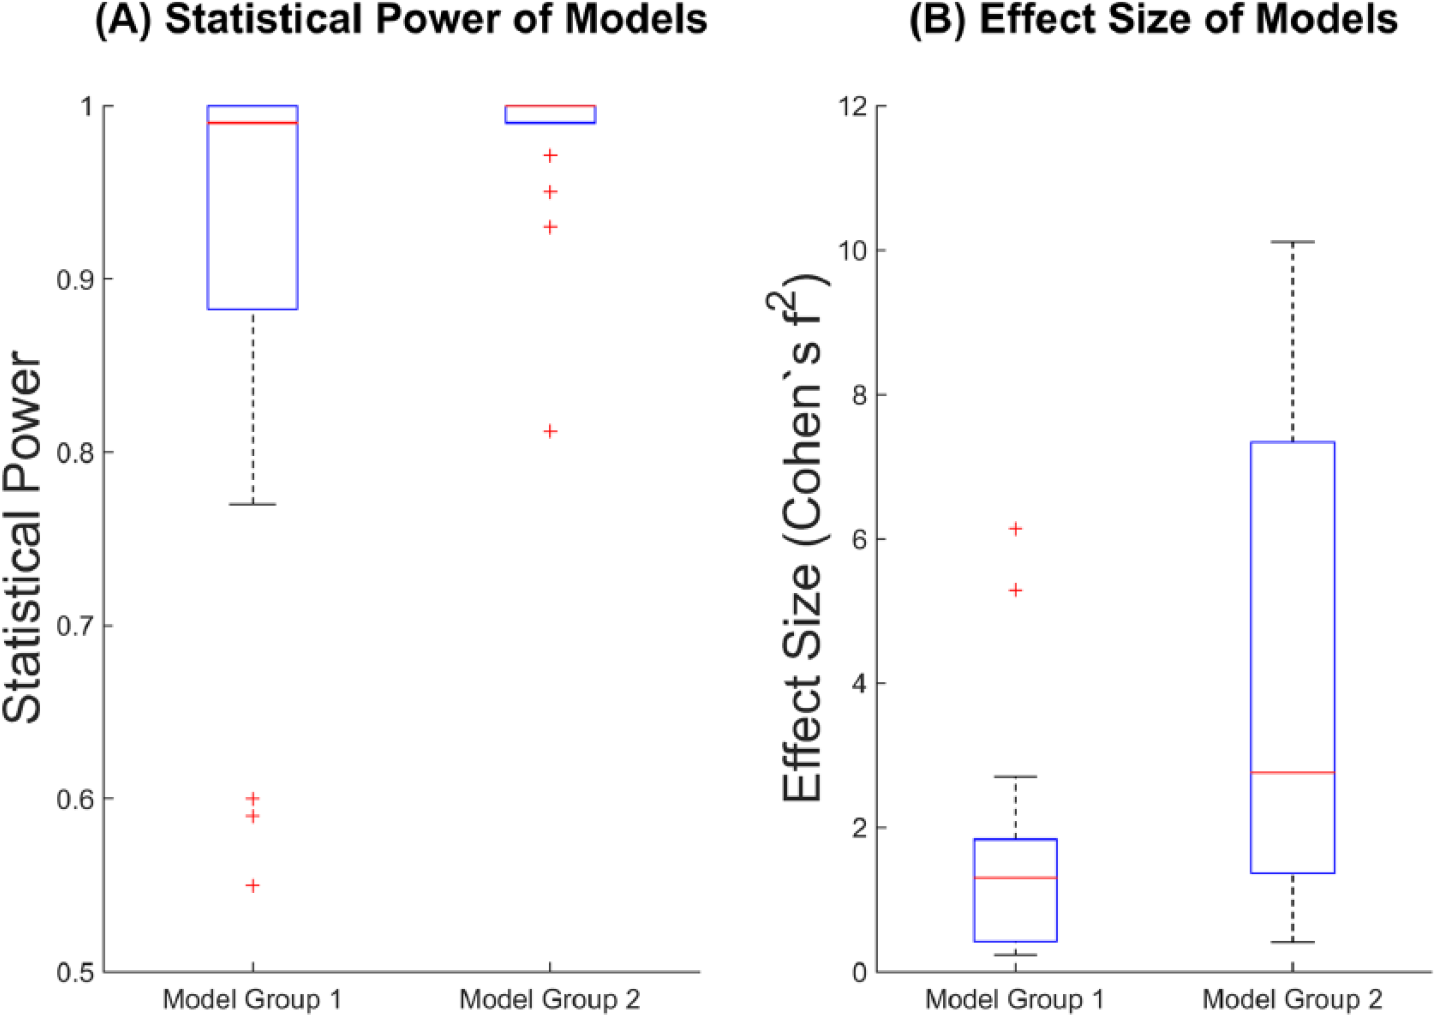
Comparison of statistical power and effect size between models using neurological biomarkers alone and models using neurological biomarkers and clinical measures. (A) Statistical power; (B) effect size. Model group 1 indicates the models using neurological biomarkers alone, and the model group 2 indicates the models using neurological biomarkers and clinical measures as predictors. The extremely high effect size for model group 2 (see Table 10) has been removed from Figure 6B for plotting purposes.
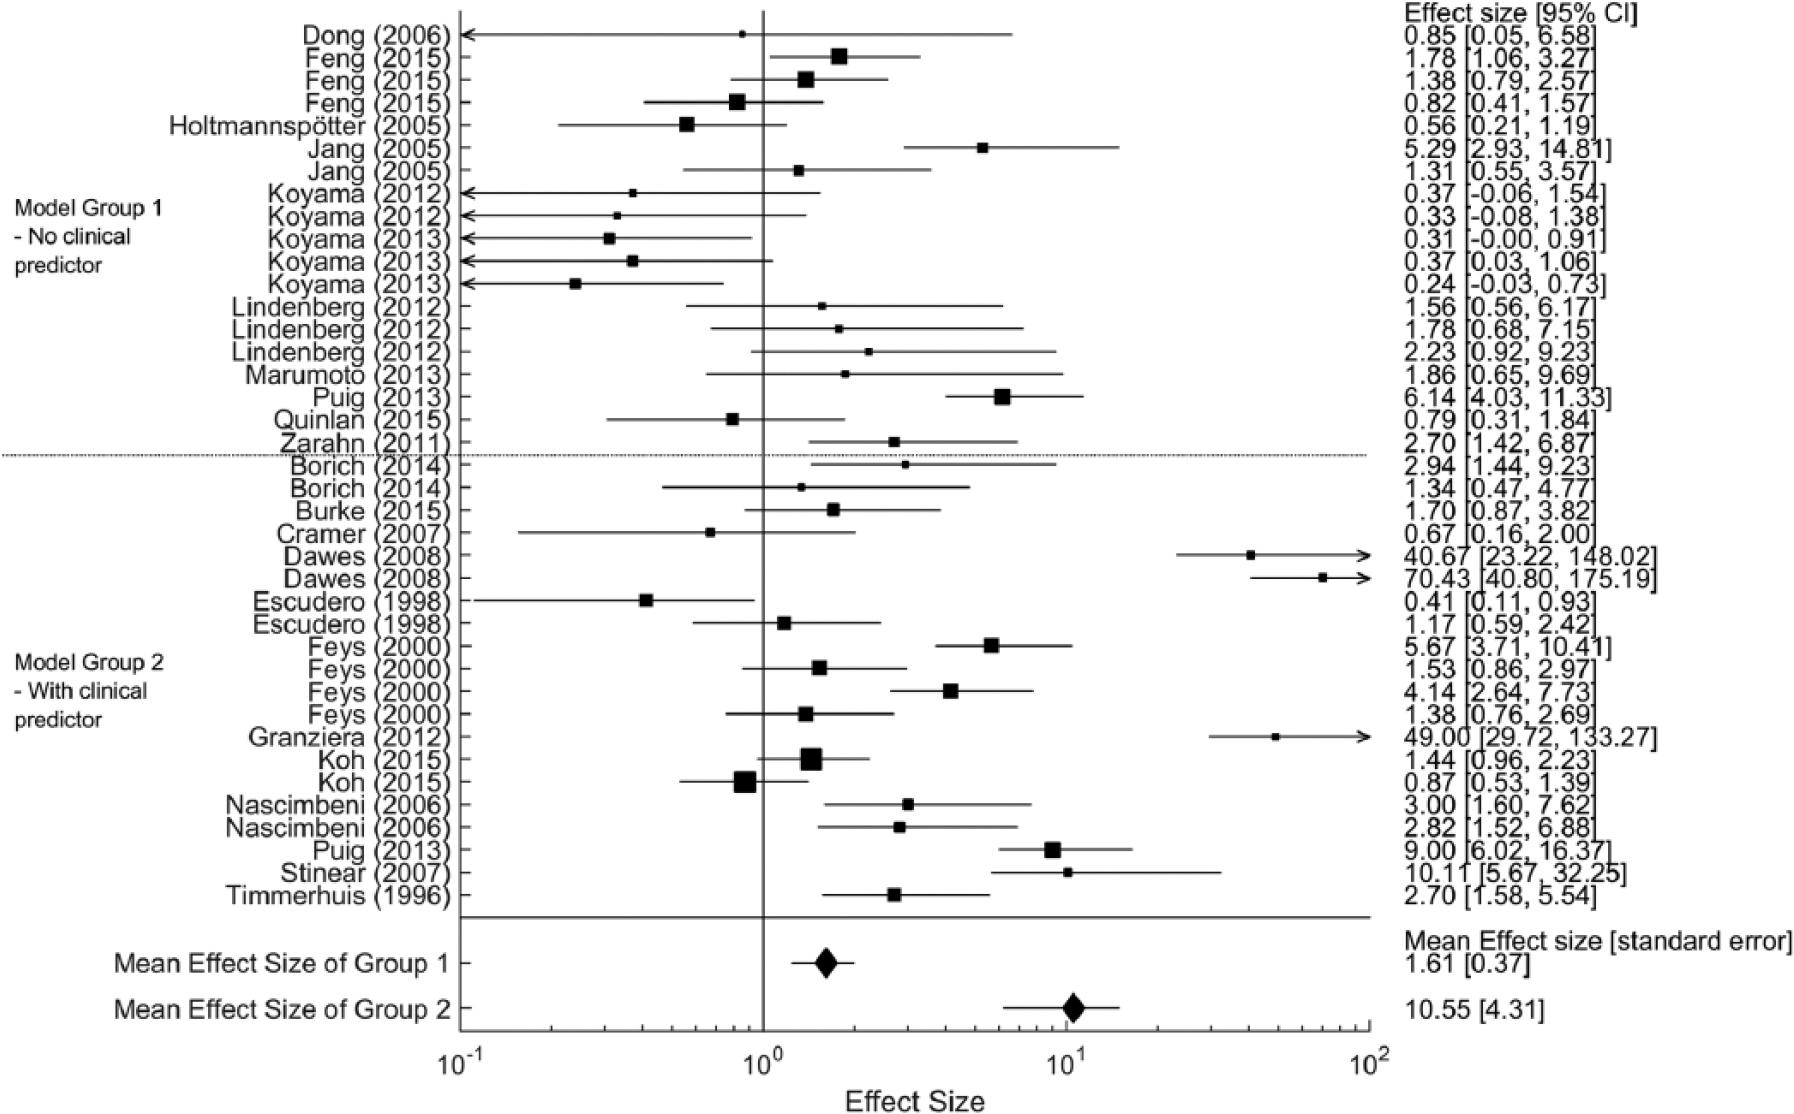
Forest plot for comparing effect sizes between different model groups. Each line represents 95% of confidence interval of effect size of each model. The size of black box represents sample size of each model. The diamonds indicate the mean of effect sizes for each model group. The effect size of models using neurological and clinical predictors were greater than that of models using neurological predictor alone.
Statistical Power and Effect Size Comparison Between Regression Models Using Neurological Biomarkers Alone and Models Using Neurological + Clinical (Demographic) Measures as Predictors.
Furthermore, 6 studies reported models with clinical motor behavioral predictors alone, in addition to the models incorporating behavioral and neurological predictors. Among these 6 studies, 5 reported that the prediction model with clinical behavioral predictors and neurological biomarkers explained more variance in the outcome variable than the model with clinical behavioral predictors alone (Table 12).
Prediction Models Using Only Clinical Behavioral Predictors.
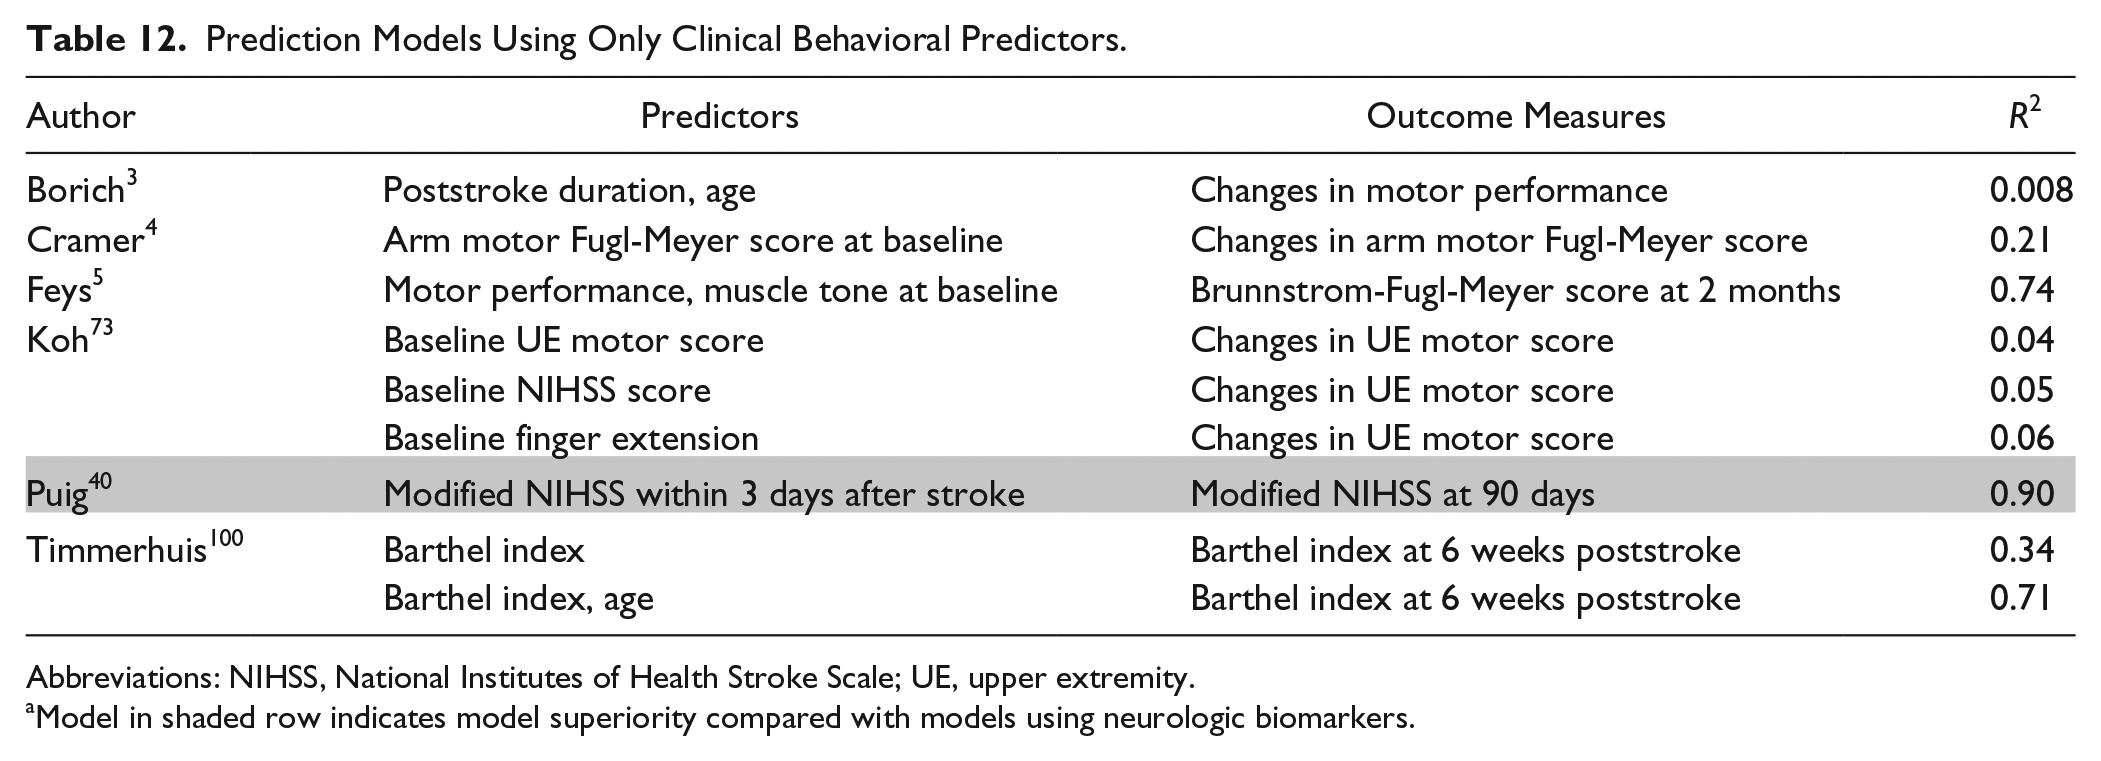
Abbreviations: NIHSS, National Institutes of Health Stroke Scale; UE, upper extremity.
Model in shaded row indicates model superiority compared with models using neurologic biomarkers.
Discussion
To our knowledge, this is the first evidence-based review to have critically and systematically evaluated the extant literature related to neurological biomarkers to determine the best predictor variables for motor recovery after stroke.
Evidence Methodological Quality
Numerous methodologically robust clinical studies provide evidence that structural biomarkers or a combination of different neurological biomarkers including DTI are useful to predict motor recovery after stroke. Several methodological weaknesses were found in studies using fMRI or TMS biomarkers, which included small sample size, a lack of blinded evaluation of outcome measures, no control for multicollinearity, or no control for additional treatment effects.
Furthermore, most studies (~90%) provided no cross-validation of the predictive models and no discussion of the minimal clinically important differences (MCID). A cross-validation of prediction models on an independent group of participants should be conducted to verify the validity and accuracy of prediction models. 15 Therefore, the lack of cross-validation of the model would be the biggest limitation of the current literature. In recent studies, a number of statistical methods for model validation have been suggested, such as leave-one-out cross-validation or k-fold cross-validation.21,22 Use of these statistical cross-validation methods is likely to improve the accuracy estimation of the prediction model. 21 MCID is considered to be an important factor, particularly for interpretation of the relevance of observed changes in clinical endpoints. 23 Consideration of MCID for neurological biomarkers and clinical motor endpoints will likely improve the clinical usability of the predictive models for motor recovery.
Overall Evidence Quality
Only 2 types of biomarkers (ie, conventional sMRI biomarker type and combination type) were graded as high in overall evidence quality. Therefore, it is likely that we have sufficient evidence to utilize these 2 types of neurological biomarkers for development of prediction model.
Although DTI-derived biomarkers are the most frequently used in reviewed studies, the evidence methodological quality of those studies was insufficient. DTI is a promising noninvasive neuroimaging tool that captures orientation and microstructural characteristics of white matter in the human brain. 24 The popularity of DTI among stroke rehabilitation researchers is likely the ease with which one can quantify the structural characteristics of specific pathways affected by the stroke. 25 Therefore, future DTI studies that employ higher methodological quality are likely to have an important impact on our confidence in the prediction model(s) derived from them.
TMS measures were the second most prevalent biomarker (ie, 13 of 71 studies). However, only 3 of the 12 TMS studies had high methodological quality. The low prevalence of high-quality prognostic studies in this category resulted in a “low” overall evidence quality grade.
There was also a low prevalence of high-quality prognostic studies using fMRI. Specifically, only 1 fMRI study had an EQS ≥12. Thus, more methodologically robust prognostic studies using TMS or fMRI will be needed to raise our confidence in the estimate of the prediction model using these biomarkers.
Frequently Used Predictor Variables for Each Biomarker Type
In the following section, we will discuss the most frequently used predictor variables for each biomarker type. The details of predictor variables are described in the supplementary material.
DTI Biomarker Type
Ratio and asymmetry index of fractional anisotropy (FA) between ipsi- and contralesional corticospinal tracts (CSTs) were the most popular predictor variables in DTI studies among many DTI-derived variables in Table 13. FA of ipsilesional CST is associated with microstructural characteristics of white matter fibers.3,26 A lower FA value of the ipsilesional CST may indicate greater damage of the CST that can lead to more Wallerian degeneration of CST axons. 27 However, the FA value can be influenced by a number of other factors, such as white matter architecture. Therefore, we need to use the DTI-derived FA values as neurologic biomarkers of brain impairment with caution.
Summary of DTI-Derived Predictor Variables.
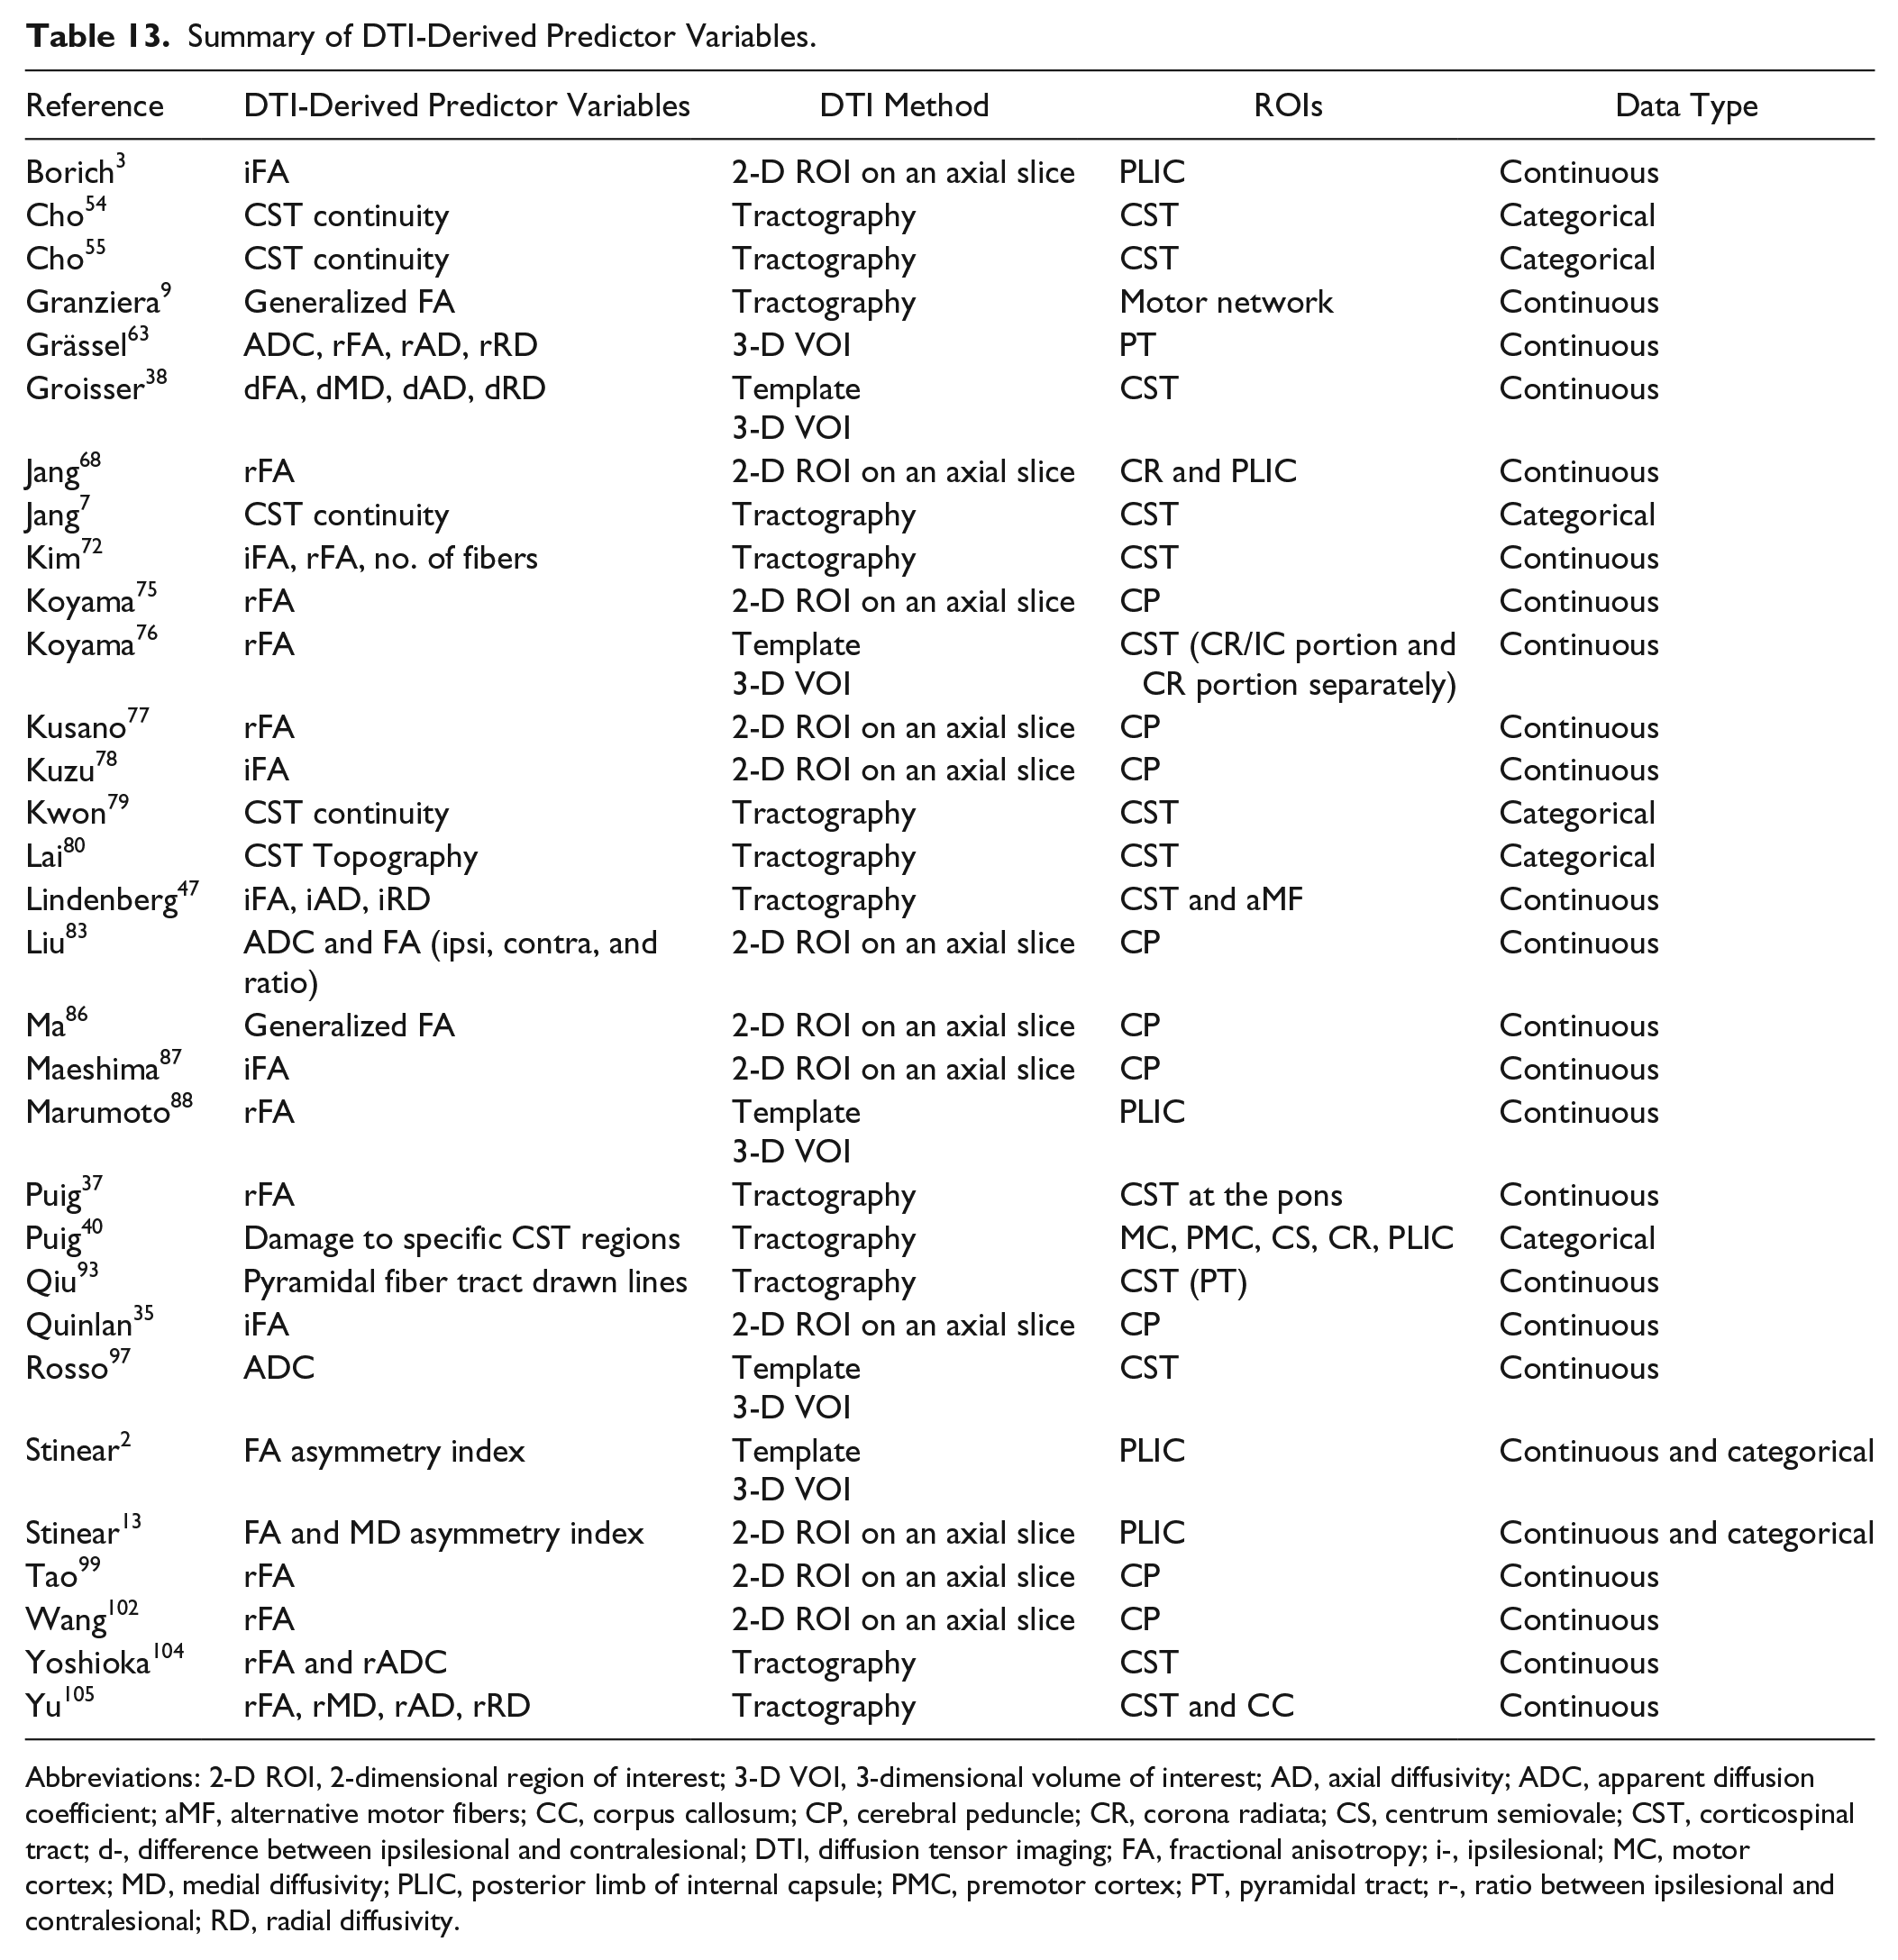
Abbreviations: 2-D ROI, 2-dimensional region of interest; 3-D VOI, 3-dimensional volume of interest; AD, axial diffusivity; ADC, apparent diffusion coefficient; aMF, alternative motor fibers; CC, corpus callosum; CP, cerebral peduncle; CR, corona radiata; CS, centrum semiovale; CST, corticospinal tract; d-, difference between ipsilesional and contralesional; DTI, diffusion tensor imaging; FA, fractional anisotropy; i-, ipsilesional; MC, motor cortex; MD, medial diffusivity; PLIC, posterior limb of internal capsule; PMC, premotor cortex; PT, pyramidal tract; r-, ratio between ipsilesional and contralesional; RD, radial diffusivity.
TMS Biomarker Type
A number of TMS studies have shown that the presence of an MEP when stimulating the upper or lower extremity muscle representation areas of ipsilesional primary motor cortex (M1) is a good indicator of a significant motor recovery. In most cases, a TMS response in a specific arm/hand or leg/foot muscle was recorded as binary data (ie, absent or present). 2 Although the presence of MEP of upper or lower extremity is a crucial predictor of motor recovery, this variable is insufficient as a predictor alone in the model. To improve the accuracy of the model, the TMS biomarker should be incorporated with other neurologic and/or clinical biomarkers. 5
sMRI Biomarker Type
Conventional sMRI studies usually used lesion location and volume information as predictors. Specifically, CST-lesion overlap volume (CST-lesion load) was calculated to quantify how much CST is damaged due to stroke. 28 In this review, we carefully used the term “CST structural integrity” separating it from “CST microstructural characteristics.” In previous literature, there was no distinction between “CST structural integrity” and “CST structural characteristics.” Investigators refer to DTI-derived metrics, such as FA and mean diffusivity (MD) of CST as “CST structural integrity,” but these DTI-derived metrics represent the water molecules’ diffusion directions and patterns along the axon.24,29 Thus, using “structural integrity” for these DTI-derived variables lacks precision. We refer to “CST structural integrity” as the amount of damage to CST, which represents the overlap volume between the stroke lesion and the CST.
fMRI Biomarker Type
In functional imaging studies, the laterality index of ipsilesional M1 and functional connectivity between bilateral M1s during ipsilateral motor task performance were the most common predictor variables. Furthermore, recent studies have shown that functional connectivity among sensorimotor regions after stroke in resting-state can be a significant biomarker of brain functional impairment.30-32
Combination Type
In studies using multiple neurological biomarkers, a combination of DTI and conventional sMRI biomarkers was the most common case. Further, a combination of DTI and TMS biomarkers was the next most frequently used. All combinations of biomarkers from included studies are listed in Table 14.
Summary of Combinations of Neurological Biomarkers.
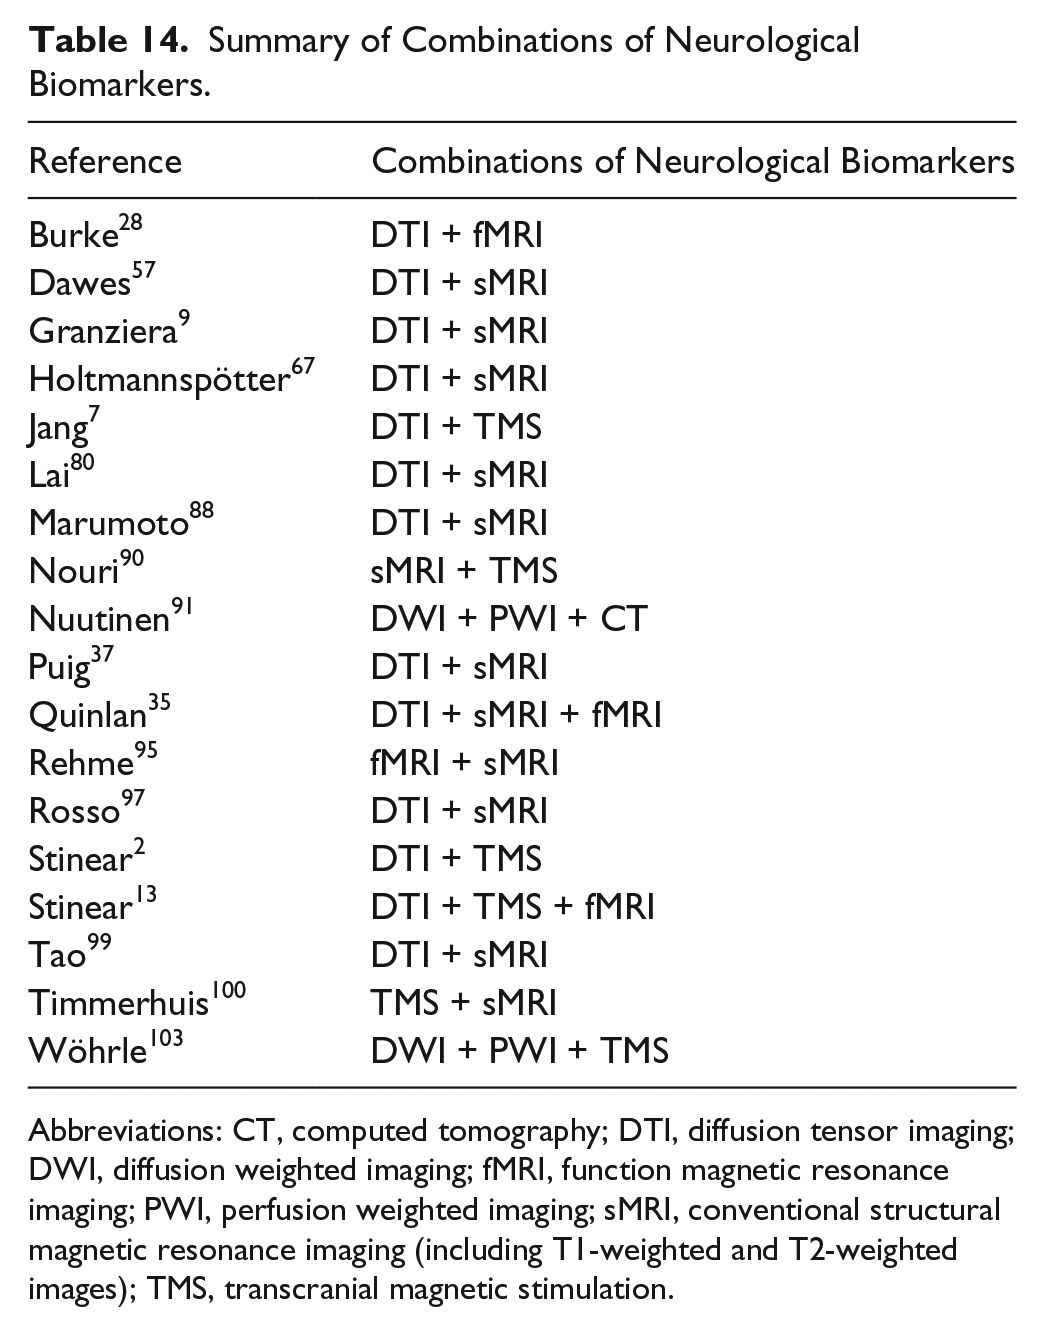
Abbreviations: CT, computed tomography; DTI, diffusion tensor imaging; DWI, diffusion weighted imaging; fMRI, function magnetic resonance imaging; PWI, perfusion weighted imaging; sMRI, conventional structural magnetic resonance imaging (including T1-weighted and T2-weighted images); TMS, transcranial magnetic stimulation.
Dependent Variables (Clinical Endpoints) of Prediction Models
The most commonly employed clinical outcomes were the Rankin Scale (RS or modified RS), NIH Stroke Scale (or modified NIHSS) motor portion, and Barthel Index (BI). Although these clinical outcome measures have been proven to be highly reliable and valid, 33 they lack specificity for motor impairment or performance in individuals poststroke. 34 Furthermore, these low-level categorical scales lack sensitivity and resolution for detecting motor recovery. 33
There were several other clinical motor outcome variables that were utilized in reviewed studies, such as the Fugl-Meyer Assessment (FMA), Wolf Motor Function Test (WMFT) time score, Motricity Index (MI), Action Research Arm Test (ARAT), Nine-Hole Peg Test (NHPT), Grip force assessment, and walking performance measures. These measures represent the “Body Structure” and/or “Activity” levels of the International Classification of Functioning (ICF) and are more specific to motor impairment/performance. 11 As such, these motor-specific measures are more sensitive and may be more appropriate than other more generic and broad-based clinical outcome measures when the goal is to capture changes in motor behavior.
Recent studies have utilized a composite measure statistically derived from multiple clinical outcome measures, as a single outcome measure cannot capture all dimensions of motor recovery. 33 Quinlan et al 35 utilized principal component analysis (PCA) of 2 different motor outcome scores to specify changes in motor behavior. Incorporating several different motor outcome measures will improve the accuracy of model estimation by reducing the measurement errors in dependent variables. Although, using these data reduction methods, including PCA, is attractive from a statistical standpoint, the meaningfulness of the derived composite measure is not that transparent. Therefore, researchers should consider the pros and cons when composite measures of motor recovery are used as dependent variables of prediction models pertaining to changes in motor behavior.
Difference in Prediction Models Among the Acute, Subacute, and the Chronic Phases of Stroke
Most participants in the included studies were in the acute stroke phase rather than subacute or chronic phase (~56%). It has been suggested that prediction of motor recovery in the early phase of stroke may play an important role in tailoring neurorehabilitation therapies for each individual.36-38 The initial assessment of brain impairment within 1 week after stroke including lesion volume or location was the most common predictor of motor recovery in previous studies. This might be because of the predominance of retrospective prognostic studies using diagnostic structural MRI. Furthermore, TMS was also frequently used to predict motor recovery during the acute phase. Researchers have reported that the presence of an MEP for hand muscles on the affected side during the acute phase is a strong predictor of upper extremity motor recovery.2,13,39 DTI biomarkers were also frequently used as a predictor in the acute phase, but this is a controversial topic. There is evidence that DTI measures of CST cannot capture the structural impairment within 2 weeks after stroke. 40 This might be associated with the time course of Wallerian degeneration of white matter fibers after stroke. 27 Puig and colleagues 40 also showed that the FA ratio between ipsi- and contralesional CSTs acquired at admission and at day 3 after stroke is not a significant predictor of motor recovery, while these metrics acquired at day 30 is a strong predictor of motor recovery at 3 months. Furthermore, DTI biomarkers were predominantly used for the prediction model in the subacute phase. This suggests that a DTI measure of sensorimotor pathways taken during the subacute phase would be a viable predictor for motor recovery, while those captured during the acute phase would not.
Prediction of motor recovery at the chronic stroke phase may be much more complex. Individuals at the chronic stage may be near to their motor recovery potential,41,42 and there are likely a number of additional secondary factors that can influence motor recovery, including psychosocial factors, 43 biomechanical factors, 44 motor learning, 45 and changes in brain structural and/or functional connectivity. 46 As such, it makes sense that prediction of motor recovery during this later phase should include multiple neurologic and clinical biomarkers to account for these additional secondary factors. A number of studies of individuals in the chronic stage after stroke have developed prediction models for motor improvement using neurological biomarkers. 47 Prediction models for motor recovery at the chronic stage are focused on whether the individual can benefit from specific treatments, such as transcranial direct current stimulation (t-DCS), 48 constraint-induced movement therapy (CIMT), 49 or behavioral neurorehabilitation therapies including task-specific motor practice. 13 However, we lack high-quality prospective longitudinal clinical trials to develop a multimodal prediction model for motor recovery in the chronic phase. 50
Limitations
Our findings are limited by the prevalent use of broad-based clinical endpoints that lack sensitivity, specificity, and resolution for motor recovery, particularly that along the restitution-substitution continuum. 51
Furthermore, several methodological weaknesses limited the impact of studies using functional MRI, conventional structural MRI, or TMS biomarkers. The reader is cautioned, however, that the low prevalence of methodologically robust prognostic studies that used these biomarkers as opposed to the more prevalent ones may have skewed our results.
Another limitation is that the evidence methodological evaluation tool used here is likely outdated and in need of revision. As the evidence evaluation tool was developed in 1990 when the imaging technology was in its infancy, several criteria may be inappropriate for recent developments in neuroimaging/neurophysiologic methods. Furthermore, although a number of items are critical to determining methodological quality of the evidence, all items carry the same weight. We attempted to minimize this limitation by redefining the criteria for several items; however, this is likely not a complete fix. The development of newer methodological quality evaluation tools would likely improve the systematic review process in this area.
Future Research
To improve methodological quality, we recommend that future studies: (a) perform cross-validation of the model, (b) consider the MCID of motor recovery outcome measures, and (c) recruit a large enough sample to provide sufficient statistical power. Furthermore, future studies that employ more sensitive and specific clinical endpoints coupled with valid neurological biomarkers are more likely to advance our understanding of the motor recovery process after stroke. Such an approach may lead to the development of more accurate prediction models than that achieved with the more traditional broad-based clinical endpoints that have dominated the literature, thus far.
Conclusion
Heterogeneity of poststroke brain pathology and motor impairment is a considerable challenge for the development of accurate prediction models. Accurate prediction of recovery is critical for determining the best neurorehabilitation protocol that will promote motor recovery and maximize meaningful outcomes. This focused systematic review found that conventional structural MRI and combination biomarker types possess the most methodologically robust evidence to be used for predicting motor recovery after stroke. Furthermore, it is not surprising that prediction models that used neurological biomarkers along with clinical measures (eg, Fugl-Meyer score, age, or chronicity) were more accurate than models that used neurological biomarkers alone.
Footnotes
Appendix
Declaration of Conflicting Interests
The authors declared no potential conflicts of interest with respect to the research, authorship, and/or publication of this article.
Funding
The authors received no financial support for the research, authorship, and/or publication of this article.