
Abstract
Objective. Somatosensory function is critical to normal motor control. After stroke, dysfunction of the sensory systems prevents normal motor function and degrades quality of life. Structural neuroplasticity underpinnings of sensory recovery after stroke are not fully understood. The objective of this study was to identify changes in bilateral cortical thickness (CT) that may drive recovery of sensory acuity. Methods. Chronic stroke survivors (n = 20) were treated with 12 weeks of rehabilitation. Measures were sensory acuity (monofilament), Fugl-Meyer upper limb and CT change. Permutation-based general linear regression modeling identified cortical regions in which change in CT was associated with change in sensory acuity. Results. For the ipsilesional hemisphere in response to treatment, CT increase was significantly associated with sensory improvement in the area encompassing the occipital pole, lateral occipital cortex (inferior and superior divisions), intracalcarine cortex, cuneal cortex, precuneus cortex, inferior temporal gyrus, occipital fusiform gyrus, supracalcarine cortex, and temporal occipital fusiform cortex. For the contralesional hemisphere, increased CT was associated with improved sensory acuity within the posterior parietal cortex that included supramarginal and angular gyri. Following upper limb therapy, monofilament test score changed from 45.0 ± 13.3 to 42.6 ± 12.9 mm (P = .063) and Fugl-Meyer score changed from 22.1 ± 7.8 to 32.3 ± 10.1 (P < .001). Conclusions. Rehabilitation in the chronic stage after stroke produced structural brain changes that were strongly associated with enhanced sensory acuity. Improved sensory perception was associated with increased CT in bilateral high-order association sensory cortices reflecting the complex nature of sensory function and recovery in response to rehabilitation.
Introduction
Rehabilitation can improve motor function even in the chronic phase after stroke1-3 and these improvements are associated with neuroplastic brain changes.4-6 Still, many stroke survivors do not achieve full recovery of normal movement and consequently continue to exhibit lifelong disability. Recovery of sensory function is necessary for normal motor function. 7 Sensory reeducation therapy can produce gains in sensory perception. 8 However, the neuroplastic mechanisms underlying recovery of sensory function after stroke are only partially understood.9-13 One method to study neuroplasticity is through structural brain changes. Motor-related structural changes have been observed in response to rehabilitation.14,15 However, structural plasticity in relation to sensory restoration after stroke has not been studied. Specifically, structural cortical changes have not been explored.
Evidence from healthy animal models supports that cortical thickness or cortical volume increases in response to training.16-18 Additionally, structural cortical plasticity has been reported during skill acquisition and learning in healthy human adults.19-21 These studies demonstrate that in the healthy state, cortical structure changes in response to training.
In terms of cortical structure/thickness changes in response to training after stroke, animal studies have provided some information regarding the nature of structural plasticity describing change that is specific to the trained networks, 18 prominent in survived structures 17 and greater with more complex treatment interventions. 17 In human stroke survivors, a few studies have reported on the nature of structural characteristics and motor therapy. For example, greater cortical volume at baseline can predict a superior motor outcome response to rehabilitation therapy22,23 and cortical thickness of the contralesional postcentral gyrus (primary sensory area) increased in response to constraint induced therapy. 24 Therefore, cortical thickness may be a marker of poststroke functional performance, but a quantitative relationship has yet to be established between cortical thickness change and improvement in motor function in response to treatment.
Even less is known about sensory function–related structural plasticity after stroke, though in a cross-sectional study Schaecter et al 25 provided an important finding of a relationship between cortical thickness and greater functional magnetic resonance imaging (fMRI) activation during tactile stimulation within a region that demonstrated adaptive functional plasticity in chronic stroke patients. However, it remains to identify the relationship of structural cortical change that could drive sensory improvement.
Given the critical role that sensory function plays in overall functional performance, the elucidation of sensory-related cortical structural changes would help to advance our understanding of the efficacy of existing and emerging treatments for sensory function after stroke. The purpose of the current study is to describe cortical thickness changes in response to rehabilitation after chronic stroke. It is hypothesized that in response to therapy, improved sensory function is proportionally related to changes in surviving sensory processing regions.
Materials and Methods
Subjects
This is a secondary analysis based on data from a prior study (n = 25) 6 of subjects with chronic upper limb sensorimotor arm deficits. Subjects with both improved and worsened sensory scores were included. Subjects were excluded in the current study if they had no sensory impairment at baseline (n = 5). The remaining 20 subjects were included in the current analysis. The inclusion criteria for the original cohort were as follows: first ever stroke onset ≥6months, ≥trace muscle contraction in major muscle groups, medically stable and without contraindication for MRI. The institutional review board approved the study protocol; an informed consent was obtained from each participant.
Intervention
Patients received upper limb rehabilitation 5 h/d, 5 d/wk for 12 weeks (described elsewhere 3 ). Sensory reeducation was incorporated into the motor learning rehabilitation protocol and included the following: visual feedback regarding the desired movement versus the abnormal movement; tactile cues for stimulation of skin and muscle sensory receptors; surface functional electrical stimulation for stimulation of joint and muscle sensory receptors synchronized with attempted volitional muscle contraction; passive joint movement with manual assistance by a therapist or robot; and stimulation of muscle and joint receptors through attempted active movement practice of upper limb functional tasks and their component parts.
Sensory and Motor Assessment
Subjects were tested with the tactile Semmes-Weinstein monofilaments over 9 hand areas: tips/pads of digits 1 to 5, radial/ulnar dorsal surface of the hand, and thenar- and hypothenar eminences of the palmar surface of the involved hand. For each tested area, the subject was blindfolded, and response was obtained to 5 monofilament sizes (2.83, 3.61, 4.31, 4.56, and 6.65 mm). The smallest detected size was recorded. The 9 hand areas were tested with a given monofilament in random order and sensitivity to that monofilament was determined at each area. Three trials were performed at each area; stimulus delivery lasted 1.5 seconds and the pressure on the monofilament was delivered to ensure the monofilament flexed into a “C” position. An accurate response was recorded if the patient could localize the monofilament stimulus (ie, “the pad of my index finger”). Based on accuracy of response, the next monofilament gauge was tested. To ensure that a patient was properly assigned a monofilament level for a given point, a confirmatory test for the assigned level was performed. If no monofilaments were perceived, the largest size was recorded. We summed the 9 values (minimum 25.4 = “no sensory deficit”; maximum 59.85 = “very diminished” or “no ability”). Motor performance was assessed with the upper limb Fugl-Meyer test (FM).26,27 The FM is a coordination test of 33 items (normal = 66).
MRI Acquisition
T1-weighted anatomical images were obtained pre- and posttreatment using a Siemens Symphony 1.5T scanner, acquired in the axial plane with 1.0 × 1.0 × 1.0 mm resolution (repetition time = 2160 ms; echo time = 3.45 ms; inversion time = 1100 ms; flip angle = 15°).
Cortical Thickness Calculation
Image preprocessing was performed using the longitudinal processing stream of the FreeSurfer image analysis suite (http://surfer.nmr.mgh.harvard.edu/) with the following steps: affine transformation to the MNI (Montreal Neurological Institute) atlas; removal of nonbrain tissue (skull stripping); volumetric segmentation of the cortical gray matter, white matter, and deep gray matter structures; tessellation of the gray/white matter boundary (ie, white matter surface), and pial surface with topology correction. 28 The longitudinal processing stream computed an unbiased within-subject template from the pre- and posttreatment images using robust, inverse consistent registration. 29 The within-subject template was used to initialize subsequent processing steps such as skull stripping, atlas registration, and parcellation for both pre- and posttreatment images, which, together, significantly increases reliability and statistical power. 29 After the pial/gray and white/gray surfaces were computed, all images were visually inspected to ensure the appropriateness and quality of reconstruction. Ipsilesional and contralesional hemispheres were analyzed separately. Cortical thickness was computed at each vertex on the white matter surface as the closest distance to the pial surface. Then, for each subject, the pre-/posttreatment change in cortical thickness at each vertex was computed. In order to perform group analysis, brain images of the surface and of the change in cortical thickness were transformed to a common left-right symmetric space, using a standard procedure based on Freesurfer’s fsaverage_sym atlas. 30 Both hemispheres were transformed into this symmetric template. 30 Transformation into the symmetric template minimizes left-right bias. 30 Since the cohort contained both left and right hemisphere lesions, the standard procedure of cross hemisphere registration to the symmetric template was performed for the subjects with a right hemisphere lesion, enabling analyses of the cohort within a common hemisphere space. Finally, in the group 2-dimensional surface space, each subject’s pre-/posttreatment change in cortical thickness was smoothed with a 7 mm full-width at half-maximum Gaussian kernel.
Statistical Analysis
Magnetic Resonance Imaging
The relationship between change in cortical thickness and sensory function was analyzed using nonparametric permutation-based general linear models (GLM) 31 using threshold-free cluster enhancement. 32 Similarly, we analyzed a relationship between changes in cortical thickness and changes in Fugl- Meyer score. At each vertex, a GLM is fit and the t-statistic of the independent variable of interest is computed. The t-statistic map is then converted to a threshold-free t-statistic map by weighting values depending on nearby vertices. This provides for the detection of both diffuse, low-amplitude signals and sharp, focal signals without defining a cluster-forming threshold. 32 The threshold-free t-statistic map values are converted to P values and R2 values and corrected for multiple comparisons using nonparametric permutation inference31,33 with 1000 permutations. 34 Significance is defined as a corrected P value less than .05. For the primary analysis at each vertex the GLM consisted of pre-post thickness change as the dependent variable and the pre-/posttreatment change in monofilament score as the independent variable. In secondary analysis, we included additional independent variables, as follows: age and pre-/posttreatment change in FM. Ipsilesional and contralesional hemispheres were analyzed separately. The clusters were further characterized using the Harvard-Oxford cortical structural atlas in the MNI152 template space. 35 For each anatomical region identified by the Harvard-Oxford atlas tool in FSL, we calculated volume (in mm3) and percent of the cluster within each region along with the MNI coordinates, model β coefficient, R2, and P value of the most significant vertex.
We performed ipsilesional cluster validation. Since cortical surface reconstruction may be inaccurate in the vicinity of lesions, additional steps were performed to validate clusters in the ipsilesional hemisphere. The initial ipsilesional group analysis was conducted as described above to identify potentially significant clusters. These clusters were then mapped from the group space back to each individual’s space, and visually inspected superimposed on their individual images and reconstructed cortical surfaces. If a given subject’s lesion affected the cortical surface in the vicinity of the cluster, then that subject was excluded from further analysis and statistical analysis was then repeated. Only the results from this repeated analysis are presented here. The ipsilesional cluster remained statistically significant after excluding two subjects with inadequate surface reconstruction in the cluster vicinity.
Stroke Lesion Overlay Map
Stroke lesions were traced on T1-weighted images for each subject. The T1 images for the 7 subjects with right hemisphere lesions were left-right reversed. All images were displayed within the MNI152 template in FSL.
Clinical Data
Pre-/posttreatment comparisons were conducted for the monofilament score and FM using the Wilcoxon signed rank test for nonparametric data. Spearman correlation was performed between change in monofilament score and FM to evaluate colinearity.
Results
Subject Characteristics
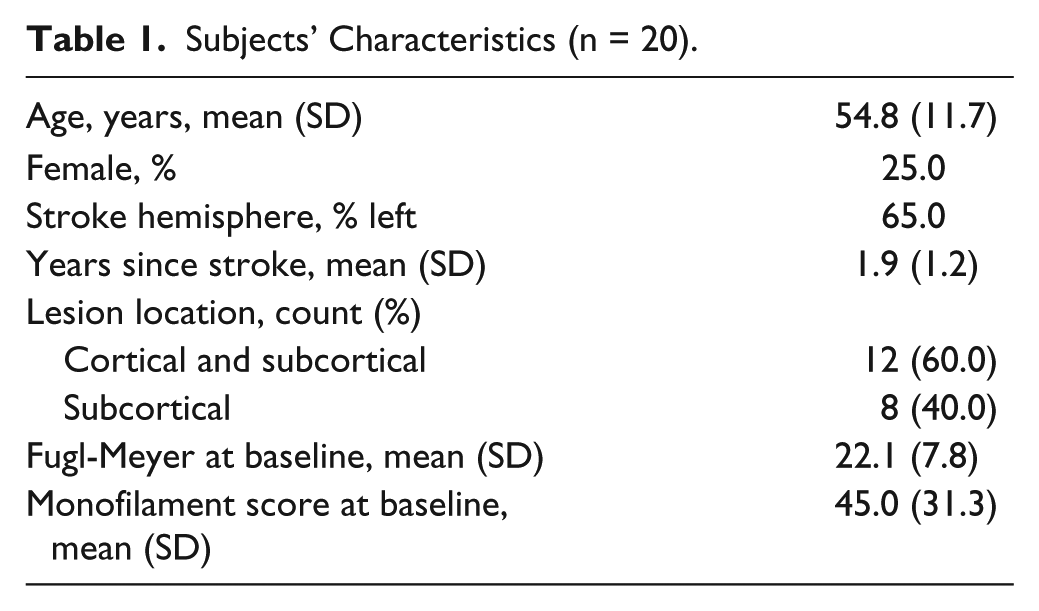
Information on subject characteristics is provided in Table 1. Figure 1 depicts stroke lesion distribution among the study subjects.
Subjects’ Characteristics (n = 20).
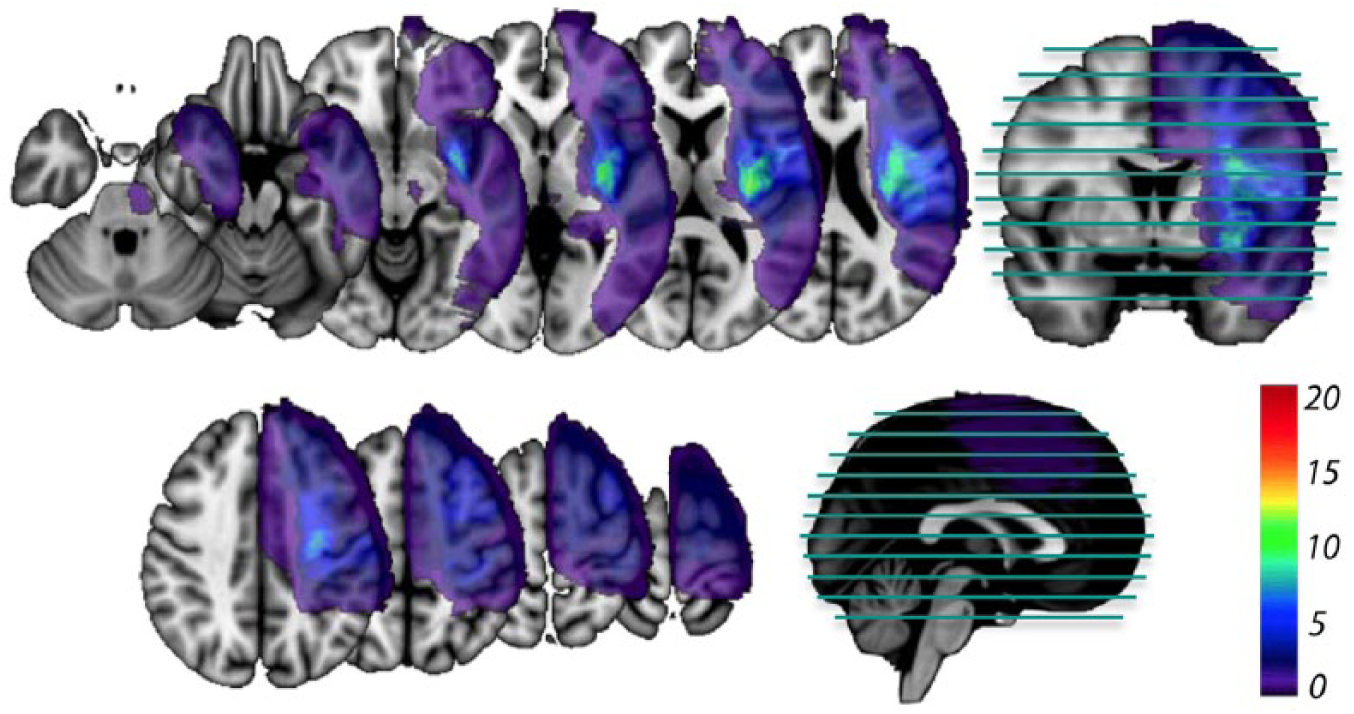
Stroke lesions overlay for the study subjects (n = 20). Color scale corresponds to the number of subjects with a stroke lesion involving a given area/voxel. The location of the axial slices is shown in the sagittal and coronal views.
Relationship Between Increased Cortical Thickness and Recovery of Sensory Tactile Perception
Ipsilesional Hemisphere
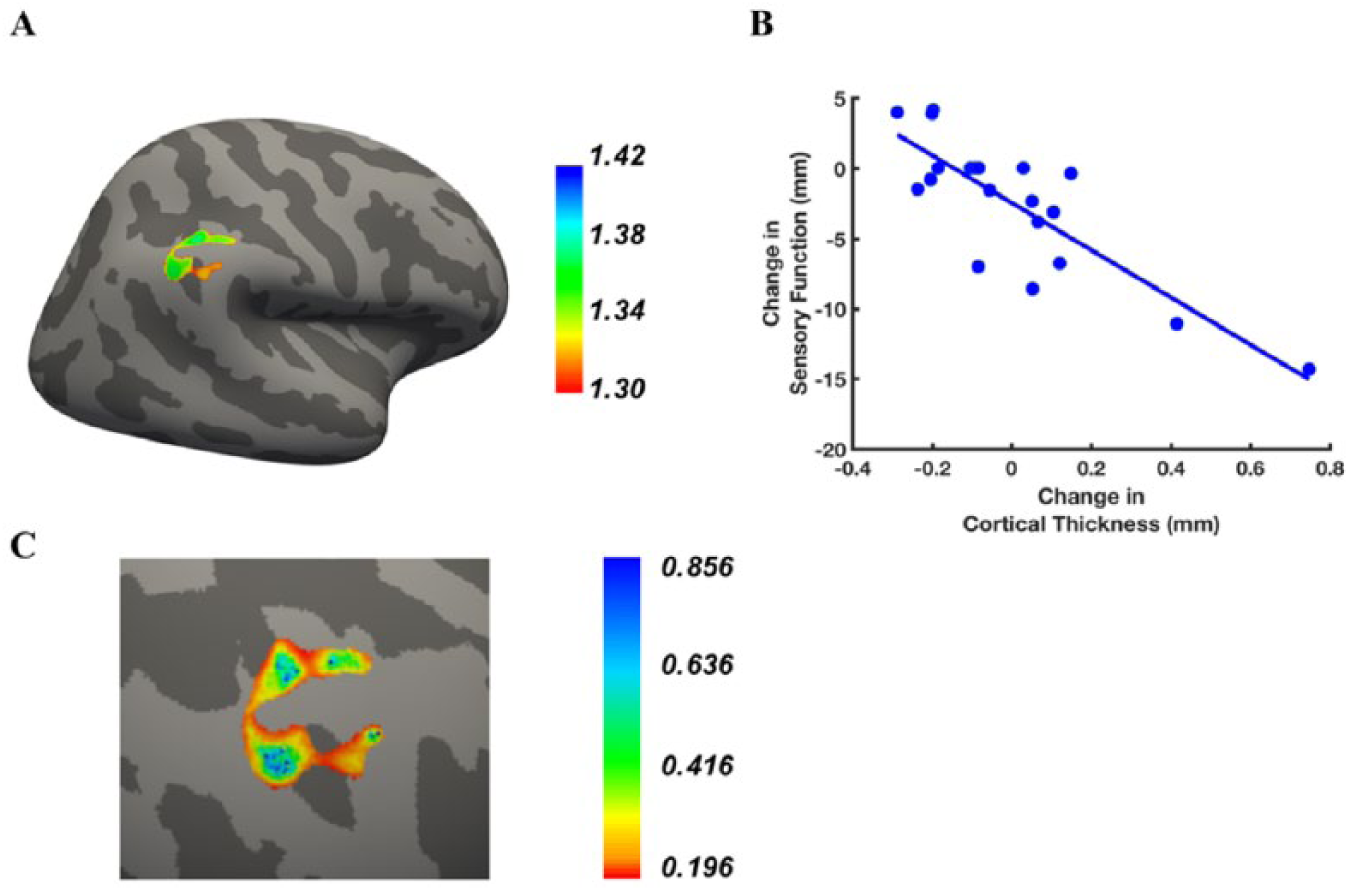
Figure 2 shows that for the ipsilesional hemisphere, there were areas within the occipital, parietal and temporal lobes that demonstrated a statistically significant relationship between the change in cortical thickness and change in sensory performance on the monofilament test. This statistically significant cluster encompassed the occipital pole, lateral occipital cortex (inferior and superior divisions), intracalcarine cortex, cuneal cortex, precuneus cortex, inferior temporal gyrus, occipital fusiform gyrus, supracalcarine cortex, and temporal occipital fusiform cortex (Figure 2A and B). Figure 2C (a scatterplot of subject data) illustrates the relationship between change in monofilament score and change in cortical thickness at the most significant vertex (ie, the lowest P value) in the cluster. Figure 2D depicts the regression model R2 values in the cluster.
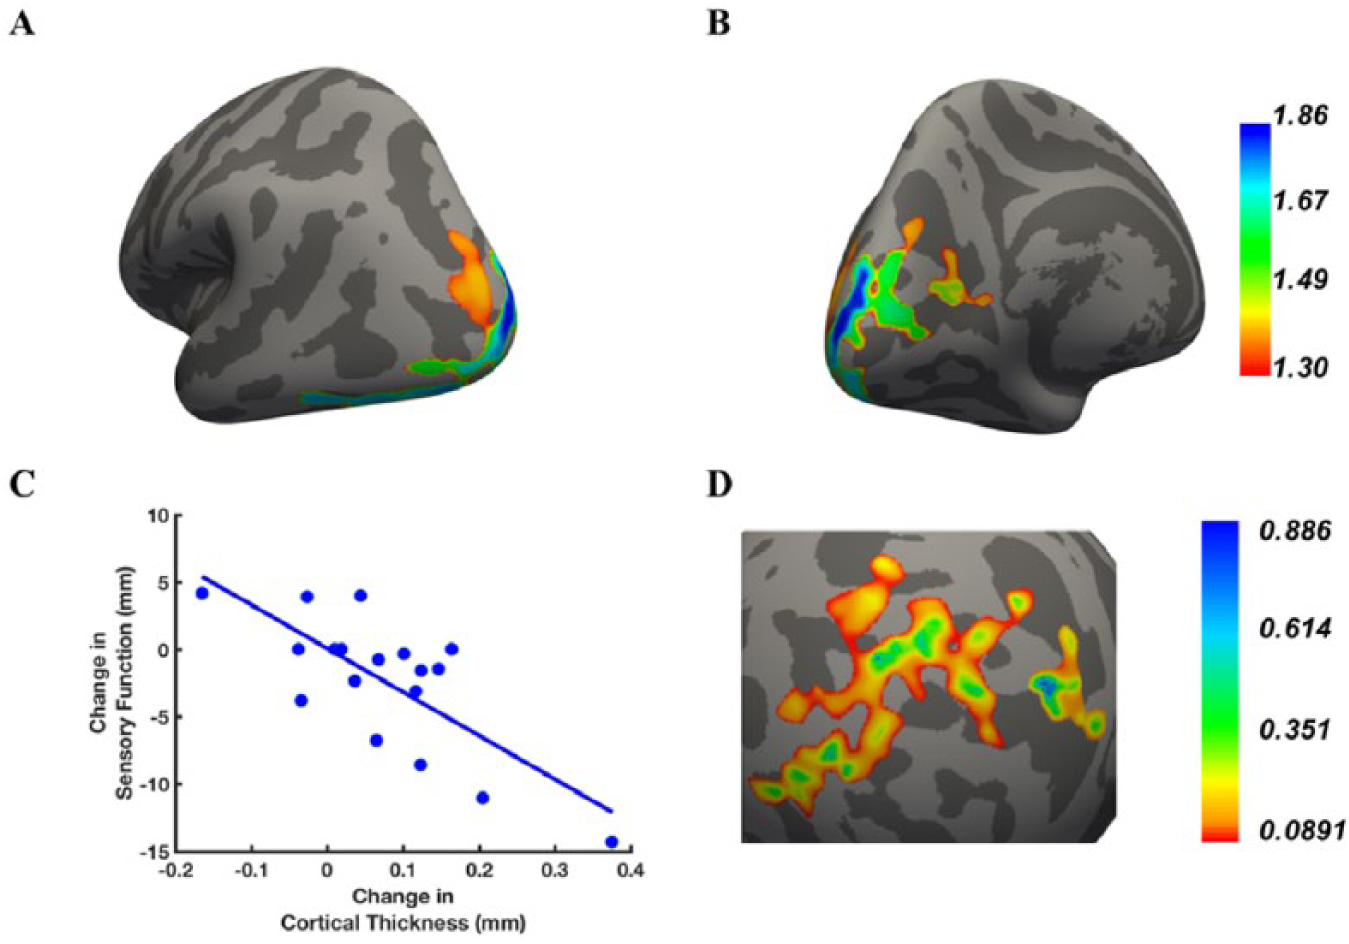
Ipsilesional cluster for which increased cortical thickness was associated with improved sensory function after treatment. Lateral-posterior (A) and medial-posterior (B) views of the area where a relationship was found between change in cortical thickness and change in monofilament score; Color bar: statistical significance level expressed in units of –log10(P) (eg, –log10(.05) = 1.3, P values ranging from .05 to .014). (C) Scatterplot of changes in monofilament score (ranging from 4 mm worsening to 14 mm improvement) and changes in cortical thickness for the peak vertex, that is, the vertex with the greatest significance (lowest P value). (D) Map of R2 values and color bar of the cluster projected on a spherical dilated cortical surface.
Table 2 lists the Harvard-Oxford atlas regions within the statistically significant cluster, their volumes and percentage of the whole cluster. Within each atlas region, the location of the most significant vertex is listed along with the regression model results (R2, β coefficients, and P values) at that vertex.
Description of the Cortical Clusters Where There Was a Statistically Significant Association Between Change in Cortical Thickness and Change in Sensory Function. a
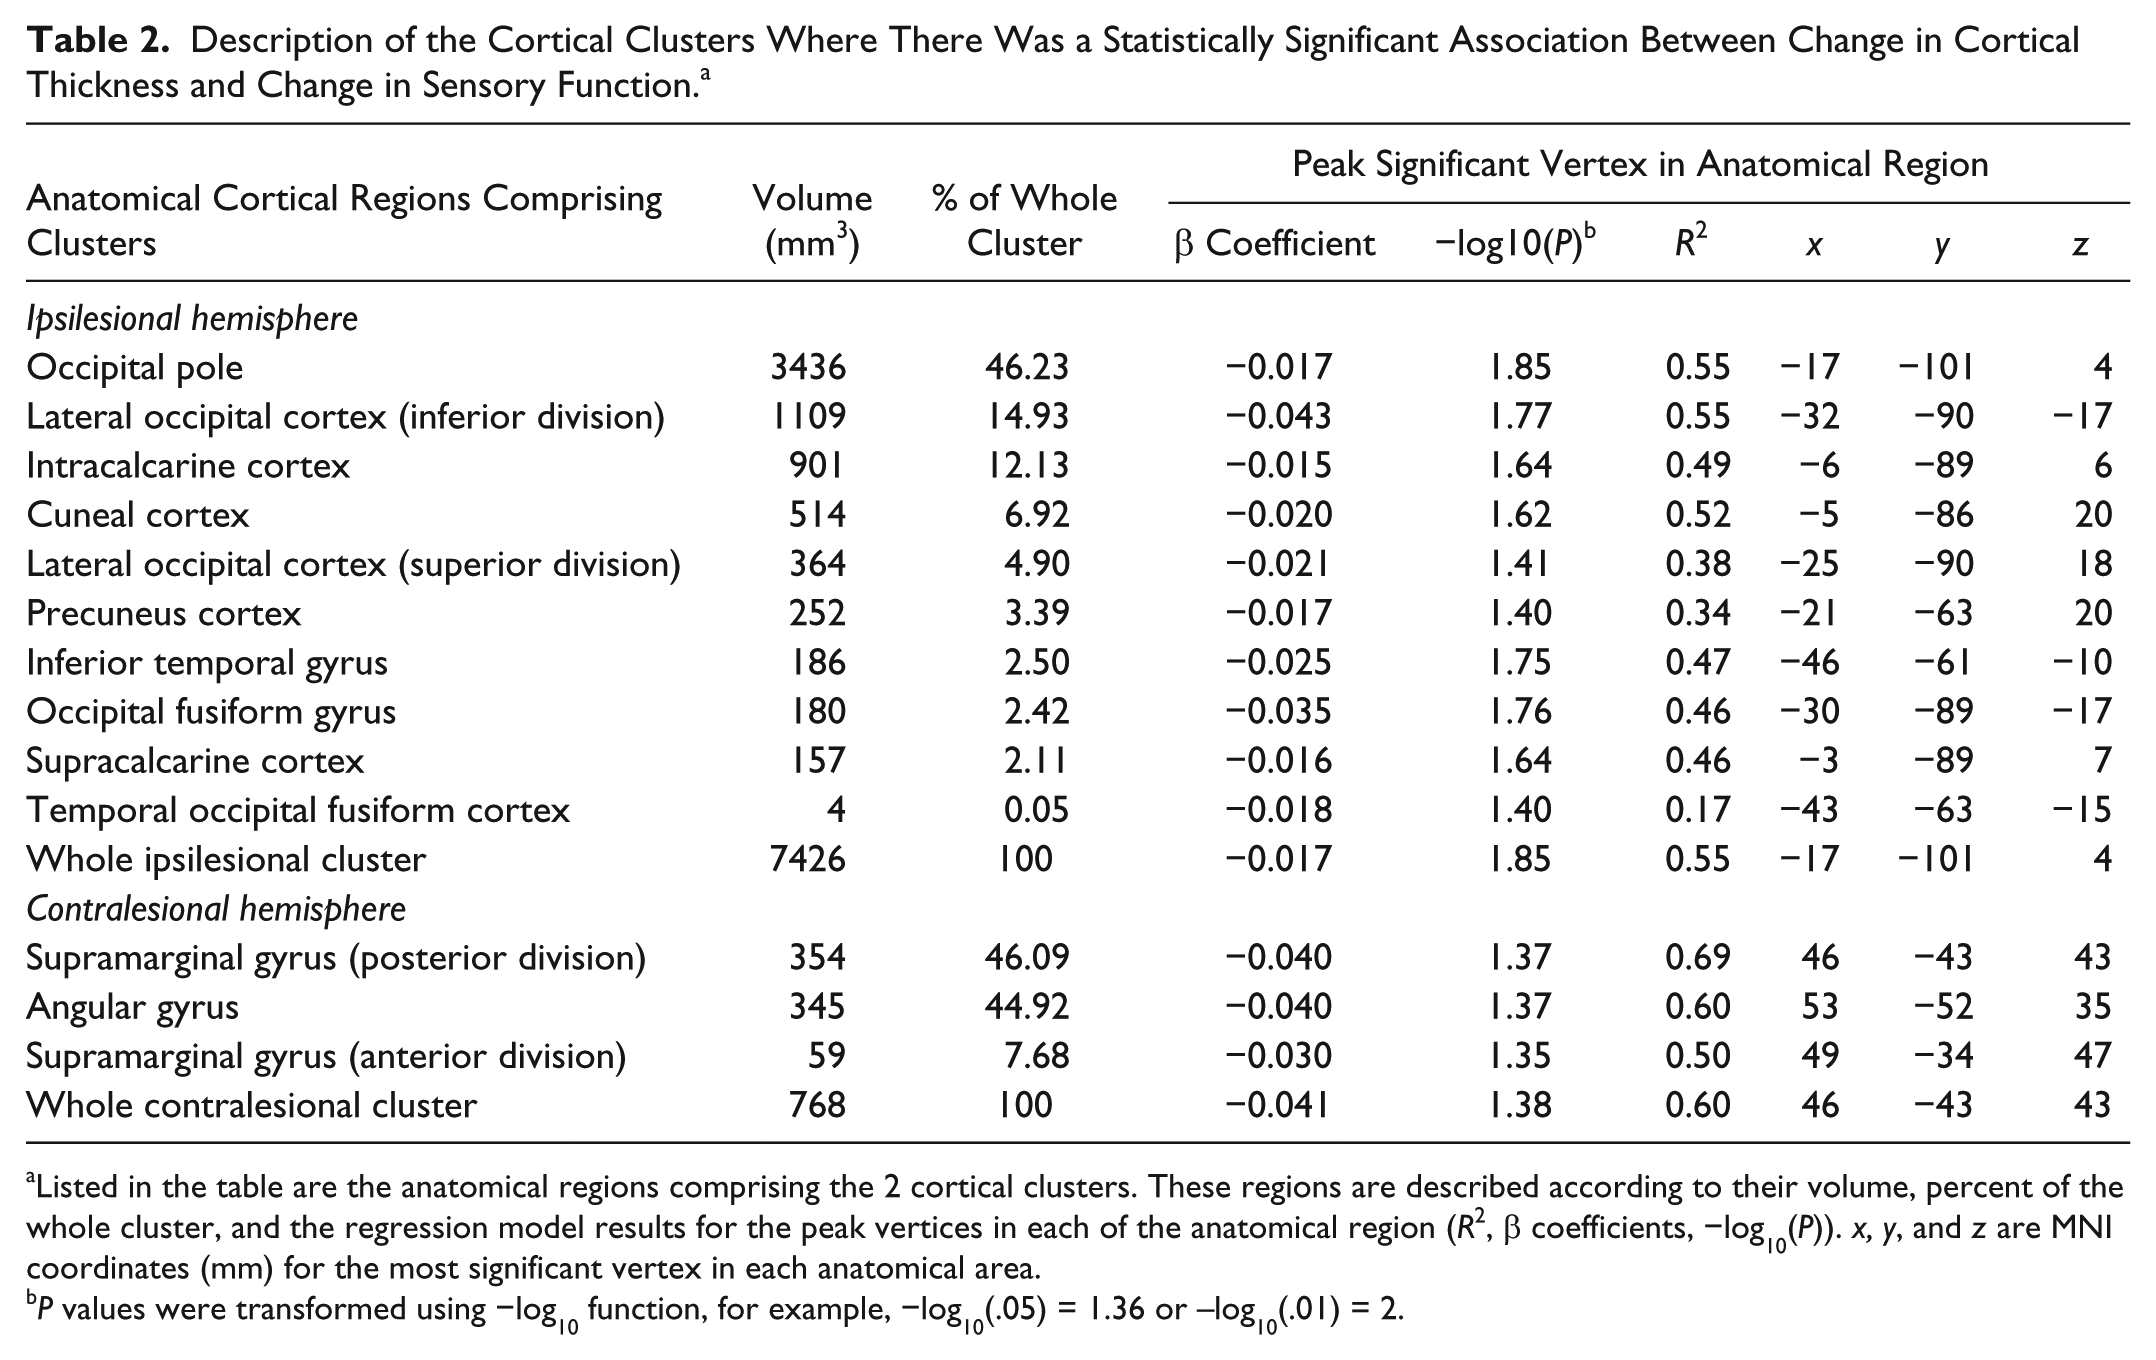
Listed in the table are the anatomical regions comprising the 2 cortical clusters. These regions are described according to their volume, percent of the whole cluster, and the regression model results for the peak vertices in each of the anatomical region (R2, β coefficients, −log10(P)). x, y, and z are MNI coordinates (mm) for the most significant vertex in each anatomical area.
P values were transformed using −log10 function, for example, −log10(.05) = 1.36 or –log10(.01) = 2.
A significant relationship between change in cortical thickness and change in monofilament score remained in the presence of the following covariates: age (Table 3, column ii), or age plus motor impairment change according to FM (Table 3, column iii). The individual predictors of change in monofilament score and FM were not correlated (ρ = 0.134; P = .5).
Ipsilesional Hemisphere Areas Where There Was an Association Between Change in Cortical Thickness and Impaired Sensory Function (i) Controlling for Either Age (ii) or Age and Motor Function Improvement (iii)
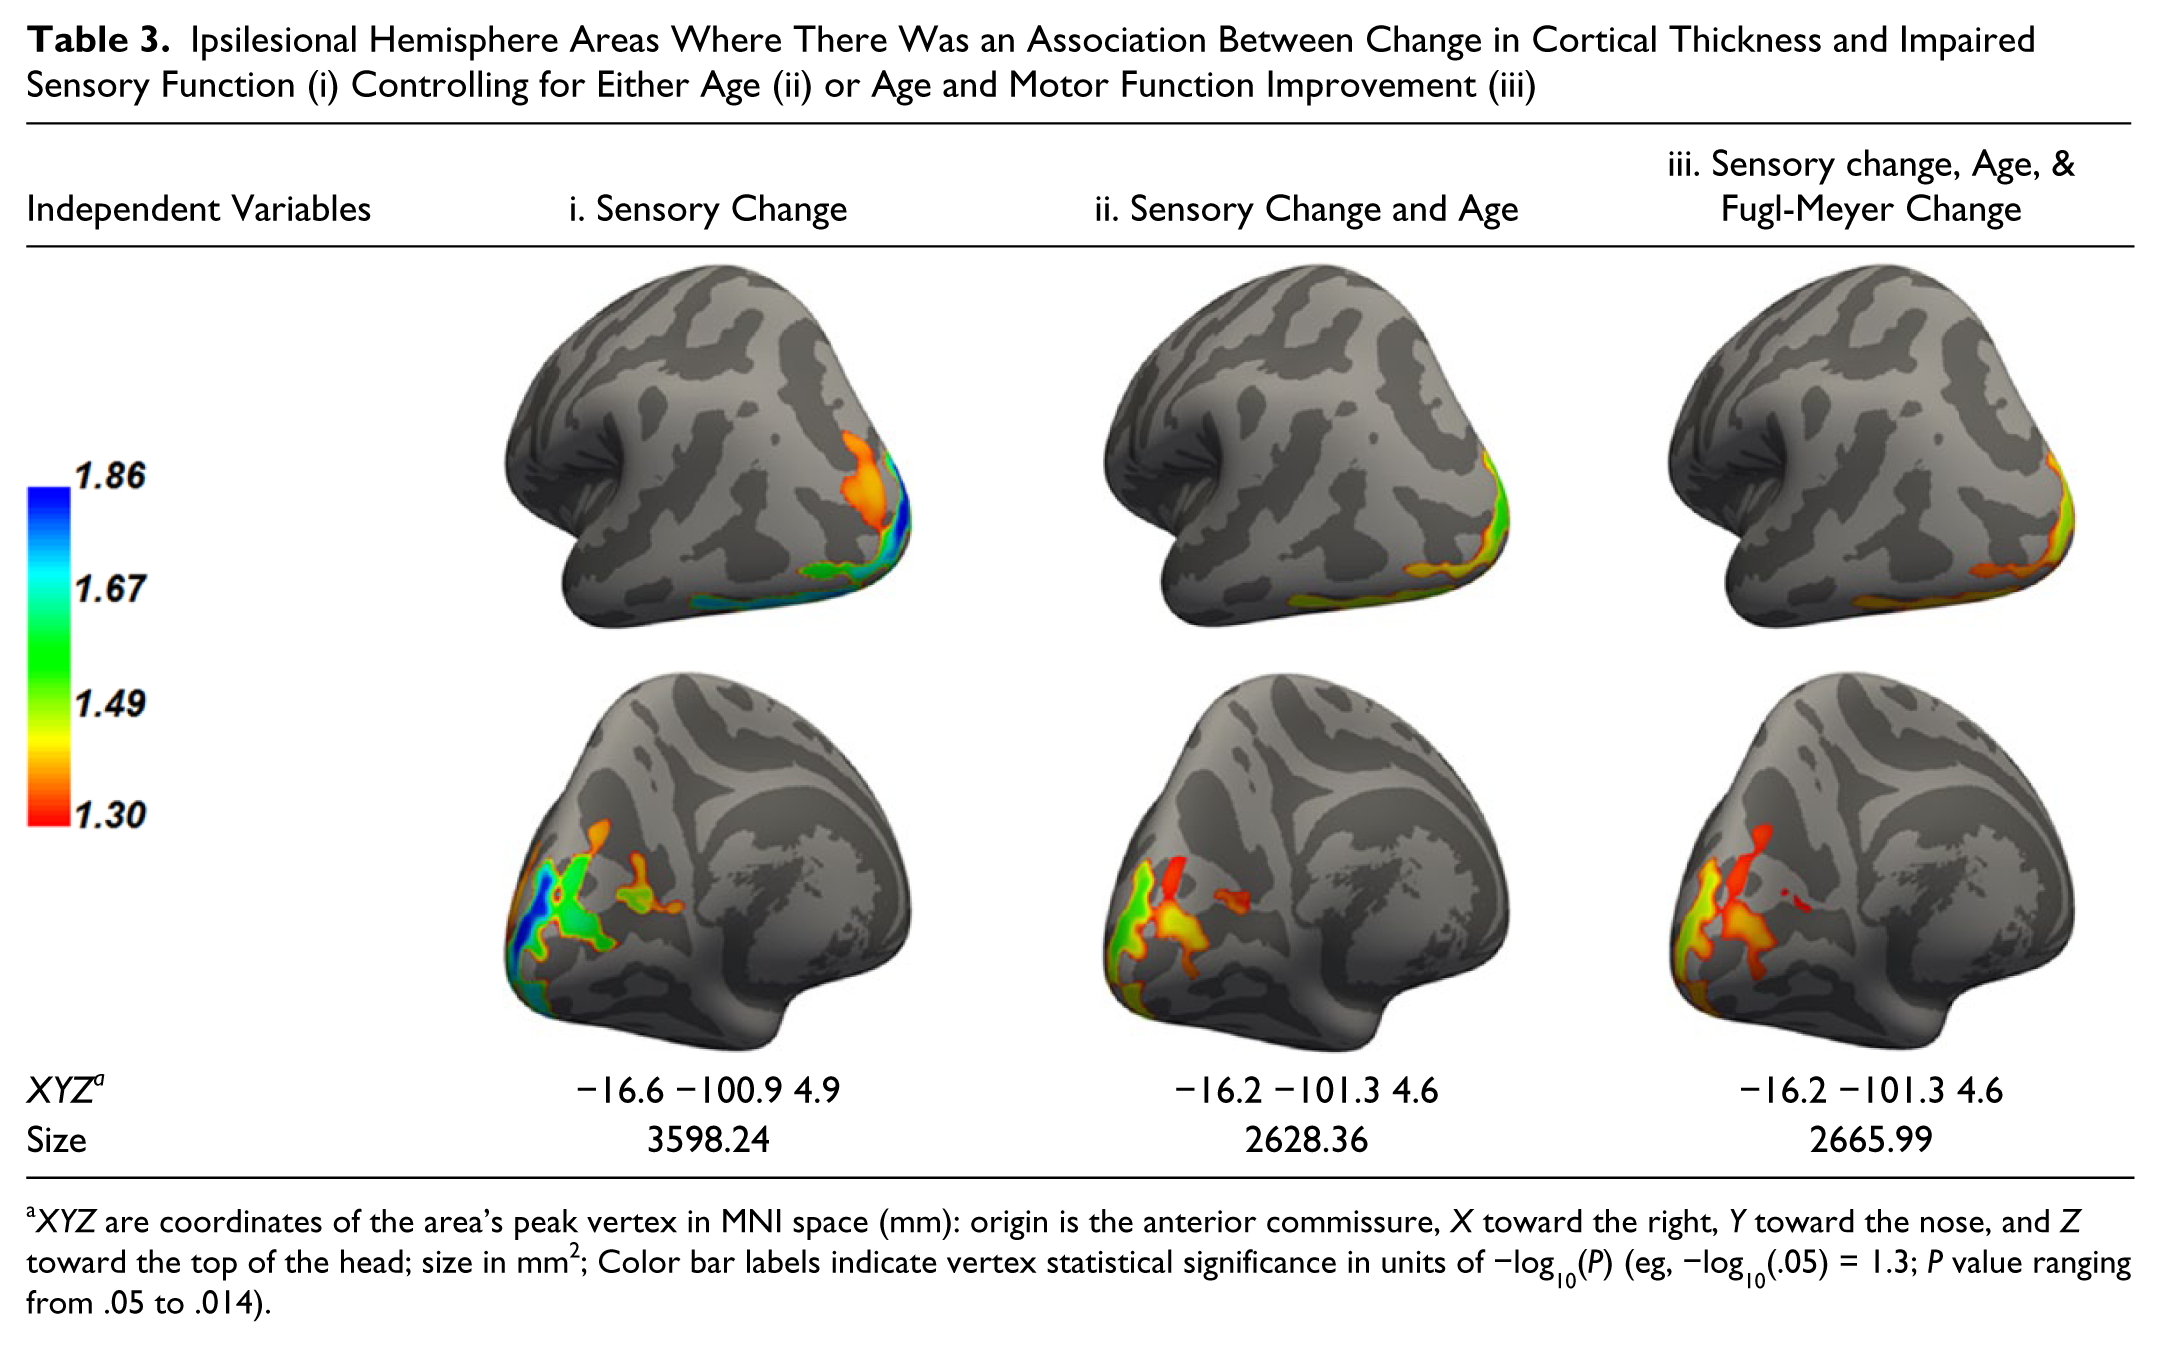
XYZ are coordinates of the area’s peak vertex in MNI space (mm): origin is the anterior commissure, X toward the right, Y toward the nose, and Z toward the top of the head; size in mm2; Color bar labels indicate vertex statistical significance in units of −log10(P) (eg, −log10(.05) = 1.3; P value ranging from .05 to .014).
Contralesional Hemisphere
For the contralesional hemisphere, there was a statistically significant association between change in cortical thickness and improved sensory function in the posterior parietal cortex that included supramarginal and angular gyri (Figure 3 and Table 2). Figure 3B illustrates the relationship between change in monofilament score and change in cortical thickness at the peak vertex. Figure 3C is an R2 map of the statistically significant cluster. Table 2 describes the 2 anatomical regions within the contralesional significant cluster according to their relative volume and regression results at the most significant vertices.
Contralesional cluster for which increased cortical thickness was associated with change in sensory function after treatment. (A) Lateral view of the area where a relationship was found between change in cortical thickness and change in monofilament score. Color bar: statistical significance level expressed in units of –log10(P) (eg, –log10(.05) = 1.3; P values ranging from .05 to .038). (B) Scatterplot of changes in monofilament score (ranging from 4 mm worsening to 14 mm improvement) and changes in cortical thickness for peak vertex. Peak vertex is the vertex with greatest statistical significance (lowest P value). (C) Map of R2 values of the ipsilesional cluster and its color bar projected on a spherical dilated cortical surface.
Table 4 shows that the statistically significant relationship was retained between change in cortical thickness and improved sensory function in the presence of the following covariates: age (Table 4, column ii), or age plus FM change (Table 4, column iii).
Contralesional Hemisphere Area Where There Was an Association Between Change in Cortical Thickness and Impaired Sensory Function (i) Controlling for Either Age (ii) or Age and Motor Function Improvement (iii).
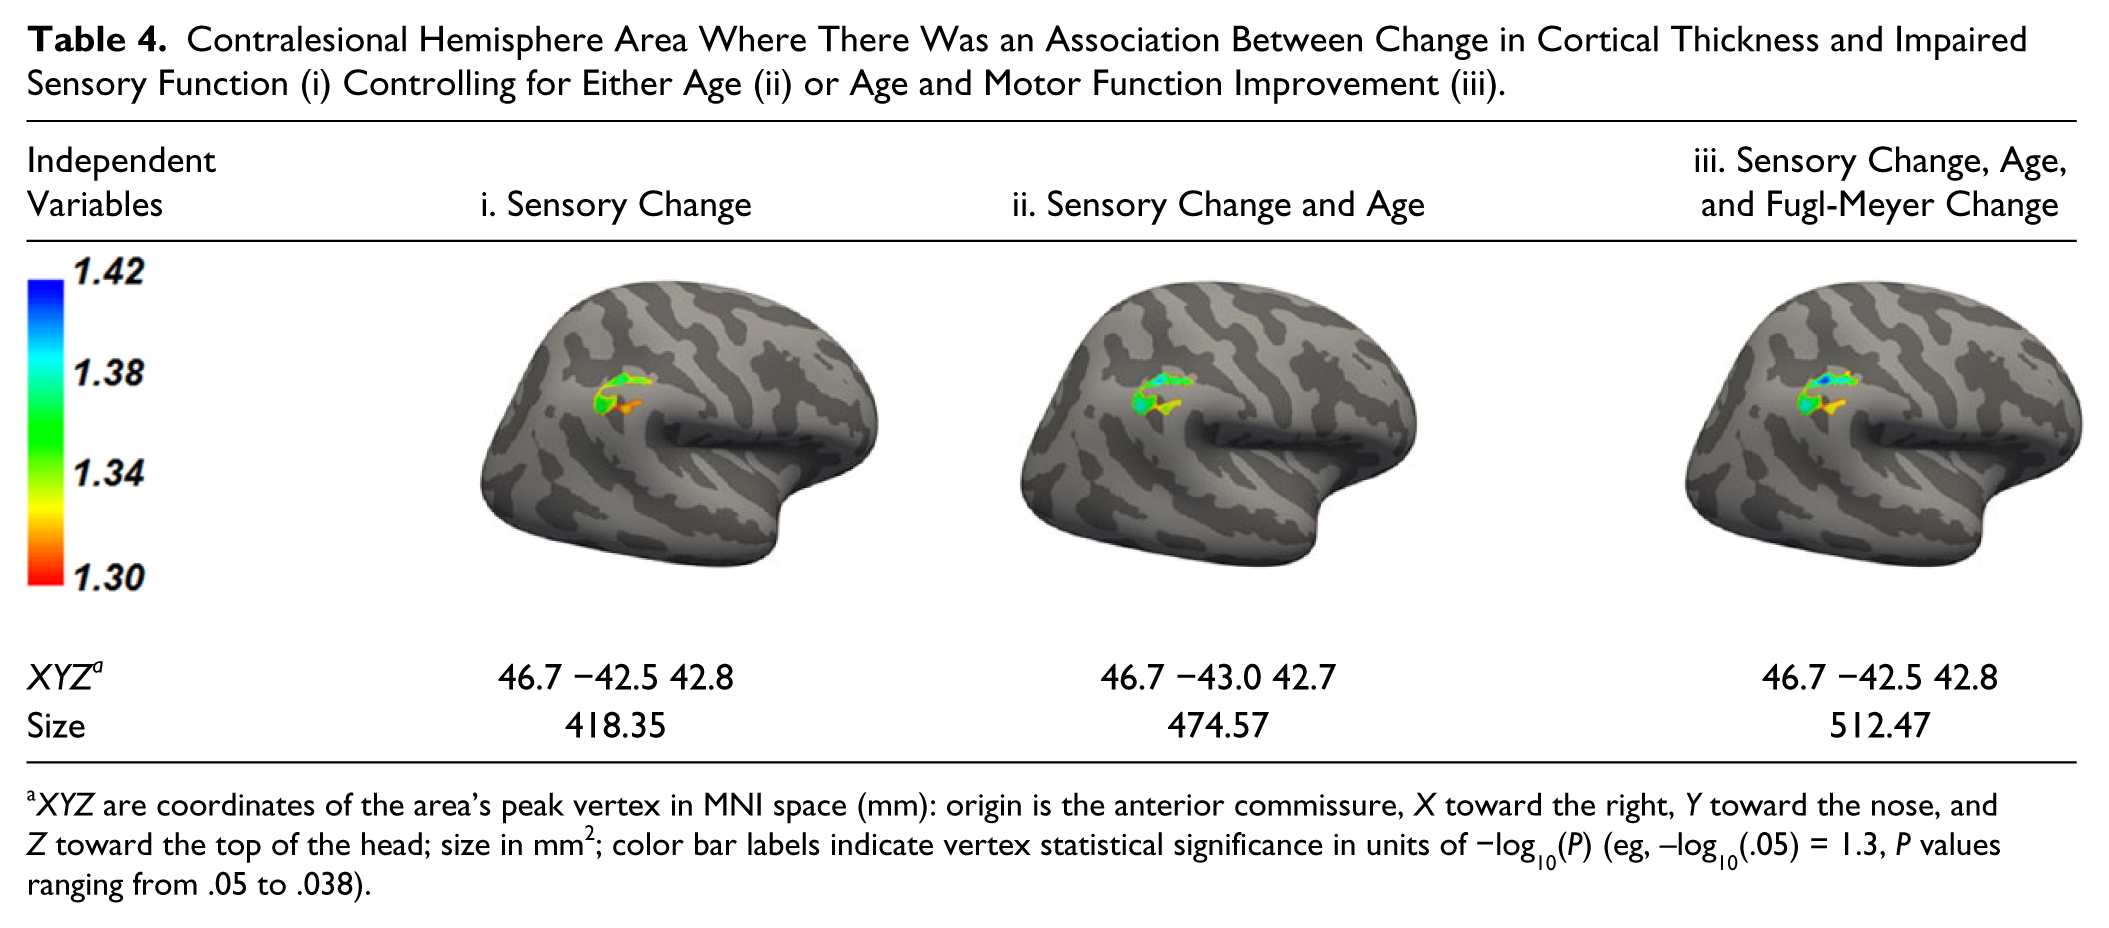
XYZ are coordinates of the area’s peak vertex in MNI space (mm): origin is the anterior commissure, X toward the right, Y toward the nose, and Z toward the top of the head; size in mm2; color bar labels indicate vertex statistical significance in units of −log10(P) (eg, –log10(.05) = 1.3, P values ranging from .05 to .038).
Relationship Between Changes in Cortical Thickness and Changes in FM Score
When examining the association between change in cortical thickness and change in FM score, there were no statistically significant clusters.
Sensory and Motor Impairment Measures
Figure 4 illustrates sensory-motor performance change in response to rehabilitation. While motor performance improved in all except one participant, monofilament score worsened in 3 and did not change in 5 subjects. Monofilament score (mean ± SD) changed from 45.0 ± 13.3 to 42.6 ± 12.9 mm (P = .063; Figure 4). FM improved from 22.1 ± 7.8 to 32.3 ± 10.1 (P < .001).
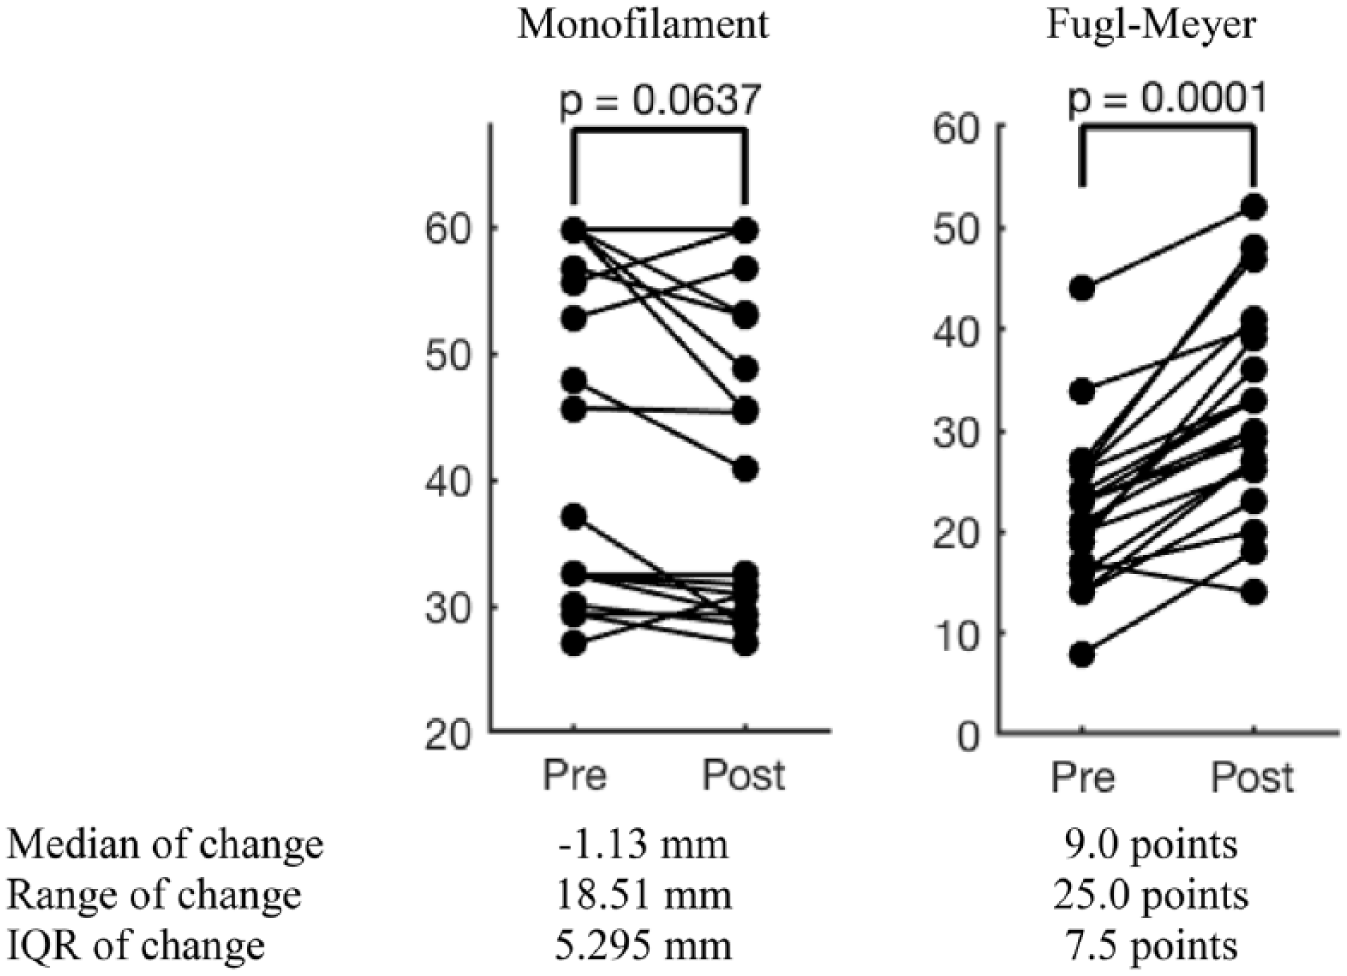
Change in sensory and motor function in response to rehabilitation p value for the Wilcoxon sign rank test paired comparison test.
Discussion
To our knowledge, this is the first report of increased cortical thickness in association with improved sensory function following rehabilitation in chronic stroke. We identified both ipsilesional and contralesional cortical areas that belong to the higher order sensory processing hubs located in the posterior parietal region as well as in the temporal-occipital lobes. These findings are consistent with the paradigm of adaptive plasticity after stroke and suggest structural brain changes corresponding to functional recovery.
Within the ipsilesional hemisphere, the occipital pole region was the largest area followed by the inferior division of the lateral occipital complex and the calcarine cortex. To understand the role of the occipital pole region in somatosensory processing, we looked at experiments using rTMS (repetitive transcranial magnetic stimulation) targeting this area of the occipital cortex. In these studies, inhibitory rTMS produced transient dissociation in execution of a sensory-motor task 36 by healthy control subjects and impaired language production (mostly semantics) in the blind. 37 Therefore, the occipital pole has multiple functionalities; it plays a role in higher order integration for nonvisual signals and presents to be a reasonable alternative substrate for adaptive somatosensory plasticity. The primary visual area (calcarine cortex) has also been shown to participate in a tactile discrimination task in healthy control subjects. 38 Furthermore, we identified the lateral occipital complex (LOC) region within the ipsilesional temporal-parietal-occipital lobes as an area active during somatosensory processing. In healthy individuals, LOC is important in tactile perception, as a multimodality converging region for recognition of tactile imagery, 39 successful perception of macrostructural global form perception with a tactile task 40 ; decoding of objects’ shapes, forms, and orientations 39 ; and convergence of multisensory processing of shape recognition based on tactile, visual, and audio stimuli.41,42 Although the primary role of the occipital cortex is in processing of visual signals, functionality of the visual system intersects with somatosensory coordination where, visual input has a strong influence on perception of touch 43 as demonstrated in a rubber hand illusion experiment. In this experiment, 43 there was a distortion of touch perception of a hand that was hidden from subjects’ sight when subjects were observing manipulation of a rubber hand. In other words, visual input has a direct impact on perception of touch. Overall, the occipital cortex appears to be a receiving hub for the sensory anterior-posterior sensory processing stream. Furthermore, vision plays an important role in compensation for tactile function deficits. Indeed, in sensory reeducation, visual recognition is a therapeutic tool. 8 Therefore, it seems reasonable that there are neuroplastic changes in the visual cortex correlating with changes in sensory function.
There is strong evidence for the anterior to posterior signal processing flow pathways that carry information from primary sensory areas across the posterior parietal region down to the occipital visual cortices. 44 A recent review 45 eloquently described a processing sequence in tactile discrimination. Along these pathways, there is substantial anatomical convergence of different sensory modalities. While even more anterior regions display cross-modal activation, there is additional convergence of multimodal functionality toward the end of this sensory processing chain in the visual cortex, specifically in LOC. Of note, true modality segregation is mainly present at the level of the ascending sensory tracts, and, at the level of the cortex, sensory processing is highly integrated. 46 Taken together, the posterior parietal and occipital areas of the ipsilesional hemisphere are part of the higher order somatosensory processing network and, therefore, they are reasonable alternative substrates for adaptive plasticity during rehabilitation of sensory deficits after stroke. Further studies are needed to investigate the specifics of their functionality in sensory recovery after injury.
We also identified a cluster within the contralesional posterior parietal cortex in the region of the inferior parietal lobule encompassing supramarginal and angular gyri. The sizes of the involved areas within each gyrus are similar (Table 2). These 2 regions are part of the sensory association cortex functioning in visual attention, 47 discrimination of geometrical shapes 48 and detection of moving objects. 49 Peripheral sensory signals reach ipsilateral parietal cortex through either transcallosal50-52 or transthalamic connections. 53 The inferior parietal cortex influences sensory perception of ipsilateral median nerve stimulation as demonstrated with rTMS facilitation of the right parietal cortex. 54 Ipsilateral posterior parietal activation is prominent during attention demanding tasks, 49 and during activities requiring somatosensory-motor-visual integration such as during hand tool use. 55 In stroke animal models, structural remodeling of the contralesional parietal cortex was shown to support restoration of sensory function in mice. 56 In human stroke, increased contralesional activation is associated with better sensory function.57-59 Although there may be left-right interhemispheric differences in cortical thickness60,61 in this region, to date, there is no evidence indicating changes in cortical thickness following rehabilitation would be different in the left versus the right hemisphere. Therefore, the contralesional inferior parietal region presents another reasonable area for adaptive plasticity after stroke but the specific role of contralesional sensory regions in decoding sensory information from the stroke-affected side will require further investigation.
Poststroke recovery-related neuroplasticity research has been based on functional neuroimaging, that is, fMRI. Compared with the findings in fMRI studies, our approach identified similar bilateral cortical regions. For example, in subjects with subcortical stroke, there was greater activation in contralesional angular and ipsilesional lingual gyri. 62 Ipsilesional precuneus activity was more pronounced in stroke vs control subjects during a sensory discrimination task 63 and increased after sensory therapy. 11 Also, following intervention that included proprioception training in addition to movement therapy, there was increased activation in the contralesional sensory areas that included inferior parietal cortex.64,65 Therefore, according to the unfortunately limited literature on longitudinal sensory-related neuroplastic changes, fMRI-based studies of sensory recovery also demonstrated that clinical recovery correlates with changes in secondary ipsilesional and contralesional sensory regions.9-11,13,25 Our finding of structural cortical plasticity echoes the notion of adaptive functional plasticity in the contralesional hemisphere and the ipsilesional posterior higher order sensory regions in recovery of sensory function after stroke.
Animal studies support human imaging reports of cortical thickness changes in response to learning and training. In fact, cellular substrates for activity-dependent structural cortical plasticity have been assessed in animal studies. In response to learning and training, there is extensive neurogenesis, synaptogenesis, neuronal restructure, gliogenesis, myelinogenesis, and angiogenesis (reviewed in Bailey and Kandel, 16 Zatorre et al, 66 and Fields 67 ). Importantly, these studies report that structural changes are appropriately located in the trained networks 18 and have a dose-dependent response. 17 Additionally, after unilateral injury, cortical regions on the unaffected side demonstrated morphological changes in response to training. 17 Some examples of structural changes include expansion of dendritic spines, 68 increased astrocyte to neuron ratio, 69 and heightened myelin staining in proportion to the learning rate. 70 Structural brain plasticity research in the human is still in its infancy and will require confirmatory examinations in the future. 71 Nonetheless, our results are reasonable based on 2 factors: (a) thoroughly controlled for multiple comparison imaging analysis and (b) anatomically rational findings. Further work is needed to establish cortical structural measurement in neurorehabilitation research and to further evaluate the significance of structural changes in recovery after stroke.
Although the main focus of this study was to evaluate changes in sensory function, we also tested a relationship between cortical thickness change and change in a motor impairment measure, namely FM. The lack of a statistically significant relationship is puzzling but could be explained by a documented variability in neuroplasticity patterns involved in recovery of motor function after stroke. Previous studies demonstrated that the pattern of adaptive plasticity in response to rehabilitation varies depending on the level of baseline motor impairment.6,72,73 Since our cohort included subjects with a relatively large spectrum of motor deficits at baseline (FM ranging between 8 and 44), it is likely that different patterns of both structural and functional changes were used by different subjects. Therefore, it is possible that due to such variability we were unable to detect group-wise changes in this relatively small cohort of subjects. Larger studies are needed to further assess this relationship.
Limitations
Our sensory measure was constrained to the monofilament test. As a secondary analysis of a dataset from a motor learning rehabilitation study, the study was not designed to have multiple sensory outcome measures. However, the monofilament perception test is widely used in clinical practice and a good indicator for overall sensory function. Future work will need to incorporate a broader array of sensory tests.
Conclusions
Recovery of sensory function after stroke in response to intensive rehabilitation was associated with structural brain changes in higher order sensory processing regions. Bilateral multimodal sensory hubs of the parietal, temporal and occipital lobes are functionally and anatomically meaningful and further studies are needed to determine a specific function of these regions in poststroke recovery. The cortical thickness measure sensitively discriminated brain regions relevant to the recovery of sensory function. In the era of fast-growing opportunities for focal brain stimulation and brain machine interface technologies, identifying the regions exhibiting a relationship between recovery and structural change is likely to guide development of brain-modulating methodologies to benefit rehabilitation.
Footnotes
Declaration of Conflicting Interests
The authors declared no potential conflicts of interest with respect to the research, authorship, and/or publication of this article.
Funding
The authors disclosed receipt of the following financial support for the research, authorship, and/or publication of this article: The study was supported by grants from the Department of Veterans Affairs Rehabilitation Research and Development Service (#B3709R, #B9024S and #B6636W).