
Abstract
Background. Strength training programs for children with cerebral palsy (CP) showed inconclusive evidence for improving walking, despite improvements in strength. Recent studies have suggested that strength training with high movement velocity is more effective for improving walking than traditional resistance training. Objective. The purpose of this study was to evaluate the effect of functional high-velocity resistance training (power-training) to improve muscle strength and walking capacity of children with CP. Method. Twenty-two children with spastic CP participated (13 bilateral, Gross Motor Function Classification System [GMFCS] level I [n = 10] and II [n = 12], 7.5 years [SD 1.8, range 4-10 years]). Within-subjects changes in a 14-weeks usual care period were compared with changes in a 14-week functional power-training period (in groups, 3×/wk). Outcome measures were the muscle power sprint test (MPST), 1-minute walk test (1MWT), 10-m shuttle run test (SRT), gross motor function (GMFM-66), isometric strength of lower-limb muscles and dynamic ankle plantar flexor strength. Results. Changes during the training period were significantly larger than changes in the usual care period for all outcome measures (P < .05). Large improvements were found during the training period for walking capacity (ΔMPST [mean]: 27.6 W [95%CI 15.84-39.46, 83% increase], Δ1MWT: 9.4 m [95% CI 4.17-14.68, 13%], ΔSRT: 4.2 [95%CI 2.57-5.83, 56%], ΔGMFM-66: 5.5 [95% CI 3.33-7.74, 7%]) and muscle strength (18%-128%), while outcomes remained stable in the usual care period. Conclusions. The results indicate that functional power-training is an effective training for improving walking capacity in young children with cerebral palsy.
Introduction
Children with cerebral palsy (CP) have significantly impaired walking capacity because of their motor impairments. 1 These motor impairments are multifactorial (spasticity, loss of selectivity, and muscle weakness). 1 Ambulant children with spastic CP (60%-70%) are integrated in community schools and recreational activities and need to perform the same activities as their typical developing (TD) peers, such as playing in the schoolyard, participating in physical education class and taking part in school outings.2,3 However, children with CP often experience difficulties keeping up with their peers in these daily activities because of their insufficient walking capacity. 4
A key aspect of the decreased walking capacity in children with CP is lower-limb muscle weakness: children with CP only have about 36% to 82% of the muscle strength of TD children. 5 Compared with TD children, they produce even less muscle power in the distal muscle groups (the plantar flexors) than in the more proximal muscle groups.6,7 This power production of plantar flexor muscles is important for step length and walking speed by generating ankle power at push-off. 8 Dallmeijer et al 9 showed that, in comparison with TD children, ankle power generated at push-off is indeed reduced in children with CP by more than 40% during gait. 9
Several methods have been used to increase muscle strength to enhance the walking capacity of children with CP; the most commonly used method is progressive resistance exercise (PRE) training. 10 However, despite an increase in strength in most lower-limb muscles, this training method did not improve the walking capacity of children with CP.10,11 Apparently, the newly gained muscle strength does not transfer to functional improvements in walking. Moreau et al 12 suggested that to get functional improvements, the strength training velocity has to be at a higher, more functional movement velocity than generally used in PRE training. This suggestion is based on their findings that children with CP have a reduced capacity to rapidly generate forces. 12 This capacity is especially needed in playing activities such as running and sprinting games on the playground and in sports. 13 Previous studies have in fact shown reduced sprinting capacity (as part of walking capacity) in children with CP.13,14
Another possible reason for the limited effects of PRE training on walking capacity is lack of training that is targeted to the plantar flexor muscles. This muscle group is more difficult to train in functional exercises, especially when children wear orthoses. Muscle weakness is already present at an early age in children with CP. 5 At the same time, the plantar flexor muscles are hampered in gaining strength by several commonly used treatments for children with CP, such as botulinum toxin injections and casting periods. 1 While these treatments address the problem of plantar flexor muscle shortening, they are also likely to weaken these muscles or at least hamper muscle growth.15,16 Strengthening the plantar flexor muscles is therefore particularly important for children with CP.
To strengthen the plantar muscles and to improve walking capacity in children with CP, we developed a functional power-training program that consists of resistance training with exercises at high movement velocities. This functional power-training consists of loaded functional exercises, such as walking, running, and climbing stairs, performed at high movement velocities. 17
The purpose of this study was to evaluate the effect of this functional power-training on walking capacity (sprinting capacity, walking speed, endurance) and muscle strength with a double-baseline design. We compared changes in walking capacity and muscle strength during a 14-week usual care period with changes in walking capacity and muscle strength during a 14-week functional power-training period.
Methods
Participants
Inclusion criteria were ambulant children aged 4 to 10 years, with a spastic CP, and Gross Motor Function Classification System (GMFCS) I and II. Parents and/or the children had a treatment question related to walking capacity (such as being able to walk longer or faster). The children had to be able to understand and follow instructions. The exclusion criteria were treatment with botulinum toxin A in lower limb and/or serial casting of lower limb less than 6 months before the start of the functional power-training and selective dorsal rhizotomy treatment less than a year before the functional power-training. Children who did not (yet) choose walking as their preferred way of mobility were also excluded.
Design and Procedure
This study had a double-baseline design, in which the participating children acted as their own controls: a 14-week usual care period was compared with a 14-week functional power-training intervention that followed immediately after the usual care period. Measurements were performed before the usual care period (Pre1); after the 14-week usual care period (which was also the start of the training period) (Pre2); after the 14-week training period (Post); and 14 weeks after the posttest (Follow-up) to assess if the potential improvements were maintained. In the usual care period and the follow-up period children followed their regular physical therapy sessions (1 to 2 times a week, 30 minutes), which differed from child to child. Detailed descriptions of the design and procedure of the study can be found in Van Vulpen et al. 17
The Medical Ethics Committee, Amsterdam, the Netherlands, approved this study, and written informed consent forms were obtained from the parents of each participant.
Setting
Participants were recruited from a rehabilitation center, 2 special needs schools for children with physical disabilities and an outpatient clinic of a university medical center. The training and assessments took place in the 2 special needs schools for physically disabled children and the rehabilitation center.
Intervention: Functional Power-Training
During the intervention period, children followed the functional power-training program. The training period was 14 weeks, with sessions 3 times a week and each training session lasting 60 minutes. This was based on strength training recommendations for improving muscle strength in children with or without CP.18-21 The functional power-training replaced the conventional physiotherapy program if there was one. The power-training was specifically designed to strengthen the plantar flexor muscles during functional exercises and consisted of the following phases: a warm-up (10 minutes), 3 to 4 different power exercises (35 minutes), and an end game (15 minutes).
The training sessions were in small groups (3-6 children), with 1 supervising therapist for each child (3-6 therapists). Children wore regular sport shoes without orthoses. Each training session started with a warm-up with walking and running exercises and dynamic calf muscle stretching exercises. A story about super heroes and secret missions kept the children motivated to give their best effort. They all received their own T-shirt with their super hero to stimulate the group feeling and training motivation.
Power Exercises
All participants received 3 to 6 different power exercises for improving daily life activities (Table 1), chosen in line with the treatment goals set by their parents. The children performed 3 to 4 of the 6 different power exercises in each session (Table 1). Key elements of the power exercises were functional loaded multijoint exercises like running and walking with a focus on the ankle push-off, high movement velocity (similar to the velocity used in daily/playing activities), and progressive load. The exercises were performed at 50% to 70% of their maximum unloaded speed by retaining the movement with load. Each exercise was performed during 25 seconds on maximal effort, with a resting period of 30 to 50 seconds, and 6 to 8 repetitions of each exercise.
Characteristics and Training Volume of the 6 Different Power Exercises and Progression of Each Exercise During the Training Period.
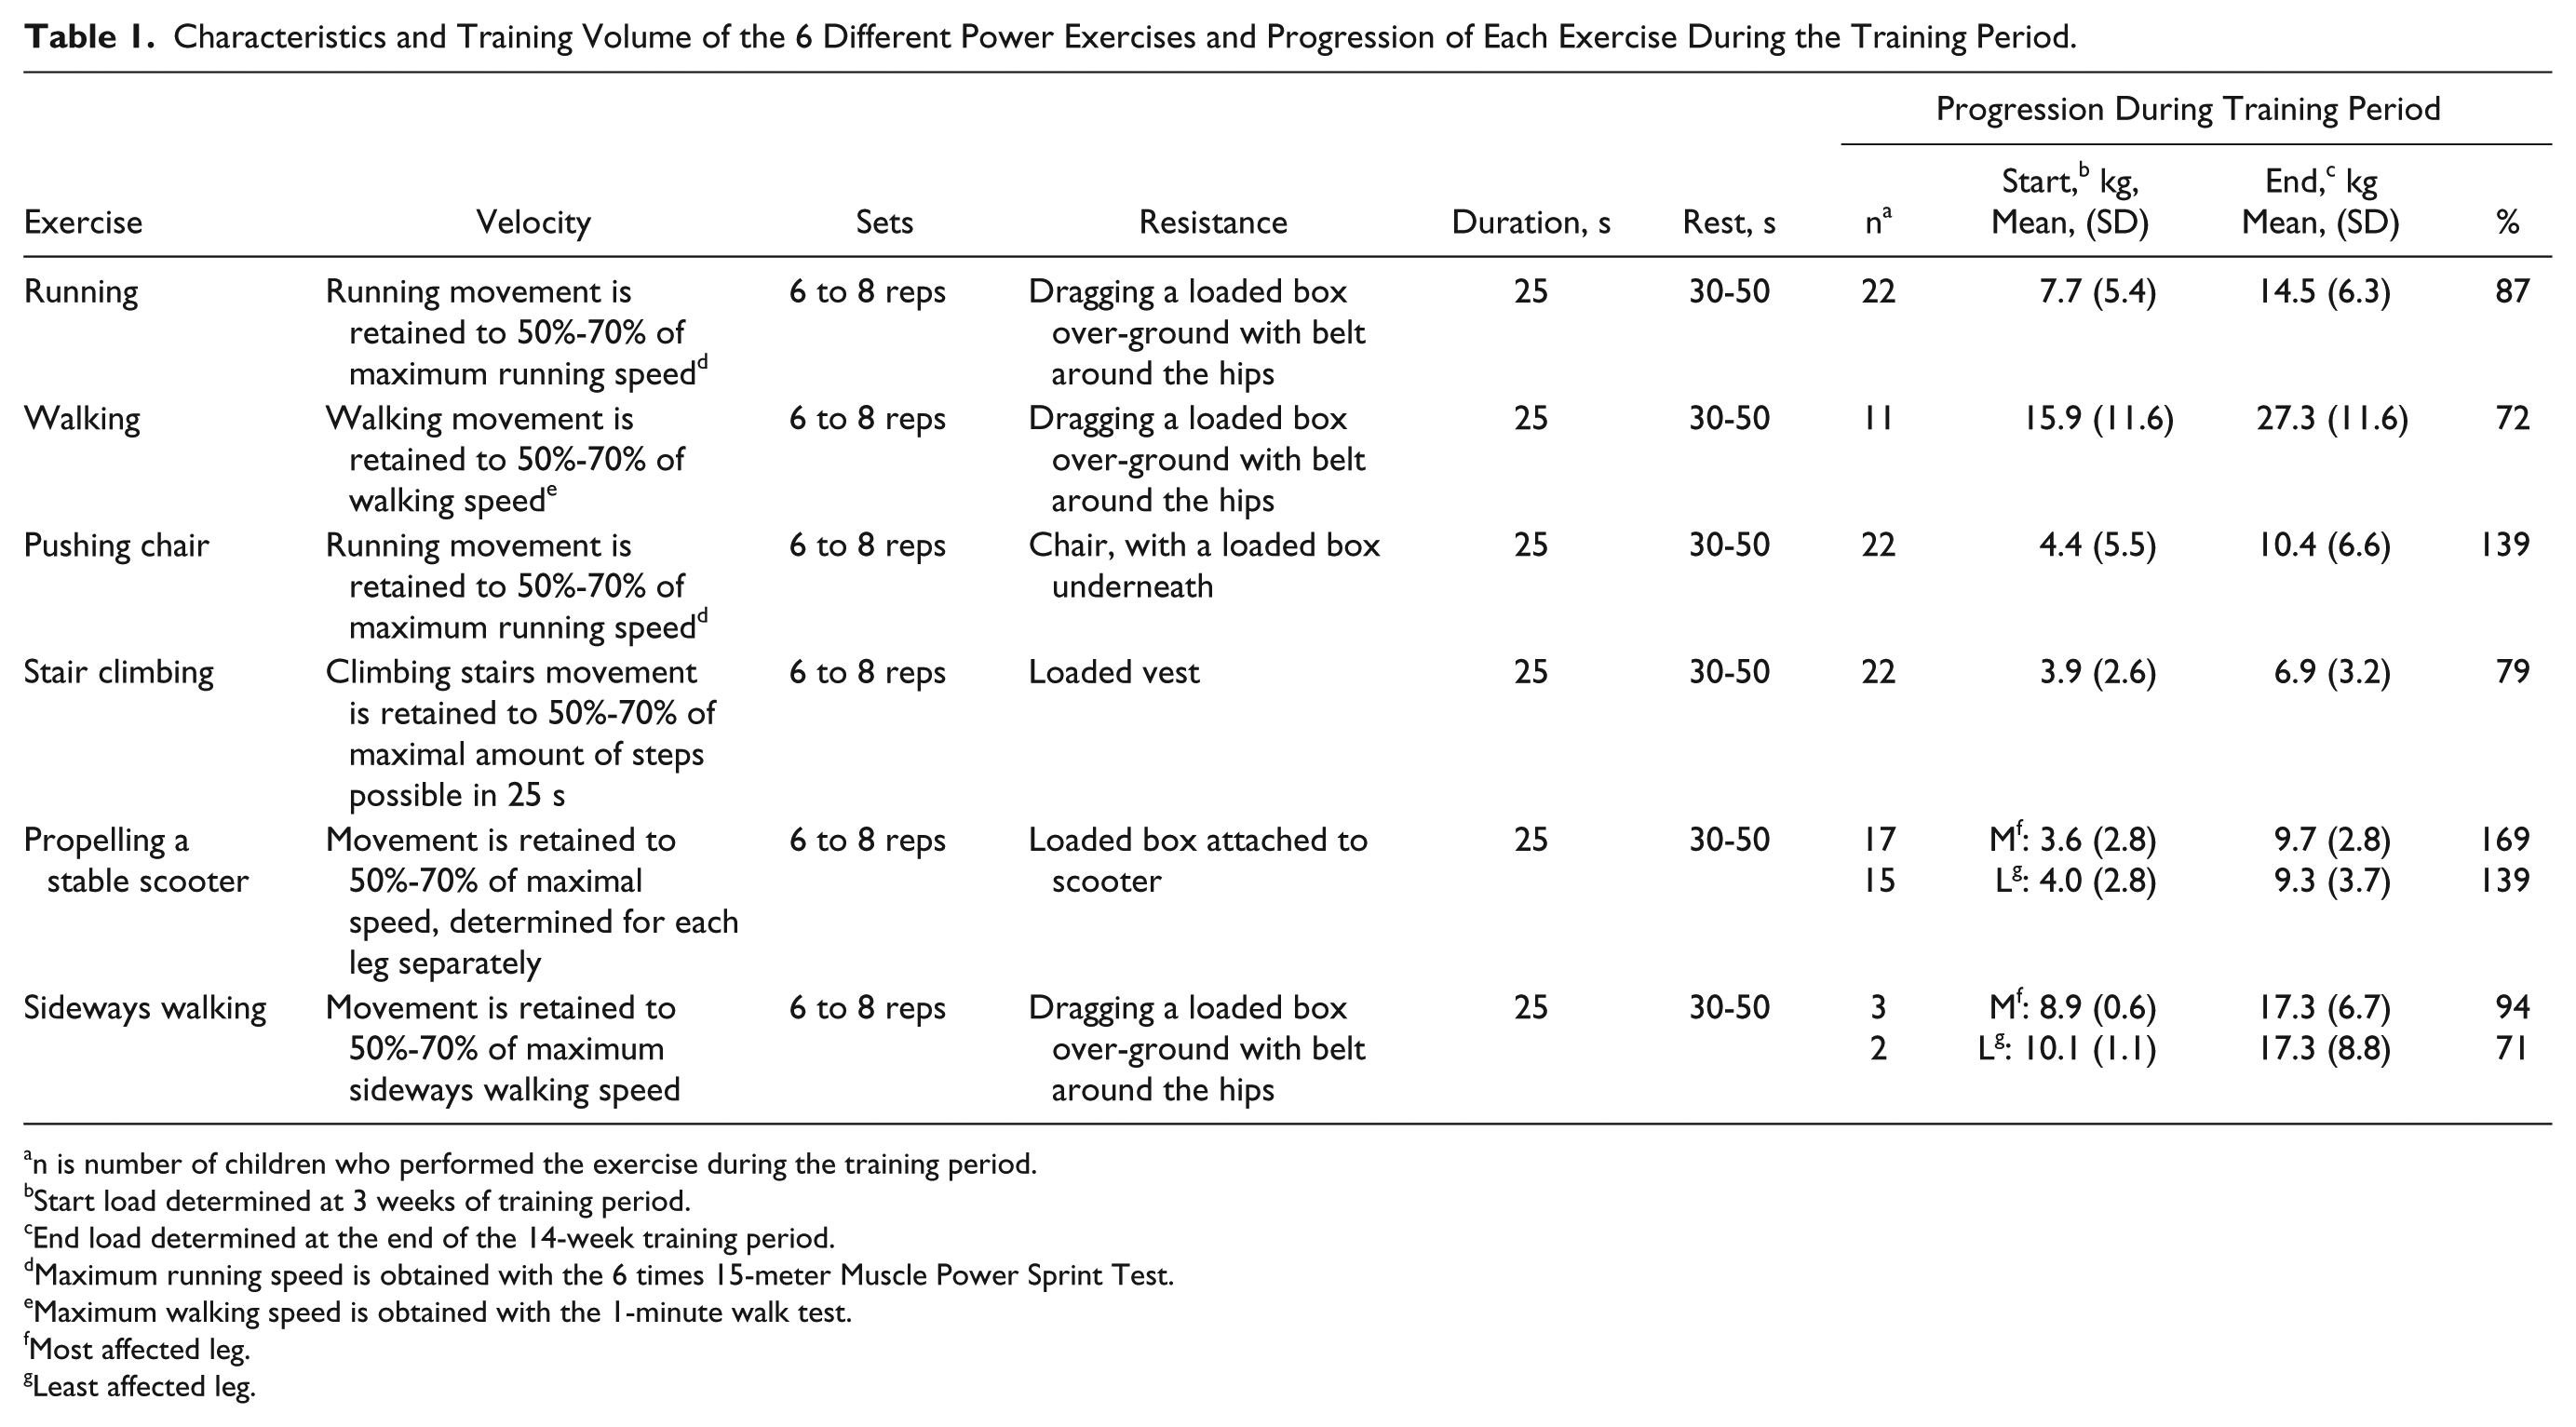
n is number of children who performed the exercise during the training period.
Start load determined at 3 weeks of training period.
End load determined at the end of the 14-week training period.
Maximum running speed is obtained with the 6 times 15-meter Muscle Power Sprint Test.
Maximum walking speed is obtained with the 1-minute walk test.
Most affected leg.
Least affected leg.
The training volume was determined by load, velocity, and number of repetitions (Table 1). When children became faster and performed the distance of the exercise in less than 25 seconds, the load was increased by10%. A more detailed description of the training protocol is described elsewhere. 17
Measurements
Walking Capacity
The primary outcome measure of walking capacity was the Muscle Power Sprint Test (MPST). The MPST measures the sprint capacity of the child expressed in mean power and peak power. 22 This test is reliable (intraclass correlation coefficient [ICC] = 0.97) with good feasibility and construct validity. 22 Children sprint at maximum speed over 15 meters with 6 repetitions, with a 10-second break in between to turn around for the next 15 meters sprint as described in the protocol of the test. The power output for each of the 6 sprints was estimated from the collected data using the following equations: (1) velocity (m/s) = 15 meters/time, (2) acceleration (m/s2) = velocity/time, (3) force (kg·m/s2) = body mass × acceleration, (4) power (W) = force × velocity. 22 Peak power was defined as the highest power output of the 6 runs. Mean power was defined as the average power output of the 6 runs.
The secondary outcome measures on walking capacity were walking speed, measured with the 1-minute walk test (1MWT), and walking endurance, measured with the 10-meter Shuttle Run Test (SRT). The 1MWT measures the distance walked in 1 minute. The children were asked to walk as fast as possible without running around an oval track. The reliability (ICC = 0.94) and validity of the 1MWT are good.23,24 The 10-meter SRT, made for children with CP GMFCS level I and II, measures endurance. Children walked or ran between 2 markers that were 10 meters apart, at a set incremental speed determined by a signal. Children with GMFCS level I performed the SRT-I with starting speed at 5 km/h; children with GMFCS level II performed the SRT-II with starting speed at 2 km/h. Both SRT tests increase 0.25 km/h in speed every minute. Reliability of the SRT-I and SRT-II is good (SRT-I, ICC = 0.97 and SRT-II, ICC = 0.99). 25
Gross motor function was measured with the 66-item version of the Gross Motor Function Measure (GMFM-66). Items that were tested included activities in walking, running, and jumping skills. There is a 4-point scoring system for each item converted to an interval scale (range 0-100 points). The GMFM-66 is a standardized tool designed to evaluate change in gross motor function in children with CP; it has been internationally validated.26,27
Muscle Strength
The isometric muscle strength of the plantar flexors (with knees extended and with knees flexed), knee extensors and hip abductors were measured. The make-method was used, (microFET, Biometrics BV, Almere, The Netherlands) for about 5 seconds. Each child subsequently performed 3 repetitions for each muscle group, and the maximum force (peak force) for each repetition was registered. A fourth or fifth repetition was performed if the concentration and/or motivation of the child were not optimal.
A standardized protocol was used for positioning of the child, joint fixation and joint positioning. 28 Torque (N·m) was calculated by multiplying force (Newton) by the length (meter) of the lever arm. To improve reliability, isometric muscle strength was measured at 2 different test occasions (different days, with a maximum of 7 days within measurements). The mean of these 6 measurements (2 test occasions with 3 repetitions each) was used in the analysis. Isometric strength measurements have good reliability when measured with 3 repetitions in 2 different test occasions. 28
The dynamic muscle strength of the plantar flexors was measured with the standing heel-rise test on one limb. The most and least affected limb were both tested with a standardized protocol. 28 Moderate to good reliability was found for the heel-rise test in young children with CP (ICC 0.86-0.98). 28
Control Outcomes
Each child was weighed on a mechanical scale (Seca 761 mechanical scale, Seca BV, Hamburg, Germany) and body height was measured with a height scale (Seca 217 Stadiometer, Seca BV, Hamburg, Germany) with the child standing against a wall. GMFCS and type of CP were determined by a pediatric physiotherapist together with the physician. To determine the most and least affected leg of each child, selective motor control of knee extension and ankle dorsiflexion were tested by the modified Trost Selective Motor Control test. 29 The modified Trost Selective Motor Control test has 3 levels of control: 0, no ability to perform isolated movement; 1, partial ability to perform isolated movement; and 2, complete ability to perform isolated movement. 29 Passive ankle dorsiflexion range of motion and popliteal angle measurements were performed with a goniometer with the child in supine position. 8
Statistical Analysis
Sample Size
A power calculation was performed for the primary outcome measure, the Muscle Power Sprint Test (W). A pilot study (n = 10) showed an increase of 85% (mean ± SD: 13.1 ± 12.2 W) after functional power-training. Calculations were based on a within-subject design with a dependent t test, a power of 0.8, α of .05, and an effect size 0.7. According to the power calculation, a sample size of at least 19 children was needed. Twenty-two children were recruited to allow a dropout of 10%.
Mean and standard deviations were calculated of walking capacity and muscle strength at each measurement occasion (Pre1, Pre2, Post, and Follow-up). Changes in walking capacity and muscle strength during the usual care period (Δ Pre2 − Pre1), functional power-training period (Δ Post − Pre2), and follow-up period (Δ Follow-up − Post) were calculated. Paired sampled t tests (if normally distributed) and Wilcoxon signed rank tests (if nonnormally distributed) were used to determine the possible intervention effect by comparing the changes during the functional power-training period with changes in the usual care. All statistical analyses were performed using SPSS Statistics 22.0 software (IBM Corporation, New York, USA).
Results
Characteristics of the Study Population
Twenty-two children participated in this study. Personal characteristics of the participants are presented in Table 2. Of 22 participants, three had interfering treatment with the protocol (serial casting for 1 to 3 weeks) in their usual care period, and one participant had serial casting (3 weeks) in the follow-up period. As an intention-to-treat analyses, these four participants were included in the analyses. One participant was hospitalized during the follow-up measurements because of a medical problem that was unrelated to the training and therefore missed the follow-up test. Three participants had a surgical intervention (selective dorsal rhizotomy without muscle lengthening) more than a year before start of the usual care period.
Characteristics of the Participants.
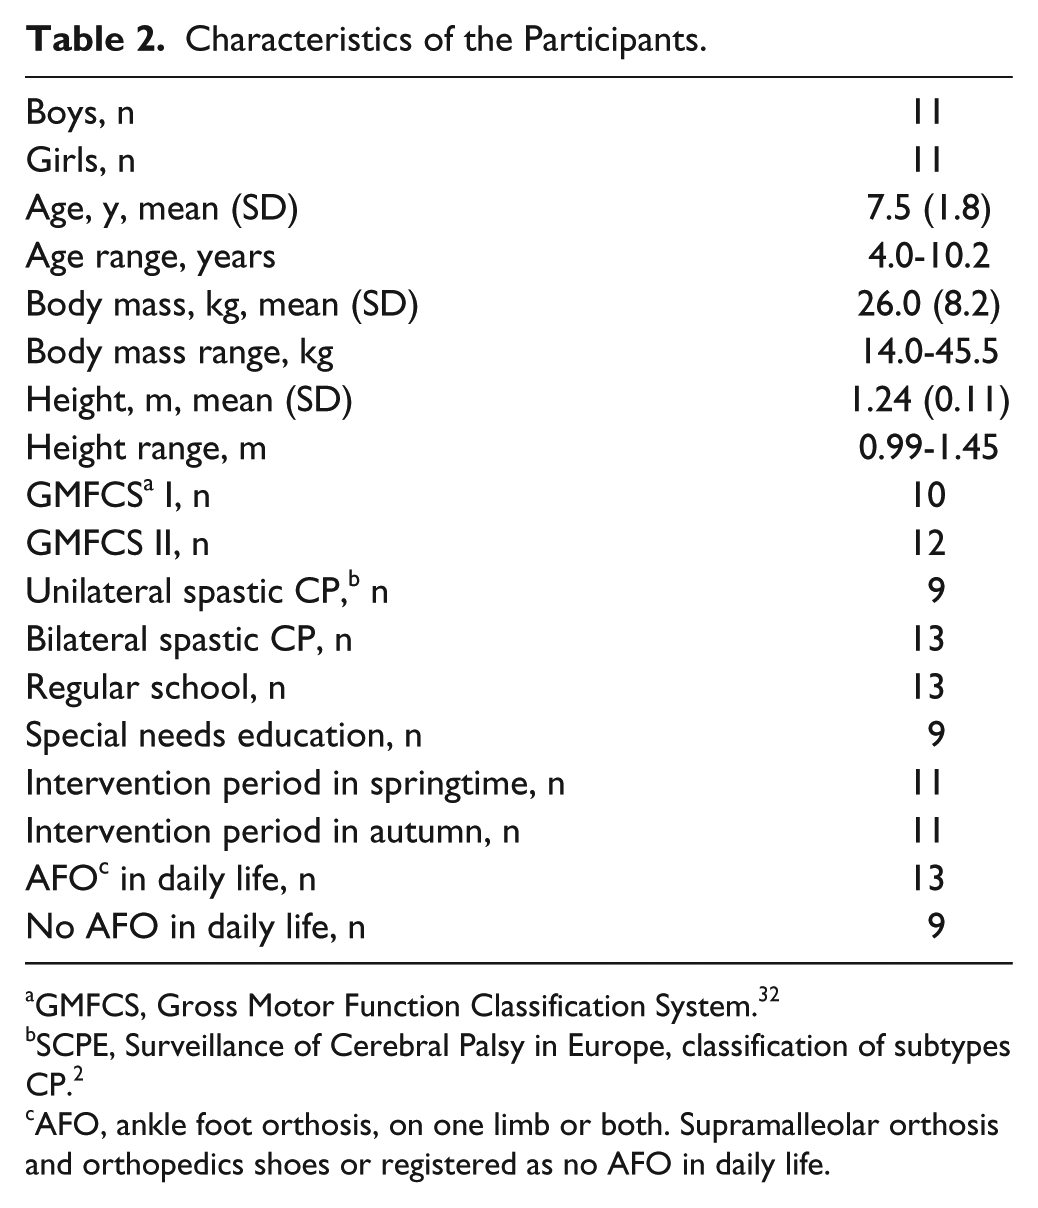
GMFCS, Gross Motor Function Classification System. 32
SCPE, Surveillance of Cerebral Palsy in Europe, classification of subtypes CP. 2
AFO, ankle foot orthosis, on one limb or both. Supramalleolar orthosis and orthopedics shoes or registered as no AFO in daily life.
Training Compliance
The children participated in 88% (range 57%-100%) of the scheduled training sessions. One child missed 33% of all possible training sessions because of logistic problems of the parents. Another child missed 43% of the 14-week functional power-training because the family moved at the end of the training period. Other reasons for not attending the training were illness, vacation, medical appointment, family visits, or unknown.
Training Progression
Load increased significantly in the power exercises over the intervention period. It took 1 to 3 weeks for the children to get used to the exercises, and set the appropriate training load. Children showed increases in the load they could pull, bear, or push in the power exercises in the 14th week compared with the 3rd week in the training period, ranging from 72% in walking to 170% in propelling the scooter (Table 1).
Walking Capacity
There were 2 missing values for the 1MWT: One participant could not be tempted to walk instead of running during the posttest, and one participant did not bring the same footwear at posttest.
Table 3 shows the intervention effect by comparing the changes during the functional power-training period with the changes in the usual care period within participants: All walking capacity variables showed significant improvements during the functional power-training.
Mean (±SD) Changes During the Usual Care Period, Intervention Period, and Intervention Effect (Differences Between Changes in Usual Care Period and Changes in Intervention Period).
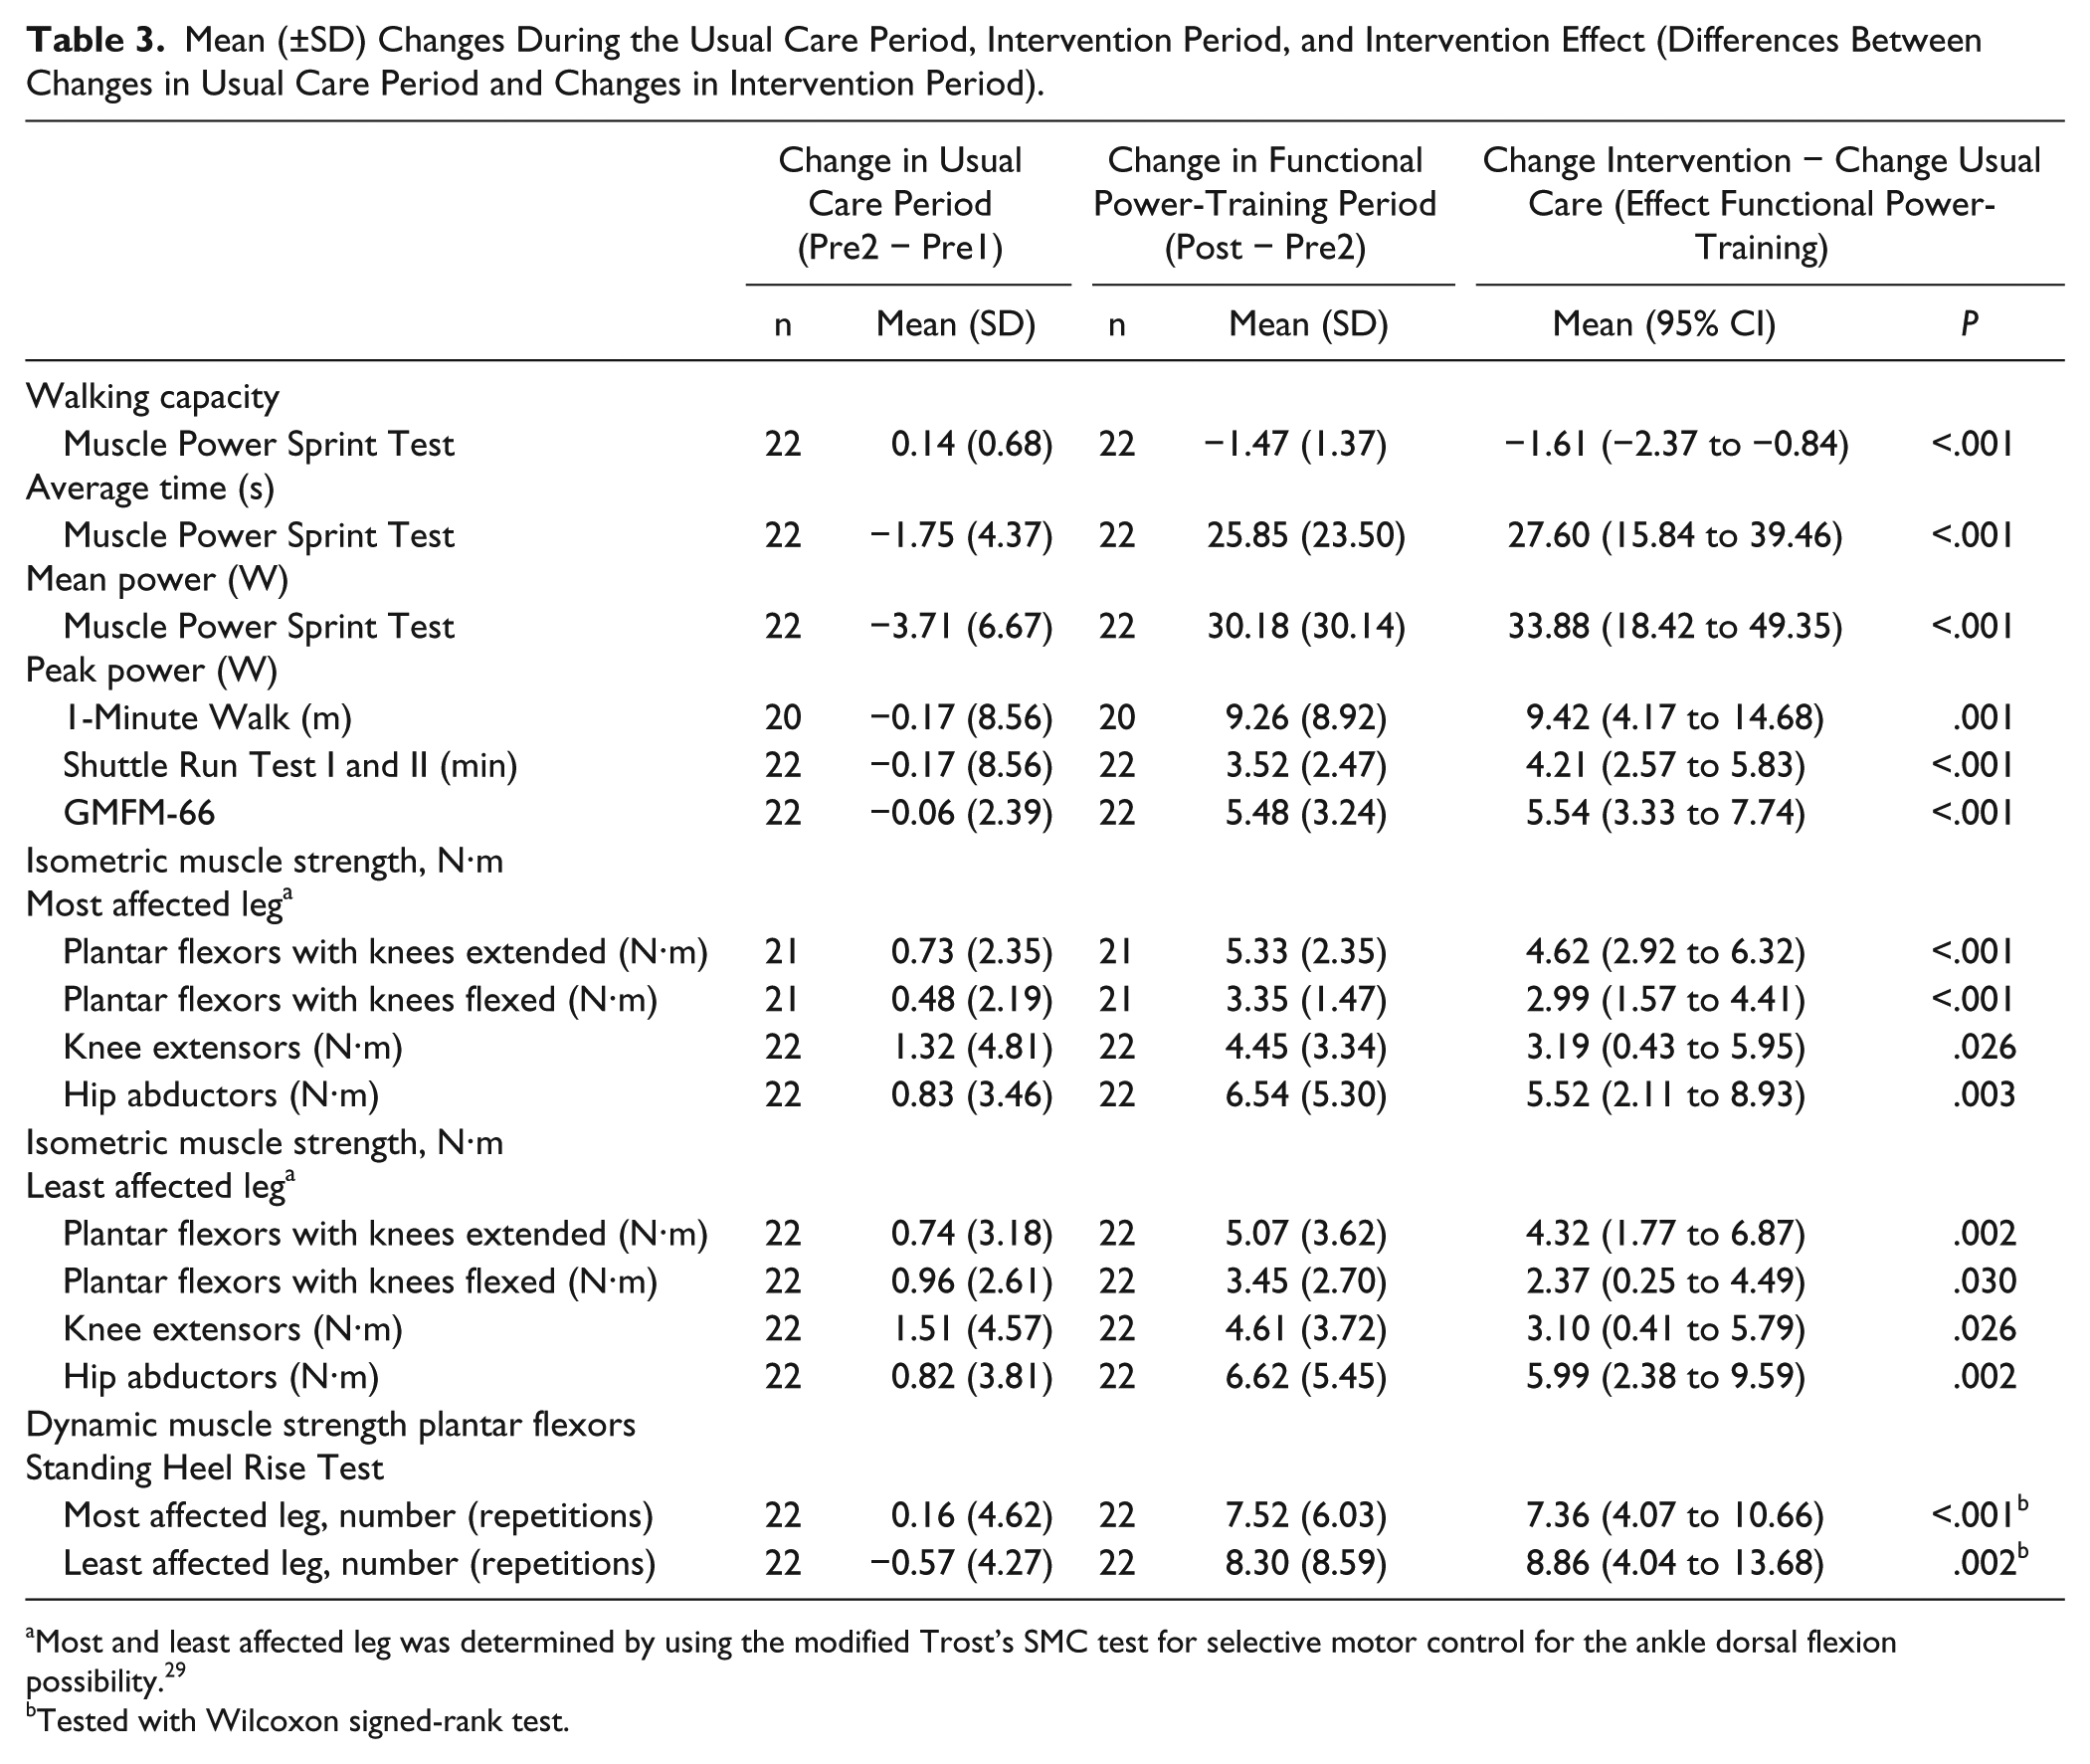
Most and least affected leg was determined by using the modified Trost’s SMC test for selective motor control for the ankle dorsal flexion possibility. 29
Tested with Wilcoxon signed-rank test.
Table 4 shows walking capacity variables of all measurement moments. We found no significant changes in the walking capacity variables in the usual care period (from Pre 1 to Pre 2 measurement) except for a small decline in peak power on the MPST (41.0 W at Pre 1 to 37.3 W at Pre 2, P = .017). All walking capacity variables showed a significant increase in the functional power-training period (from Pre 2 to Post). In the follow-up period, the MPST showed a decline in mean power (from Post 57.1 W to Follow-up 52.0 W, P = .041) and in peak power (from Post 67.4 W to Follow-up 60.8 W, P = .037); however, compared with the measurement at the start of the training (Pre 2), they still showed a higher mean power (from Pre 2 31.2 W to Follow-up 52.0 W, P < .001) and peak power (from Pre 2 37.3 W to Follow-up 60.8 W, P < .001). Similar results were seen in the SRT, while walking speed (1MWT) maintained the training effect with no decline after Follow-up.
Pre, Post, and Follow-up Values (Means and SD) for Walking Capacity and Muscle Strength Variables.
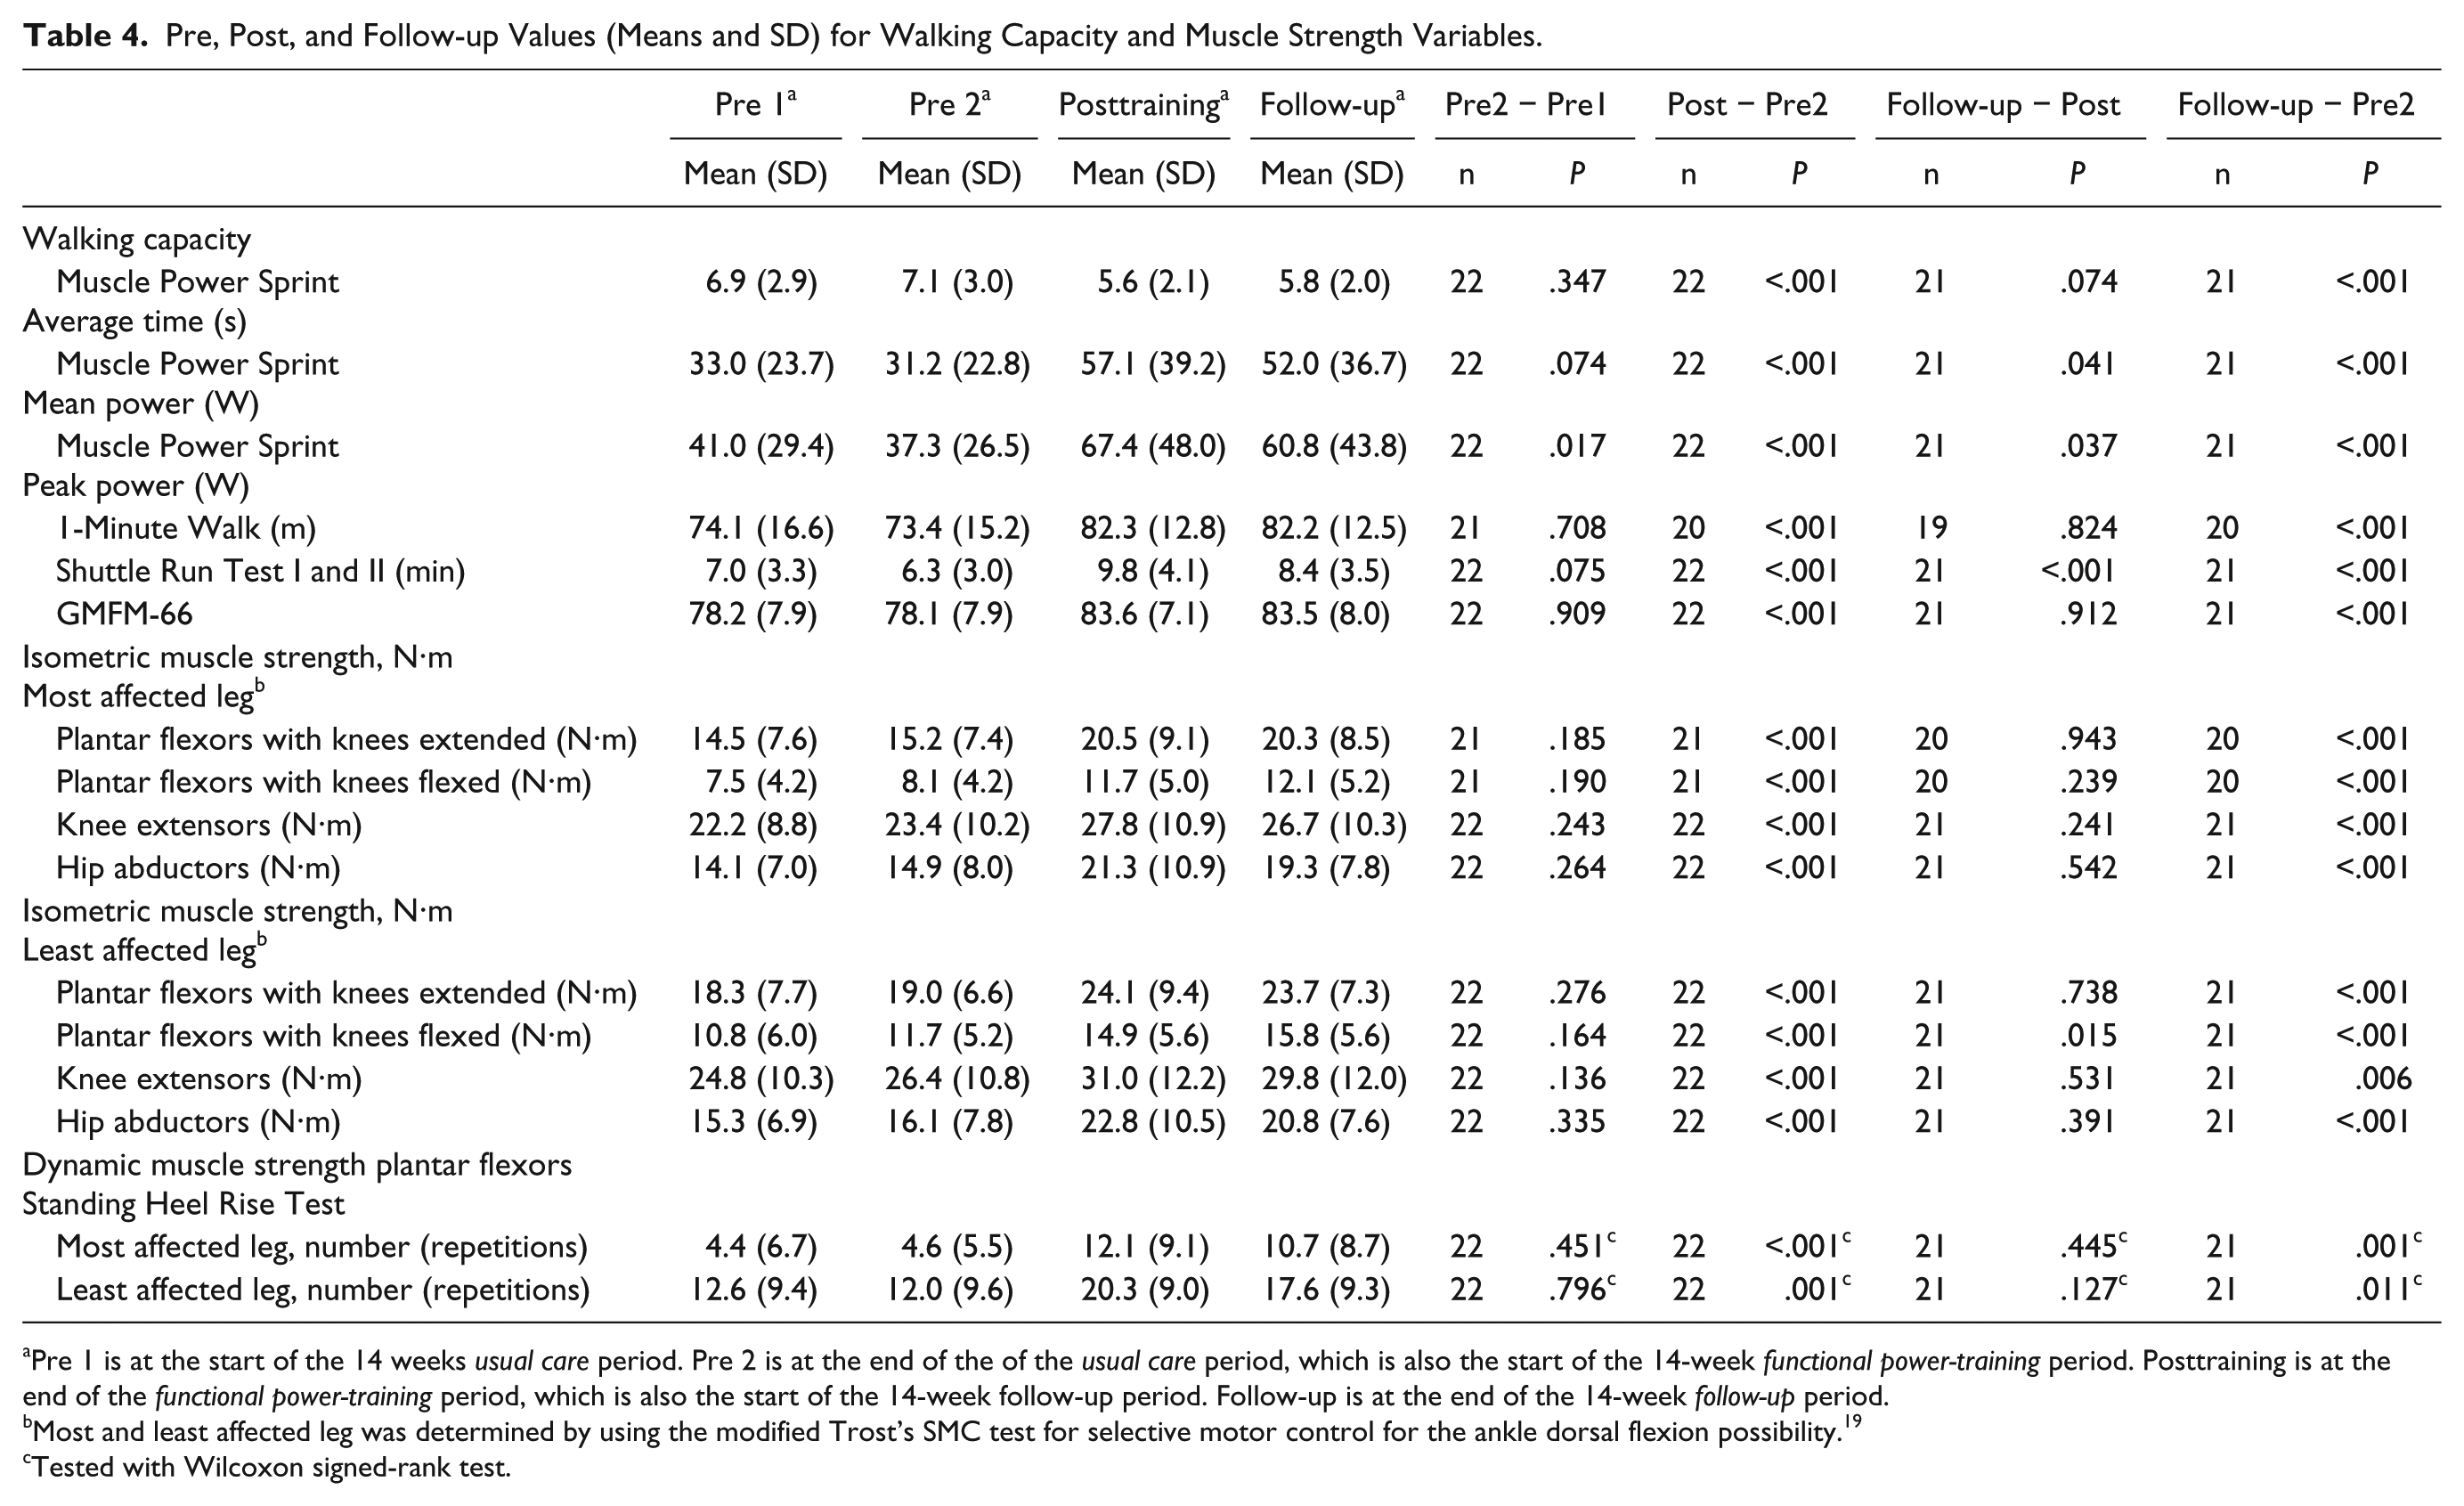
Pre 1 is at the start of the 14 weeks usual care period. Pre 2 is at the end of the of the usual care period, which is also the start of the 14-week functional power-training period. Posttraining is at the end of the functional power-training period, which is also the start of the 14-week follow-up period. Follow-up is at the end of the 14-week follow-up period.
Most and least affected leg was determined by using the modified Trost’s SMC test for selective motor control for the ankle dorsal flexion possibility. 19
Tested with Wilcoxon signed-rank test.
The individual changes of the participants in the MPST and the 1MWT in the usual care period and the functional power-training period are illustrated in Figure 1.
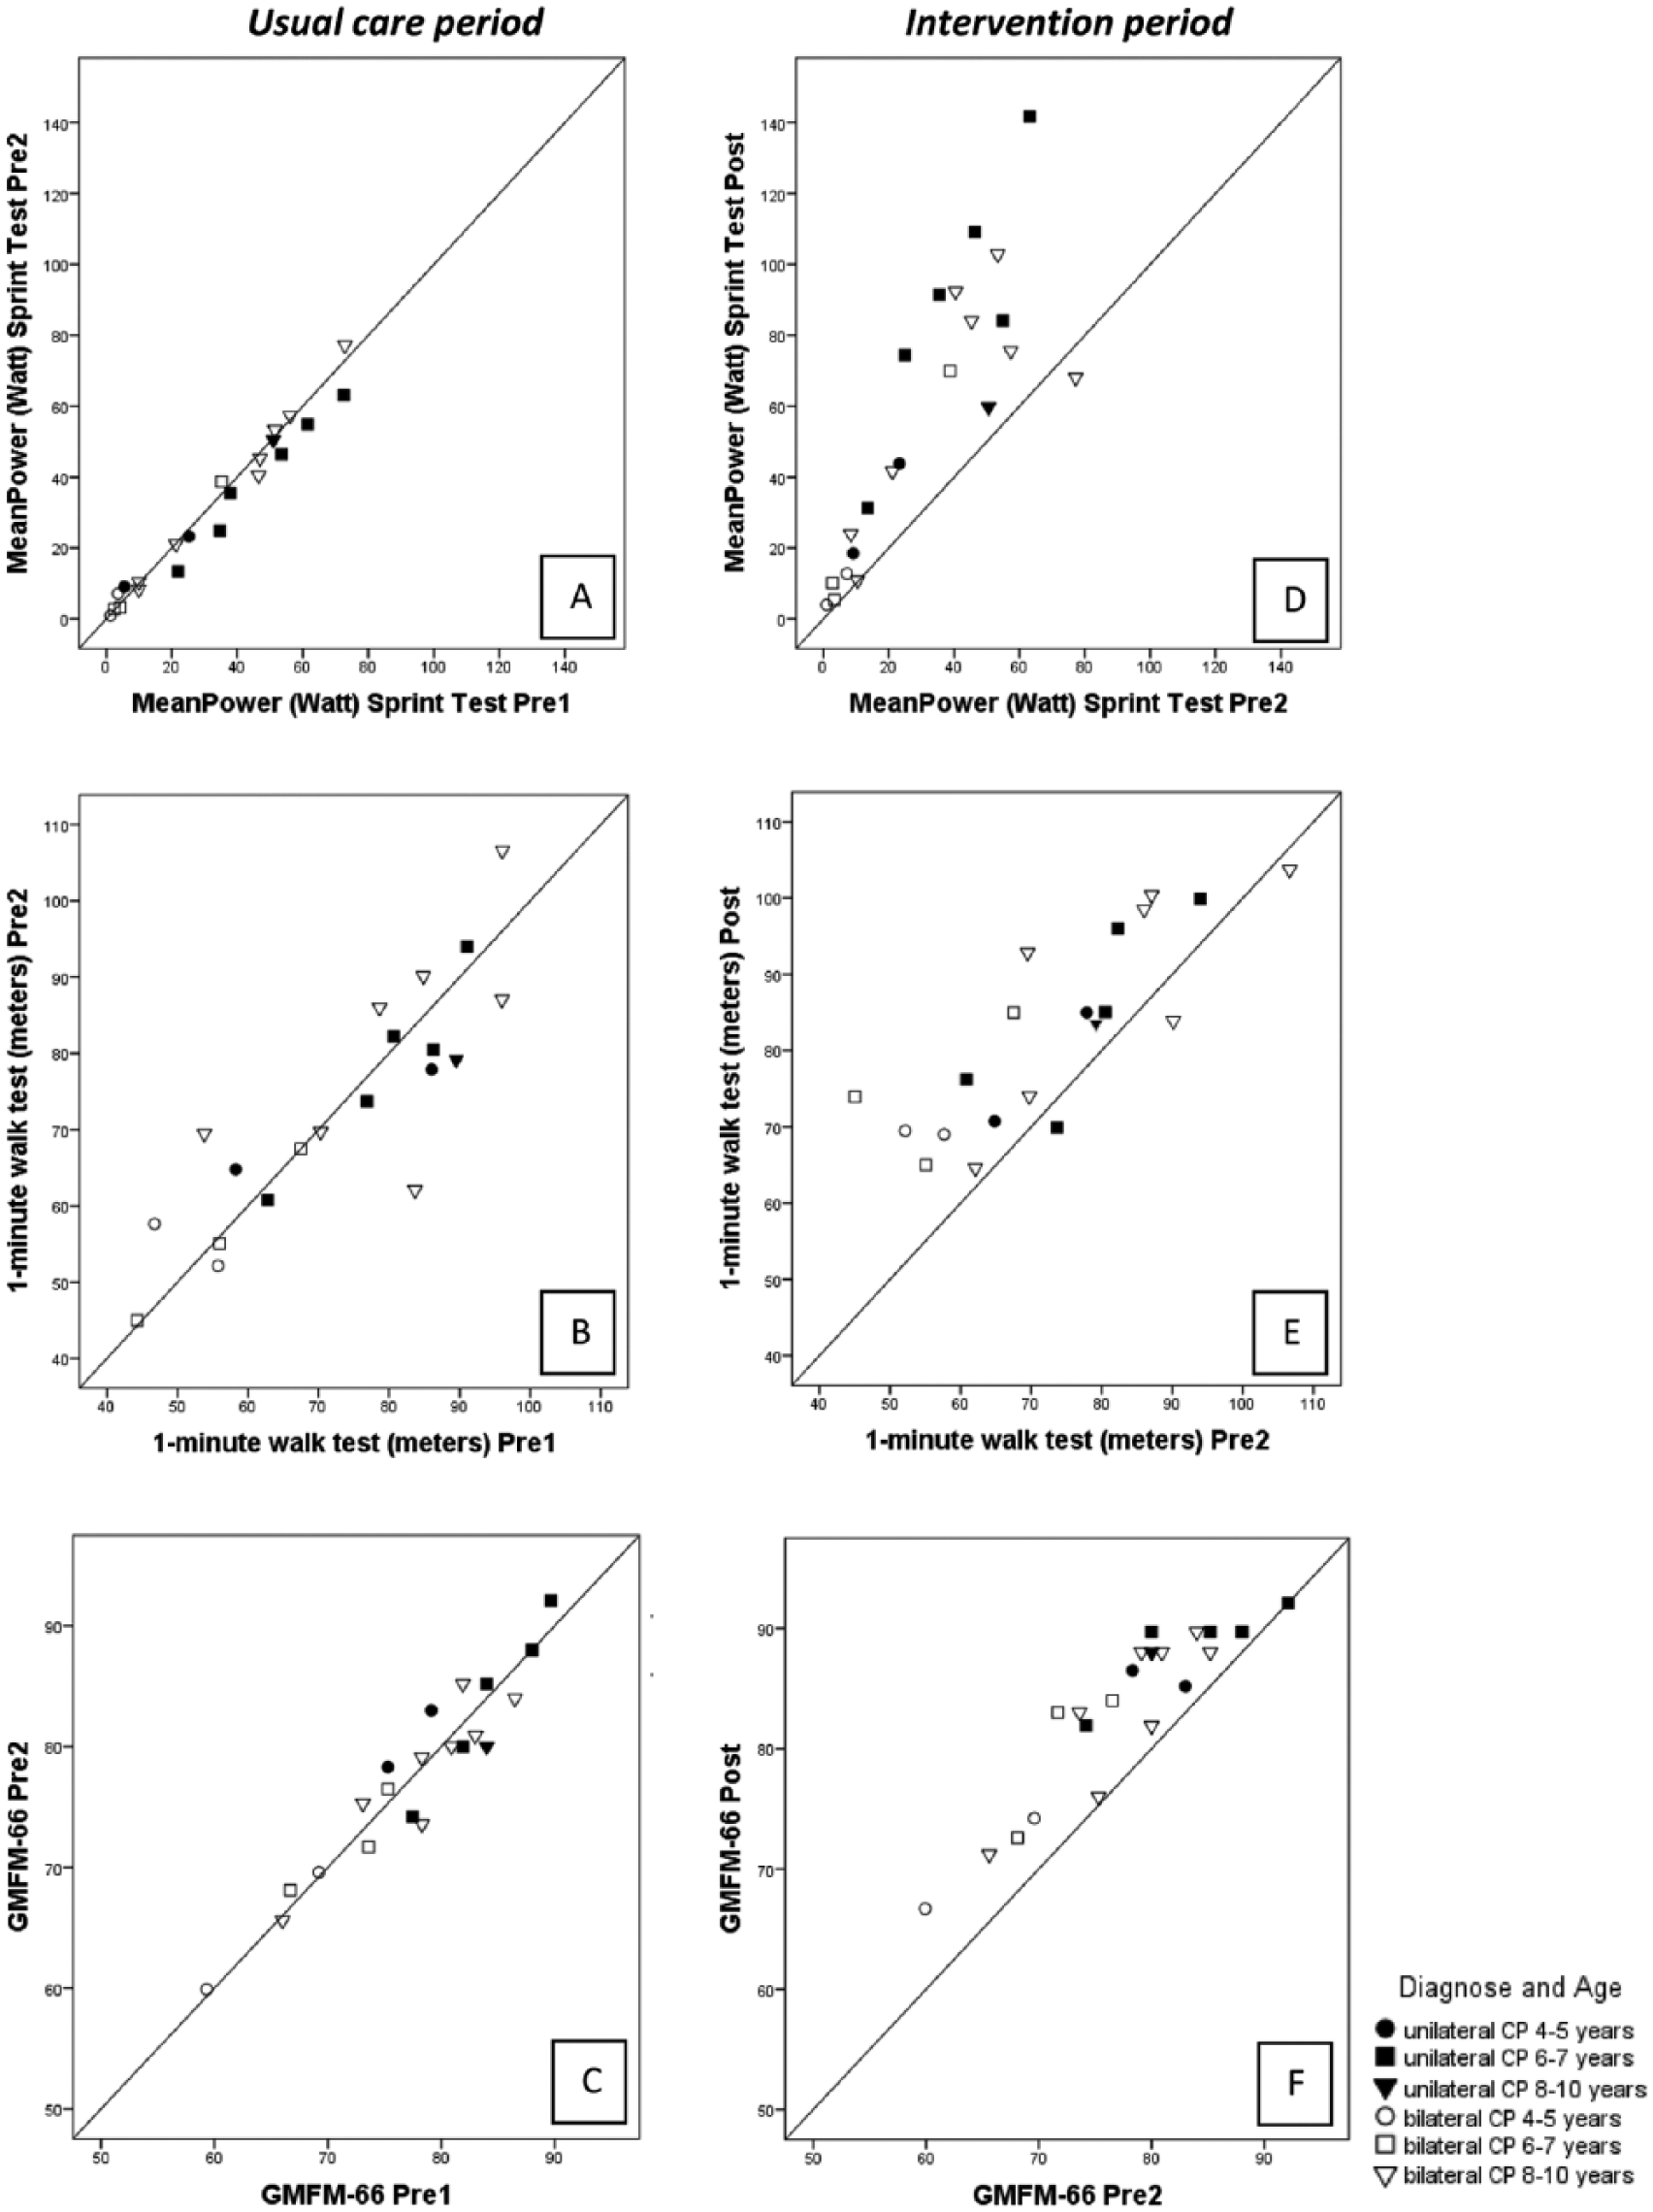
Individual changes in walking capacity variables and gross motor function in usual care period (A sprint capacity, B walking speed, C gross motor function) and in functional power-training period (D, E, F).
Muscle Strength
One participant could not perform the isometric plantar flexor muscle strength test (knees flexed and knees extended) of the most affected limb because of motor control problems.
All muscle strength variables showed significant increases during the functional power-training compared with the usual care period (Table 3).
There were no changes in the muscle strength variables in the usual care period; isometric strength of all muscle groups and dynamic muscle strength increased significantly in the functional power-training period (Table 4). There were no changes in muscle strength in the follow-up period except for the plantar flexors tested with the knees flexed, which showed a small further increase (from 14.9 N·m at Post to 15.8 N·m at Follow-up, P = .015).
The individual changes of the isometric and dynamic muscle strength of the participants in the plantar flexor muscles are illustrated in Figure 2.
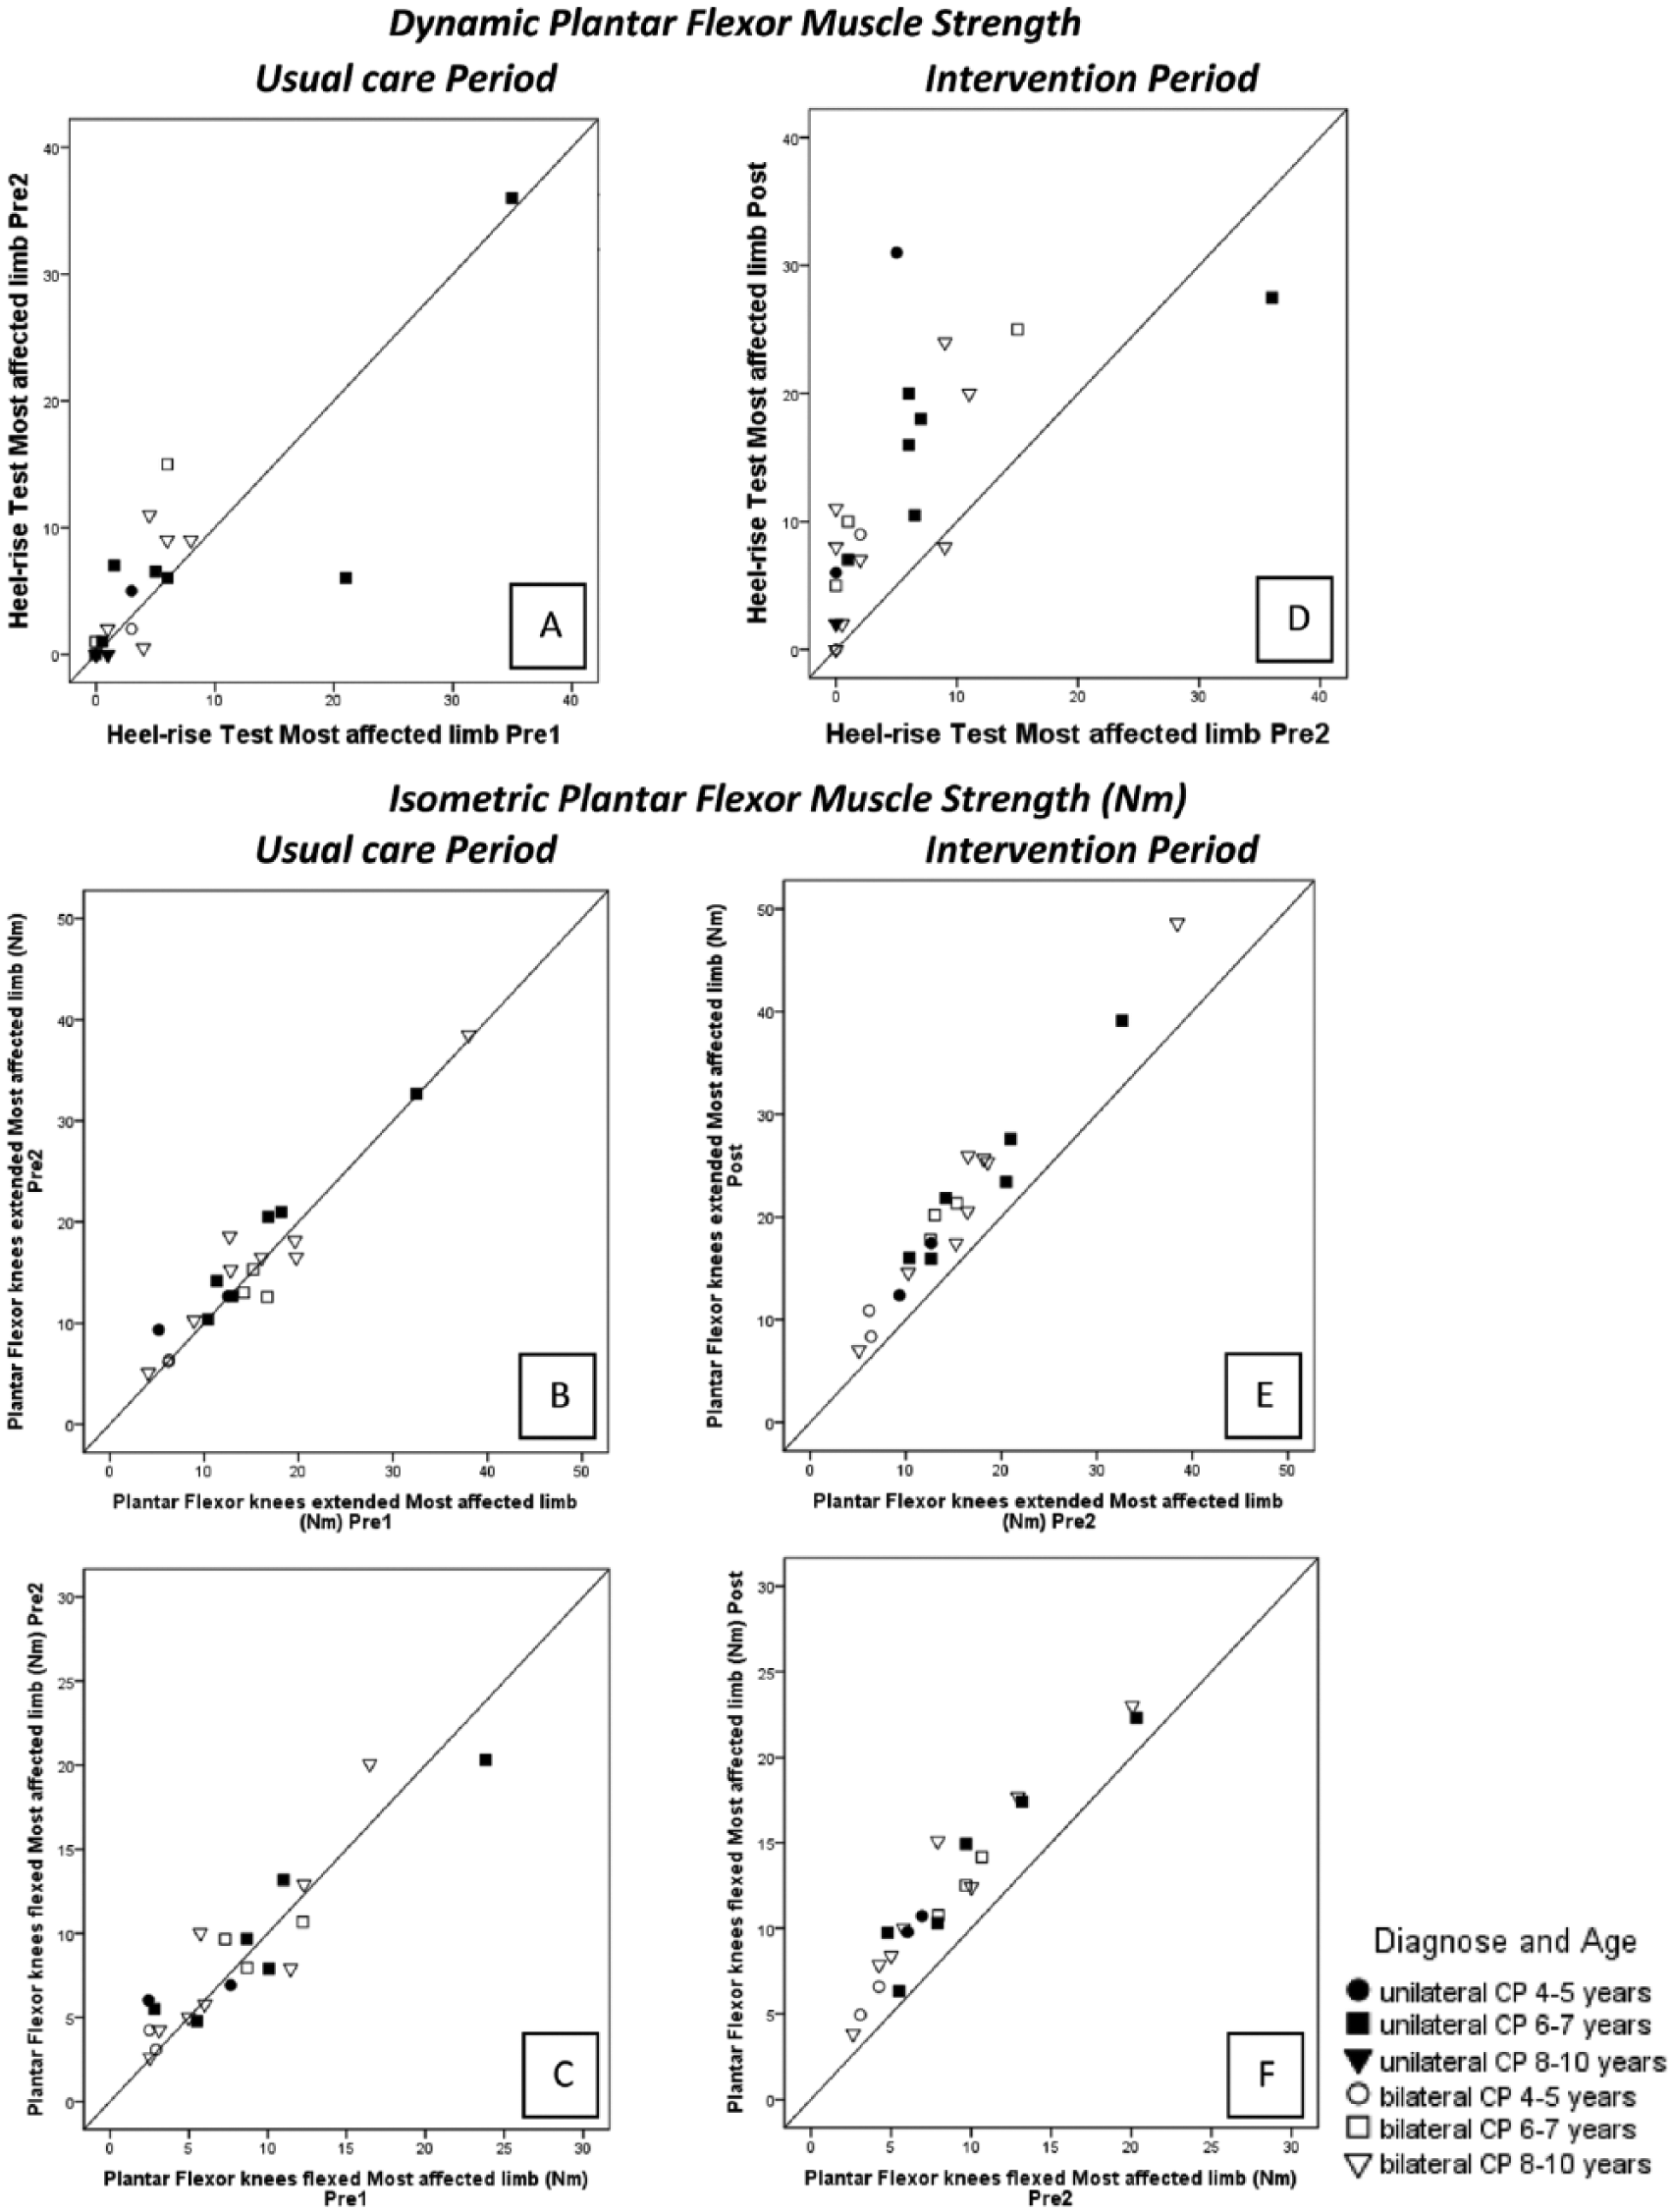
Individual changes in muscle strength variables in usual care period (dynamic strength [A] and isometric N·m [B, plantar flexor knees extended and C, plantar flexor knees flexed]) and in functional power-training period (D, E, F).
Adverse Events
There were no adverse events associated with the functional power-training. Two participants complained of foot pain in the first weeks of the training period. One participant had ankle pain during 1 week of the training period because of a fall at school, and 1 participant had knee pain because of activities in the weekend unrelated to the training. These 4 children were examined by their physicians, who found no serious injuries. The children did not miss any training session due to their foot or ankle pain.
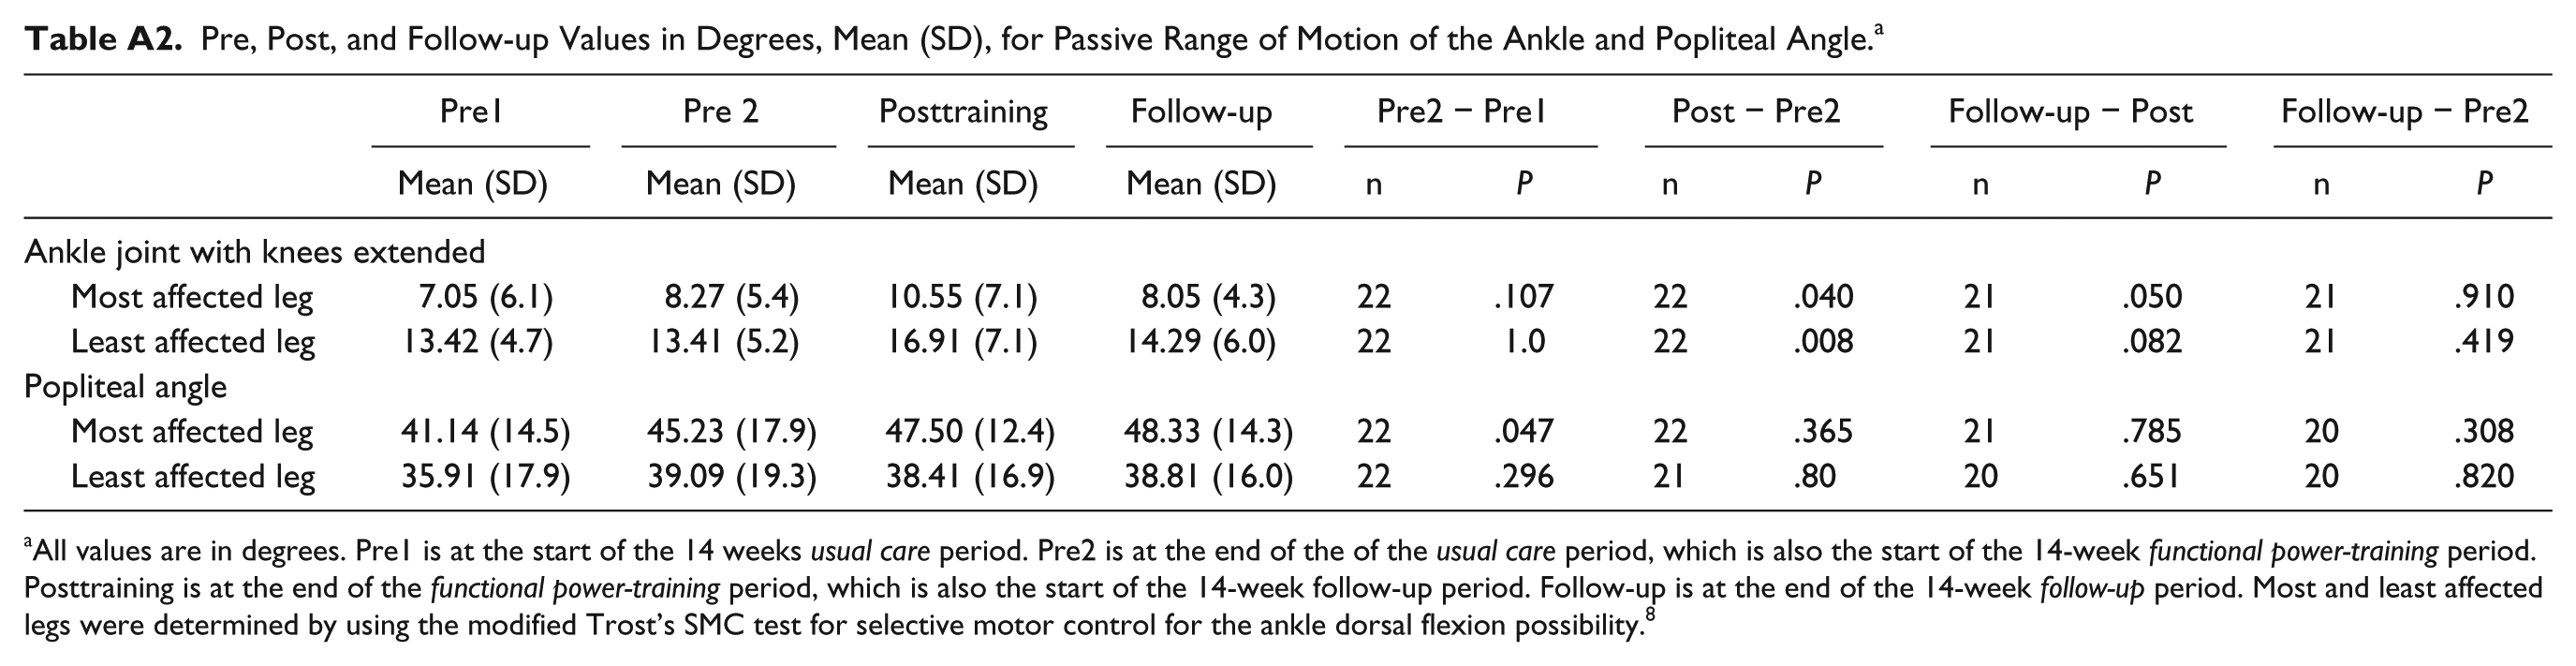
No muscle shortening was found after the functional power-training. Passive range of motion at the ankle joint and popliteal angle measurements are described in the appendix Tables A1 and A2b.
Discussion
The results indicate that power-training increases walking capacity and muscle strength. All outcome measures on the walking capacity showed substantial increases ranging from 13% to 83% after the functional power-training. Previous studies into conventional strength training programs have not found significant effects on the walking capacity of children with CP.10,11 The main differences between these conventional strength training programs and our functional power-training program is the specificity of the strength training: we used a higher movement velocity in the progressive loaded strength training exercises and incorporated strength exercises in functional movements like walking and sprinting.
The children in our study showed an increase of 83% in sprint capacity after the functional power-training, measured with the MPST, which was our primary outcome. In the follow-up period, a small but significant reduction (8.9%) in sprint capacity was found. Verschuren et al 30 found an increase of 25% in sprint capacity, also measured with the MPST, after a functional training program of 8 months, 2 times a week for 45 minutes, in children with CP (7-18 years). Their intervention had some factors that could be compared with our training intervention: they incorporated many running exercises with repeated bouts of 20 to 30 seconds, also used group training and they had the same training frequency (48 vs 42 training hours). The difference between the training programs was that our functional power-training program incorporated external load in the running exercises by letting the children push a weighted-chair and drag a weighted-box, thus ensuring enough resistance in the exercises for muscle strengthening. The added progressive load in the exercises may have partly induced the larger increase in sprint capacity in our study. Another difference is that we trained younger children (4-10 years old in our study vs 7-18 years), who may show more neural and muscular plasticity 31 and may therefore be more sensitive to changes in motor coordination necessary for increasing their sprint capacity. 20
The children in our study showed an increase of 13% in their walking velocity, measured with the 1MWT. This increase in walking velocity is larger than earlier increases of 4%, considered clinically relevant, 32 in a group of children with CP (9-17 years) who received a high-velocity strength training. 33 Our findings support the suggestion that the velocity in strength training exercises has to be higher than generally used in conventional strength training exercises in order to get functional improvements. Our results also suggest that adding specificity of strength exercises, that is, incorporation of the strength exercise in functional movements, further increases these improvements. 34
The specificity of the strength training exercises in our study—which ensured that the power generated by the muscles was directly related to walking capacity—has the potential of training motor performance such as coordination, strength, and endurance. 19 Improved coordination can be expected as a result of the repetitiveness of the functional exercises, which help refine the efficient motor patterns that are required for optimal functional performance like walking, sprinting, and climbing stairs. 35 In the present study, we combined this principle with progressive exercise, which may explain the large increases of 83% in sprint capacity. We also found an increase of 56% for the shuttle run test during the trainings period and a decrease of 14% in the follow-up period. A possible explanation for this increase is that the specificity of the strength exercises may have led to improved coordination of the muscles, which in turn may have led to an improved walking economy of the children, with a lower aerobic demand at equal velocity. 36 Another explanation may lie in the similarity of our training to that of high-intensity interval training (HIIT). Previous studies have shown that HIIT increases both the sprint and endurance in unimpaired subjects 37 and children with CP. 30 These improvements may be the result of peripheral adaptations within the muscles (ie, increased strength) rather than central adaptations (within the cardiopulmonary system). 38
We found larger improvements in plantar flexor muscles strength in the more affected—weaker—limb than in the less affected limb (isometric strength 34% increase in more affected limb versus 27% increase in less affected limb and dynamic strength 128% vs 80%). This contrasts with previous information that suggests that resistance training programs with multi-joint exercises strengthening of the target (weaker) muscles is prevented by compensation of other (less affected) muscle groups.19,21 Such compensations would yield larger improvements in muscle strength of the less affected limb, but we found the opposite. This could be explained by the specific and progressive character of the strength exercises; the children were forced to produce power with both legs. It is unknown to what extent strength improvements in other nonmeasured muscle groups, for example, hip flexors and extensors and the knee flexors, have contributed to the observed functional improvements. To reduce the burden for the children we limited strength assessments to the plantar flexors, knee extensors and hip abductors.
Some, but not all, of the functional effects persisted in the follow-up period. Although we found a significant decrease in sprint capacity and in the shuttle run test, participants still had an increase in sprint capacity (67%) and in the shuttle run test (33%) at the end of the follow-up period compared with the start of the functional power-training period. The increases in muscle strength were maintained in the follow-up period.
Some authors suggested that muscle tightness after muscle strengthening exercises might occur and consequently might have an adverse effect on gait. 39 In our study, however, a significant increase in the ankle range of motion (ROM) with knees extended (gastrocnemius muscle length) was found after the training period which decreased in the follow-up period. The changes are too small to be of clinical relevance but could be relevant for understanding the changes in muscle morphology after resistance exercise. Some of the exercises provoked the children to make larger steps than usual and to lean forward, which might have provided repeated dynamic stretches in the gastrocnemius muscles. A previous study with inclined treadmill gait training in adults with CP found similar ROM improvements. 40 Increased muscle length can also be explained by muscle fiber hypertrophy, which would lead to increased muscle length in highly pennate muscle like the gastrocnemius. 41 These findings indicate that the power training did not negatively affect muscle length, but may even have a positive effect on ROM of the ankle.
Clinical Significance
Walking capacity is important for children with CP, and it is often the aim of muscle strength training programs. There is, however, inconclusive evidence that strength training programs improve walking capacity. Nevertheless, our study suggests that strengthening interventions are effective in improving muscle strength and walking capacity in young children with CP if they involve high-velocity strengthening exercises incorporated in functional movements of sufficient intensity and volume (maximal effort, 3 sets of 6 to 8 repetitions), frequency (3 times a week) and duration (14 weeks). Our results also suggest that targeting the plantar flexor muscles might improve walking and sprinting performance.
Limitations
We used a double-baseline design instead of a randomized controlled trial (RCT) to increase the feasibility of our study in a heterogeneous group of children with CP. In this design, the children served as their own controls by comparing the changes in usual care period to the changes in during the functional power training period. As an RCT is considered the highest level of evidence, double-baseline could be considered as a limitation of the study. However, the double-baseline design has been described as a good alternative in evidence-based rehabilitation for heterogeneous patient populations. 42 In addition, the number of children that are needed is less than in an RCT because similar statistical power can be reached with smaller groups, which makes the double-baseline design more feasible and less expensive. 42
Conclusions
The results indicate that functional power-training is an effective training to improve walking capacity and muscle strength in young children with cerebral palsy. As hypothesized, functional strength training at higher movement velocities resulted in improvements in both walking capacity and muscle strength.
Footnotes
Appendix
Pre, Post, and Follow-up Values in Degrees, Mean (SD), for Passive Range of Motion of the Ankle and Popliteal Angle. a
| Pre1 |
Pre 2 |
Posttraining |
Follow-up |
Pre2 − Pre1 |
Post − Pre2 |
Follow-up − Post |
Follow-up − Pre2 | |||||
|---|---|---|---|---|---|---|---|---|---|---|---|---|
| Mean (SD) | Mean (SD) | Mean (SD) | Mean (SD) | n | P | n | P | n | P | n | P | |
| Ankle joint with knees extended | ||||||||||||
| Most affected leg | 7.05 (6.1) | 8.27 (5.4) | 10.55 (7.1) | 8.05 (4.3) | 22 | .107 | 22 | .040 | 21 | .050 | 21 | .910 |
| Least affected leg | 13.42 (4.7) | 13.41 (5.2) | 16.91 (7.1) | 14.29 (6.0) | 22 | 1.0 | 22 | .008 | 21 | .082 | 21 | .419 |
| Popliteal angle | ||||||||||||
| Most affected leg | 41.14 (14.5) | 45.23 (17.9) | 47.50 (12.4) | 48.33 (14.3) | 22 | .047 | 22 | .365 | 21 | .785 | 20 | .308 |
| Least affected leg | 35.91 (17.9) | 39.09 (19.3) | 38.41 (16.9) | 38.81 (16.0) | 22 | .296 | 21 | .80 | 20 | .651 | 20 | .820 |
All values are in degrees. Pre1 is at the start of the 14 weeks usual care period. Pre2 is at the end of the of the usual care period, which is also the start of the 14-week functional power-training period. Posttraining is at the end of the functional power-training period, which is also the start of the 14-week follow-up period. Follow-up is at the end of the 14-week follow-up period. Most and least affected legs were determined by using the modified Trost’s SMC test for selective motor control for the ankle dorsal flexion possibility. 8
Acknowledgements
The authors thank all the children, parents, and trainers who participated.
Declaration of Conflicting Interests
The authors declared no potential conflicts of interest with respect to the research, authorship, and/or publication of this article.
Funding
The authors disclosed receipt of the following financial support for the research, authorship, and/or publication of this article: This study was funded by Mitialto Foundation, Duyvensz-Nagel Foundation, Dutch Rehabilitation Fund, and Royal Dutch Society for Physical Therapy.