
Abstract
Background and Objective. The course of central and peripheral motor recovery after cervical spinal cord injury (SCI) may be investigated by electrophysiological measures. The goal of this study was to compare the 2 over the first year after injury in relation to motor gains. Methods. Compound motor action potentials (CMAPs), motor-evoked potentials (MEPs), and F-waves were recorded from the abductor digiti minimi and CMAP and F-waves from abductor hallucis muscles in 305 patients at about 15 days, 1 month, 3 months, 6 months, and 12 months following an acute traumatic SCI. Results. The MEP amplitudes and F-wave persistences were lower with more severe sensorimotor impairment. They steadily increased in most subgroups within 6 months after SCI. The amplitude of the CMAPs was low for the first 3 months in the most severely affected participants. This was also found for CMAPs from tibial nerve originating well below the cervical lesion level. Improvement in neurophysiological parameters correlated with improved upper extremity motor scores. Conclusion. The results point to a systematic interrelation of corticospinal transmission, spinal motoneuron excitability, and its axon function, respectively. Electrophysiological correlates of neural excitability show distinct spatial and temporal interrelations within central and peripheral motor pathways following acute cervical SCI. A strong secondary deterioration within the peripheral motor system with incomplete or no recovery depends on anatomical distance caudal to lesion and on lesion severity. Electrophysiological assessments may increase the sensitivity of interventional studies in addition to clinical measures.
Introduction
Knowledge about the mechanisms of neurological and functional recovery after spinal cord injury (SCI) is necessary to optimize rehabilitative approaches or introduce novel therapies. However, the mechanisms of reorganization of neural circuits are difficult to assess in humans. Comprehensive electrophysiological measures such as compound motor action potentials (CMAPs), F-waves, and motor-evoked potentials (MEPs) allow noninvasive objective assessment of human motor circuitry and of the extent and level of SCI. 1
The CMAP is defined as the sum of all motor unit action potentials in the muscle obtained by supramaximal electrical nerve stimulation. Its amplitude is a derivate of the number and size of the motor units in the peripheral nerve. 2 F-waves are a valuable technique for monitoring spinal alpha-motoneuron excitability3-6; however, not for short-term changes. 7 They represent late responses to stimulation of peripheral nerves and were first described by Eccles and Pritchard 8 as a recurrent discharge reflecting backfiring of a small number of motoneurons in a probabilistic manner (percentage of recurrent discharges termed persistence). F-waves are reduced or absent during spinal shock, which was attributed to reduced excitability of spinal alpha-motoneurons due to the loss of tonic input or trophic support from supraspinal to spinal neuronal centers.9-11 MEPs are a marker for excitability changes that occur within the central nervous system, including cortical motor areas or corticospinal tracts.1,12,13 The amplitude of the MEP also depends on axonal damage of nerve roots or peripheral motor nerves. 14 Several studies showed considerable deficits in the peripheral motor nerves following traumatic SCI15-18 even in motoneurons clearly located below the spinal segments of the lesion. Given this notion, recovery of motor function is assumed to involve changes of both central and peripheral motor systems. The timing, extent, and relative contribution of these systems to the recovery and their relation to type and severity of SCI have not been examined systematically. The main goal of this study was to quantify and attribute recovery to specific neuroanatomic locations within the motor system and determine relation to clinical outcomes (ie, neurological and functional scores of the upper extremity). We hypothesized that repeated simultaneous neurophysiological assessments with CMAP, F-waves, and MEP would show excitability changes over time at various levels of the central and peripheral motor systems that may give valuable insight into mechanisms of motor recovery after SCI.
Methods
Database and Subject Selection
This study included acute traumatic SCI subjects enrolled between December 2001 and June 2012 in 8 centers within the framework of the “European Multicenter Study about Spinal Cord Injury” (EMSCI; www.emsci.org). The study was performed in accordance with the Declaration of Helsinki and was approved by the local ethics committees of the participating centres. Informed consent was obtained from each subject. Data on neurological, neurophysiological, and functional status were prospectively collected within the first 15 days (termed “15D”), at 1 month (16-40 days, “1M”), 3 months (70-98 days, “3M”), 6 months (150-186 days, “6M”), and 12 months (300-400 days, “12M” phases) after an SCI. Only subjects with at least 2 repeated assessments were included. Subjects suffering from an acute accompanying head trauma or other neurological disorders were excluded.
Neurological Assessments
Neurological examinations were performed by clinicians trained in SCI rehabilitation according to the International Standards for Neurologic Classification of Spinal Cord Injury (ISNSCI) 19 of the American Spinal Injury Association (ASIA). The subjects were grouped as ASIA Impairment Scale (AIS) A (motor-sensory complete), B (motor complete, sensory incomplete), C (motor-sensory incomplete), D (motor-sensory incomplete, majority of key muscles below the lesion show movement against gravity), and E (no sensory or motor deficits determinable by ISNCSCI). Five key muscles of each side were tested and scored (0 = total paralysis, 1 = palpable or visible contraction, 2 = active movement with gravity eliminated, 3 = active movement against gravity, 4 = active movement against some resistance, 5 = active movement, against full resistance). Each muscle represents the function of a spinal segment (elbow flexors, C5; wrist extensors, C6; elbow extensors, C7; finger flexors, C8; small finger abductor, T1). 20 The sum of all 10 key muscles was expressed as upper extremity motor score (UEMS) with a maximum value of 50.
Assessment of Disability
The functional status was evaluated with the Spinal Cord Independence Measure (SCIM)21-23 that assesses the functional capabilities in the domains “self-care” (maximal points = 20); “respiration and sphincter management” (maximal points = 40) and “mobility” (maximal points = 40). The domain of self-care that best describes upper extremity motor function 24 consists of 6 items (feeding; bathing upper/lower body; dressing upper/lower body; grooming). Each item is graded for increasing difficulty; the higher the grade, the better the patient’s performance. The assessments were conducted by physical and occupational therapists and/or nurses experienced in the field of SCI.
Electrophysiological Recordings
MEPs were recorded as reported elsewhere. 1 For stimulation of the abductor digiti minimi (ADM) muscle on both sides, the stimulation hot spot was determined by stepwise optimizing coil position to obtain a maximum ADM MEP following standard published procedures.1,25,26 ADM MEPs were recorded at 1.2 times motor threshold. Subjects with preserved motor function were instructed to slightly contract their ADM muscles (about 10% of maximum force). Patients were asked to produce as much muscle force as possible. Three to 5 representative ADM-MEPs at the desired stimulus intensity were applied if there was a visible muscle response. 27 Three responses were stored offline for further analysis. 28 The onset of the fastest response from 3 ADM MEP trials was determined as the onset latency. The ADM MEP amplitude was measured from baseline to the negative peak (ie, the highest negative peak in polyphasic potentials) for the largest response out of 4 trials. ADM-MEP measures from both sides were analyzed.
Central motor conduction times (CMCT) of the ADM MEP were calculated according to Rossini et al 25 (CMCT = MEP − [M + F + 1]/2; where MEP = corticomuscular latency of the motor-evoked potential, M = latency of the M wave, a short latency response induced by an orthodromic volley in the motor nerve; F = shortest latency of at least 20 reliable F-wave responses; 1 = time for reexcitation of the spinal motoneurons) and were normalized (corticomuscular latency × 170 cm/body height [cm]) and classified according to laboratory reference values.
Motor nerve conduction studies were performed according to clinical standards (see Neurophysiology Manual used within EMSCI, www.emsci.org). CMAPs of the ADM at the upper extremity and abductor hallucis (AH) muscles at the lower extremity were recorded with surface electrodes with the active electrode placed over the motor point of the ADM or the AH, respectively, and the reference electrode at the base of the fifth digit or the first toe. The stimulation intensity of the constant current rectangular stimulation pulses (pulse width 0.2 ms) was set to a supramaximal level (1-100 mA). The CMAP amplitude was measured from baseline to the negative peak in millivolts.
F-wave responses were recorded as part of the motor nerve conduction measurements (ADM and AH muscles) and 20 supramaximal stimuli were applied. The persistence (ie, the percentage of F-wave responses to 20 consecutive stimuli) and F-wave latencies were assessed. The sensitivity for the evaluation of F-waves was set to 200 μV per division and amplitudes ≥50 μV were included in the further analyses. F-wave latencies were normalized to body height (F-wave latency × 170 cm/body height [cm]).
Printouts of the electrophysiological data (CMAP, MEP, and F-wave curves of each patient) were monitored by a blinded neurophysiologist at the lead center (Zurich) to ensure compliance with the standards and to reduce interrater variability.
Statistics
Patients were allocated to 5 groups according to lesion severity based on criteria of MEP deterioration and evolution during follow-up examinations. This categorisation scheme allows for objective discrimination by neurophysiological criteria standardizing the assessment procedure without dependence on patient cooperation or subjective rating of motor grades and sensory sparing. It has been shown to produce robust stratification of lesion severity with relation to functional outcome and independence within patient subgroups.29-31 The subgroups were termed abolished MEP (aMEP) in cases where ADM MEP remained abolished in all assessment stages (15D to 12M); reappearing MEP (rMEP) in cases with initially abolished ADM MEP, but consistent re-appearence in at least one out of 4 possible follow-up examinations until stage 12M; inconsistent MEP (iMEP) where patients occasionally (ie, in at least 1 out of 5 possible measurements) showed ADM MEP responses that, however, were not retrievable at 12M; mildly or severely deteriorated MEP (mdMEP, sdMEP) if ADM MEPs could be attained in all available assessments with either normal (mdMEP) or delayed CMCT (sdMEP). The cutoff value for the presence/absence of an ADM MEP was a reproducible potential with amplitude of at least 100 µV above background electromyographic activity.25,32,33 Data are given as means and standard error (SE), unless specified otherwise.
A linear mixed model (LMM) approach was chosen similar to former evaluations.29-31 All analyses were performed with SPSS 22.0 for Windows.
For the correlation of electrophysiological data, SCIM and UEMS and the evaluation of changes over time, Pearson correlations between absolute values and stage interval changes were calculated. Delta changes over time were calculated by subtracting ADM MEP amplitudes, CMAPs, F-wave persistence, SCIM self-care subscores and UEMS of each earlier stage from those of the corresponding subsequent stage. Independent-samples Kruskal-Wallis test was performed to analyse distribution of AIS according to stratification by ADM MEP criteria.
Results
Demographics
A total of 305 acute traumatic tetraplegic SCI subjects were included (mean age 46 ± 20 years, mean body height of 175 ± 9 cm, 77% male, 15.7% AIS A, 13.8% AIS B, 13.1% AIS C, 55.7% AIS D and 1.6% were AIS E at the last examination stage) (Table 1); neurological level of injury: C2 4%, C3 14%, C4 30%, C5 30%, C6 13%, C7 6%, C8/T1 3%).
SCI Subjects’ Demographics and 12-Month Outcome of AIS Within the Different Groups of Spinal Cord Damage Defined by MEP Recordings. a
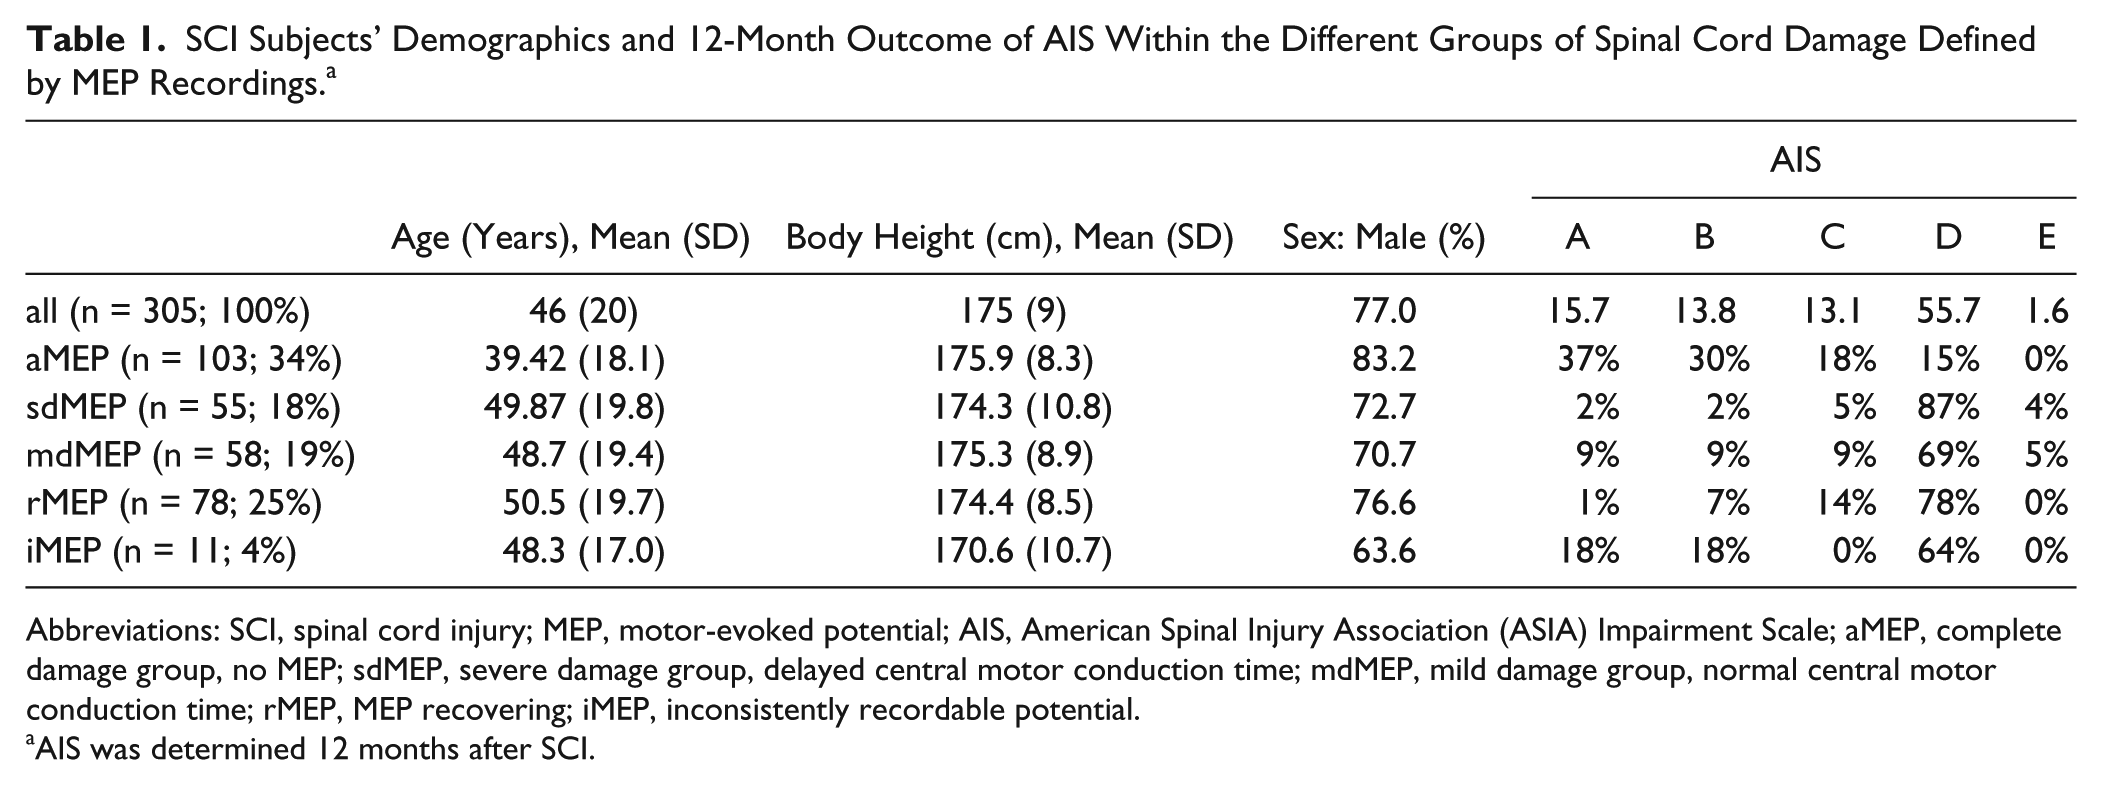
Abbreviations: SCI, spinal cord injury; MEP, motor-evoked potential; AIS, American Spinal Injury Association (ASIA) Impairment Scale; aMEP, complete damage group, no MEP; sdMEP, severe damage group, delayed central motor conduction time; mdMEP, mild damage group, normal central motor conduction time; rMEP, MEP recovering; iMEP, inconsistently recordable potential.
AIS was determined 12 months after SCI.
Group Allocation
In 34% of SCI subjects, ADM MEPs were abolished throughout all measurements (aMEP). In 19% an ADM MEP was recordable at all assessment stages and data were classified as “mildly deteriorated” as the CMCT of the ADM-MEP was normal at the first available assessment (mdMEP), while in 18% of cases the CMCT of the ADM-MEP was initially delayed resulting in classification as “severely deteriorated” (sdMEP). Initially abolished but consistently “reappearing” ADM MEPs in the follow-up examinations were found for 25% of cases (rMEP). In 4% of subjects, inconsistently recordable potentials (iMEP) were found.
Since there was no statistical difference between measures obtained from both body sides, only right-sided measures were analysed in all following evaluations.
Evolution of ADM MEP Amplitudes and CMCT
Because of definition of group criteria, effects of stage (time since SCI) could only be evaluated for 2 of the 5 subject groups (mdMEP and sdMEP). We found a main effect of stage (F = 19.9, df = 220.8, P < .001; Table 2) with larger amplitudes in later stages, as well as a group effect (mdMEP vs sdMEP) with larger amplitudes in the mdMEP group (F = 12.294, df = 106.1, P = .001) and a group by stage interaction (F = 19.6, df = 222.2, P < .001). Subgroup analysis revealed an increase of MEP amplitudes in both the sdMEP (F = 14.6, df = 105.9, P < .001) and mdMEP group (F = 6.5, df = 111.0, P < .001) (Figure 1A).
Upper Extremity Electrophysiological and Clinical Measures.
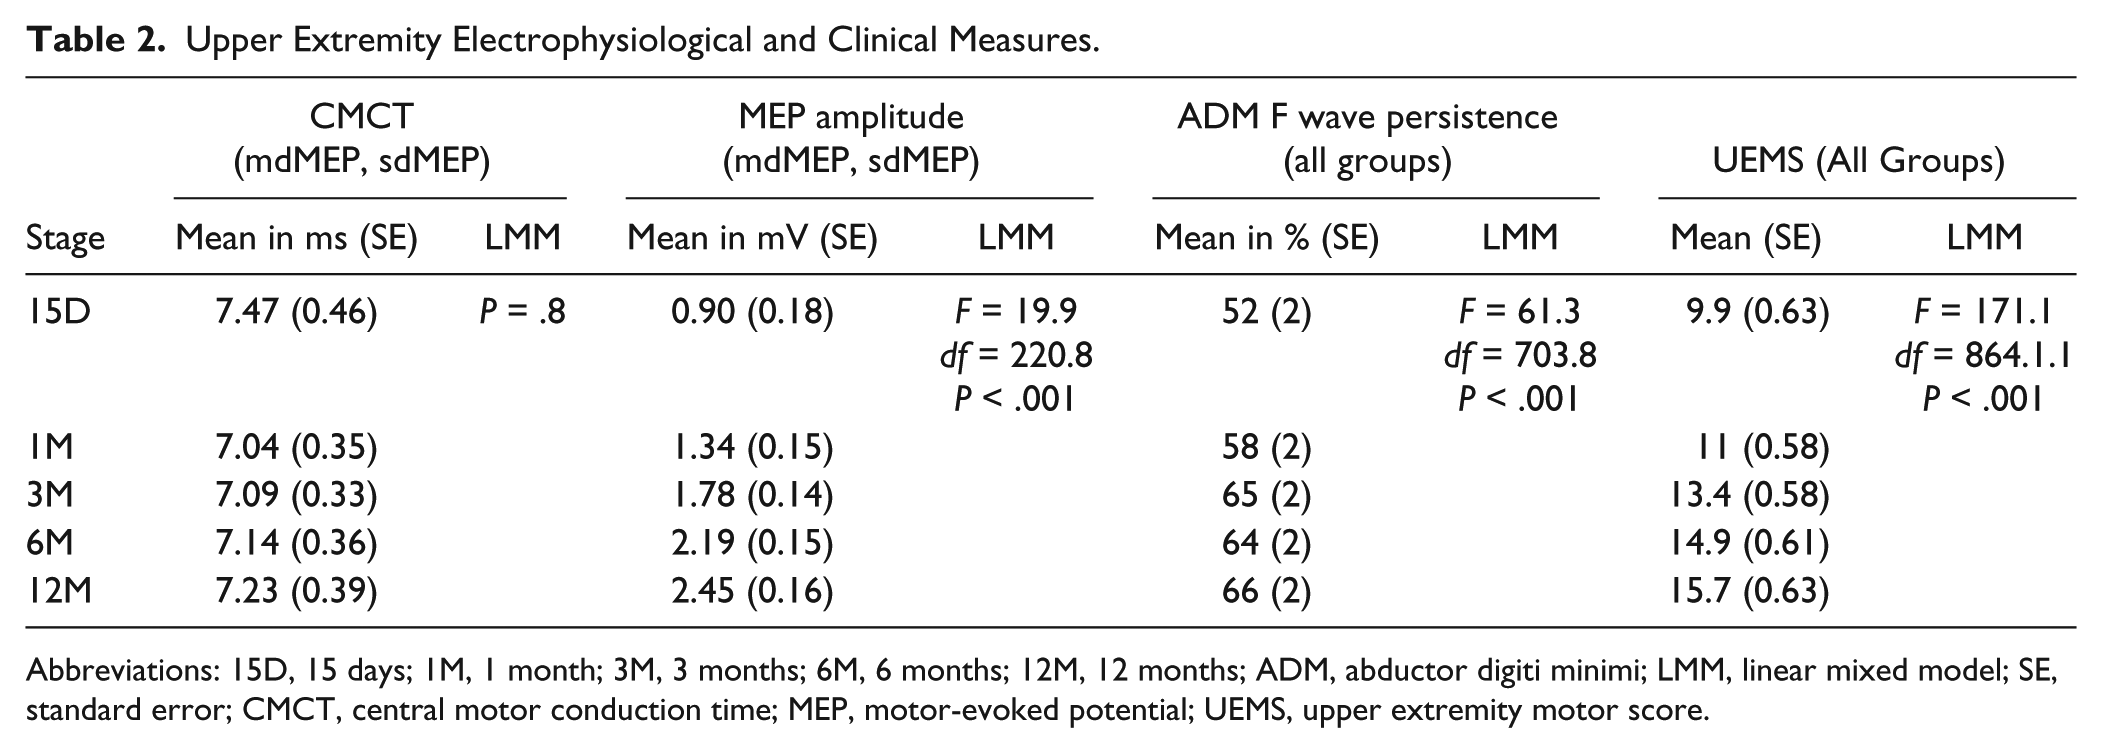
Abbreviations: 15D, 15 days; 1M, 1 month; 3M, 3 months; 6M, 6 months; 12M, 12 months; ADM, abductor digiti minimi; LMM, linear mixed model; SE, standard error; CMCT, central motor conduction time; MEP, motor-evoked potential; UEMS, upper extremity motor score.
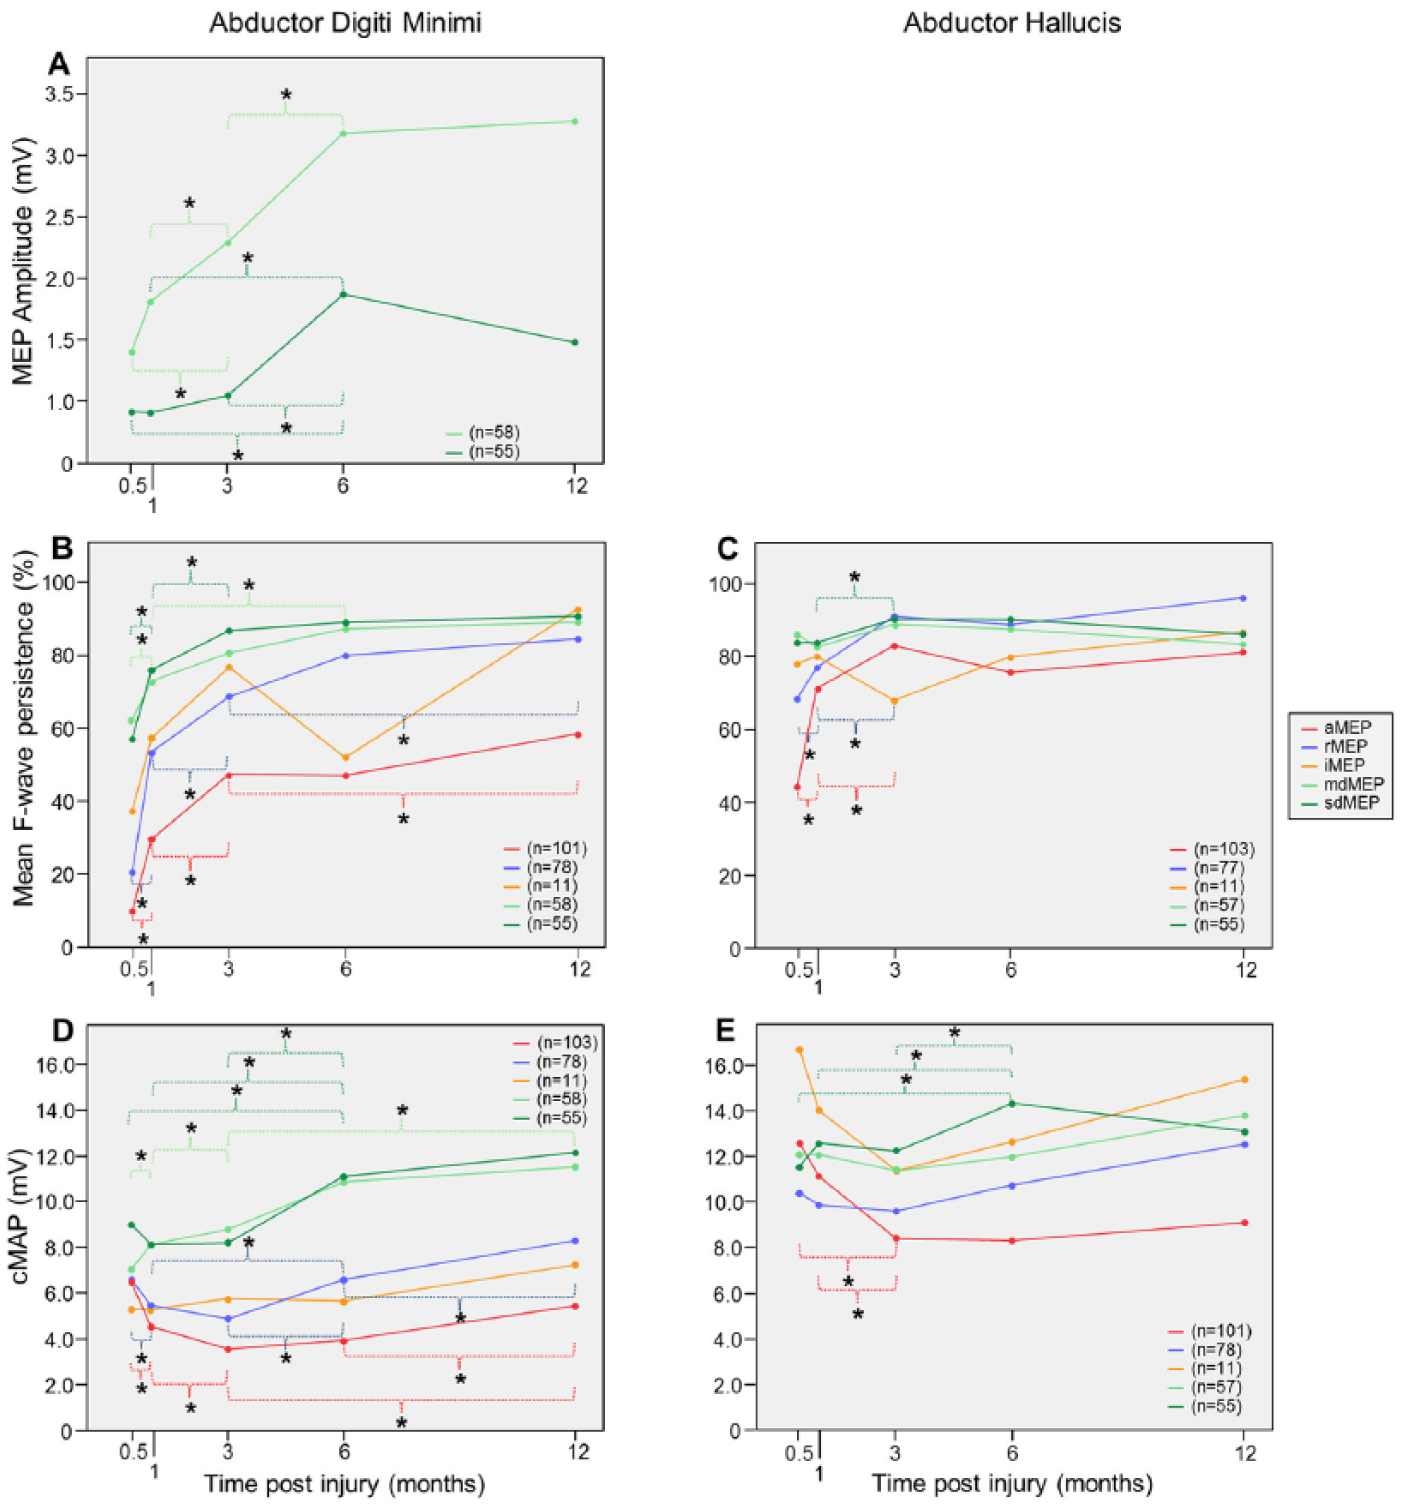
Evolution of mean abductor digiti minimi (ADM) motor-evoked potential (MEP) amplitudes (A); evolution of ADM (B, C) and abductor halluces (D, E) mean F-wave persistence and mean compound motor action potential (CMAP) amplitudes. Significant changes (P < .05) are indicated by asterisk.
Because of definition of group criteria, effects of stage (time since SCI) could only be evaluated for the mdMEP and sdMEP groups. LMM analysis of ADM MEP CMCTs revealed no overall effect of stage, thus CMCT remained stable within groups.
LMM analysis of ADM MEP amplitudes revealed an overall effect of AIS grades (F = 9.4, df = 292.6, P < .001). In AIS E patients, ADM MEP amplitudes were significantly higher than in AIS A, B, C, and D patients. In AIS D patients, ADM MEP amplitudes were significantly higher than in AIS C, B, and A patients.
Evolution of ADM CMAPs
LMM analysis of ADM CMAPs revealed an overall effect of stage (F = 23.0, df = 696.3, P < .001). There was a trend for decline of ADM CMAPs between 15D and 3M. ADM CMAPs were larger at 6M and 12M than at 15D, at 6M and 12M than at 1M, at 6M and 12M than at 3M, and at 12M than at 6M. There was a group effect (F = 26.725, df = 1774 476, P < .001) with smaller ADM CMAPs in the aMEP than in the rMEP, mdMEP, and sdMEP groups, smaller ADM CMAPs in the rMEP than in the mdMEP and sdMEP groups, and smaller ADM CMAPs in the iMEP than in the mdMEP and sdMEP groups. Group by stage interaction was significant (F = 23.6, df = 692.0, P < .001) (Figure 1D).
Evolution of ADM MEP/ADM CMAP Ratio
Analysis of ADM MEP/ADM CMAP ratio was performed to evaluate MEPs independent from peripheral motor nerve activation. There were significant main effects for stage (F = 4.9, df = 214.9, P = .001) and group (F = 19.8, df = 105.5, P < .001). ADM MEP/ADM CMAP ratios were smaller in the sdMEP than in the mdMEP group. Group by stage interaction was also significant (F = 4.9, df = 217.5, P = .001).
Evolution of ADM F-Waves
For ADM F-wave persistence an effect of stage (F = 61.3, df = 703.8, P < .001; Table 2) was shown with an increase over time as well as a group effect (F = 25.6, df = 276.1, P < .001) and group by stage interaction (F = 61.3; df = 709.0, P < .001) (Figure 1C). In the aMEP group, ADM F-wave persistence was lower (P < .001) than in all other groups. In the rMEP group, ADM F-wave persistence was lower than in the mdMEP (P < .005) and sdMEP (P < .001) groups. In the sdMEP and mdMEP groups, ADM F-wave persistence did not differ.
Arm F-wave persistences correlated with ADM MEP amplitudes (r = 0.34, P < .001), UEMS (r = 0.4, P < .001), total SCIM score (r = 0.42, P < .001), and the SCIM self-care subscore (r = 0.36, P < .001).
Evolution of AH CMAPs
LMM analysis of AH CMAPs revealed an overall effect of stage (F = 4.6, df = 694.8, P = .001). AH CMAPs were smaller at 3M than at 15D, smaller at 3M than at 1M, larger at 6M than at 1M and larger at 12M than at 3M. There was a significant group effect (F = 3.5, df = 290.9, P < .01) with smaller AH CMAPs in the aMEP than in the mdMEP and sdMEP groups, and smaller AH CMAPs in the rMEP than in the mdMEP and sdMEP groups. There was also a group by stage interaction (F = 4.2, df = 686.5, P < .005) (Figure 1E). It is noteworthy that in the most severely affected cases (aMEP), other than for ADM CMAPs, AH CMAPs did not recover after initial amplitude loss occurring until the third month after SCI.
Evolution of AH F-waves
For AH F-wave persistence an effect of stage (F = 18.2, df = 720.0, P < .001) was shown with an increase over time as well as a group effect (F = 3.9, df = 283.2, P < .005) and group by stage interaction (F = 19.2, df = 712.6, P < .001) (Figure 1C). In the aMEP group, AH F-wave persistence was significantly lower than in the rMEP, mdMEP, and sdMEP groups.
Evolution of UEMS
Main effects of stage (F = 171.1, df = 864.3, P < .001) (Table 2) and group (F = 55.6, df = 267.9, P < .001) as well as group by stage interaction (F = 170.5, df = 854.3, P < .001) (Table 3) were found for the LMM for UEMS of all 5 groups. UEMS of aMEP SCI subjects were significantly and considerably lower than those of all other groups. UEMS of the rMEP group were lower than those of the sdMEP and mdMEP groups (P < .001). UEMS of the iMEP group were lower than those of the mdMEP and sdMEP groups. UEMS of the sdMEP group was significantly lower than that of the mdMEP group.
Means and Standard Errors of LMM Analyses Listed for Group by Stage Interaction. a
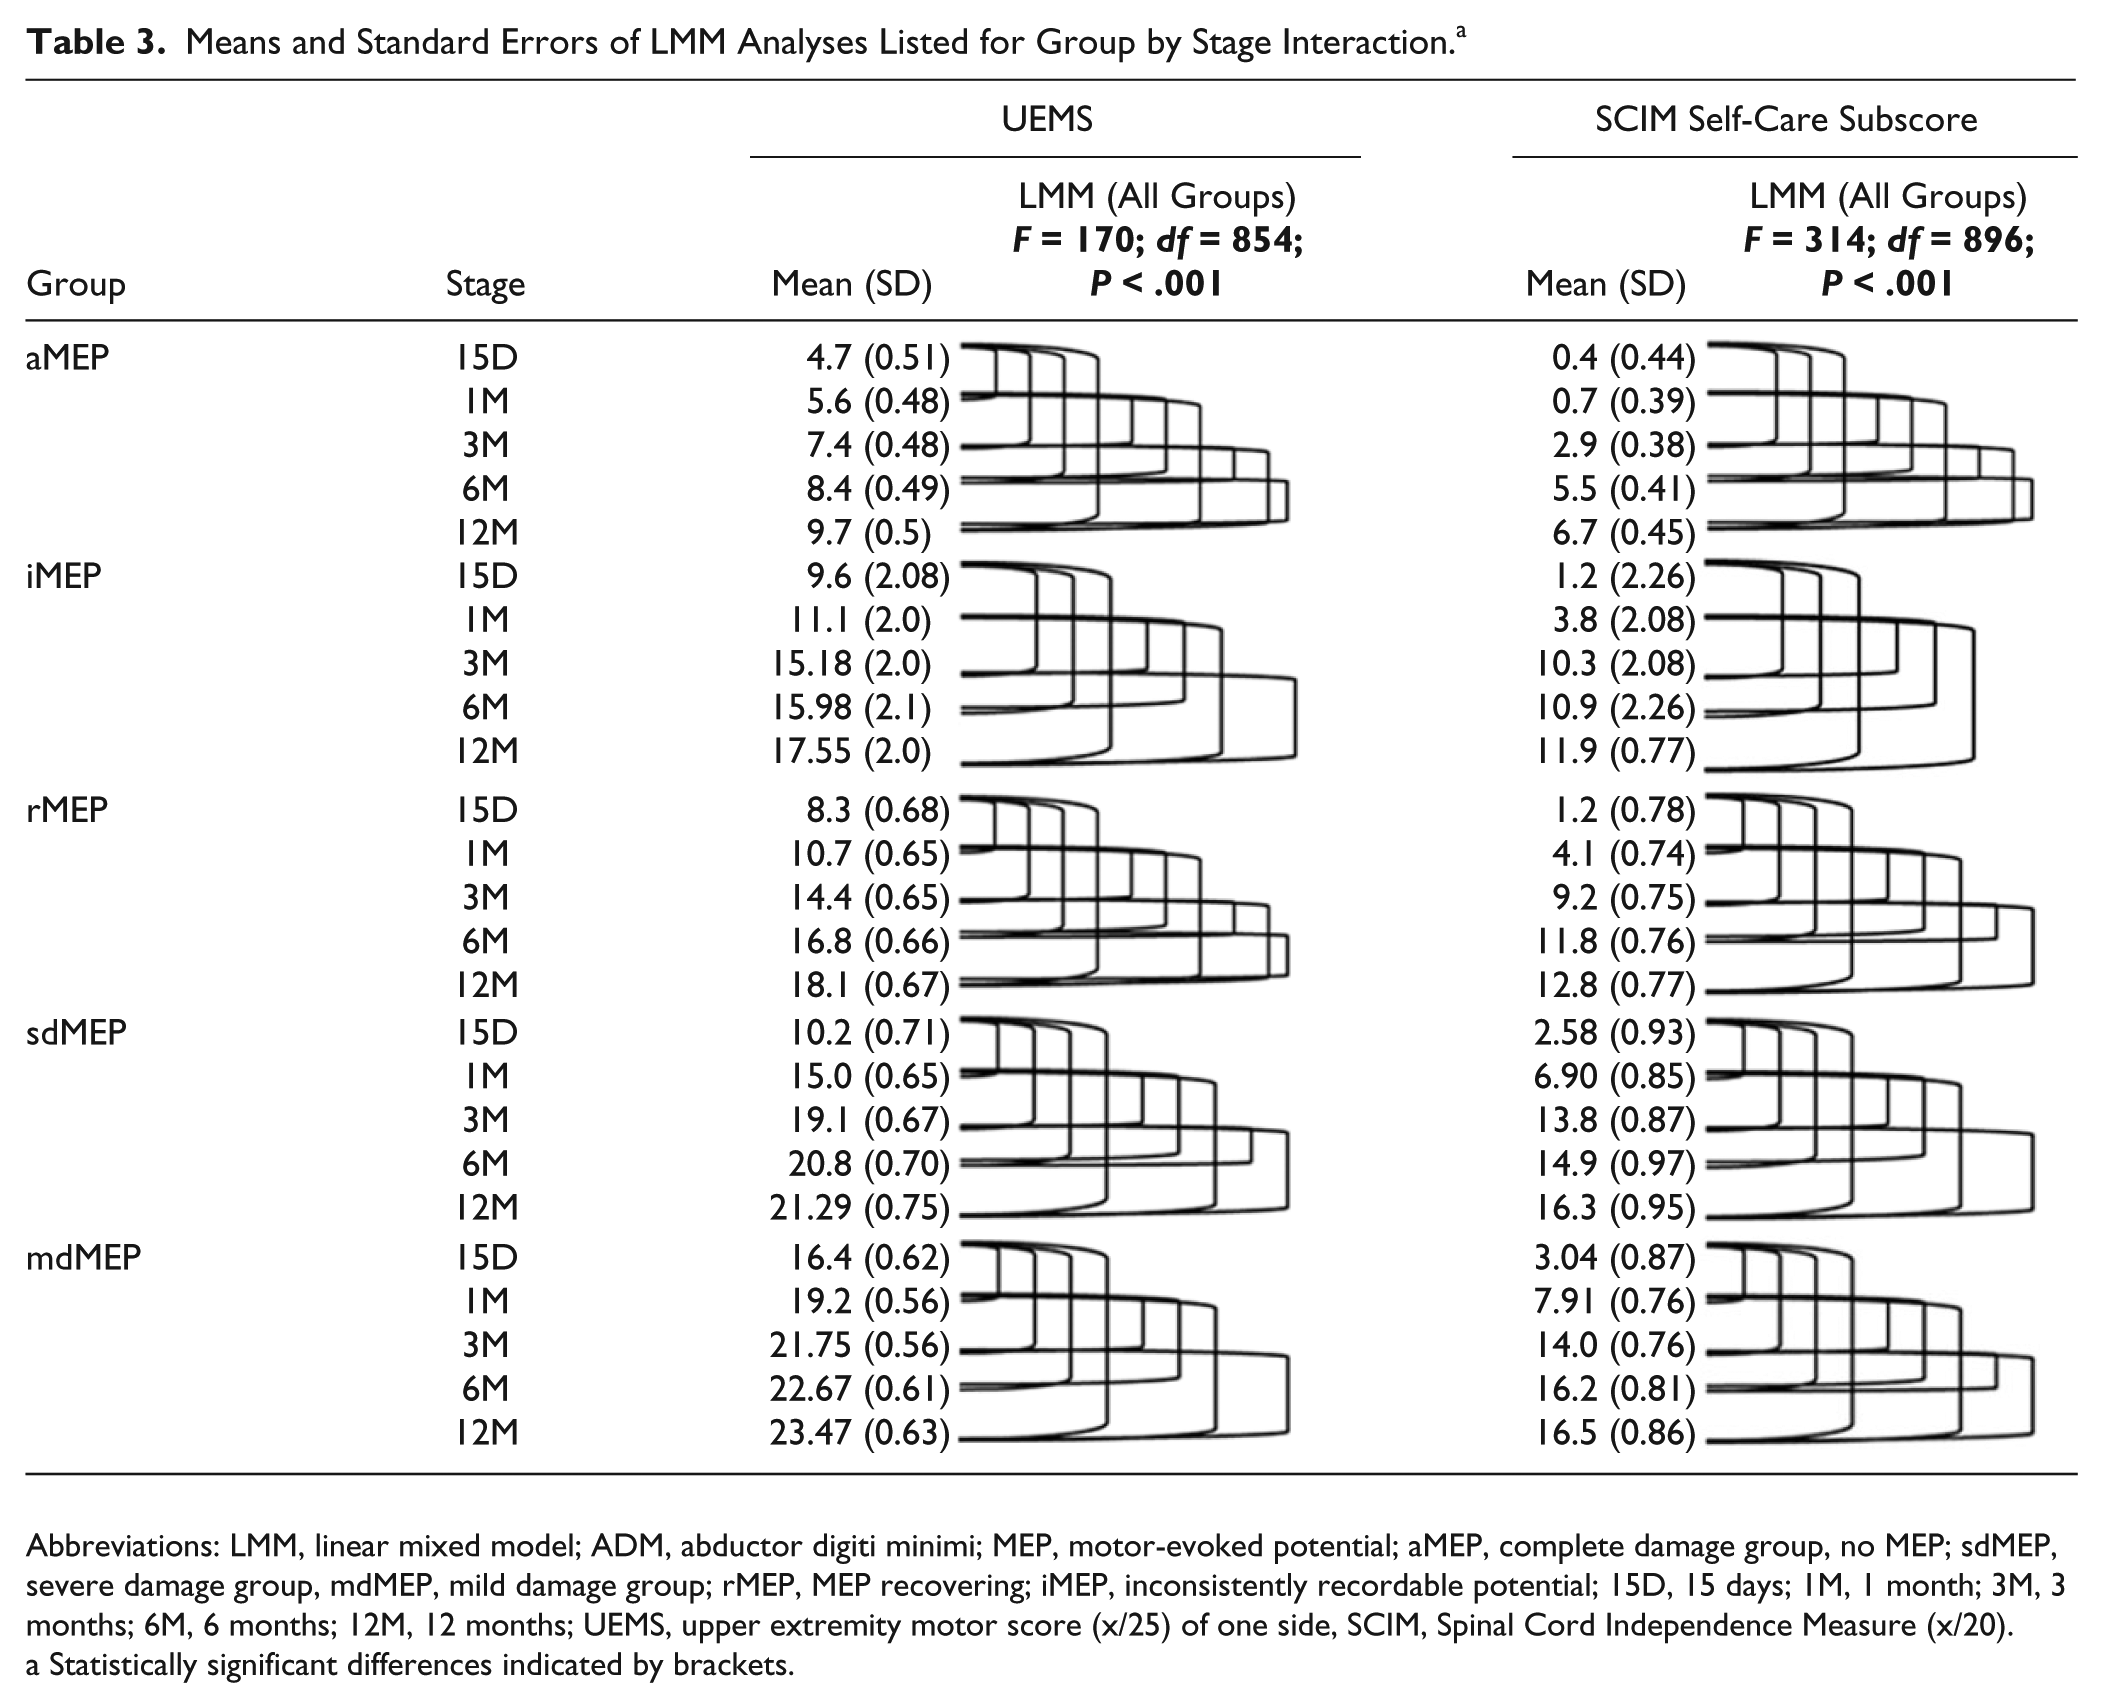
Abbreviations: LMM, linear mixed model; ADM, abductor digiti minimi; MEP, motor-evoked potential; aMEP, complete damage group, no MEP; sdMEP, severe damage group, mdMEP, mild damage group; rMEP, MEP recovering; iMEP, inconsistently recordable potential; 15D, 15 days; 1M, 1 month; 3M, 3 months; 6M, 6 months; 12M, 12 months; UEMS, upper extremity motor score (x/25) of one side, SCIM, Spinal Cord Independence Measure (x/20).
Statistically significant differences indicated by brackets.
UEMS of the arms correlated with ADM MEP amplitudes (r = 0.419, P < .001) and ADM-MEP groups (measures at baseline) were indicative of the degree of motor recovery (Figure 2) quantified by UEMS. For the correlation of the changes over time, UEMS and ADM MEP amplitudes of each earlier stage were subtracted from those of the corresponding later stage. There were correlations for stage interval changes of UEMS and ADM MEP amplitudes and other variables with the SCIM self-care subscore (Table 4).
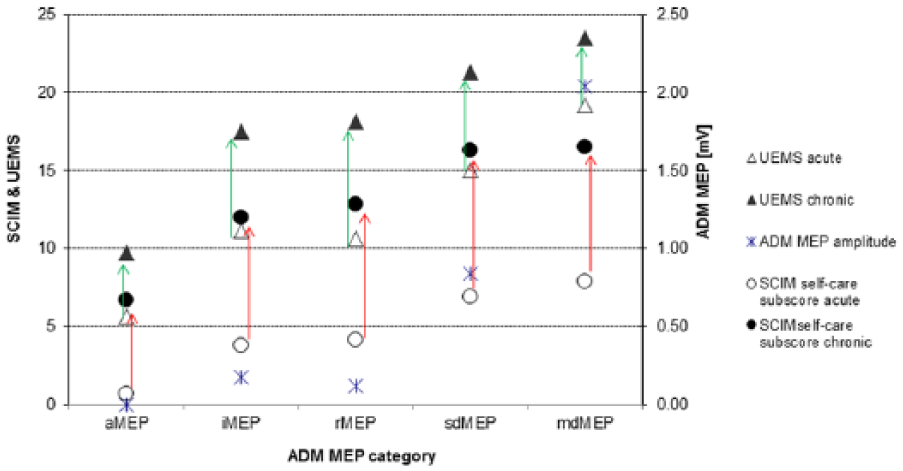
Functional outcome of different MEP-based subgroups: Distribution of grand mean UEMS (triangles, left ordinate) and SCIM-score (Items 1-3, circles, right ordinate) as stratified by ADM-MEP categories. For comparison, the ADM-MEP amplitude (stars, right ordinate) is also included. Open symbols represent the acute state while filled symbols show the corresponding data from the chronic state. This stratification indicates the predictive value of ADM-MEP. MEP, motor-evoked potential; UEMS, upper extremity motor score; SCIM, Spinal Cord Independence Measure; ADM, abductor digiti minimi.
Correlation of Upper Extremity Clinical, Functional, and Electrophysiological Measures. a
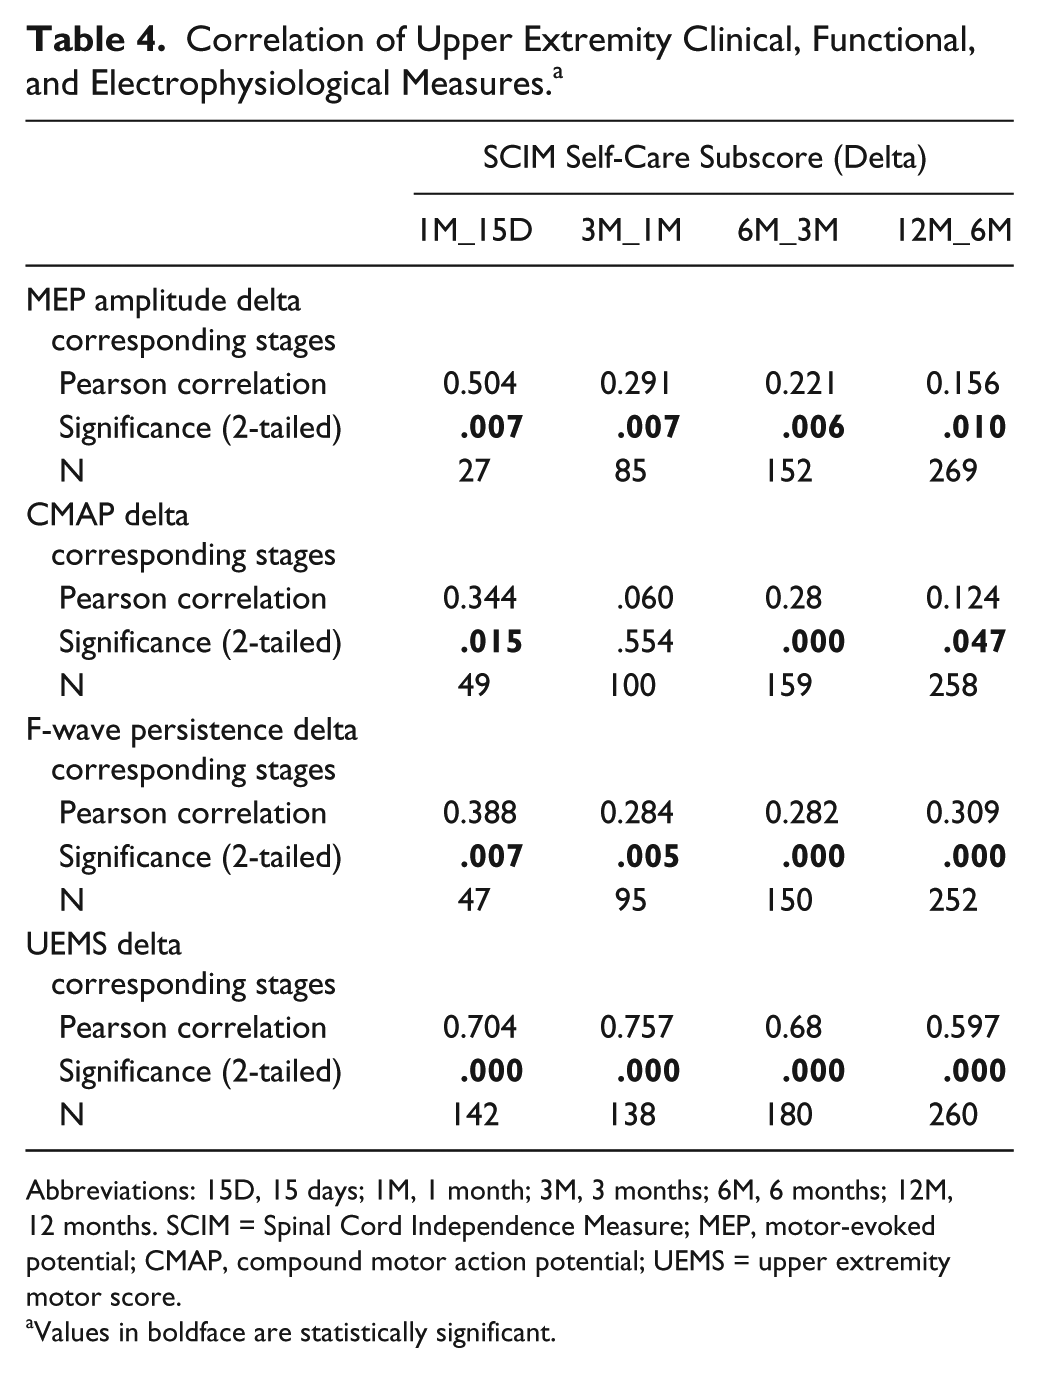
Abbreviations: 15D, 15 days; 1M, 1 month; 3M, 3 months; 6M, 6 months; 12M, 12 months. SCIM = Spinal Cord Independence Measure; MEP, motor-evoked potential; CMAP, compound motor action potential; UEMS = upper extremity motor score.
Values in boldface are statistically significant.
Evolution of SCIM Self-Care subscore
Main effects of stage (F = 315.4, df = 9015, P < .001) and group (F = 41.74, df = 279.7, P < .001) as well as a group by stage interaction (F = 314.17, df = 896.8, P < .001) (Table 3) were found for the SCIM self-care subscores of all 5 groups. The SCIM self-care subscores of aMEP SCI subjects were lower than those of all other groups (P < .001). The SCIM self-care subscores of the rMEP group were lower than those of the sdMEP and mdMEP groups (P < .001). The SCIM self-care subscores of the iMEP group were lower than those of the mdMEP and sdMEP groups (P < .05).
The SCIM self-care subscores correlated with ADM MEP amplitudes (r = 0.495, P < .001) and ADM-MEP groups (measures at baseline) were indicative of the degree of functional recovery (Figure 2).
Changes of SCIM, UEMS and neurophysiological data correlated in corresponding stage intervals (Table 4). In noncorresponding stage intervals, the changes did not correlate.
Discussion
Neurophysiological assessments were applied to investigate the recovery following cervical SCI at cortical/corticospinal, spinal, and peripheral levels. Subgroups of lesion severity were defined by objective neurophysiological criteria derived from MEP data. 1 The results provide evidence of dramatic excitability changes over time due to spinal damage with relevance for functional recovery. This indicates a hitherto unknown systematic secondary deterioration within the peripheral motor system related with lesion severity and distance to the lesion. Reduced CMAP amplitudes and motoneuron excitability were described as a direct cause of cell damage at the lesion level 34 ; however, direct damage of the ADM motoneurons is unlikely in our study since the lesion level was C8/T1 in only 3% of cases. Evolution of ADM MEP and CMAP ratios indicate that rate of change during the course of recovery differs between central and peripheral motor pathways.
Cortical and Corticospinal Effects
MEPs are indirect assessments of central and peripheral motor excitability. They are affected by cortical, corticospinal and spinal motoneuron excitability and synaptic transmission to the muscle and thus cannot measure any of these components alone. 35 In our study, CMCT, which may be lengthened due to demyelination, 36 axonal destruction, or degeneration of the fastest-conducting corticomotoneuronal fibers, 37 remained stable after a cervical SCI. ADM MEP amplitudes increased throughout the first 6 months following SCI. MEP amplitudes reflect corticospinal tract integrity and depend on the excitability of motor cortex, spinal motoneurons and potential axonal damage of nerve roots or peripheral motor axons. 14 For patients with a prolonged CMCT (sdMEP), ADM MEP amplitudes were smaller and initial recovery was slower than for patients with a normal CMCT (mdMEP). Recovery plateaued at 6 months irrespective of SCI severity (cf. Fig 1A). These differences between the mdMEP and sdMEP groups cannot be due to spinal excitability changes as the recovery curves of the CMAPs and F-waves of these groups were not different (cf. Fig. 1B and D).
An increase in MEP amplitude was described previously in acute38,39 and chronic SCI patients1,40 but cannot be clearly related to cortical or spinal excitability changes. The different profiles of early F-wave recovery as opposed to a slower and longer increase of MEP amplitude may point to differential effects within the central motor system, more specifically to a slower increase in corticospinal than spinal excitability. The difference between the recovery profiles of MEP amplitudes in mdMEP and sdMEP groups suggests that recovery of spinal motoneuron excitability with cessation of spinal shock cannot be the only mechanism of corticospinal recovery. Cessation of spinal shock could contribute to the early phase of recovery of spinal and corticospinal excitability between 15D and 3M. Other possible mechanisms include changes in synaptic transmission efficiency, collateral sprouting, 41 or a strengthening of synaptic interconnections between distant spinal segments after several months following SCI. 42 Remyelination of damaged spinal fibers 43 could be responsible, although this is not assumed to a large extent in the present study as CMCT did not change. Since SCI subjects received rehabilitation training, use-dependent plasticity cannot be excluded.
Spinal Effects
The excitability of spinal motoneurons was assessed by F-wave recordings. F-waves occur as a consequence of supramaximal peripheral nerve stimulation due to antidromic axonal propagation and reflection at a fraction (1%-5%) of spinal motoneurons closest to firing threshold. F-waves give an estimate of alpha-motoneuron excitability 7 and can help assess spinal excitability that may be reduced due to spinal shock.9-11
F-wave persistence is a conservative measure of motor neuron excitability as it is based on the probability of the response. 7 In supratentorial stroke, several F-wave parameters are significantly reduced on the paretic side.4,5 Similarly, F-waves are found of low persistence 10 or lacking following an SCI and are regained in patients with preserved CMAPs. 9 In spasticity, F-wave persistence and average F-wave amplitudes are increased. 3
In our analysis, F-wave persistence depended on severity of SCI as expressed by MEP category, time after injury, and the anatomical location of its recording muscle. The latter can be assumed due to the segmental distance from the spinal lesion. ADM F-waves showed lower persistence than AH F-waves, which is different from a physiological state where upper extremity F-waves are at least as highly persistent as in the lower extremities. Since all patients in this analysis had cervical SCI and as the most severe SCI (aMEP) showed lower ADM- than AH F-wave persistence this suggests that persistence is related with distance of supplying motoneurons from the epicenter of a spinal lesion. A similar time course was observed for the recovery of ADM MEP amplitude and F-wave persistence in the mdMEP group. It may be argued that along with neurapraxia, cessation of spinal shock could explain F-wave and ADM MEP recovery. However, this only explains initial F-wave recovery because spinal shock and neurapraxia are assumed to wear off within 3 months 10 while ADM F-wave persistence continued to recover (rMEP and aMEP groups). In one study, it was reported that F-waves could be normally elicited in all cervical SCI patients after a period of 6 months if there was no damage of the segmental alpha-motoneuron pool 10 ; however, lesion severity was not stratified and a comparison of motoneuron excitability with respect to different anatomical spinal levels was not made. In our population, ADM F-waves were initially completely absent and then recovered dependent on severity of lesion as determined by MEP group. This is in line with the notion that F-waves are influenced by cortical modulation and by upper motor neuron damage. 10 Therefore, increased F-wave persistence suggests a recovery of spinal motoneuron excitability together with corticospinal excitability, that is, neuronal plasticity after SCI likely engages supraspinal and spinal structures in parallel and both might contribute to functional recovery. However, there seems to be a fraction of spinal motoneurons caudal to the lesion site which remain unexcitable and the axons of which do no longer contribute to infralesional motor function as is shown by permanently reduced ADM F-wave persistence and reduced ADM and AH CMAPs in the aMEP group.
Peripheral Effects
The CMAP is the sum of all motor unit action potentials in the muscle obtained by supramaximal electrical axonal stimulation. Its amplitude is a derivate of the number and size of the peripheral nerve motor units. 2 It seems to depend on the SCI severity not only in the penumbra of the lesion site 44 but also caudal and remote from it.17,18 Following an SCI, there is significant dysfunction45-47 and recovery 15 of CMAPs even in muscles far away from the injured segment. Cervical SCI was shown to affect lower limb axons, not attributable to direct trauma. 16 Modeling of lower limb axonal excitability changes in the absence of direct trauma suggested that interruption of energy-dependent processes contributed to the peripheral abnormalities, perhaps through rostral transsynaptic processes. 16 The excitability changes may affect muscle strength 15 and recovery of function in patients with SCI. There are various hypotheses about such findings, including motor axon degeneration due to transsynaptic degeneration, 15 altered function of calcium channels resulting in gradual change of excitability and discharge frequency, 48 neuronal plasticity in motor units, or compromised function at the neuromuscular junction. 49 Motor neuron contusion (with subsequent Wallerian degeneration) and/or transsynaptic degeneration may be involved dependent on the level of lesion.
Comparing ADM CMAP and MEP reveals a differential time course of recovery in central and peripheral motor systems after SCI. The different time course of recovery of ADM and AH CMAPs with a drop of AH CMAP from 12 to 8 mV and little recovery in most severe SCI furthermore suggests that a proportion of spinal motoneurons located far caudal from the damage may become permanently unexcitable as was earlier demonstrated in stroke patients. 50 On the contrary, the almost complete recovery of the AH F-wave persistence indicates that motoneurons that remain excitable show close to normal likelihood to be discharged.
Functional Significance and Limitations
Central and peripheral motor excitability changes were highly related to functional and neurological recovery supported by significant correlation between neurophysiological, neurological, and functional data. Following an SCI, the early presence of an ADM MEP indicated a favorable clinical/functional outcome in a majority of subjects (Table 1). Outcome of functional recovery of the upper extremity expressed by UEMS and SCIM self-care sub-score was systematically distinguished by MEP categories (Figure 2).
Selection bias may be a limitation as AIS A subjects are more likely to miss MEP testing since this is of no benefit for the patient. This may account for the low percentage of AIS A subjects as compared with other studies. 51 Furthermore, ADM MEP amplitude strongly depends on voluntary target muscle contraction that increases the excitability of both corticospinal and spinal motoneurons. When muscle strength is graded 0 it is not possible to facilitate ADM MEPs. In the group of patients with absent ADM MEPs, threshold may be too high to allow activation with maximal transcranial magnetic stimulation (TMS) pulse intensity (bottom effect), thus neurological improvement may evade the detection with ADM MEPs.
Conclusion
In this study, ADM CMAPs, F-wave persistence, MEPs, neurological and functional measures were assessed throughout the first year after SCI in a large group of patients. After an SCI, neurophysiological and clinical recovery are related. Clinical outcome and hand function can be predicted by the assessment of ADM-MEPs independently of clinical measures. Noninvasive neurophysiological methods help attribute spontaneous recovery to specific neuroanatomic locations and may eventually provide evidence on how central conduction through the injured segments of the spinal cord improves following treatment-induced recovery. The mechanisms of recovery following human SCI remain elusive and further analysis should aim at understanding how electrophysiology changes relate to these restorative mechanisms in the human spinal cord.
Footnotes
Acknowledgements
We would like to thank Mathias Bannwart for his valuable support regarding figure formatting.
Authors’ Note
The EMSCI Study Group: Thomas Meiners, J. Vidal, J. Benito, Klaus Röhl, Carl Fürstenberg, Doris Maier, Henk van de Meent.
Declaration of Conflicting Interests
The authors declared no potential conflicts of interest with respect to the research, authorship, and/or publication of this article.
Funding
The authors disclosed receipt of the following financial support for the research, authorship, and/or publication of this article: Funding of this study was provided by the International Foundation for Research in Paraplegia.