
Abstract
Background. Stroke is a major cause of disability worldwide, and effective rehabilitation is crucial to regain skills for independent living. Recently, novel therapeutic approaches manipulating the excitatory-inhibitory balance of the motor cortex have been introduced to boost recovery after stroke. However, stroke-induced neurophysiological changes of the motor cortex may vary despite of similar clinical symptoms. Therefore, better understanding of excitability changes after stroke is essential when developing and targeting novel therapeutic approaches. Objective and Methods. We identified recovery-related alterations in motor cortex excitability after stroke using magnetoencephalography. Dynamics (suppression and rebound) of the ~20-Hz motor cortex rhythm were monitored during passive movement of the index finger in 23 stroke patients with upper limb paresis at acute phase, 1 month, and 1 year after stroke. Results. After stroke, the strength of the ~20-Hz rebound to stimulation of both impaired and healthy hand was decreased with respect to the controls in the affected (AH) and unaffected (UH) hemispheres, and increased during recovery. Importantly, the rebound strength was lower than that of the controls in the AH and UH also to healthy-hand stimulation despite of intact afferent input. In the AH, the rebound strength to impaired-hand stimulation correlated with hand motor recovery. Conclusions. Motor cortex excitability is increased bilaterally after stroke and decreases concomitantly with recovery. Motor cortex excitability changes are related to both alterations in local excitatory-inhibitory circuits and changes in afferent input. Fluent sensorimotor integration, which is closely coupled with excitability changes, seems to be a key factor for motor recovery.
Introduction
Approximately 75% of stroke survivors suffer from permanent disability; thus, stroke causes significant human suffering and poses a major economic burden on the society. 1 Recovery from stroke is based on brain’s plasticity. Studies in both animals and humans have shown that a period of enhanced plasticity occurs 1-4 weeks after stroke.2-5 After this sensitive period, the effectiveness of poststroke rehabilitation diminishes dramatically. Recently, there have been promising attempts to prolong or enhance the sensitive period with pharmacological manipulations6-8 or with noninvasive brain stimulation,9,10 both aiming at changing the cortical excitation-inhibition balance. However, patients with initially similar clinical symptoms may recover differently, possibly because the underlying neurophysiological changes vary between these patients. Thus, understanding and monitoring recovery-related neurophysiological mechanisms and their temporal evolution is crucial for developing efficient, personalized rehabilitation.
Fluent upper limb motor function is important for independency in daily life. Integration of proprioceptive and tactile input with motor plans forms the basis of smooth and precise movements. 11 Afferent input mediates its effect on motor functions by modulating the motor cortex excitability. 12 Accordingly, our previous study in healthy subjects indicated that proprioceptive input strongly modulates the ~20-Hz motor cortex rhythm, causing an initial suppression followed by a strong and robust rebound. 13 Prior studies have suggested that the ~20-Hz rebound reflects deactivation or inhibition of the motor cortex.14 -17 Moreover, a combined magnetiencephalography (MEG) and magnetic resonance spectroscopy study showed that the ~20-Hz rebound strength is associated with the concentration of the inhibitory neurotransmitter GABA (γ-aminobutyric acid). 18
To study alterations in motor cortex excitability after stroke and its association with motor recovery, we measured the dynamics of ~20-Hz motor cortex oscillations during passive movement of the index fingers in 23 stroke patients at the acute phase and during 1-year recovery. The motivation of this study was to understand the neurophysiological mechanisms underlying stroke recovery, which is instrumental for developing novel therapeutic interventions.
Methods
Subjects
We recruited 30 patients with first-ever stroke in the middle cerebral artery territory causing unilateral upper limb paresis (12 females, age 45-78 years, mean 67 ± 2 years) from the Department of Neurology, Helsinki University Hospital. The paresis of the upper limb was determined on the basis of the clinical examination by a neurologist at the time of the recruitment. The inclusion criteria required at least a sensory deficit and hand weakness or clumsiness. Twenty-two healthy control subjects (11 females, age 42-72 years, mean 59 ± 2.0 years; data presented in detail in our previous study 13 ) were included. Exclusion criteria were earlier neurological diseases, mental disorders, neurosurgical operations, and unstable cardiovascular condition. After recruitment, 7 patients were excluded; 2 died, 4 declined the upcoming MEG sessions, and the data of 1 patient were contaminated with artifacts preventing reliable analyses. Twenty-three patients participated in all 3 follow-up measurements (10 females, age 45-78 years, mean 65 ± 2 years). The local ethics committee of the Helsinki and Uusimaa Hospital District approved the study protocol, and all subjects gave written informed consent prior to the measurements.
Clinical Evaluation
The patients underwent clinical examination in conjunction with the MEG recordings 1 to 7 days (T0), 1 month (T1), and 12 months (T2) after stroke. Impairment caused by stroke was evaluated according to clinical neurological examination and the National Institutes of Health Stroke Scale (NIHSS; 0-42). Independency in daily life was scored with Barthel Index (BI; 0-100). Jamar Hydraulic Hand Dynamometer was used to measure the grip strength. Fine and gross manual dexterity was tested with Nine-Hole-Peg Board (NHPT; time to remove and replace 9 pegs into 9 holes, maximum 180 seconds) and Box and Block (BB; number of cubes moved from one compartment to another in 60 seconds) tests, respectively. Proprioception was tested qualitatively; the impaired hand was placed to a certain position and the ability of the patient to blindly mimic this position with the healthy hand was evaluated to be normal or abnormal.
Furthermore, we aimed to study whether the patients with different clinical outcomes (well-recovered vs poorly recovered patients) would show distinct changes in the modulation of the ~20-Hz rhythm. We attempted to split our patient group according to the “proportional recovery rule” 19 ; however, only 2 patients reached the required 70% of the initial recovery potential. We also tried to compare the patients according to the lesion site (cortical vs cortico-subcortical vs subcortical lesions). Again, these subgroups were too small to draw reliable conclusions.
Neuroradiological Evaluation
Anatomical magnetic resonance images (MRIs) were acquired at T0 and T1 with a 3-T MRI scanner (Philips Achieva 3T, Philips Medical Systems, Best, the Netherlands). A diffusion-weighted sequence was used to detect ischemic lesions, and a T2-weighted 3D volume (1 × 1 × 1 mm3 voxels) was acquired for lesion size measurement at T0 with the MRIcron software (McCausland Center for Brain Imaging, Columbia, SC, USA). The lesions were classified to be cortical when confined to the cortex and the immediate subcortical white matter without involvement of basal ganglia and/or capsula interna; subcortical if nucleus caudatus, putamen, globus pallidus, capsula interna and/or thalamus were involved; and cortico-subcortical if both cortical and subcortical areas were involved. 20
MEG Recordings
A 306-channel (204 planar gradiometers, 102 magnetometers) whole-scalp MEG system (Vectorview; Elekta Oy, Helsinki, Finland) was used for recordings. The data of 18 control subjects were recorded in Aalto University and four controls and all the patients with similar measurement and stimulus devices in the BioMag Laboratory (Helsinki University Hospital, Finland). During the MEG measurements, the subjects were either sitting or in supine position (4 patients at T0) and instructed to relax, not to pay attention to the finger lift and to avoid excessive blinking. 13
Four indicator coils, 3 anatomical landmarks (right and left preauricular points and nasion) and 50 to 100 additional points on the head surface were used for co-registration. The MEG and vertical electro-oculogram signals were pass-band filtered to 0.03 to 330 Hz and digitized at 1000 Hz. Online averaging was performed to monitor the number of accepted trials (~60 for each hand) while acquiring continuous data for analysis. Resting state data with eyes open and closed (3 minutes each) were recorded.
Passive Movement
The index finger was extended briskly once every 3 seconds by a trained nurse; in the patients first of the healthy and then of the impaired hand. To ensure minimal cutaneous tactile stimulation the middle phalanx was covered with a surgical tape to which a rigid aluminum stick was attached with a Velcro strap. The finger was not allowed to touch the device during the movement. A 3-axis accelerometer (ADXL335 iMEMS accelerometer Analog Devices Inc, Norwood, MA, USA) was attached on the nail of the index finger and its signals, acquired with the MEG system, were used to define the finger kinematics. The accelerometer signal was available only for 17 controls and 16 patients. Since the lag (time from actual movement to recorded movement onset) distributions were narrow (335 ± 8, 317 ± 13, and 326 ± 4 ms at T0, T1, and T2, respectively), the average lag was used for the subjects with remaining accelerometer signals.
Timing and amplitude of the movements were kept constant by monitoring them with 2 optical gates separated by 30 mm along the direction of the movement (Figure 1); only movements passing through both gates within 500 ms were accepted as valid trials for online averaging and later for off-line analysis (~60 for each hand). The kinematics of the movements are reported in detail in the Results section.
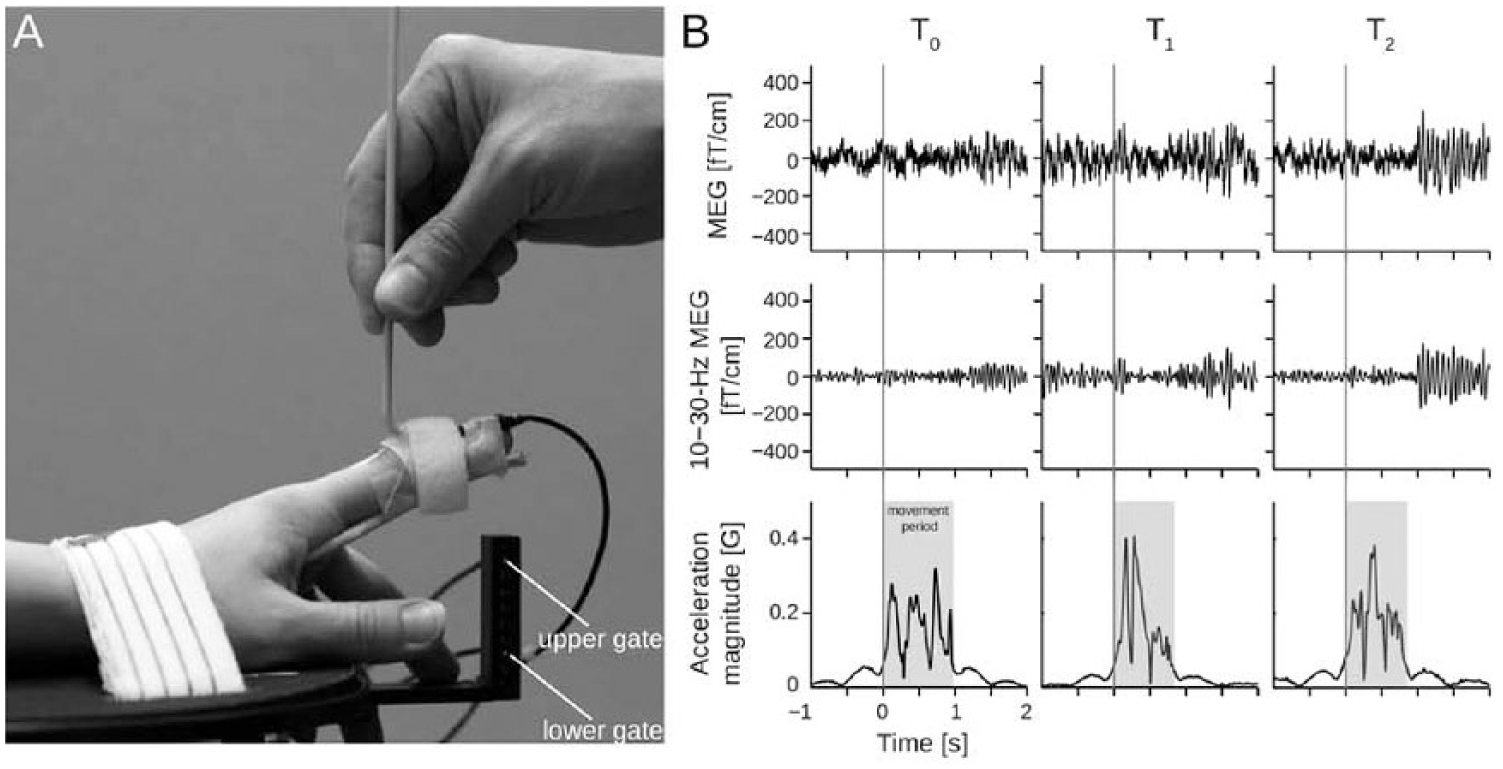
(A) Setup for passive movement. (B) Representative signals of 1 patient at T0 (1-7 days), T1 (1 month), and T2 (12 months) after stroke. Two upper rows: Magnetoencephalography signals from a single gradiometer channel (raw and filtered to 15-25 Hz over the primary sensorimotor cortex. The ~20-Hz modulation is observable even to a single movement. Third row: Magnitude of acceleration. Total duration of the movement highlighted in gray.
Data Analysis
The raw data were preprocessed with the temporal signal-space separation (tSSS) method 21 to suppress magnetic interference of nearby sources and compensated for head movement22,23 using the MaxFilter software (version 2.2.11; Elekta Oy). The 204 planar gradiometer channels were used in subsequent analysis due to their focal sensitivity patterns.
Amplitude spectra were estimated from the resting-state data (eyes open) with the Welch method using 2048-sample Hanning-windowed segments, to define the peak amplitudes and frequencies of spontaneous brain activity. As the strongest peaks were observed in the 15- to 25-Hz range in both the controls and the patients, this band was used for further analysis in all subjects. Time-frequency representations (TFR) of passive-movement responses were calculated over all channels for the 3- to 40-Hz range with 7-cycle Morlet wavelets, to ensure the frequency range of the strongest modulation.
The temporal spectral evolution (TSE) method 14 was used to quantify the modulation of rhythmic activity; the continuous data were filtered to 15 to 25 Hz, rectified, and averaged (−100 to 3000 ms) time-locked to stimulus onset.
Peak amplitudes of suppression and rebound over the rolandic area were quantified in both ipsi- and contralateral hemispheres with respect to the stimulated hand from 4 channels (2 from each hemisphere) showing the strongest suppression and rebound of 15- to 25-Hz activity. The relative peak amplitudes were calculated as amplitude changes with respect to the individual baseline (−100 to 0 ms) and defined as percentage values. Peak latencies were determined at the point of maximal suppression/rebound. To characterize the movement kinematics, the peak acceleration magnitude was computed for each successful movement, and averaged across the movements for each subject separately.
Statistical Analysis
The normality of the data was tested by using the Kolmogorov-Smirnov test; with 4 variables, the null hypothesis of a normal distribution could be rejected at P < .05. To make all variables normally distributed, we transformed the original values x into new values y = ln(x + 1) where ln(·) is the natural logarithm. After this transformation, the Kolmogorov-Smirnov test indicated normal distribution of all variables. The statistical analyses were performed on these transformed variables.
For the patients, the kinematics of passive movements and clinical test results between the impaired and healthy hands were compared using a 2-way (hands: impaired and healthy; times: T0, T1, T2) repeated-measures analysis of variance (ANOVA). The kinematics of passive movements were compared between the patients and the controls (right and left hands pooled) with 1-way, 6-level (2 × hand; 3 × time) ANOVA. The TSE results from all sessions (T0, T1, and T2) were studied in both hemispheres (AH; UH) to both healthy- and impaired-hand passive movement. The variance within factors time, hemispheres, and side of stimulation (contralateral/ipsilateral) was studied with a 2-way within-subject ANOVA. Significant (P < .05) main effects (F) were compared with paired-samples t tests. Independent-samples t tests were used when comparing statistically significant effects between the controls and the patients. Pearson’s parametric test was used for correlation analyses (P < .05).
Results
Neuroradiological Findings and Clinical Outcome
MRIs revealed cortical strokes in 2, subcortical strokes in 6, and cortico-subcortical strokes in 15 patients. The lesion volumes varied from 0.24 to 220 cm3 (mean 40 ± 12 cm3; Supplementary material, Table S1).
Table 1 shows the mean (±SEM) scores of the clinical tests of all the patients. At T0, all clinical scores of the impaired hand were significantly worse (P < .001) than those of the healthy hand. During the follow-up, the impaired hand function improved significantly; BB improved from T0 to T1 (P < .001) and from T1 to T2 (P < .01). NHPT improved from T0 to T1 (P < .05), but not significantly from T1 to T2. The impaired hand function did not reach the level of the healthy hand by T2 (P < .001). No significant improvement of Jamar scores was detected.
Clinical Scores of the Patients. a
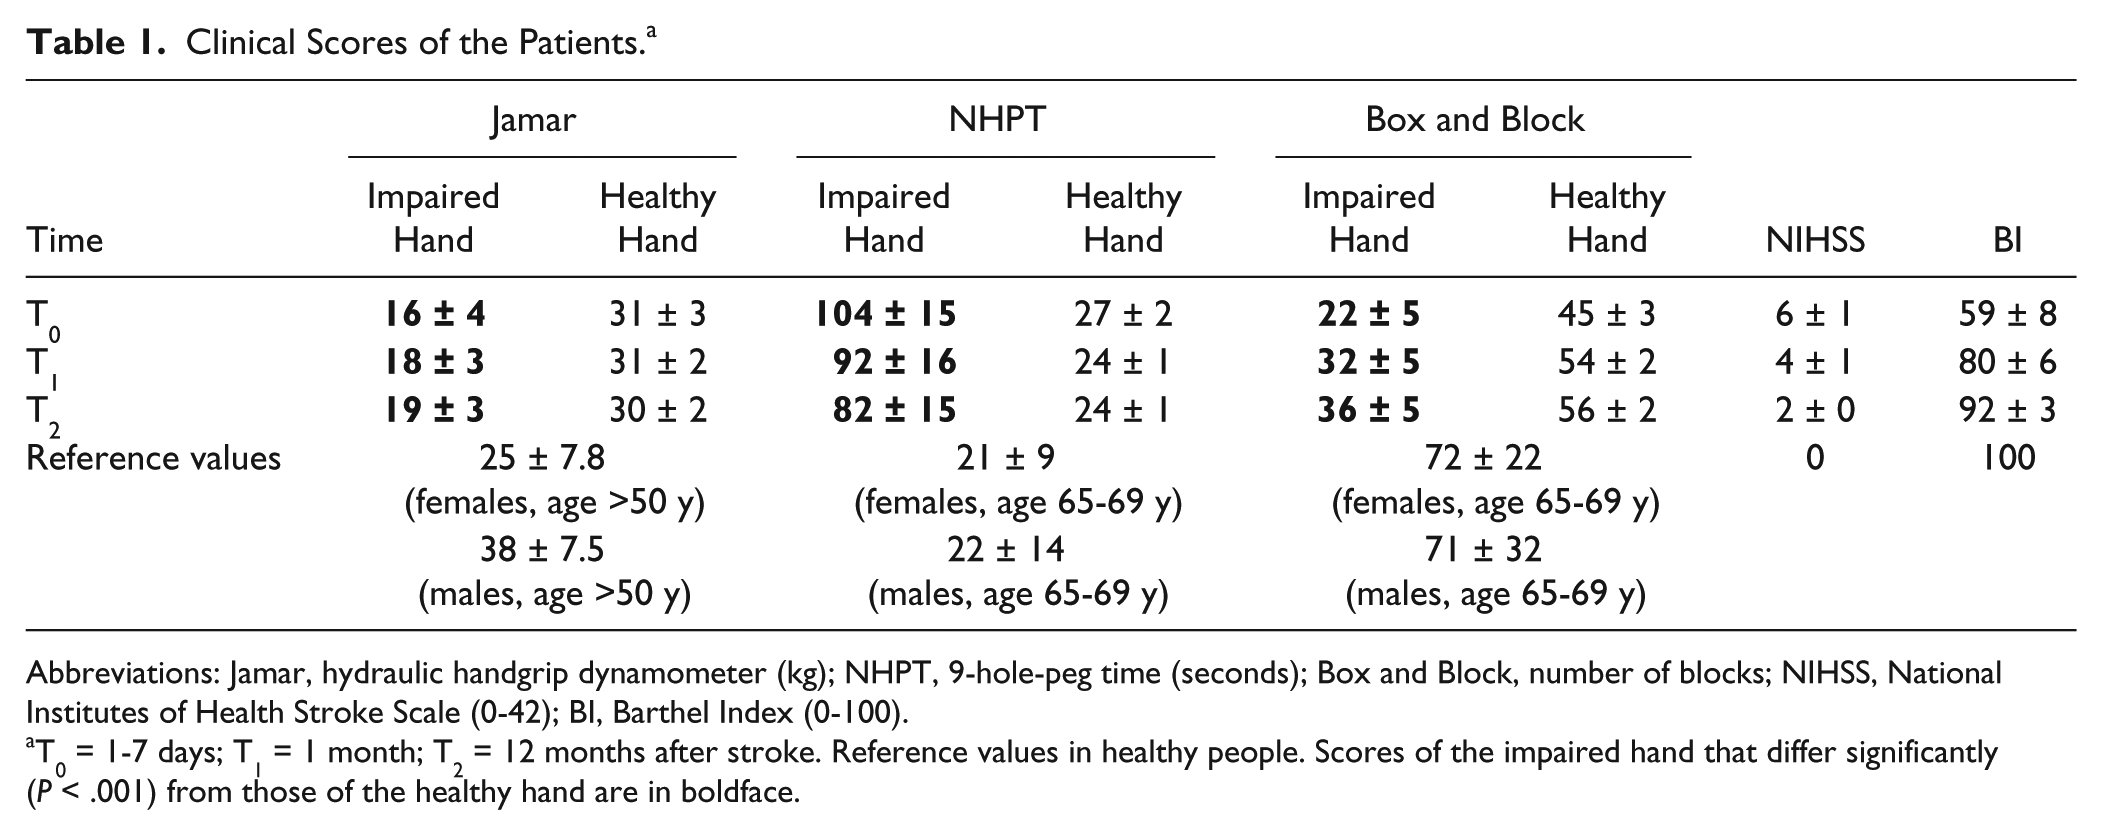
Abbreviations: Jamar, hydraulic handgrip dynamometer (kg); NHPT, 9-hole-peg time (seconds); Box and Block, number of blocks; NIHSS, National Institutes of Health Stroke Scale (0-42); BI, Barthel Index (0-100).
T0 = 1-7 days; T1 = 1 month; T2 = 12 months after stroke. Reference values in healthy people. Scores of the impaired hand that differ significantly (P < .001) from those of the healthy hand are in boldface.
Also, the healthy hand function improved during follow-up (Table 1). However, BB scores of the healthy hand were clearly lower than the reference values at all time points. Both BB and NHPT scores improved significantly from T0 to T1 (P < .001 and P < .01, respectively). The Jamar scores of the healthy hand did not differ from the reference values at any time point.
The overall clinical scores (NIHSS, BI) improved from T0 to T1 (P < .001 and P < .001, respectively) and from T1 to T2 (P < .001 and P < .01, respectively).
The proprioceptive sense of the impaired hand was normal in 5 of 23 patients at T0, in 8 of 23 patients at T1, and in 11 of 23 patients at T2.
Kinematics of Passive Movements
In the patients, the peak acceleration of the index finger did not differ significantly between the healthy and the impaired hand at any time point: T0 (healthy 0.39 ± 0.12 g, impaired 0.38 ± 0.13 g, P = .52), T1 (healthy 0.45 ± 0.12 g, impaired 0.39 ± 0.12 g, P = .07), or T2 (healthy 0.57 ± 0.09 g, impaired 0.55 ± 0.09 g, P = .25). Neither were differences within one hand observed between T0 and T1. However, the passive movements of both the healthy and impaired hand were brisker at T2 than at T0 (P < .001) and at T1 (P < .01).
In the controls, the peak acceleration of the passive movement did not differ between the right and left index fingers (right: 0.40 ± 0.10 g and left: 0.40 ± 0.06 g, N = 17; P = .96).
In the patients versus controls, no significant differences in the peak acceleration were found at T0 or T1. However, at T2, the peak acceleration in the patients for both the healthy and impaired hand was brisker than in the controls (P < .001).
The movement durations were significantly shorter (P < .01) in the patients versus controls in all measurement sessions. However, the movement durations of the healthy and affected hands of the patients did not differ between T0 and T1.
Spontaneous Brain Activity
In the controls, the amplitude spectra during rest revealed strongest peaks around 20-Hz (beta) at 15.7 ± 0.4 Hz (β1) and 21.8 ± 0.5 Hz (β2) over the right rolandic area and at 15.3 ± 0.4 Hz (β1) and 21.5 ± 0.5 Hz (β2) over the left rolandic area.
In the patients, strongest beta peaks at T0 were observed in AH at 16.0 ± 0.4 Hz (β1) and at 20.9 ± 0.7 Hz (β2) and in the UH at 15.3 ± 0.2 Hz (β1) and at 19.3 ± 0.6 Hz (β2). The strength of β1- or β2-peaks did not differ significantly between the hemispheres, the time points, or between the patients and controls (Table 2A).
Characteristics of the ~20-Hz Rhythm. a
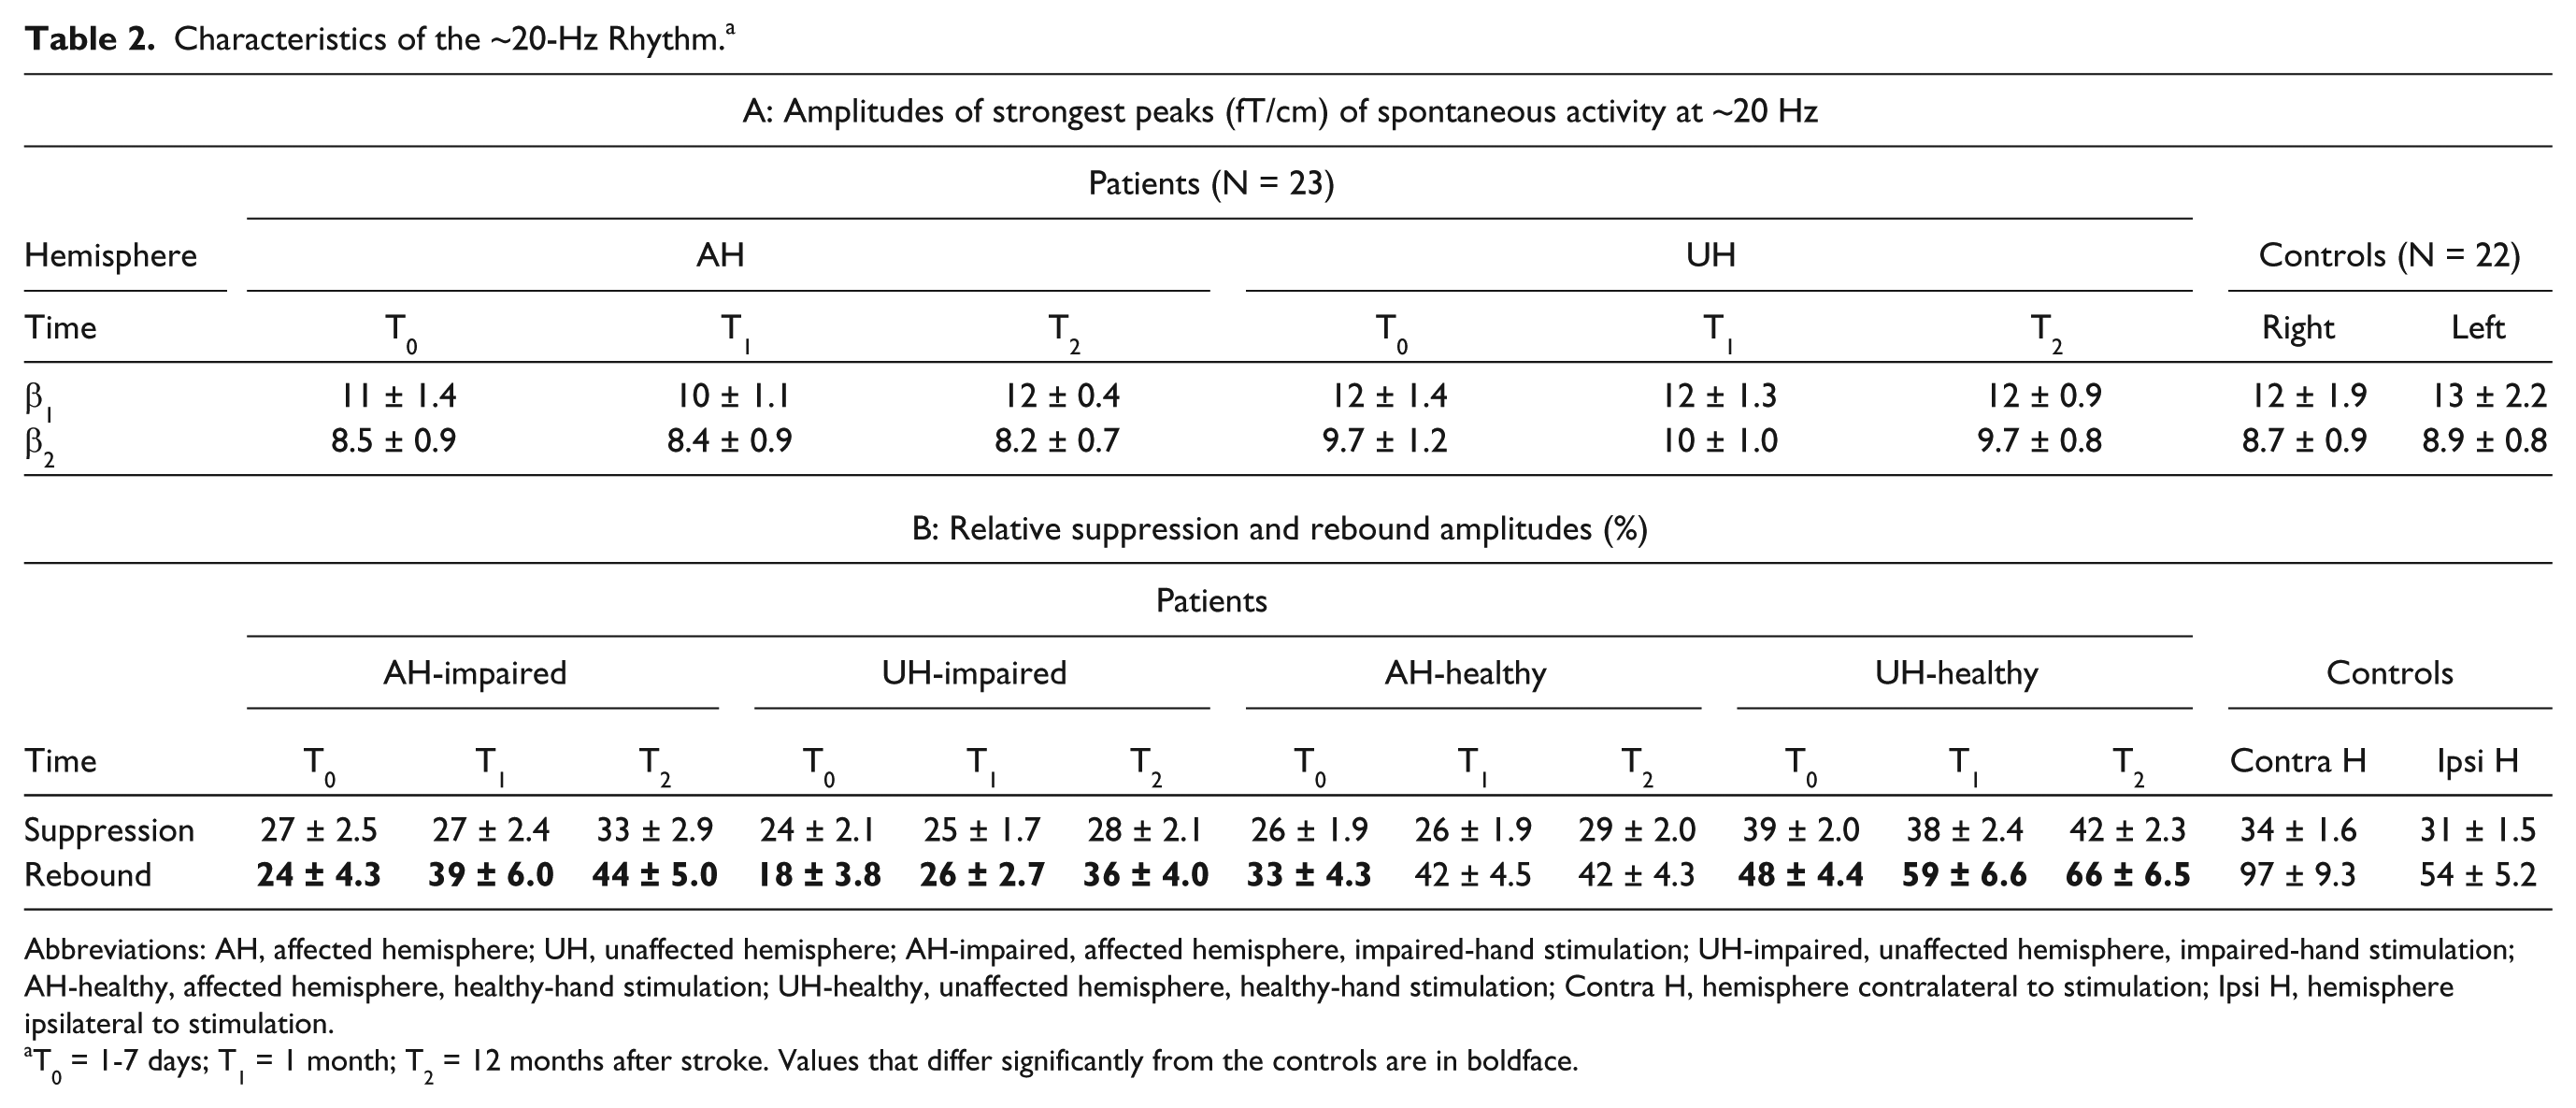
Abbreviations: AH, affected hemisphere; UH, unaffected hemisphere; AH-impaired, affected hemisphere, impaired-hand stimulation; UH-impaired, unaffected hemisphere, impaired-hand stimulation; AH-healthy, affected hemisphere, healthy-hand stimulation; UH-healthy, unaffected hemisphere, healthy-hand stimulation; Contra H, hemisphere contralateral to stimulation; Ipsi H, hemisphere ipsilateral to stimulation.
T0 = 1-7 days; T1 = 1 month; T2 = 12 months after stroke. Values that differ significantly from the controls are in boldface.
Modulation of the ~20-Hz Rhythm
Congruently with earlier studies,15,24 the ~20-Hz rhythm was bilaterally modulated to unilateral stimulation. The maximum ~20-Hz rebounds were observed over the same rolandic channels as the strongest beta peaks in the amplitude spectra and appeared anterior to the maximal suppression on the planar gradiometers.
In the controls, no differences between suppression and rebound strength were observed between the left and right hemispheres, in line with our earlier studies,5,13 hence, the responses of the left and right hemispheres were pooled together for further analyses.
In the following, we use the nomenclature AH-impaired (affected hemisphere, contralateral impaired-hand stimulation), AH-healthy (affected hemisphere, ipsilateral healthy-hand stimulation), UH-healthy (unaffected hemisphere, contralateral healthy-hand stimulation) and UH-impaired (unaffected hemisphere, ipsilateral impaired-hand stimulation).
Figure 2 shows the grand-average TSE of the ~20-Hz rhythm (from the maximum channel of each subject) to passive movement in the patients and the controls. After the stimulus, the rhythm is briefly suppressed, maximally at 530 ± 10 ms (patients) and 540 ± 20 ms (controls), and subsequently increased, peaking at 1370 ± 30 ms (patients) and 1450 ± 30 ms (controls). The peak latencies of suppression and rebound did not differ between the hemispheres, the time points or between the patients and controls
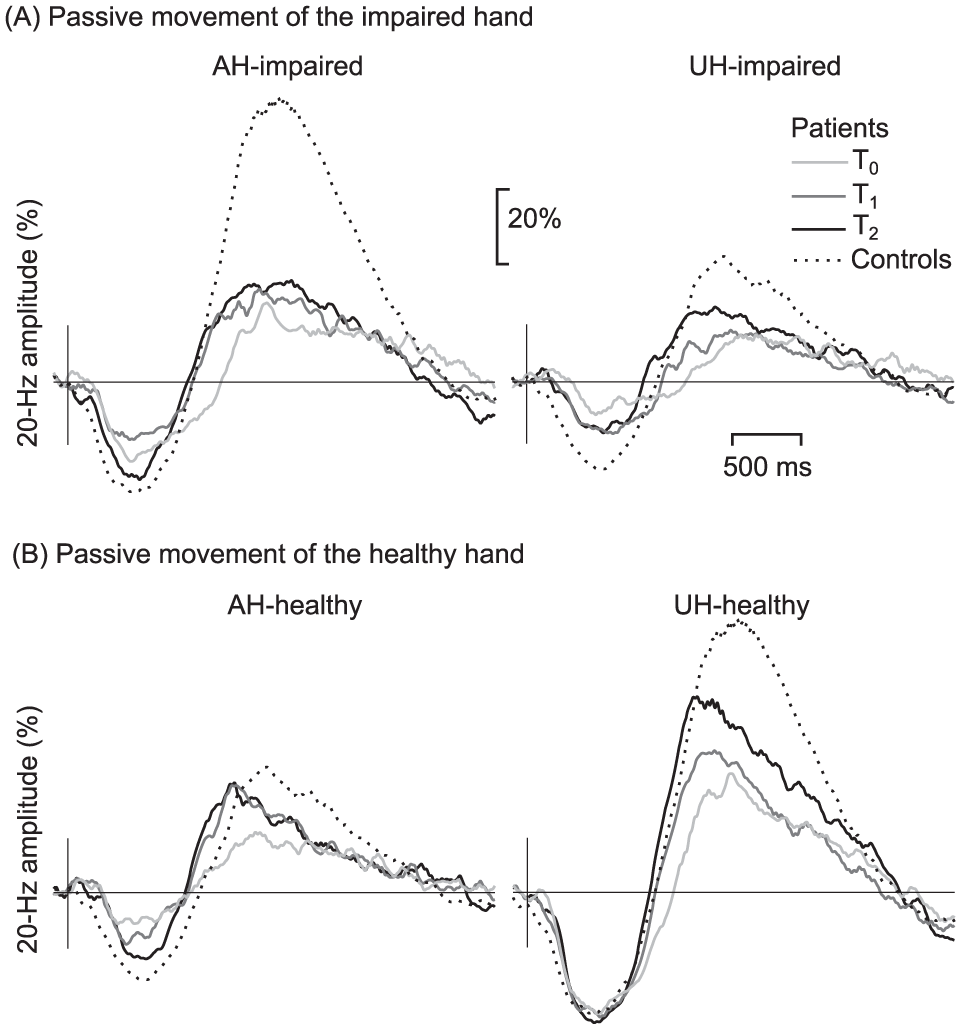
Modulation of the ~20-Hz oscillation. Grand average of the alterations of the ~20-Hz rhythm to passive movement of (A) impaired hand of the stroke patients (N = 23) in the contralateral affected (AH-impaired) and ipsilateral unaffected (UH-impaired) hemispheres compared to the responses of the controls (N = 22, hemispheres pooled). (B) Healthy hand in the ipsilateral affected (AH-healthy) and unaffected contralateral (UH-healthy) hemispheres, both at T0 (1-7 days), T1 (1 month), and T2 (12 months) after stroke.
The mean amplitudes of suppression and rebound of the patients and the controls are presented in Table 2B. No significant differences in the strength of the suppression were detected between the hemispheres of the patients, between different time points or between the patients and the controls. In contrast, Figure 2 shows that in the patients, the rebound strength increases from the acute phase during recovery in both hemispheres.
ANOVA showed significant main effects for the factors time, F(2, 44) = 13.9, P < .000; hemisphere, F(1, 22) = 2.2, P < .000, partial η 2 = 0.090; and side of stimulation, F(1, 22) = 29.0, P < .000, partial η 2 = 0.569; for the rebound strength. A significant interaction was found between the factors hemisphere and side of stimulation, F(1, 22) = 23.9, P < .001.
Impaired-Hand Stimulation
At T0, no rebound was detected in AH in 6 patients, and at T1, in 2 patients. Figure 3 shows that the AH-impaired rebound increased significantly from T0 to T1 and to T2 (P < .01 and P < .001, respectively). No significant increase from T1 to T2 was detected. The AH-impaired rebounds of the patients were significantly weaker than those of the controls at all time points (P < .001 for T0, T1, and T2).
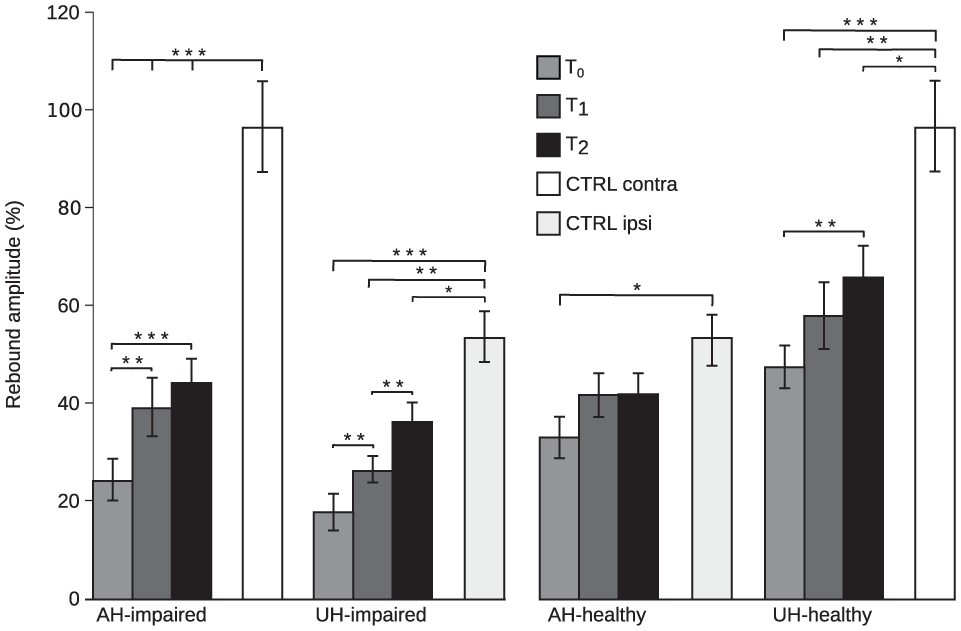
Rebound strength. Rebound amplitudes (%) in the controls (N = 22, hemispheres pooled) and the patients (N = 23) in the affected (AH) and unaffected hemispheres (UH) to the stimulation of the impaired hand and healthy hands. AH-impaired, affected hemisphere, impaired-hand stimulation; UH-impaired, unaffected hemisphere, impaired-hand stimulation; AH-healthy, affected hemisphere, healthy-hand stimulation; UH-healthy, unaffected hemisphere, healthy-hand stimulation; CTRL contra, controls, contralateral stimulation; CTRL ipsi, controls, ipsilateral stimulation. T0 (1-7 days), T1 (1 month), and T2 (12 moths) after stroke. *P < .05; **P < .01; ***P < .001.
At T0, no rebound was found in the UH in 7 patients. The UH-impaired rebound increased significantly from T0 to T1 and T2 (P < .01 and P < .001, respectively) and from T1 to T2 (P < .01). The UH-impaired rebound was significantly weaker than that of the controls at all time points (P < .001 for T0, P < .01 for T1, and P < .05 for T2).
The UH-impaired rebound was significantly weaker than the UH-healthy rebound (P < .001 for T0, P < .001 for T1, and P < .001 for T2).
Healthy-Hand Stimulation
For healthy-hand stimulation, no AH-healthy rebound was detected in 2 patients at T0. Figure 3 shows that the AH-healthy rebound approached, but did not achieve significance from T0 to T1 and T2 (P = .05); yet it was significantly weaker than that of the controls at T0 (P < .05).
The AH-healthy rebound was significantly stronger than the AH-impaired rebound at T0 (P < .05). At T1 and T2, such difference was not observed.
The UH-healthy rebound increased significantly from T0 to T2 (P < .01) but not from T0 to T1 or from T1 to T2. The UH-healthy rebound was significantly weaker than that of the controls in all sessions (P < .001 for T0, P < .01 for T1, and P < .05 for T2).
To summarize, the AH rebound was decreased compared with that of the controls at T0 and increased during follow-up, not only when the impaired (AH-impaired) but also when the healthy hand was stimulated (AH-healthy). The AH-healthy rebound was decreased only at the acute phase, whereas the AH-impaired rebound did not reach the level of the controls during follow-up. The UH rebound to both healthy and impaired hand stimulation was also diminished at the acute phase and increased during follow-up but did not reach the level of the controls.
Correlation of Rebound Amplitude With Clinical Outcome
Impaired-Hand Stimulation
Since only 15 of 23 patients were able to perform NHPT while 19 of 23 patients obtained above-zero BB scores at T2, we chose BB for correlating the rebound amplitude with clinical outcome. Figure 4 shows that the AH-impaired rebound amplitude correlated with results of BB at all time points (r = 0.6, P < .01 at T0; r = 0.7, P < .001 at T1; and r = 0.6, P < .01 at T2), the stronger the rebound the better the BB score. The rebound strength correlated also with NHPT results of the impaired hand; the stronger the rebound the faster the patient performed the test at T0 (r = −0.5, P < .05), at T1 (r = −0.7, P < .001) and at T2 (r = −0.5, P < .05). In addition, the rebound amplitude at T0 correlated with the BB scores achieved at T1 (r = 0.6, P < .001) and at T2 (r = 0.7, P < .001).
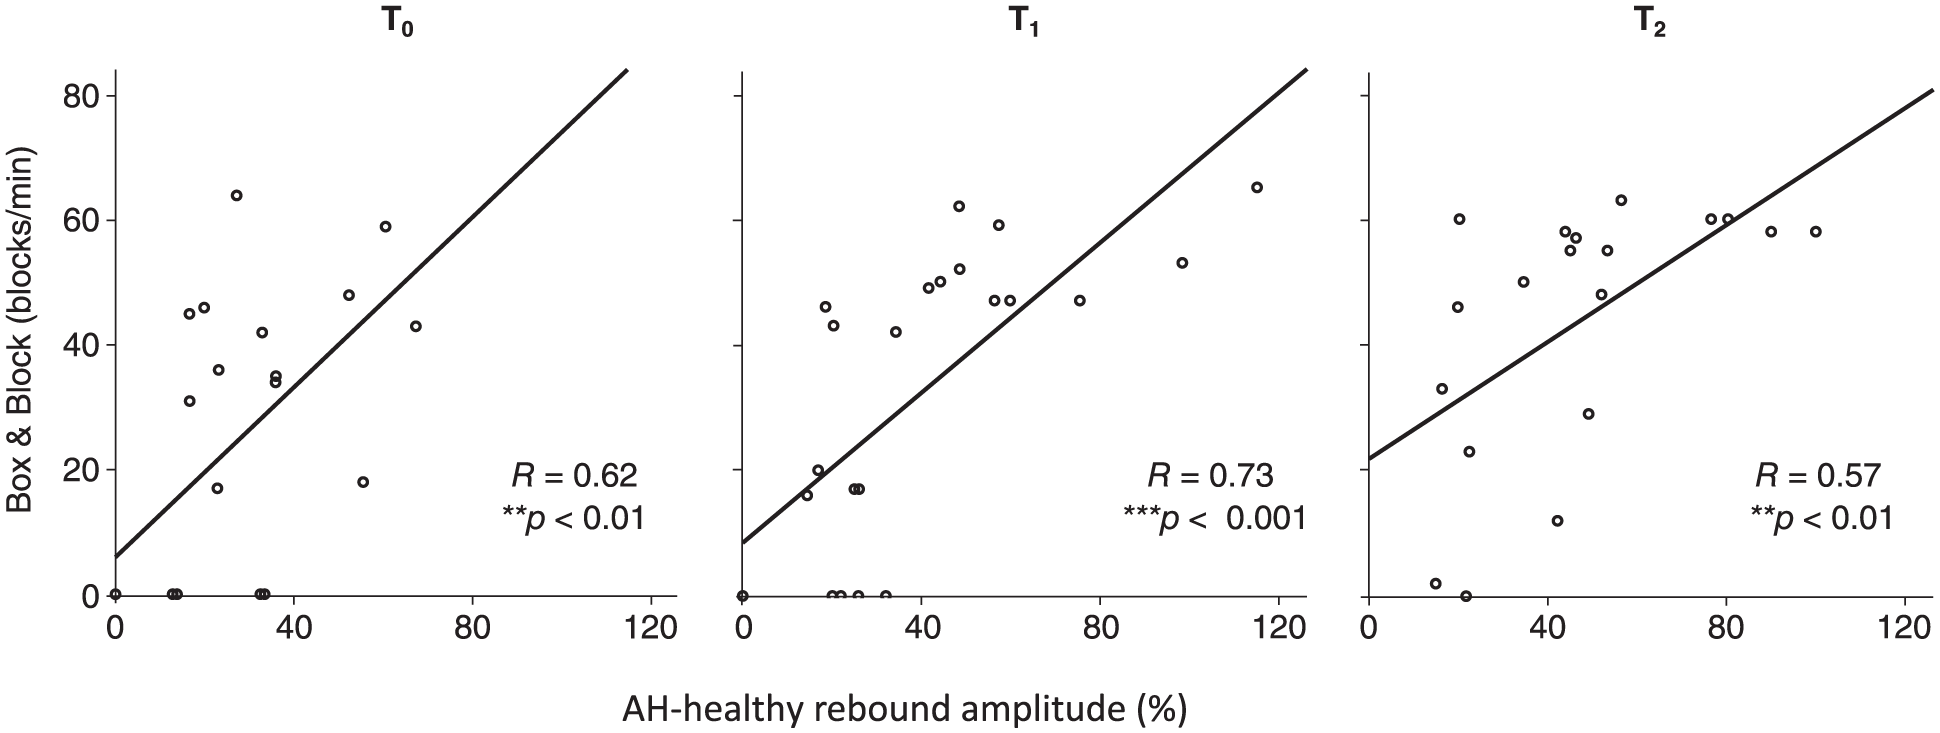
Rebound strength and clinical correlation. Linear correlation of the rebound amplitude (%) in the affected hemisphere to the contralateral stimulation of the impaired hand, and result of Box and Block test of the impaired hand. T0 (1-7 days), T1 (1 month), and T2 (12 months) after stroke.
The AH-healthy rebound strength did not correlate with any of the hand function tests.
Healthy-Hand Stimulation
The UH-healthy rebound strength correlated with BB scores of the healthy hand at T0 (r = 0.04, P < .05) and at T1 (r = 0.5, P < .05) and with NHPT scores of the healthy hand at T1 (r = −0.4, P < .05) and at T2 (r = −0.6, P < .01).
Correlation With the Lesion Volume
The rebound strength did not correlate with the lesion volume. However, the overall clinical scores correlated with the lesion volume: NIHSS (r = 0.5, P < .05 at T0; r = 0.4, P < .05 at T1; and r = 0.6, P < .001 at T2) and BI (r = −0.4, p < .05; r = −0.4, P < .05 and r = 0.5, P < .05, at T0, T1, and T2, respectively). NHPT and BB of the impaired hand correlated with the lesion volume only at T1 (r = 0.4, P < .05 and r = −0.4, P < .05, respectively).
Discussion
The present longitudinal study shows that the rebound amplitudes of the ~20-Hz motor cortex rhythm to passive movement are decreased compared with the controls in both hemispheres at the acute phase after stroke. The rebound amplitudes increase to some extent during follow-up but only the rebound strength in the AH to healthy-hand stimulation reached the level of the controls, indicating long-lasting excitability changes in both hemispheres after stroke.
Rebound and Motor-Cortex Excitability
Most animal studies have suggested stroke-triggered hyperexcitability in the AH that promotes experience-dependent plasticity, essential for functional recovery after stroke.25-28 A recent study in mice showed that after subcortical infarction, induced by an occlusion of the middle cerebral artery, tonic GABAergic inhibition was significantly decreased in the peri-infarct zone, likely via glutamate-driven excitoxicity. 29 In contrast, another recent study indicated increased tonic GABAergic inhibition in the peri-infarct zone in mice. 8 Counteracting this overinhibition by pharmacological means led to better motor recovery, underlining the close linkage between excitability changes and motor recovery after stroke. Despite these controversial observations, both studies indicate that an initially increased excitability is essential for motor recovery. In our stroke patients, we observed decreased inhibition (hyperexcitability) at the acute phase after stroke, congruently with most of the earlier studies.29-32 During recovery, the clinical parameters of hand motor function improved in conjunction with increased inhibition (increase in the rebound strength) of the motor cortex. This is in line with earlier studies indicating that although disinhibitory changes may be necessary for functional recovery,33,34 a normalization of excitability is associated with good recovery after stroke.5,35,36
In the present study, excitability changes were studied indirectly by recording the modulation of the ~20-Hz rhythm, which has been shown to be associated with changes in the cortical excitation-inhibition balance.5,13 The ~20-Hz oscillations are suppressed during movement or after somatosensory stimulation, and increase transiently (rebound) after cessation of the movement or stimulation.14,15,17
Earlier findings have shown that the rebound and suppression have different generator areas,37,38 frequencies, 39 and functional roles.13,40 Several studies have indicated that the ~20-Hz rebound reflects active inhibition or removal of excitation of the motor cortex,18,40,41 whereas the functional significance of the suppression has remained unclear. Accordingly, pharmacological studies have proposed that although both suppression and rebound seem to be GABA-dependent processes, their effects are mediated via different receptor subtypes; the suppression via fast ionotropic GABAA and the rebound via both GABAA and slower metabotropic GABAB receptor.42-44
In the present study, the ~20-Hz rebound in the patients was altered throughout the follow-up period but no changes were detected in the suppression strength. Although we cannot evaluate the exact nature of the inhibitory processes underlying the ~20-Hz rebound, our result advocates the notion of distinct neuronal populations underlying suppression and rebound.
Rebound in the AH
The strength of the AH rebound to stimulation of the impaired hand (AH-impaired) correlated significantly with functional recovery, but it did not reach the level of the controls during follow-up. Earlier studies have shown that afferent input modulates motor cortex excitability,12,45 and it is likely that altered afferent input strongly affects the AH-impaired rebound.
A prior study in monkeys indicated that cortico-cortical projections from the somatosensory cortex to the motor cortex are crucial in learning new motor skills but not in the execution of existing skills. 11 Accordingly, a study using repetitive transcranial magnetic stimulation (rTMS) showed that disturbing somatosensation during task training impaired motor learning. 46 Our finding, the correlation of the AH-impaired rebound strength with motor recovery, suggests that fluent integration of afferent input with motor functions is a key element in relearning motor skills. Modulatory afferent input may even be on its own an important driver of cortical remapping and motor recovery. 47
Afferent input may reach the motor cortex via different pathways. Our earlier study in stroke patients showed that the AH-impaired rebound strength did not correlate with the strength of the primary somatosensory cortex activation, but did correlate with the activation strength of the secondary somatosensory (SII) information with motor functions. 5 This is in line with earlier animal and human studies implicating the importance of SII areas in the sensorimotor integration.4,48,49
The strength of the AH rebound to healthy-hand stimulation (AH-healthy) was decreased compared with the controls at the acute phase after stroke but reached the level of the controls by 1 month. As the afferent input is assumed to be intact in this case, the decrease of rebound to healthy-hand stimulation likely reflects stroke-induced changes in local excitatory-inhibitory circuits rather than changes in afferent input. In contrast to the AH-impaired rebound, the AH-healthy rebound did not correlate with any of the clinical parameters.
As stroke-induced changes in the local excitatory-inhibitory circuits affect both hemispheres, it is likely that the strength of AH-impaired rebound comprises the combined effects of deficient afferent input and sensorimotor integration and changes in local cortical excitability and effects. The exact role and functional significance of all these distinct influences on motor cortex excitability still remain unclear. Nevertheless, as only the AH-impaired rebound correlated with motor recovery, the results indicate the important role of modulatory afferent input during motor recovery.
Rebound in the UH
At the acute phase, the UH-healthy rebound was diminished compared to the controls despite of intact afferent input, indicating increased cortical excitability in the UH. During the follow-up, the amplitude of the UH-healthy rebound increased but it did not reach the level of the controls by 1 year, implicating long-lasting excitability changes of the UH in accordance with earlier findings.50,51 Earlier TMS studies in stroke patients have suggested that hyperexcitability of the UH may hamper functional recovery.33,50 Inhibition of the hyperexcited UH with rTMS may release the AH from excessive interhemispheric inhibition and could thus improve functional recovery. 10
In our patients, the impaired hand function did not reach the level of the healthy hand by 1 year. The poor recovery of hand function in conjunction with long-lasting excitability changes of the UH might imply a harmful effect of the hyperexcited UH congruently with earlier studies in stroke patients.33,50,51 However, it is possible that hyperexcitation of the UH is not only harmful, but may provide at least some degree of regained function in poorly recovering patients. However, our data are not sufficient to address this important issue, which needs to be investigated in future studies.
Effect of Stimulus Kinematics on Rebound
In the current study, passive movements were performed manually; therefore, the stimuli may have varied slightly in terms of peak acceleration and movement duration. The movements were all brisk, but significantly more so in the last session (T2). However, the acceleration did not differ between the first 2 sessions (T0 and T1) where the strongest recovery of rebound amplitude occurred. In addition, at 1 year (T2), the movements were brisker and longer for the patients than for the control subjects but still the rebound amplitude remained weaker in the patients; thus, it is unlikely that the observed changes in the rebound could be explained by changes in stimulus kinematics. Yet, we suggest that the repeatability of passive-movement responses should be addressed in future studies. Recently introduced robust MEG-compatible movement actuators, using computer-controlled pneumatic artificial muscles with millisecond accuracy, 52 are thus recommended for clinical studies in the future.
Perspectives to Development of Stroke Rehabilitation
Our findings of altered motor cortex rebound in both hemispheres agree with earlier studies indicating that hyperexcitability occurs predominantly 1 to 4 weeks after stroke.4,5,53,54 Recently, there have been attempts to enhance plasticity after stroke using pharmacological manipulations with antidepressive agents such as serotonin-reuptake inhibitors (SSRIs).6,7 In humans, a randomized clinical study indicated less severe residual motor deficits in patients treated with SSRI during the first 3 months after stroke. 6 Animal studies have suggested that also GABAergic drugs8,29 could reopen or enhance the sensitive period through reducing GABAergic inhibition. 11 In addition to pharmacological manipulations, noninvasive brain stimulation, such as rTMS, has been applied to boost plasticity but the success has been variable. 55
As these therapeutic approaches are aiming at changing cortical excitability, it is of utmost important to understand and monitor changes in excitability. The present results suggest that neurophysiological methods such as MEG and EEG could be useful in detecting alterations in cortical excitability to monitor the effect of interventions at different stages (acute, subacute, and chronic) of recovery. Earlier TMS studies have shown that motor cortex excitability depends on the lesion site.56,57 Because of the small number of patients, we could not reliably compare patients having cortical, cortico-subcortical, or subcortical lesions. However, despite this heterogeneous sample, our results clearly show that the rebound strength increased throughout follow-up in conjunction with clinical outcome.
The AH-impaired rebound amplitude at the acute phase correlated with motor skills (BB scores) achieved 1 month and 12 months after stroke. Although our data are not sufficient to make conclusions about recovery potential, this relationship suggests that a diminished rebound at the acute phase may predict poor motor recovery. Further studies, both in healthy subjects and stroke patients, aiming at monitoring changes in the ~20-Hz rebound during interventions, are needed to address the usability and sensitivity of the ~20-Hz rebound as a neurophysiological marker of motor cortex recovery after stroke.
Conclusions
The present results indicate that the strength of the rebound in the AH to impaired-hand stimulation is associated with recovery of hand motor function after stroke. The close coupling of afferent input with excitability changes seems to be a key factor for motor recovery, and needs to be paid attention to when planning therapeutic interventions aiming at changing cortical excitability. Since the strength of the rebound is likely associated with stroke-induced excitability changes, it could be used to guide therapeutic interventions for optimal recovery. Future studies in a larger patient group and in patients matched for their impairment caused by stroke should aim at monitoring the proposed neurophysiological markers to assess their value in stroke rehabilitation.
Footnotes
Acknowledgements
We thank Mia Illman for help with all the MEG recordings, Jyrki Mäkelä for supporting our MEG measurements in Biomag Laboratory (Helsinki University Hospital), and Suvi Heikkilä for the assistance in those recordings. We also thank the Helsinki University Hospital occupational therapists for performing the clinical hand motor tests.
Declaration of Conflicting Interests
The authors declared no potential conflicts of interest with respect to the research, authorship, and/or publication of this article.
Funding
The authors disclosed receipt of the following financial support for the research, authorship, and/or publication of this article: The study was financially supported by Helsinki University Hospital Research Fund, SalWe Research Program for Mind and Body (Tekes; Finnish Funding Agency for technology and Innovation, Grants No. 1104/10 and 1988/31/2015), Finnish Medical Foundation, and Academy of Finland Postdoctoral Research Grant No. 266133.