
Abstract
Background
Low-frequency repetitive transcranial magnetic stimulation (LF-rTMS) protocols targeting primary motor cortex (M1) are used in rehabilitation of neurological diseases for their therapeutic potential, safety, and tolerability. Although lower intensity LF-rTMS can modulate M1 neurophysiology, results are variable, and a systematic assessment of its dose effect is lacking.
Objectives
To determine the dose-response of LF-rTMS on stimulated and non-stimulated M1.
Methods
In a sham-controlled randomized double-blind crossover study the effect of LF-TMS protocols were determined in 20 right-handed older healthy participants. In 3 sessions, 1 Hz rTMS at 80% (rTMS80), 90% (rTMS90) of motor threshold or sham stimulation were applied to left upper extremity M1. Outcome measures were curve parameters of the stimulus-response curve (maximum motor evoked potential [MEPMAX], slope and the intensity to evoke 50% MEPMAX), short-interval intracortical inhibition (SICI), and interhemispheric inhibition (IHI).
Results
Within LF-rTMS sessions, rTMS90, increased MEPMAX in the stimulated M1. Furthermore, rTMS90, increased the slope in the non-stimulated M1. LF-rTMS effects on SICI were dependent on the participants’ baseline SICI, hemisphere, and intensity of conditioning pulse. Finally, rTMS90 increased whereas rTMS80 decreased IHI, for both IHI directions. These changes were dependent on baseline IHI and hemisphere and were no longer significant when baseline IHI was accounted for.
Conclusions
Intensity of subthreshold LF-rTMS has differential effects on excitation and inhibition of stimulated and non-stimulated M1. The effects were small and were only demonstrated within the LF-rTMS sessions but were not different when compared to sham. rTMS related changes in SICI and IHI were dependent on baseline level.
ClinicalTrials.gov Identifier:
NCT02544503, NCT01726218.
Introduction
The therapeutic potential of transcranial magnetic stimulation (TMS) has been demonstrated for many neurological and psychiatric diseases. 1 There is level B evidence supporting the use of low-frequency repetitive TMS (LF-rTMS) over the contralesional M1 for the treatment of hemiparesis in stroke patients,2,3 an effect that may be mediated through interhemispheric connections with the non-stimulated (ipsilesional) M1.1,4-6 LF-rTMS of M1 induces functional changes in the stimulated and non-stimulated M1 of stroke patients and healthy adults.3,4,6,7 Since the original report of an inhibitory effect of LF-rTMS on M1, 8 reported results differ, with opposing effects at times.7,9,10 A more detailed understanding of the biological substrates underlying these therapeutic effects is warranted.1,11,12 While many factors leading to variability in outcomes of non-invasive neuromodulation studies cannot be modified (e.g., age, handedness, and gender; for review see Goldsworthy et al 9 ), they can be considered in the experimental design. Frequently, the effect of the LF-rTMS protocol has been studied in young participants, in either the stimulated or the non-stimulated M1 (but rarely in both at the same time), and without consistent consideration of hemispheric dominance. This may limit generalizability of the results to an older population given the evidence for the impact of age on motor control13,14 and motor cortex plasticity. 15 Further, M1 excitability decreases with age16,17 and is even further reduced after stroke. Related increases in motor threshold may require higher intensities of rTMS which may at times exceed the stimulator output. Intensities below threshold (subthreshold LF-rTMS) improve tolerability 1 and safety (Rossini et al 17 ) and have been shown to clearly affect M1 physiology,12,18-20 as well as behavioral outcomes in healthy participants and individuals post-stroke.1,21-23
Taken together, determining LF-rTMS effects on the neurophysiology of healthy aging motor control is necessary for a better understanding of abnormality in patients affected with neurological diseases such as stroke,1,2 but systematic studies of LF-rTMS-related effects on the excitability of the stimulated and non-stimulated M1 in middle-aged and older adults are rare. 24 Here, we conducted a sham-controlled randomized double-blind crossover study to systematically determine the effects of subthreshold LF-rTMS (1 Hz rTMS) over upper extremity M1 (targeting the extensor carpi ulnaris muscle)1,2,7 in older right-handed adults. We anticipated that rTMS at different intensities would affect upper extremity motor cortex physiology differently from sham stimulation. However, given that there are few studies in this population and results vary, we did not formulate specific hypotheses on the directionality of these effects.
Materials and Methods
This study of healthy older participants is part of a larger prospective longitudinal study of patients with stroke where TMS, magnetic resonance imaging (MRI), and behavioral data were collected. To establish abnormality in these stroke participants, we also systematically studied the effects of subthreshold LF-rTMS on the excitability of left and right M1 in 20 healthy older participants. In the present paper we report these results. In a sham-controlled randomized double-blind crossover study design, 1 Hz rTMS was applied to the left M1 (LM1) at intensities of 80% and 90% of resting motor threshold (RMT). Primary outcome measures were the curve parameters extracted from the stimulus response curve (SRC). Secondary outcome measures were short-interval intracortical inhibition (SICI) and interhemispheric inhibition (IHI).
Participants
Twenty participants (13 females, age 60 ± 7.2 years) provided written informed consent and were included in this study. All participants met the following inclusion criteria: age 50 to 80 years old, right-handed (Edinburgh Handedness Inventory, cut-off score ≥50 25 ), normal MRI of the brain, normal cognitive functioning (Repeatable Battery for the Assessment of Neuropsychological Status (total scale index scores >2 standard deviations (SDs) below the mean were considered abnormal 26 ), no history of neurological disorders, no contraindications to TMS 17 or MRI, no intake of central nervous system active drugs, and the ability for TMS to elicit a measurable MEP response >0.2 mV. We excluded participants with recreational drug use. We asked participants not to have caffeinated beverages immediately before the experiment or during the experiment. We did not ask them to change their routine of caffeine consumption otherwise. The study was approved by Emory University’s Institutional Review Board (IRB00081238; IRB00048694). All experiments were carried out at Emory Rehabilitation Hospital and Emory University Hospital. The sample size was determined to power the comparison between the stroke and healthy participants for the primary outcome measures in the main study but not for this cross-sectional study of healthy participants. CONSORT reporting guidelines were followed. 27
Overview of Experimental Set-Up
In all experiments, the 1 Hz rTMS was delivered to the left M1 (stimulated LM1) at intensities of 80% (rTMS80) or 90% RMT (rTMS90). The RMT was determined at the beginning of each session by finding the minimal intensity at which at least 5 out of 10 MEP > 0.05 mV were observed.17,28 For rTMS an air-cooled rapid Magstim 2002 coil was used. As a control, sham stimulation was applied through an air-cooled rapid Magstim 2002 placebo coil. Sham and rTMS coils look identical. The intensity and frequency of sham stimulation were matched to rTMS stimulation. The effect of the different interventions (rTMS80, rTMS90, and sham) on M1 excitability measures were tested on 3 different days, separated by at least >24 hours in a randomized order (Figure 1). On each experimental day SRC, SICI, and IHI of the stimulated LM1 and non-stimulated RM1 were measured. Randomization was accomplished by assigning participants consecutively to a pre-determined sequence of experimental conditions which was generated by the study coordinator prior to the study and kept in a password protected folder. The participants were blind to the experimental condition. They were informed that they would receive 3 different types of stimulation without any further specification, meaning that they were unaware that one of the conditions was a placebo (sham) condition. Note that blinding was not assessed post hoc. Specifically, they were not informed that sham stimulation would be applied in 1 condition. Data analysis was done after data files were stripped of their specifications with respect to the experimental condition. The statistical analysis was performed by Drs Drake and Hobbs who were not involved in any aspects of the data collection or primary data analysis.
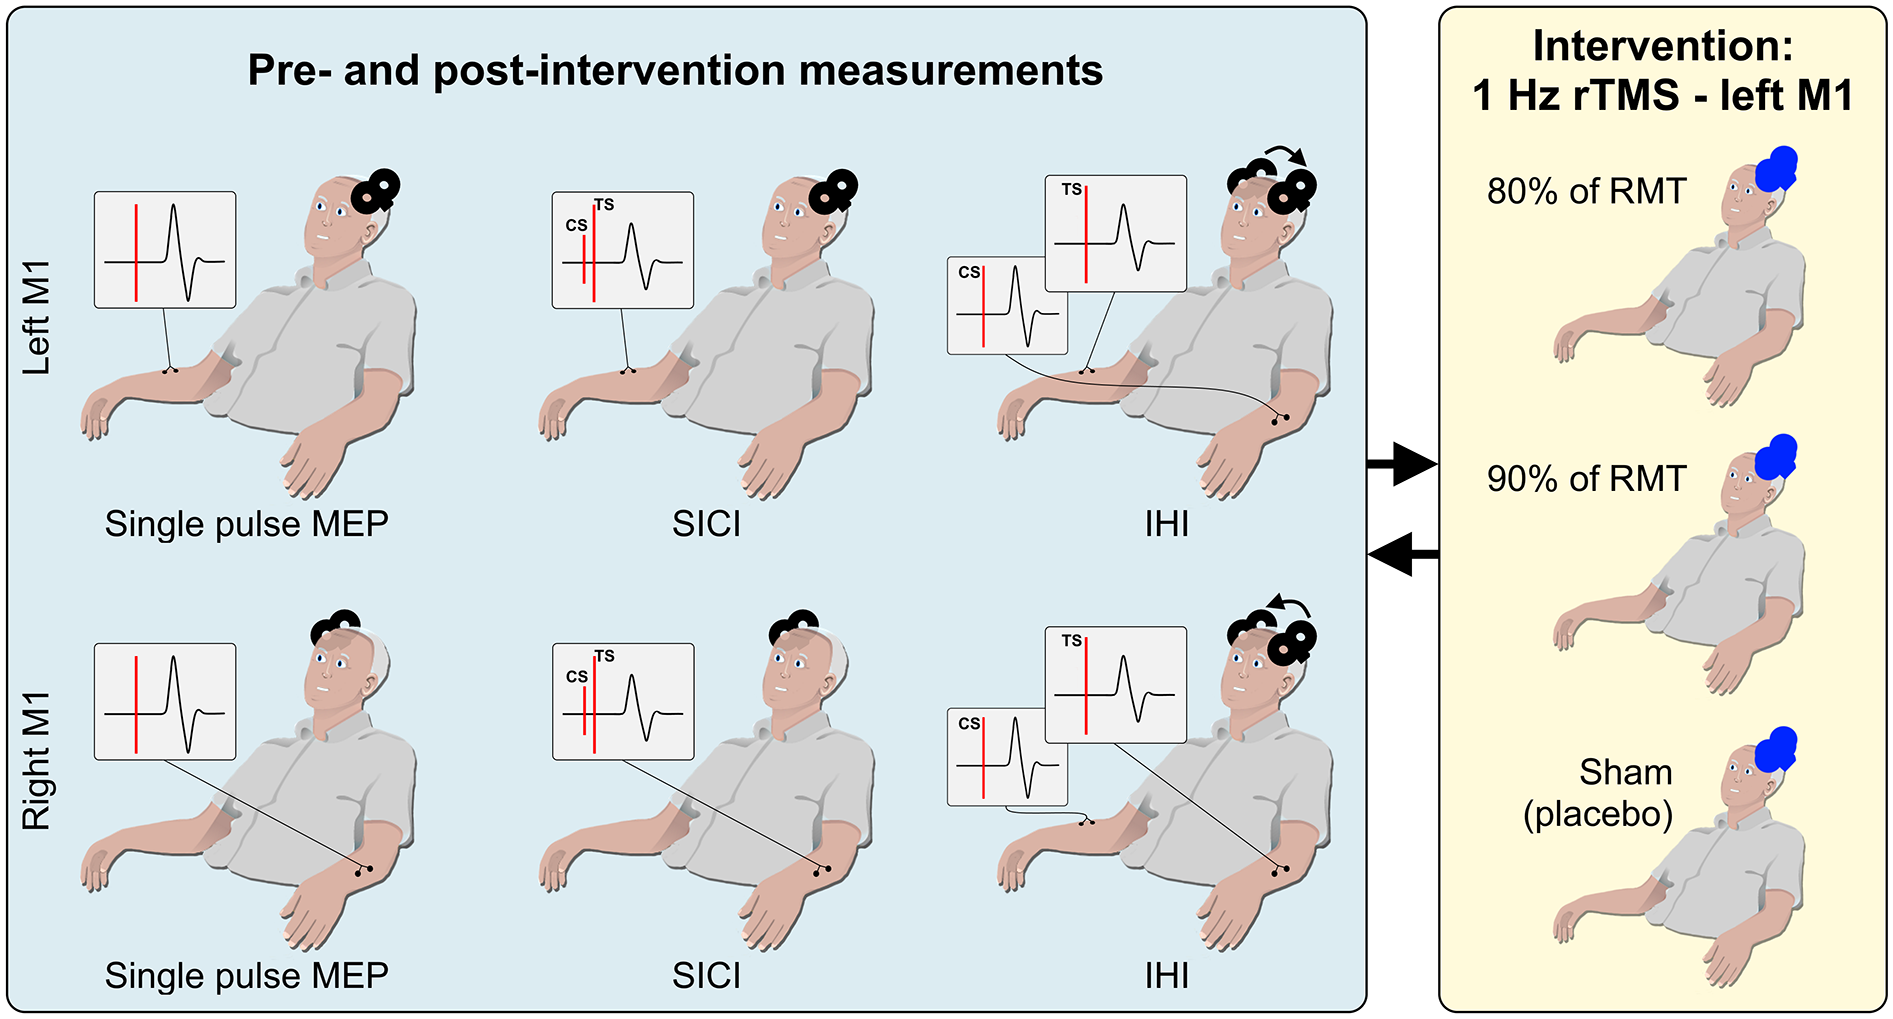
Experimental overview. All participants (n = 20) participated in 3 sessions. In each session a different intervention was used, namely rTMS80, rTMS90, or sham stimulation. The order of sessions was randomized. Within each session there was a set of pre- and post-intervention measurements in both left and right M1: (I) Single pulse MEP at intensities 5% below RMT up to 80% MSO to calculate an SRC, (II) SICI with the CS at 60% or 80% of RMT, and (III) IHI, with inter-stimulus intervals of 2 or 10 ms.
TMS Measures of M1 Excitability and Interhemispheric Inhibition
Detailed description of the employed TMS and rTMS protocols were previously published by our group. 29 Briefly, before and immediately following LM1 rTMS, single and paired pulse TMS was applied to stimulated LM1 and the non-stimulated RM1 to determine M1 excitability and IHI (Figure 1). Electromyographic (EMG) activity (bandpass: 3 Hz to 1 kHz, sampling rate: 5 kHz) of the extensor carpi ulnaris (ECU) muscle was recorded with surface electrodes (11-mm diameter) in a belly-tendon montage with a 5-cm distance between electrodes using a customized data acquisition program in LabVIEW (LabVIEW, National Instruments, CA, USA). The active electrode was placed over the motor point of the ECU muscle and the reference electrode proximal to it.
Single and paired-pulse TMS were applied using a figure-of-8 shaped coil (70-mm wing diameter) using 2 Magstim 2002 stimulators connected via a Bistim module (Magstim Company, UK). The coil was positioned perpendicular to the skull and oriented 45° to midline to induce current that flows posterior-anteriorly. 30 The optimal coil location for targeting the ECU (hotspot) was registered to a reconstructed MRI of each participant’s brain using a frameless neuronavigation system (BrainSight, Rogue Research, Montreal, Canada). Hot spots were verified at the beginning of each session but kept the same throughout the session. The RMT was determined using the adaptive method of Parameter Estimation by Sequential Testing. 31 For SRC, single-pulse TMS was administered at increasing intensities of 5% increments ranging from 5% MSO below the participants’ RMT up to 80% MSO.32,33 We opted not to increase the intensity further to minimize the chances of discomfort and increase chances of completion of all experiments by all participants. Ten stimuli were given at each intensity with an interstimulus interval (ISI) of 5 seconds. While more stimuli could reduce variability,34-36 we could not extend the experimental time further as experiments lasted for ~4 hours.
Paired-pulse TMS was used to measure intracortical inhibitory networks using the short-interval intracortical inhibition (SICI) paradigm. 37 In this paradigm a subthreshold conditioning pulse (CS, set at 60% (SICI60) or 80% RMT (SICI80)) precedes a suprathreshold test pulse (TS, 120% RMT) at an ISI of 2 ms. The CS intensity of 60%MT was added to account for earlier findings that demonstrated a non-linear relationship between maximum inhibitory effect of CS and rMT.1-3 In some cases, it is possible that the CS of 80%MT is too high given the stroke related increase in rMT, which may lead to suprathreshold stimulation in the event of any intervention related decreases in MT. Single TS and CS pulses and paired CS-TS pulses were administered in a pseudo-randomized order for a total of 10 TS, 4 CS, and 10 paired CS-TS pulses for both SICI60 and SICI80.
For IHI, stimulation was administered through 2 figure-of-8 coils (50- and 70-mm diameter) connected to 2 single Magstim 2002 stimulators (Magstim Company, UK). To position both coils over the skull a smaller coil was selected for the TS (45° to midline) and the larger coil for CS was oriented lateral-medially. 38 The intensity of the CS and TS were adjusted to produce a 1.0 to 1.5 mV MEP response. Ten paired pulses were applied at ISIs of 2 and 10 ms and intermixed with 10 single TS pulses in a pseudo-randomized order. The 10 ms condition measures inhibition, while the 2 ms condition acts as a control since it is too short to allow mediation of inhibition 39 or facilitation. 40 IHI was measured from LM1 to RM1, and vice versa with the order being randomized across experimental sessions.
Intervention With Low-Frequency LM1 rTMS
The LM1 rTMS protocol has previously been described in detail.22,41 RTMS was applied at 1 Hz frequency for a total of 900 pulses over 15 minutes to the LM1 ECU hotspot at either 80% (rTMS80) or 90% (rTMS90) of RMT or sham.
Data Analysis
TMS Measures
EMG data were analyzed in LabVIEW. EMG recordings were visually inspected and trials with increased EMG background activity, that is, amplitudes exceeding 50 µV in the in the 20 ms preceding the TMS pulse, were excluded from further analysis. A minimum of 5 of the 10 trials were required for calculation of the mean and SD of peak-to-peak MEP amplitudes at each intensity (Supplemental Figure S1) and condition per participant, otherwise the data point was coded as missing data.22,29,42 Note that this primarily happened at intensities at or under the RMT, that is, at the lower end of the SRC. Outliers were defined as exceeding a boundary defined by the 75th percentile of the sample + 3 times the interquartile range.
For analysis of SRCs, the MEP amplitudes were plotted as a function of stimulus intensity (Supplemental Figure S1). Data points below the level of measurable MEP amplitudes were set at 0. Then, a 3-parameter sigmoid Boltzmann function was applied to each SRC using the Levenberg-Marquardt least mean-squares algorithm.32,43,44 Three parameters were extracted from the fitted function for each SRC: maximum motor evoked potential (MEPMAX), S50, and M (Supplemental Figure S1). 29 Here, MEPMAX represents an estimate of maximum MEP amplitude, S50 represents an estimate of the stimulation intensity (in % MSO) needed to evoke 50% of the maximum MEP amplitude, and M represents the slope parameter. To reliably estimate parameters across participants we applied a jackknife (N − 1) procedure (see Supplemental Material for a detailed description of this analysis). SICI and IHI were expressed as the ratio of the mean conditioned MEP amplitude (CS–TS) to the mean test MEP amplitude (TS alone). Data from 3 participants were discarded from the SICI analysis due to their identification as outliers.
Statistical Analyses
Statistical significance was assessed at the .05 level in all cases and mean values are shown ±standard error (SD/√N). There were no corrections for multiple comparisons. All statistical analyses were conducted using R (R Core Team, 2017) or JMP13 software (SAS Institute, Cary NC).
Stimulus Response Curve (SRC)
Intervention-related changes in SRC curve parameters (MEPMAX, S50, and M) were examined using a repeated-measures analysis of variance (ANOVA). Parameters were used as the dependent variable and time (pre-intervention and post-intervention), hemisphere (LM1 and RM1), and intervention (sham, rTMS80, and rTMS90) were the independent variables. Post hoc 2-tailed t-tests were used to compare intervention effects on delta curve estimates and curve parameters between interventions.
Short-Interval Intracortical Inhibition (SICI)
In the primary analysis, a mixed effects ANOVA was used to test the effect of the interventions on SICI. SICI was the dependent variable and the hemisphere (LM1 and RM1), intervention (sham, rTMS80, and rTMS90), time (pre-intervention and post-intervention), and CS intensity (SICI60 and SICI80) were the independent variables. A repeated-measures ANOVA was used to test for pre-intervention differences across sessions with intervention as the independent variable and pre-intervention SICI the dependent variable. To determine whether the effect of the different intervention on change in SICI values (ΔSICI) differed depending on the level of SICI at baseline45,46 the effect of pre-SICI on ΔSICI was tested using a 4-way mixed model ANOVA with pre-intervention SICI, hemisphere (LM1 and RM1), CS intensity (SICI60 and SICI80), and intervention (sham, rTMS80, and rTMS90) as independent variables and ΔSICI as the dependent variable.
Interhemispheric Inhibition (IHI)
The primary analyses used a 4-way ANOVA to analyze the effect of the interventions on IHI. Resting IHI was the dependent variable and the hemisphere (LM1 and RM1), interventions (sham, rTMS80, and rTMS90), ISI (2 and 10 ms), and time (pre-intervention and post-intervention) were the independent variables. As follow up on significant effects or interactions, t-tests were calculated. A repeated-measures ANOVA was used to test for pre-intervention differences across sessions with intervention as the independent variable and pre-intervention IHI as dependent variable. In a secondary analysis, we also tested whether intervention-related changes in delta-IHI (ΔIHI) were dependent on pre-IHI using a 4-way mixed model ANOVA. Pre-IHI, hemisphere (LM1 and RM1), intervention (sham, rTMS80, and rTMS90) and ISI were independent variables and ΔIHI was the dependent variable.
Results
Of the 20 participants who participated in the task, 18 participants had complete data sets. One participant reported migraine after the first experimental session and was subsequently excluded from additional sessions, and data from 1 condition in 1 additional participant was not collected due to scheduling conflict (n = 20 for rTMS90, n = 19 for rTMS80, and n = 18 for sham). Resting MTs were similar among sessions (mean ± SD, sham: 58.1 ± 10.5, rTMS80: 58.8 ± 10.1, rTMS90: 57.1 ± 10.1), with no significant differences (F(2,30) = 1.39, P = .27).
LM1 rTMS-Related Effects on SRC
No significant main effects or interactions were observed for parameters M and S50 (P > .14, Table 1, also see limitations section). For the MEPMAX parameter significant effects of time (F(1,19) = 4.98, P = .038) and hemisphere (F(1,19) = 4.87, P = .040) were observed . Second, to determine each intervention’s effect on curve parameters, we evaluated within-session differences in pre- and post-intervention curve parameter estimates (Figure 2). A 2-tailed t-test determined that rTMS90 significantly increased MEPMAX in LM1 (t(19) = 2.96, P = .008) and M in RM1 (t(19) = 2.30, P = .033; Figure 3, Supplemental Table 1) while sham or rTMS80 had no significant effect on curve parameter estimates (P > .05). Follow-up comparisons revealed a significant difference between the effect of rTMS90 and rTMS80 on the MEPMAX-estimate in the LM1 (t(19) = 2.19, P = .041), with no significant differences between other pairings of interventions (P > .13, Supplemental Table 2).
Repeated Measures ANOVAs on SRC Parameters M, MEPMAX, and S50. Statistically significant effects are indicated in bold.

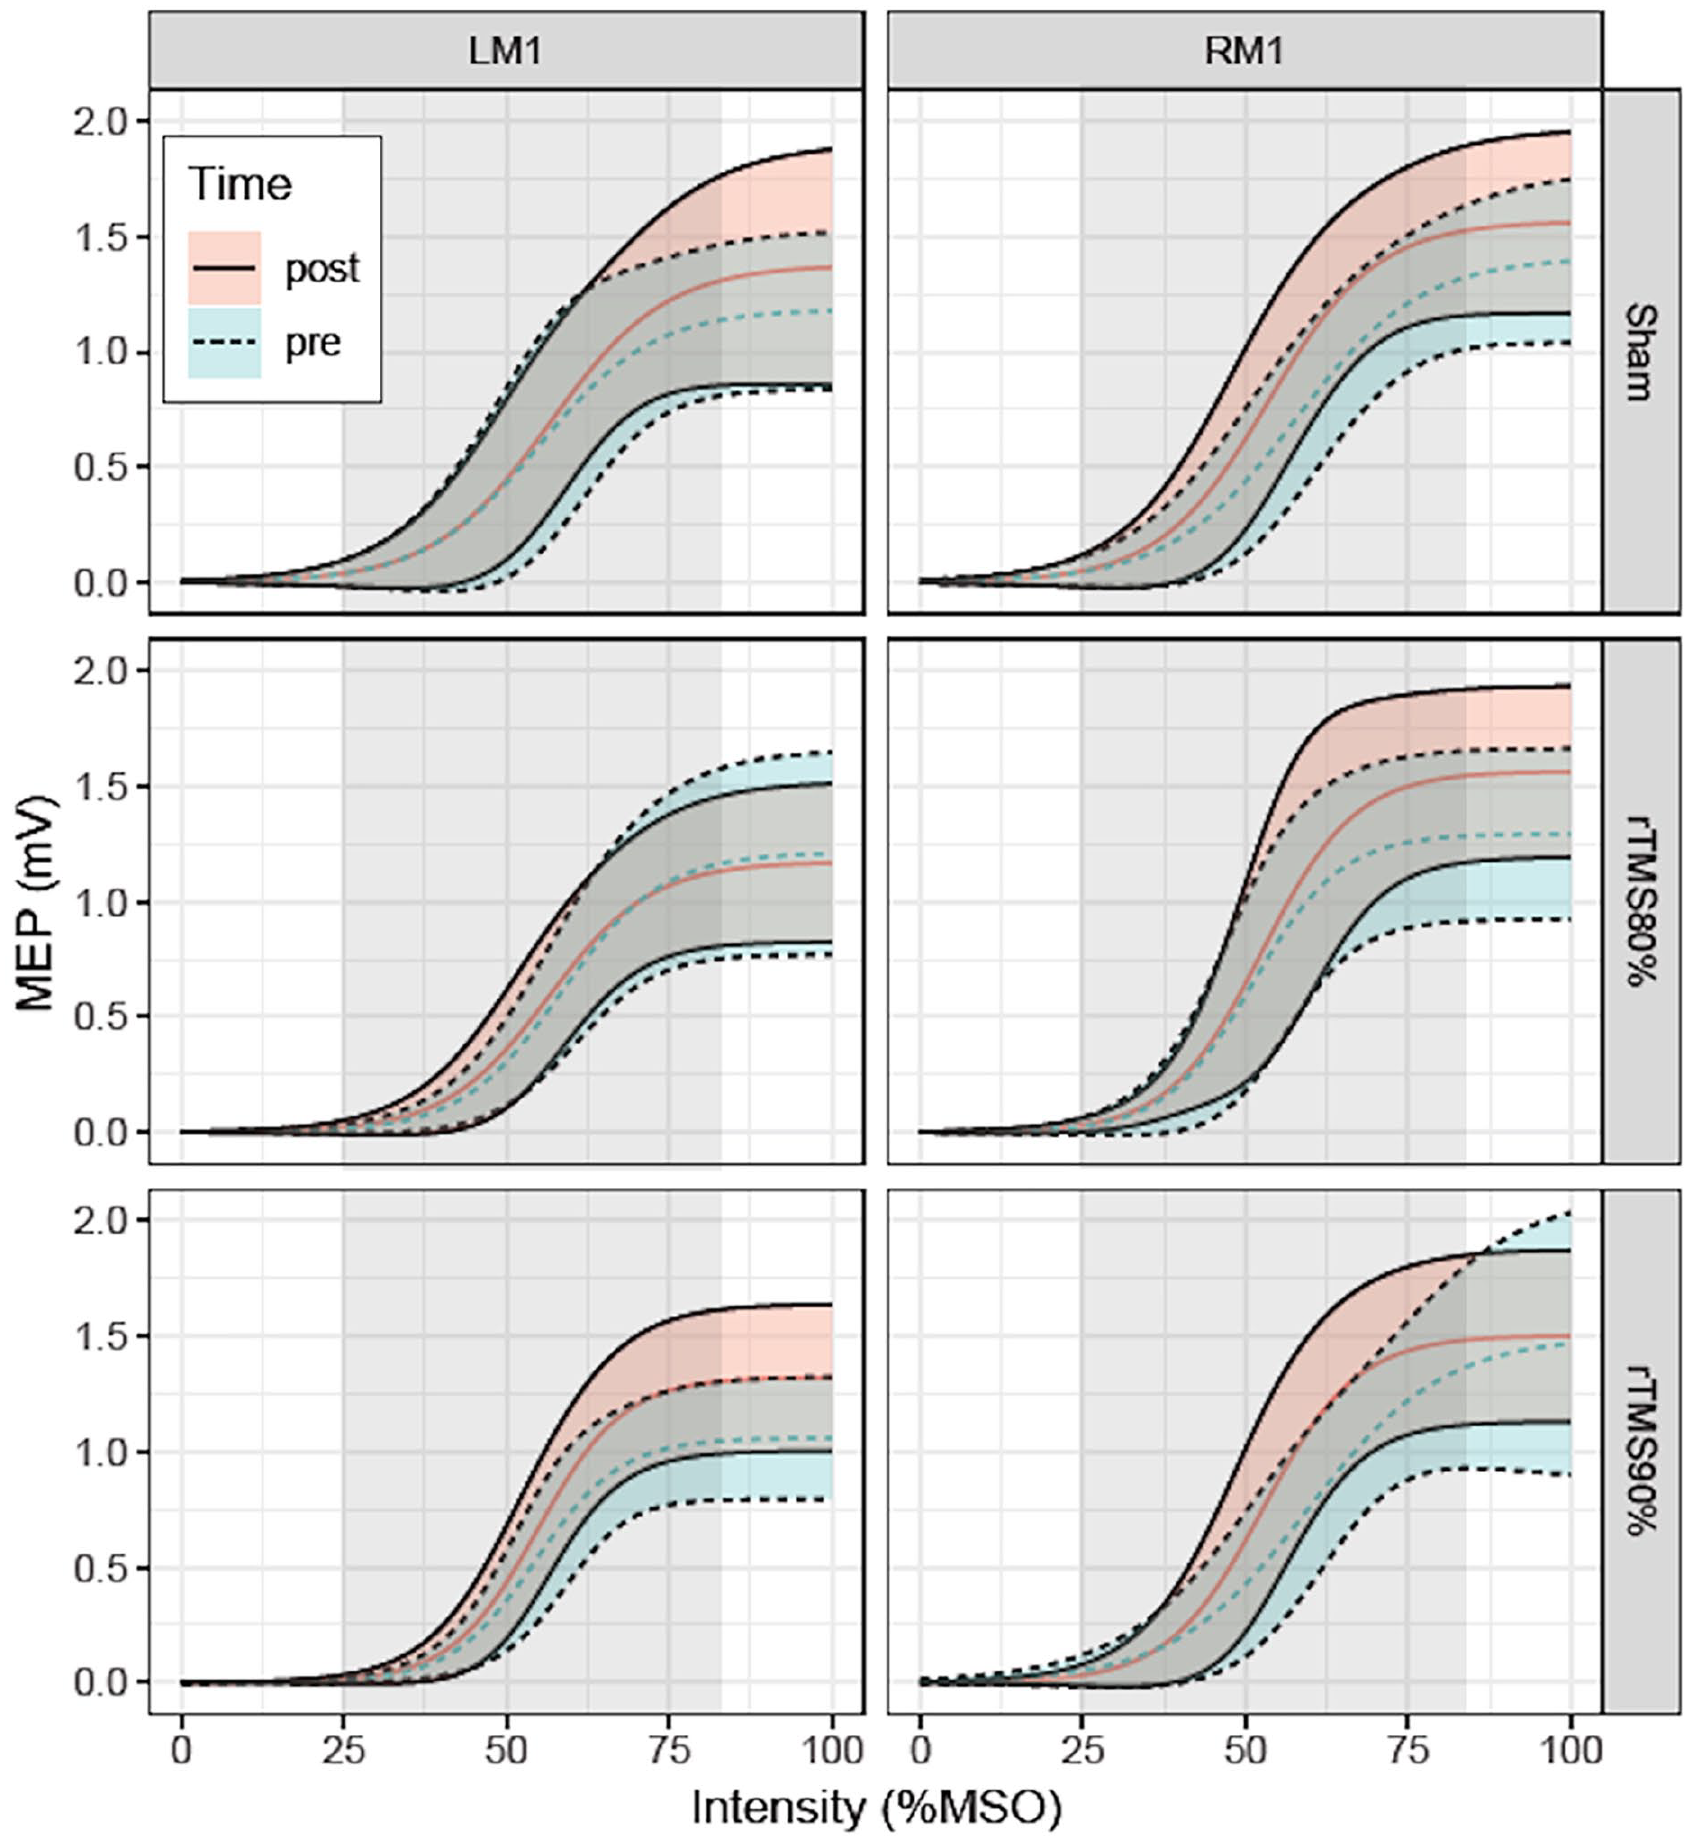
Effect of LF-rTMS on SRC (n = 20 for rTMS90, n = 19 for rTMS80, and n = 18 for sham). SRCs pre- and post-intervention with % maximum stimulator output (MSO) plotted against MEP amplitude (mV) with ±1 Jackknife-corrected SD (shaded area) for rTMS stimulation on LM1 (left panel graphs) and RM1 (right panel graphs). The LM1 LF-rTMS intensities (sham, rTMS80, rTMS90) are displayed horizontally. MEP amplitudes above 80% MSO were estimated from the calculated MEPMAX. The gray shaded area indicates the range of MSO values where data was collected.
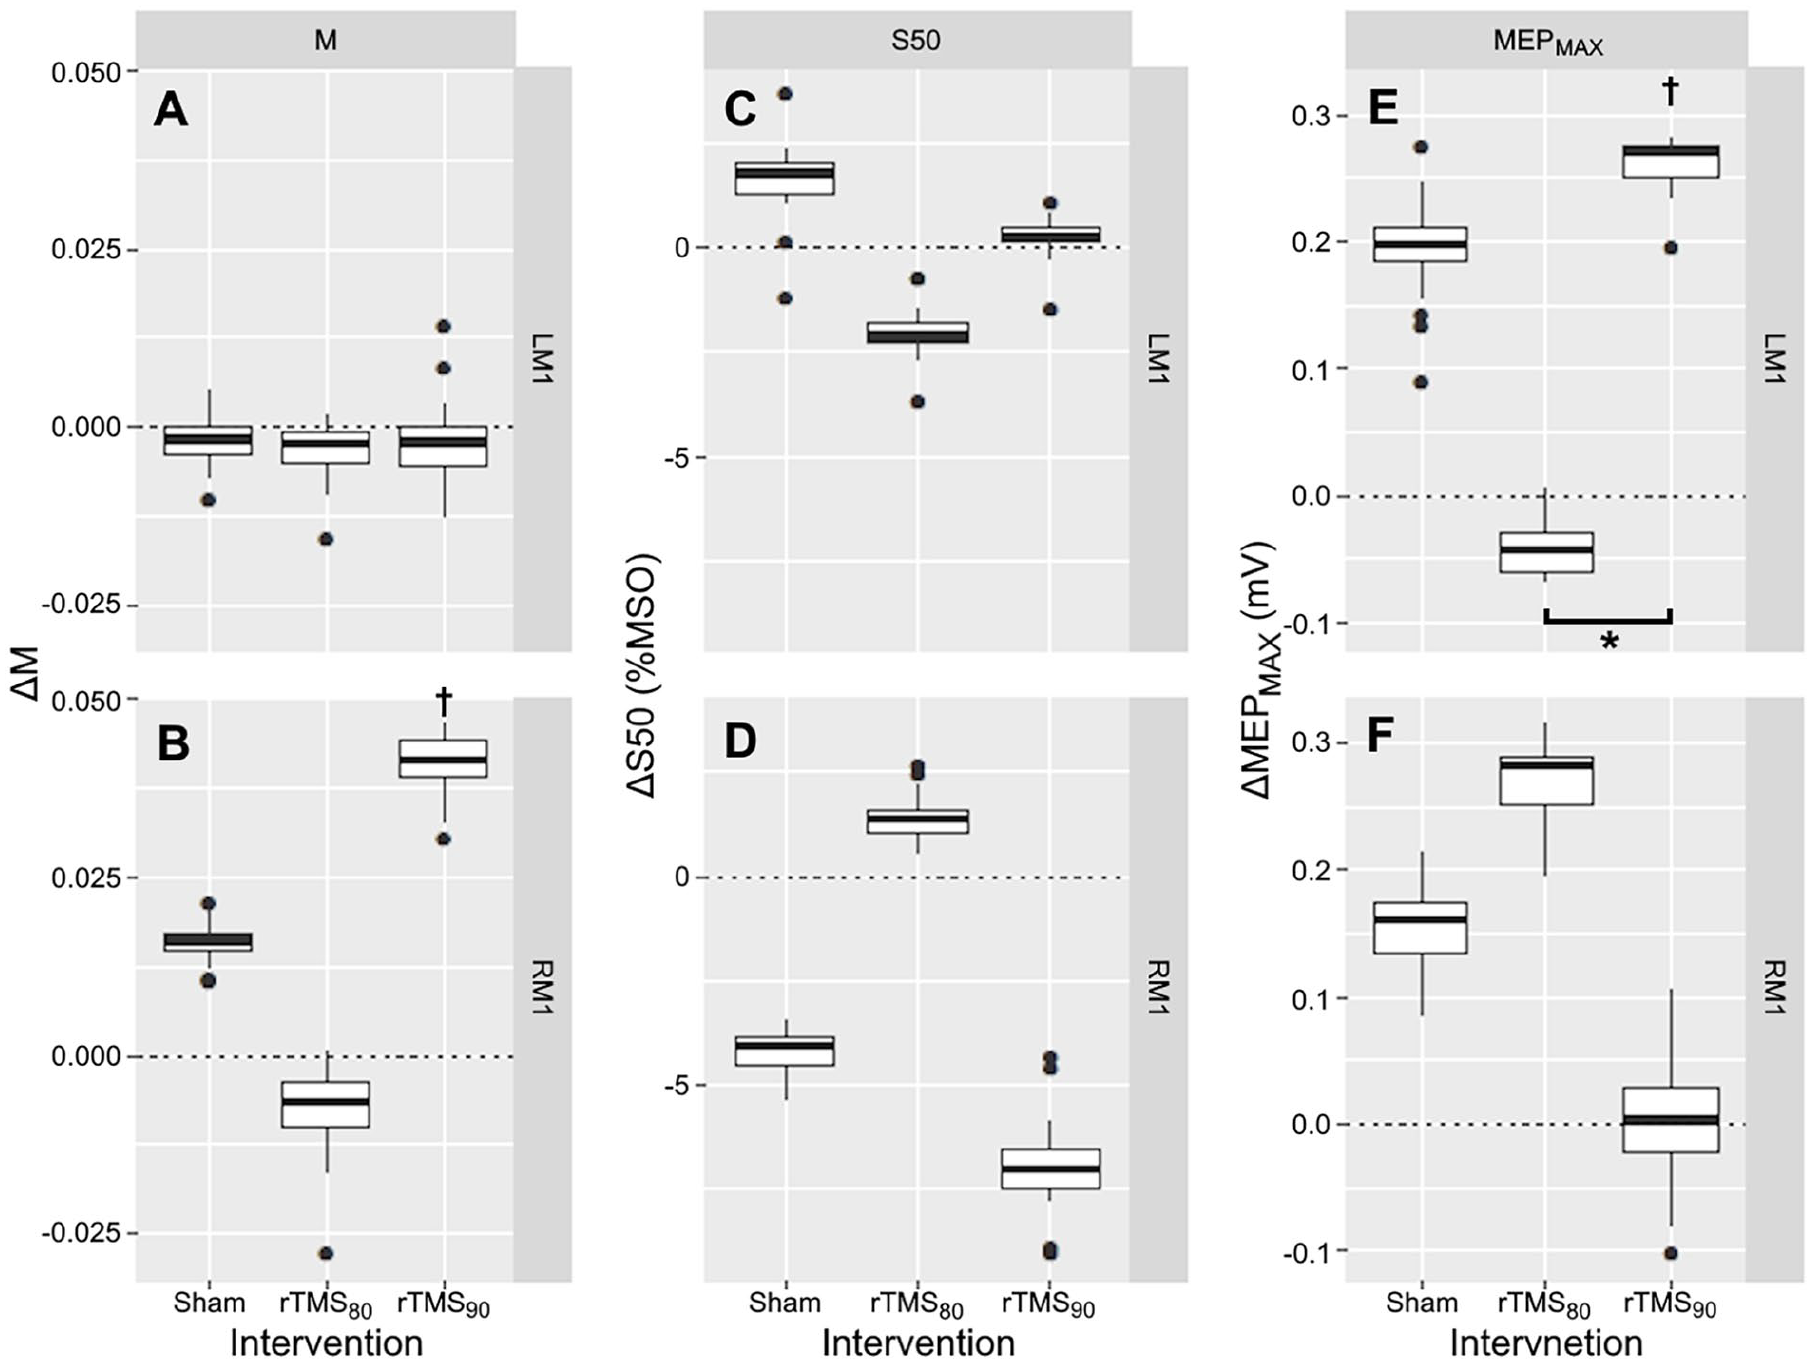
Effect of LM1 rTMS on SRC curve parameter (n = 20 for rTMS90, n = 19 for rTMS80, and n = 18 for sham). Box and whisker plots depicting the median and distribution of the change (Δ) in SRC parameters defined as the difference (post-intervention – pre-intervention) of: Slope-parameter ΔM (A and B), inflection point ΔS50 (C and D), and ΔMEPMAX (E and F) calculated for the LM1 rTMS intensities (sham, rTMS80, and rTMS90). Values >0 indicates an increase in the parameter, =0 indicates no change, and <0 indicates a decrease in the parameter. RTMS90 significantly increased MEPMAX in LM1 (P = .007) and M-estimate in RM1 (P = 0.032). Sham and rTMS80 had no significant effect on curve parameter estimates.
LM1 rTMS-Related Effects on SICI
First, we tested the effects of rTMS on SICI, without controlling for baseline SICI differences (Supplemental Table 3). A statistically significant main effect of hemisphere (F(1,16) = 6.05, P = .014) was observed. Specifically, SICI in LM1 was lower than in RM1 (LM1: 0.75 ± 0.05, RM1: 0.68 ± 0.05). Further, a main effect of CS strength was observed (F(1,16) = 11.43, P < .001), where the inhibitory effect of SICI80 is on average stronger than SICI60. This is reflected by generally lower values (for pre and post) of SICI80 compared to SICI60, meaning that the means are more left on the x-axis and lower on the y-axis. Inhibition was stronger for SICI80 (0.66 ± 0.05) compared to SICI60 (0.77 ± 0.05; Figure 4). The effects of intervention and time or any interactions between these variables were not statistically significant (P > .18, Supplemental Table 3).
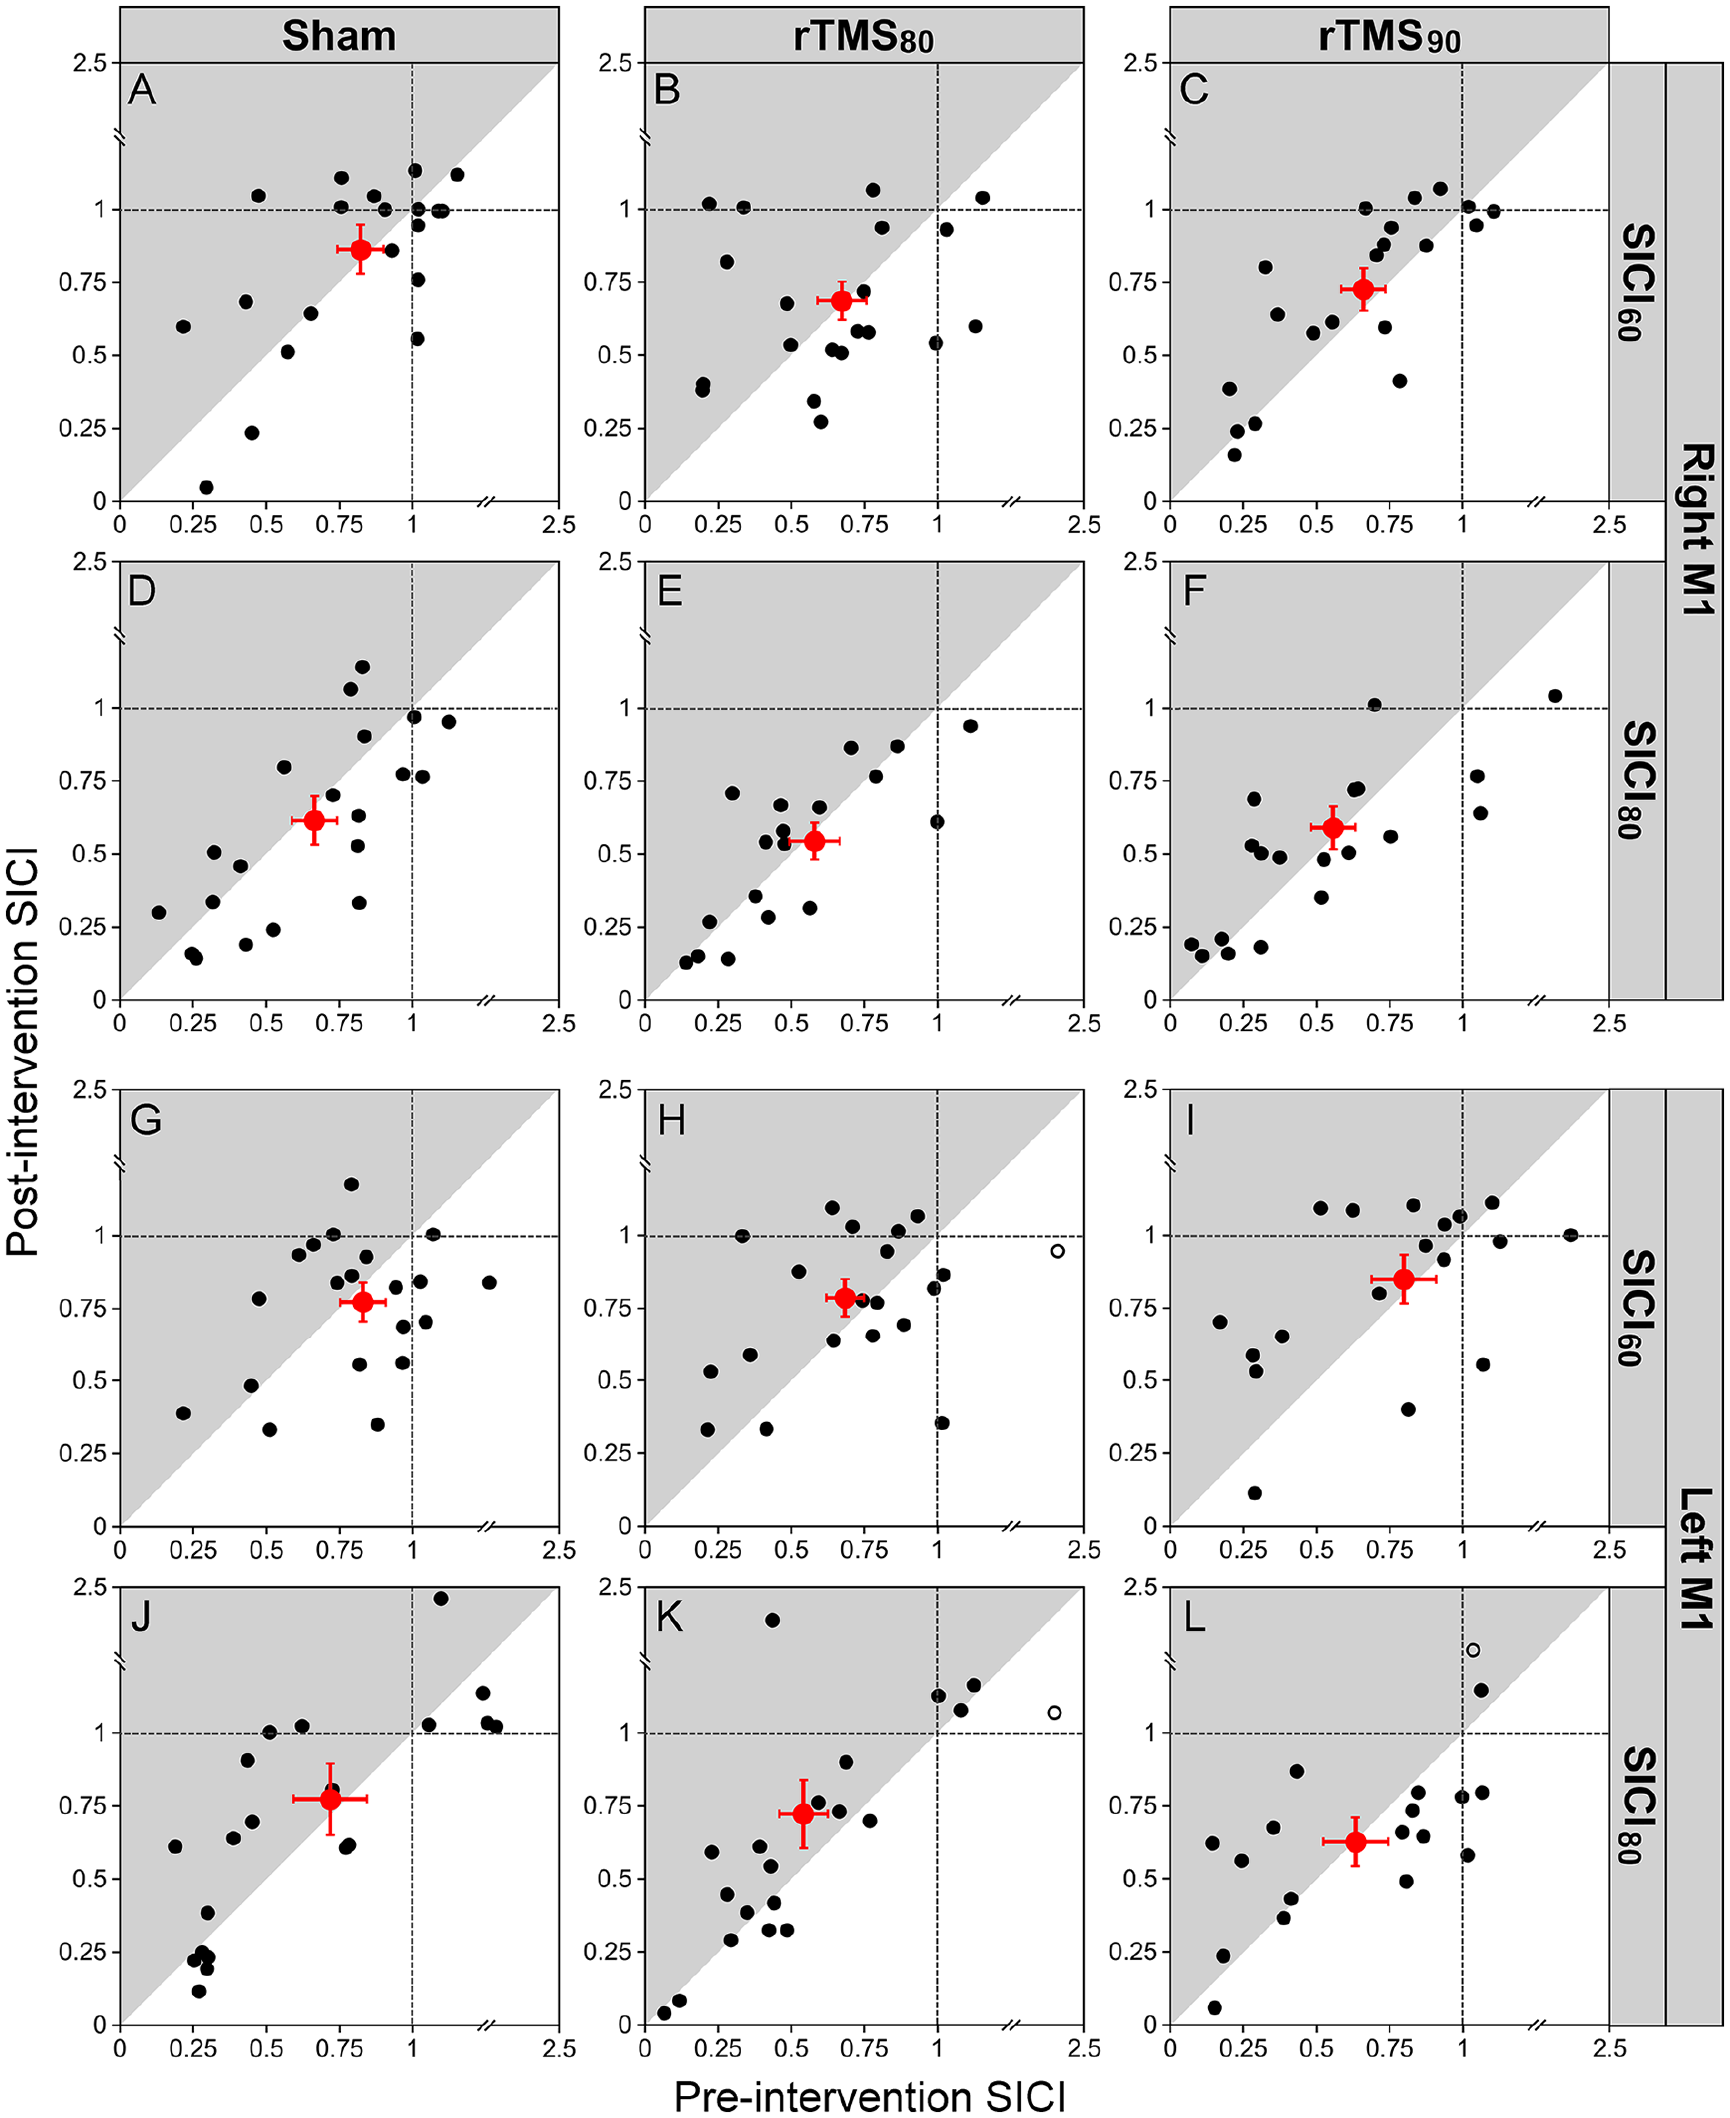
Effect of LM1 rTMS on SICI (n = 20 for rTMS90, n = 19 for rTMS80, and n = 18 for sham). Figures A-L show the pre-intervention SICI values (x-axis) and post-intervention SICI values (y-axis) for LM1 and RM1 depending on the different interventions sham, rTMS80, and rTMS90. The intensity of the conditioning stimulus (CS) was either 60% or 80% of RMT. SICI is expressed as a ratio of the conditioned test stimulus to the unconditioned test stimulus. The red circles indicate the group averages (error bars represent standard error of mean [SEM]) of all data included in the analysis (filled black circles). Outliers are plotted in open circles (not included in calculation of mean and data analysis). Data points located in the gray shading indicate a decrease in inhibition from pre- to post-intervention. Data points located in the white shading represent an increase inhibition from pre- to post-intervention. Data located close to the diagonal line represent no change. Note that 1 outlier is not plotted in K (coordinate x = 3.12, y = 0.41) for purposes of illustration clarity. Further, a main effect of CS strength was observed (F = 11.43, P < .001), where SICI60 is on average stronger than SICI80. This is reflected by generally higher values (for pre and post) of SICI compared to SICI, meaning that the means are more right on the x-axis and higher on the y-axis.
Second, we tested whether baseline inhibitory state (pre-SICI) had an effect on intervention-related changes in SICI (Table 2). 46 A significant 3-way interaction between pre-SICI, hemisphere, and intervention was found (F(2,32) = 4.42, P = .013), indicating that baseline SICI affects hemisphere-dependent changes induced by the intervention. Overall, a negative association was observed between pre-SICI and intervention-related change in SICI. This suggests that participants with weaker inhibition pre-intervention experienced greater increases in inhibition post-intervention and vice versa (Figure 5). Interestingly, follow-up correlation analyses (Figure 5) indicated that this relationship was significant for rTMS90 (r = −.656, P < .001; both ΔSICI60 and ΔSICI80 combined) and sham (r = −.512, P = .031) in the LM1 but not for rTMS80 (r = −.241, P = .306). Conversely, in RM1 pre-SICI was related to effects of rTMS80 on post-SICI (r = −.699, P < .001), but not of rTMS90 (r = −.316, P = .175) or sham (r = .235, P = .319). Note that at group level pre-intervention SICI was comparable across conditions (F(2,32) = 3.15, P = .054, Supplemental Figure 2).
Mixed Model ANOVA of rTMS-related Effects on Change in SICI With Baseline SICI as Added Factor. Statistically significant effects are indicated in bold.

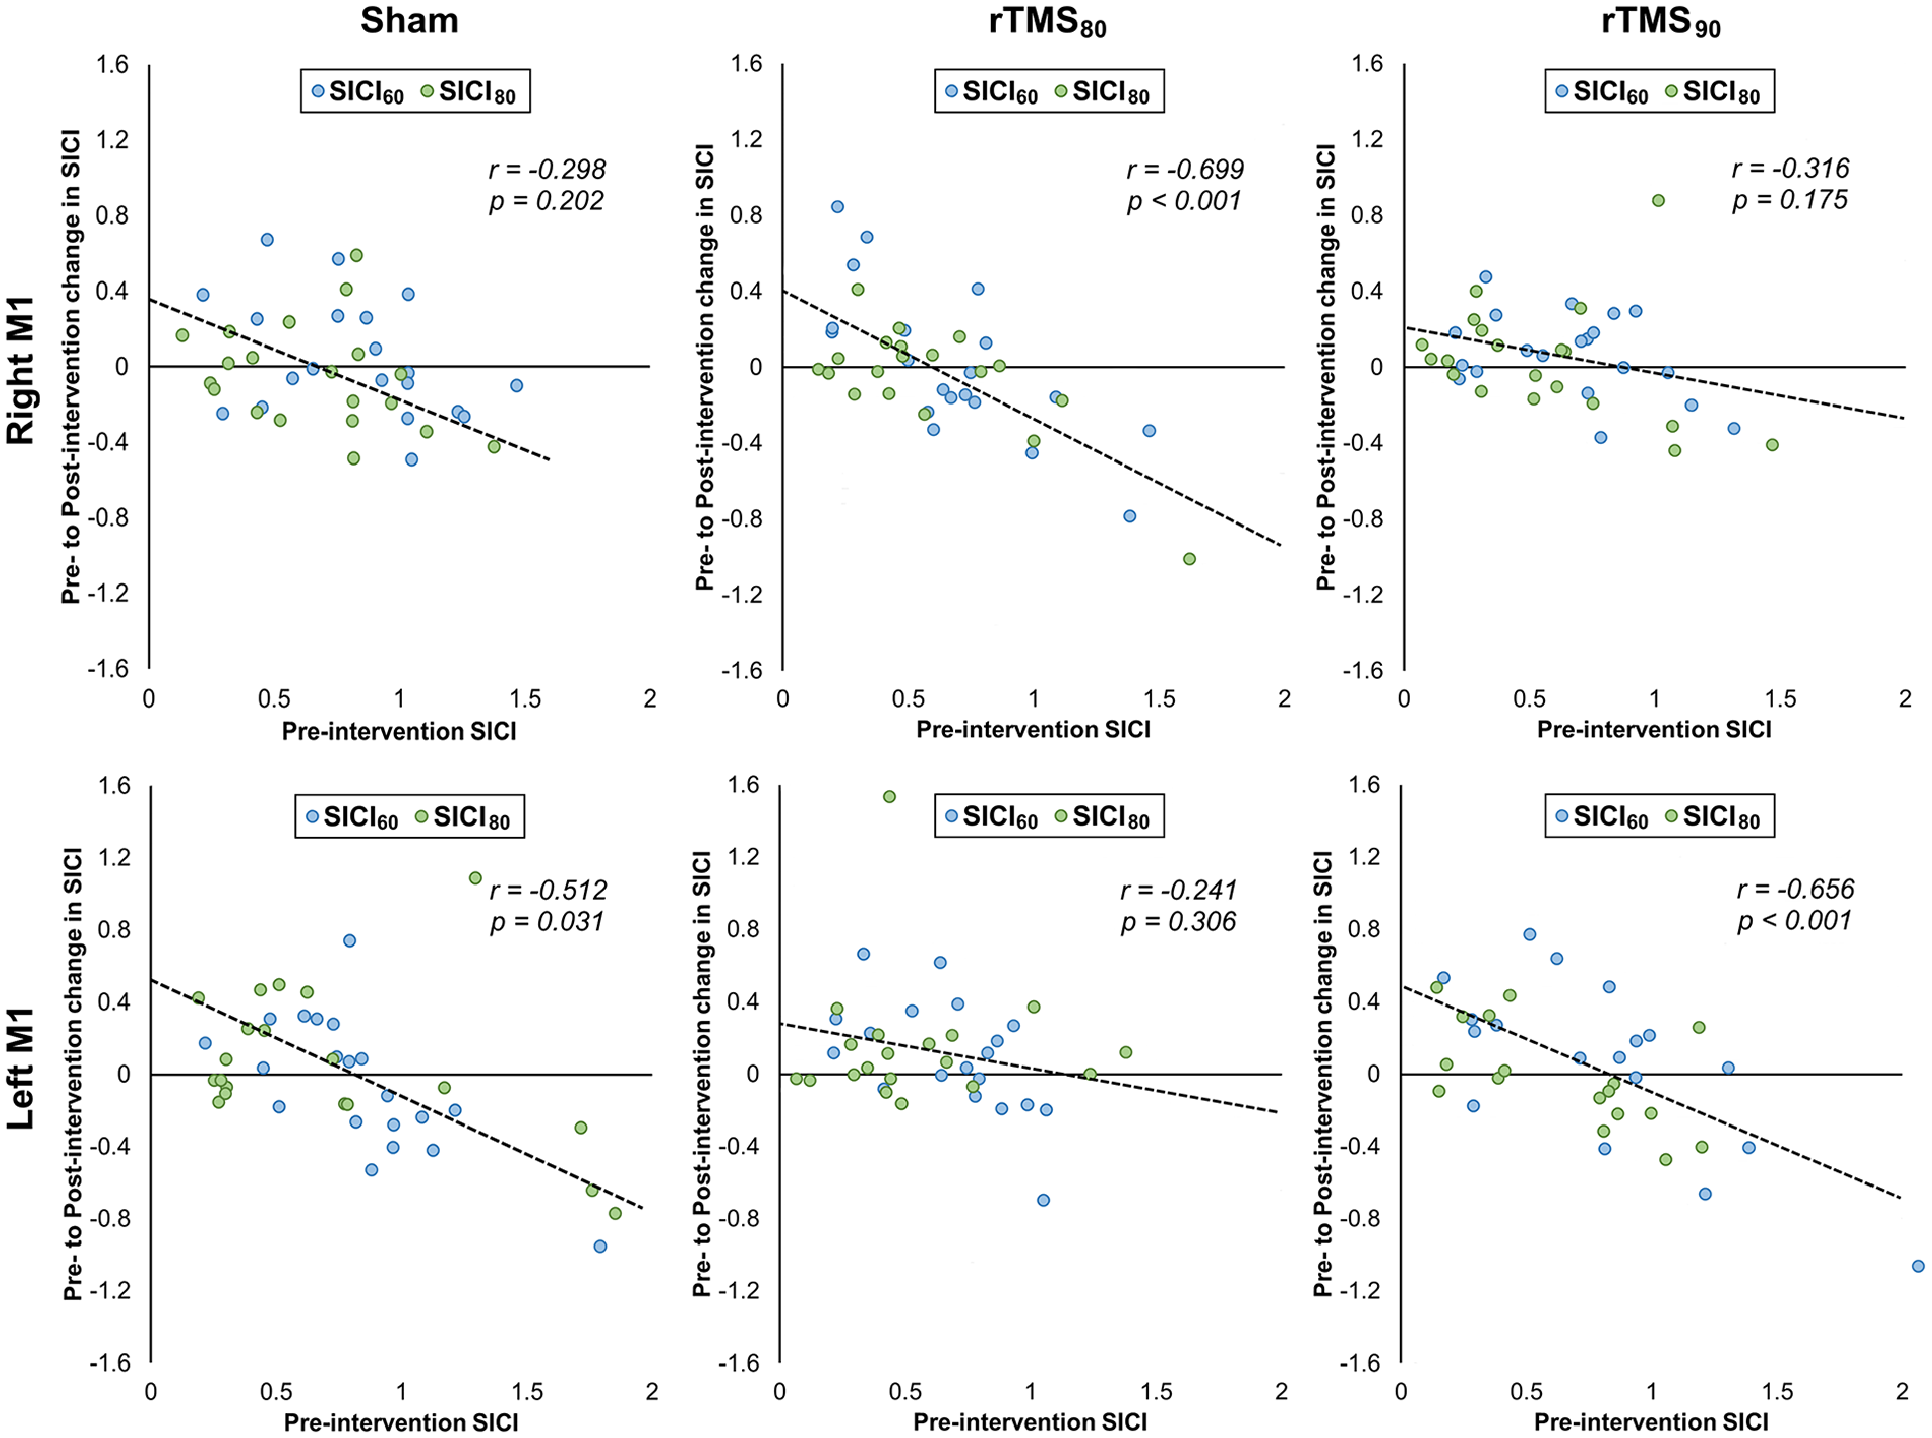
Correlation between pre-intervention SICI and the intervention related change in SICI (ΔSICI) for rTMS80 and rTMS90 for both RM1 and LM1. Note that pre-intervention SICI significantly predicts rTMS80-related effects on SICI in RM1, whereas pre-intervention SICI significantly predicts rTMS90-related effects on SICI in LM1.
LM1 rTMS-Related Effects on IHI
The results of a mixed model ANOVA are summarized in Supplemental Table 4. There are significant main effects for hemisphere (F(1,16) = 7.26, P = .007) and ISI (F(1,16)= 132.67, P < .001) but not for time or intervention. The interactions hemisphere × SI (F(1,16) = 6.15, P = .014) and intervention × time (F(2,32) = 5.18, P = .006) were statistically significant, but others were not. IHI at an ISI of 10 ms was greater from LM1 on RM1 (0.577 ± 0.047) than from RM1 on LM1 (0.783 ± 0.047). IHI at an ISI of 2 ms had no inhibitory effect (CS on TS from LM1 on RM1 (1.030 ± 0.047) or from RM1 on LM1 (1.011 ± 0.047). The significant 2-way interactions between Intervention × Time but lack of significant 3- and 4-way interactions with ISI and hemisphere indicates that ISI and the direction of IHI (LM1 on RM1 or RM1 on LM1) had no significant effect on the interventional effect (Figure 6). Specifically, rTMS90 strengthened inhibition between the 2 M1 (IHI pre: 0.92 ± 0.04 IHI post: 0.82 ± 0.04) and rTMS80 weakened inhibition between them (IHI pre: 0.79 ± 0.04; IHI post: 0.93 ± 0.04), with sham having no effect (IHI pre: 0.82 ± 0.04; IHI post: 0.85 ± 0.04; Figure 6). Post-hoc comparisons with contrasts demonstrated that the differences between rTMS90- and rTMS80-related effects were statistically significant (t(18) = 2.62, P = .009) while not statistically significant different from the effect of sham (P > .1).
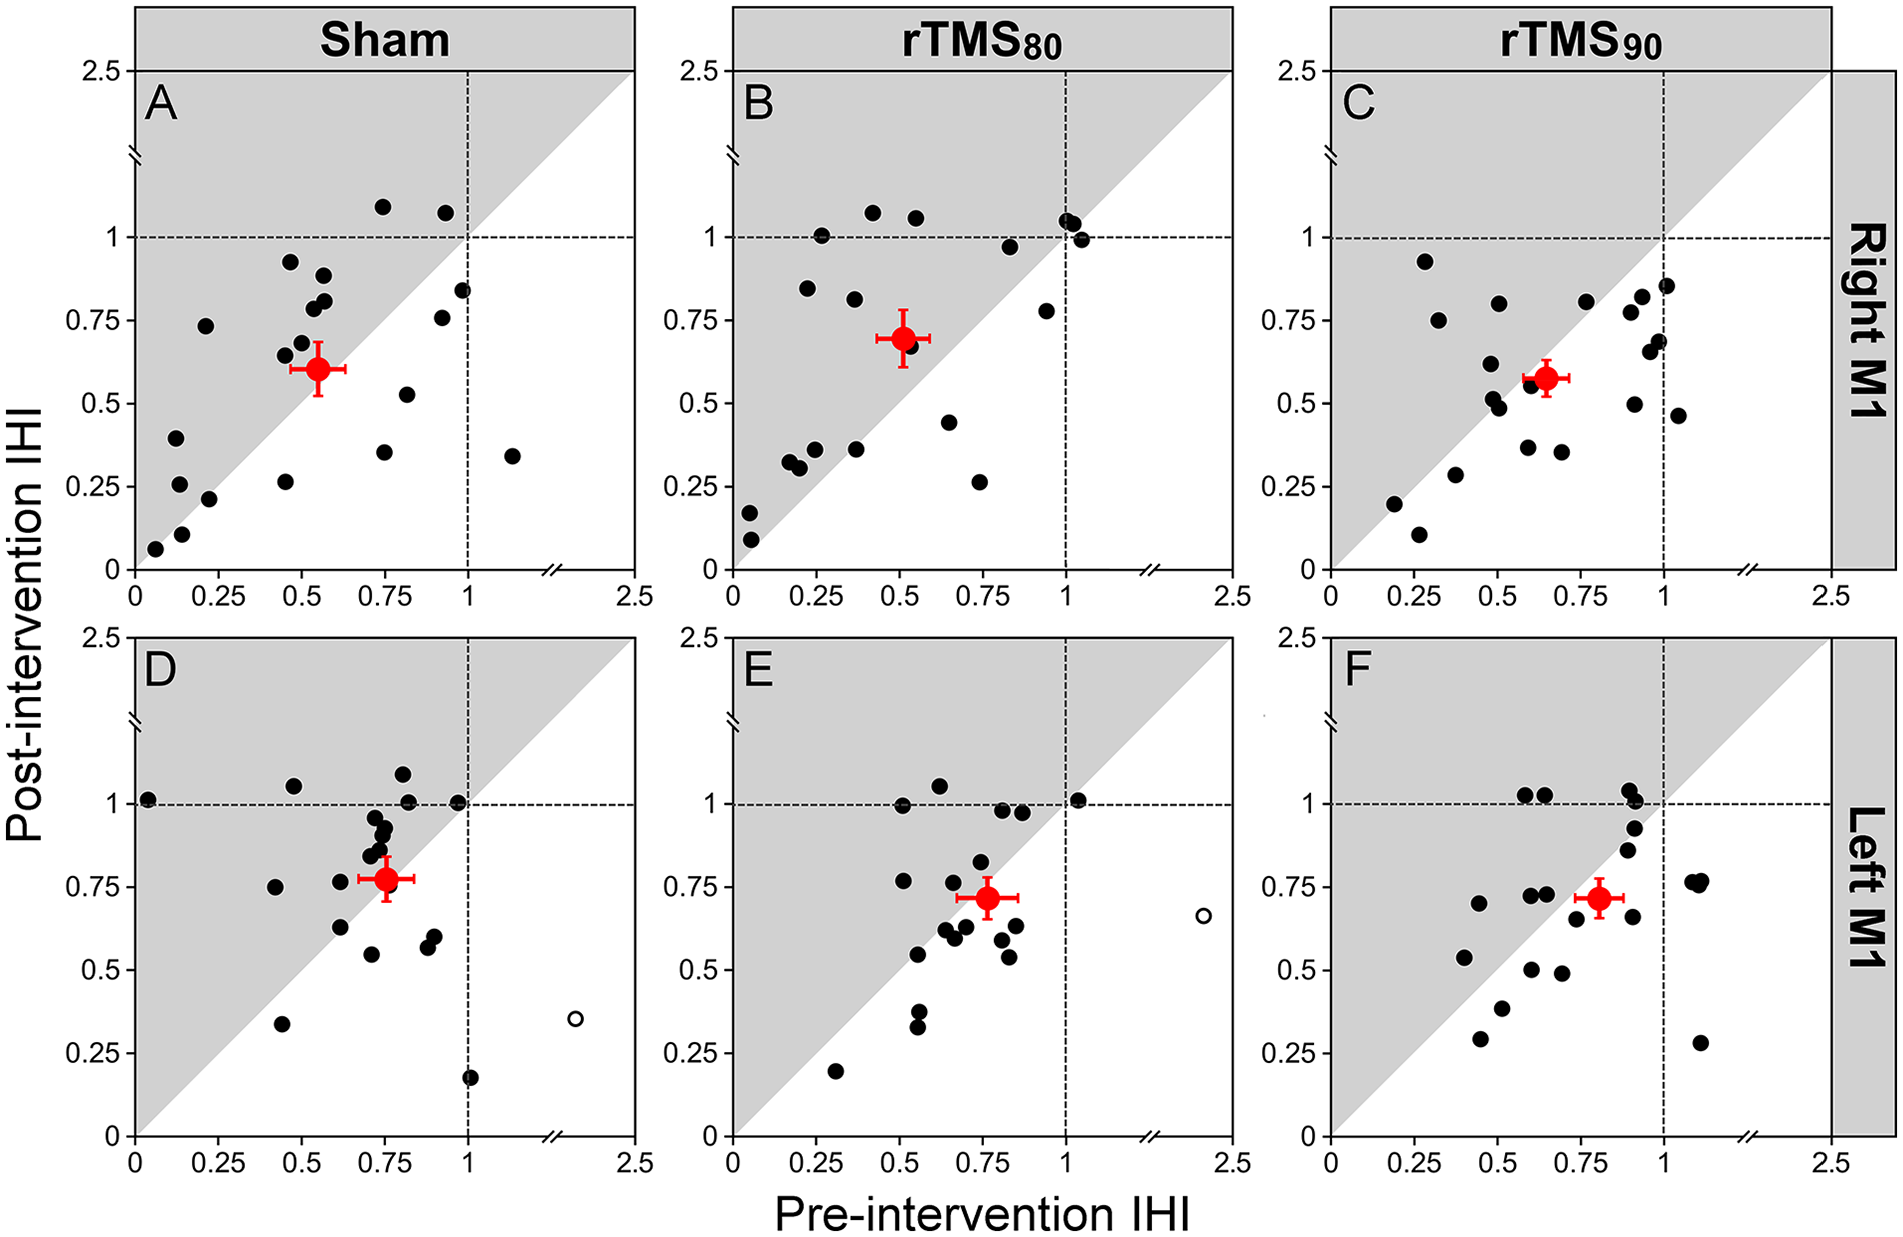
Effect of intervention on IHI (n = 20 for rTMS90, n = 19 for rTMS80, and n = 18 for sham. Plots in A-F show the pre-intervention IHI values (x-axis) and post-intervention IHI values (y-axis) of all participants for LM1 and RM1, depending on the different interventions sham, rTMS80, and rTMS90. IHI is expressed as a ratio of the conditioned test stimulus to the single test stimulus. The red circles indicate the group averages (error bars represent SEM) of all data included in the analysis (filled black circles). Outliers are plotted in open circles (not included in calculation of mean and data analysis). Data points located in the gray shading indicate a decrease in inhibition from pre- to post-intervention. Data points located in the white shading represent an increase in inhibition from pre- to post-intervention. Data points located close to the diagonal line represent no change. The direction of the IHI (LM1 to RM1), top (A-C) and RM1 to LM1, bottom (D-F).
Second, a mixed model ANOVA with pre-IHI, Hemisphere, Intervention, and ISI as the independent variables and ΔIHI as the dependent variable demonstrated significant main effects for pre-IHI (F(1,16) = 195.26, P < .001), Intervention (F(2,32) = 4.09, P = .018) and ISI (F(1,16) = 44.89, P < .001). Further, significant interactions hemisphere × pre-IHI (F(1,16) = 4.60, P = .033) and ISI × pre-IHI (F(1,16) = 4.06, P = .045) were observed with no other interactions between any other variables (Table 3). This indicates ΔIHI was dependent on pre-IHI depending on ISI and hemisphere (Figure 7), but the effect of intervention on delta ΔIHI was not dependent on these other variables. Finally, we found that pre-IHI was not different between conditions (Supplemental Figure S3).
Mixed Model ANOVA of rTMS-related Effects on Change in IHI With Baseline IHI as Added Factor. Statistically significant effects are indicated in bold.

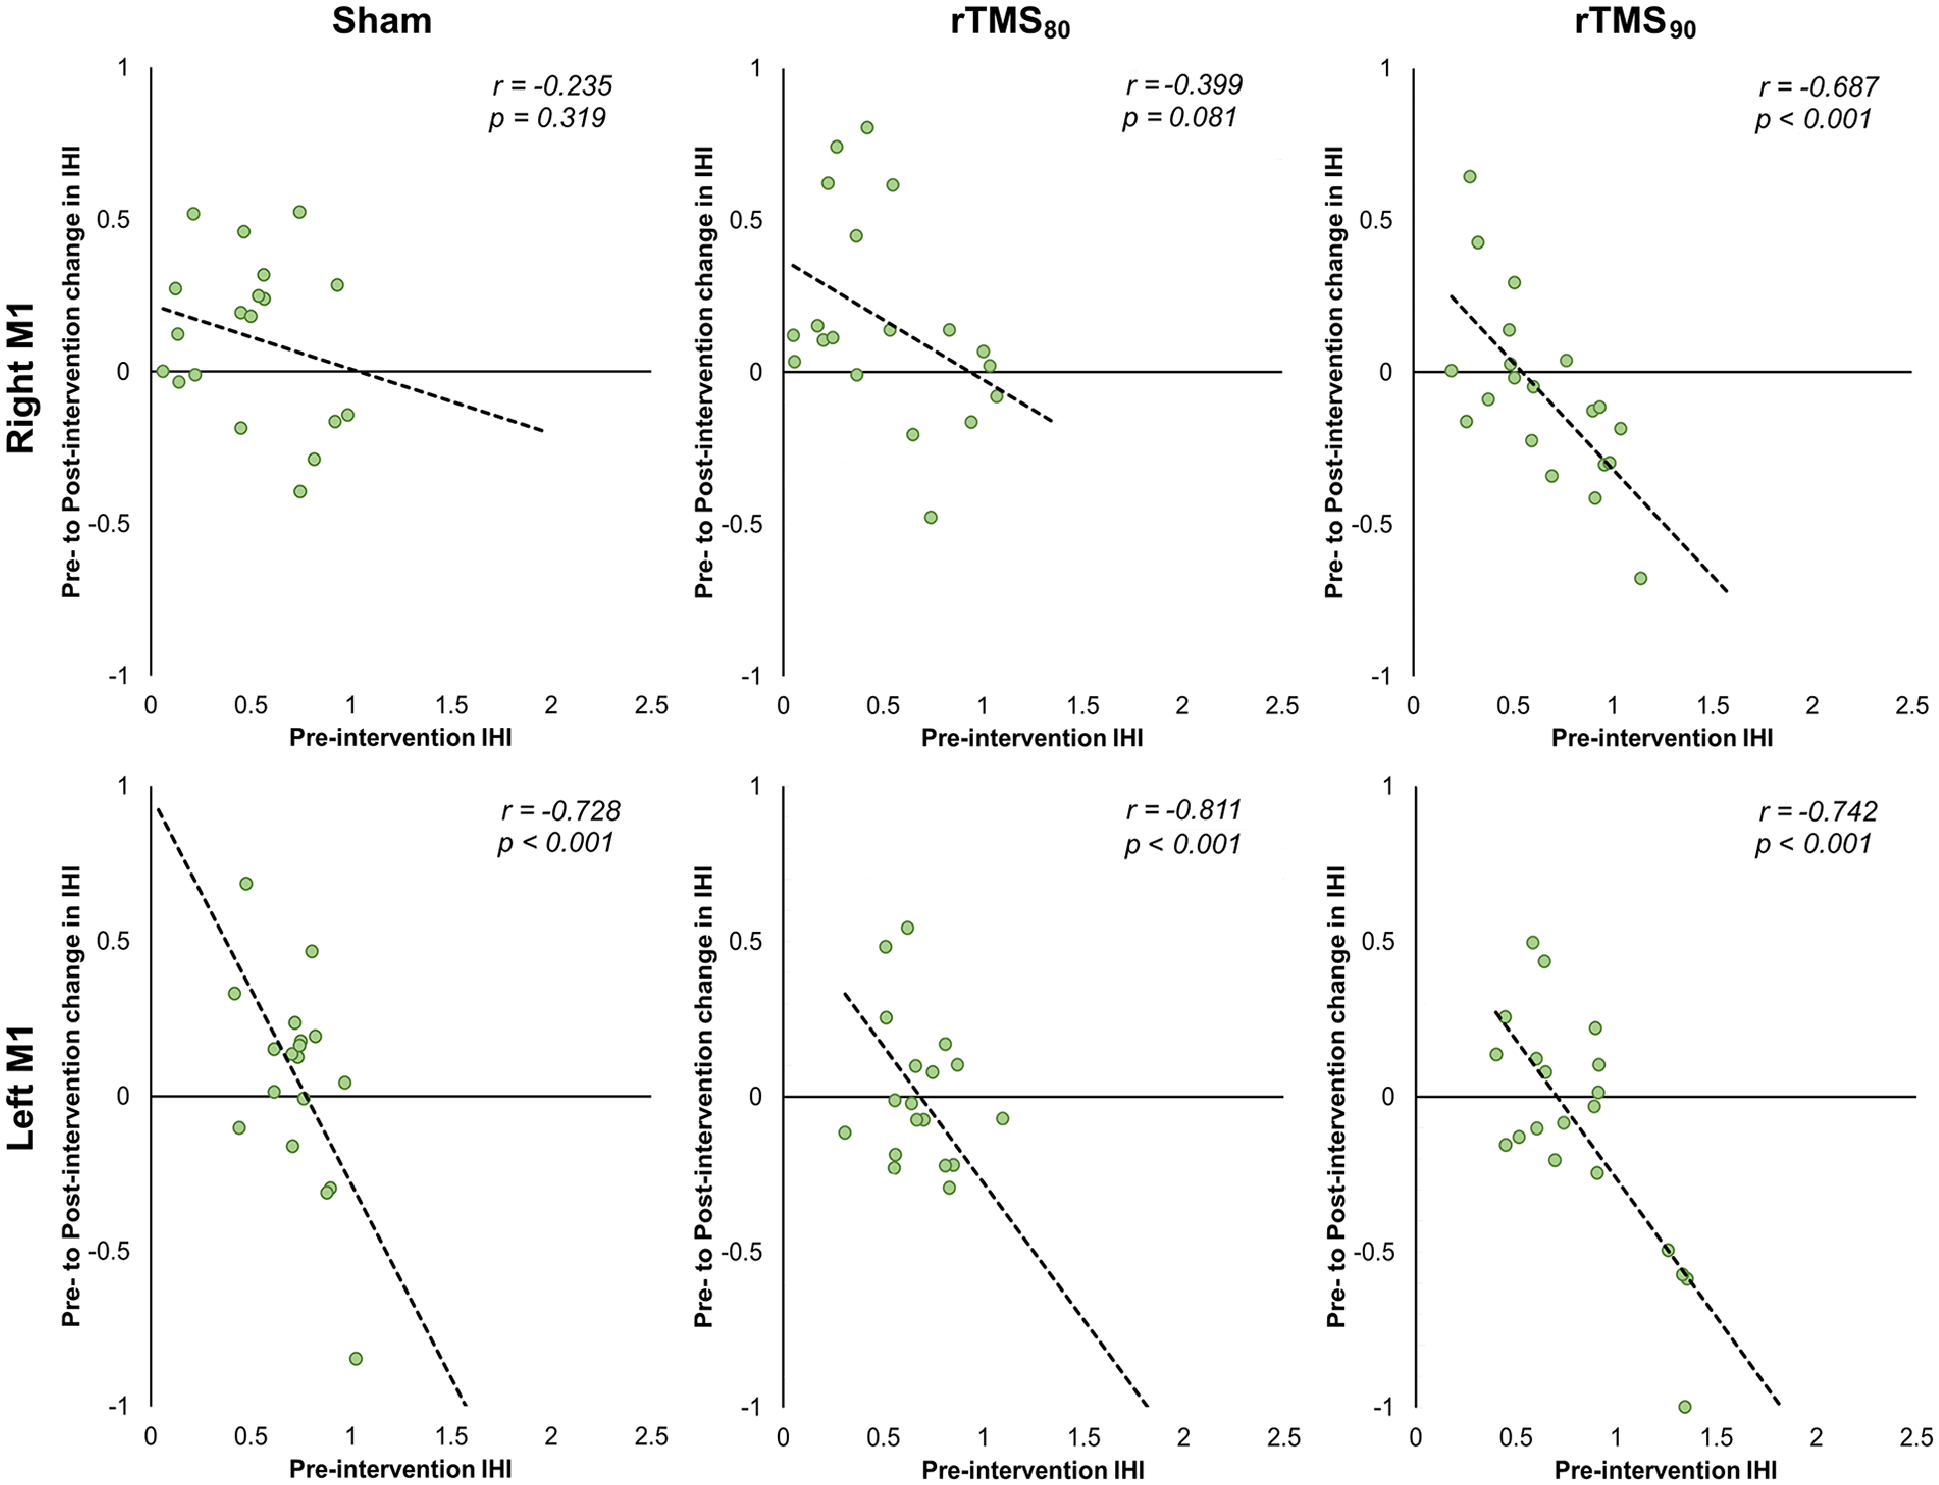
Correlation between pre-intervention IHI and the pre- to post-intervention change in IHI for sham, rTMS80 and rTMS90 for both RM1 and LM1. Note that 1 outlier (left M1, rTMS80, x-value: 2.23, y-value: −1.57) is not shown.
Discussion
The purpose of this study was to systematically determine the effects of subthreshold LF-rTMS on M1 excitability in healthy older adults. 7 Specifically, we investigated the effects of subthreshold LF-rTMS on SRC curve parameters and SICI of the stimulated and non-stimulated M1, and IHI from the stimulated M1 on the non-stimulated M1 and vice versa. Overall, the LF-rTMS protocols were well tolerated with only 1 participant who reported experiencing migraine, possibly related to the treatment. There were 3 main findings: First, there was an indication that LF-rTMS over LM1 had an rTMS intensity-dependent effect on SRC curve parameters. Post hoc analysis suggested that while rTMS90 may increase MEPMAX in the stimulated LM1 and the slope in the non-stimulated RM1, rTMS80 had no effect. Second, rTMS-related changes in SICI were related to the baseline inhibitory state. Generally, lower SICI pre-intervention led to a larger reduction in SICI. However, the magnitude of this effect was dependent on the hemisphere and the intensity of LF-rTMS. Third, rTMS90 and rTMS80 had opposing effects on IHI. While rTMS90 resulted in significantly stronger IHI, rTMS80 reduced IHI regardless of the direction of IHI. While these effects were demonstrated within sessions and were statistically different between the 2 interventions, they were not different from the sham condition. Taken together, our results show that different subthreshold intensity LF-rTMS protocols have differential effects in magnitude and direction on M1 excitability measures. Our findings add important details to the effect of LF-rTMS subthreshold dosing, which help the understanding of previously reported seemingly contradictory results and should be considered when applying these protocols in future studies of healthy populations or patients with neurological disorders.
LM1 rTMS-Related Effects on SRC Curve Parameters
In contrast to its commonly intended purpose,1,17 LF-rTMS had no inhibitory effect on SRC curve parameters of the stimulated LM1. While the main analysis was not significant, post hoc results hinted at an increase in the stimulated LM1’s MEPMAX and a steeper slope in the SRC of the other non-stimulated RM1 after rTMS90, with the other parameters being unchanged. RTMS80 had no statistically significant effect. Direct comparison between the effects of rTMS80 and rTMS90 demonstrate trends going in opposite directions with changes in MEPMAX reaching a statistically significant magnitude (Figure 3), indicating a dose-dependent effect of sub-threshold LF-rTMS on the excitability of the corticospinal output, specifically, in the change in the input-output relationship of multiple descending volleys. 32 The exact mechanisms that explain these effects are unclear. 12 Although there is no direct evidence in the present study, rTMS-related changes in M1 excitability likely occurred at the cortical level because subthreshold TMS is known to activate axons in cortical gray matter and does not result in descending volley.12,47 RTMS90 also had remote effects in the non-stimulated RM1. The observed increase in the slope parameter generally indicates increases in the excitatory bias of the corticospinal neurons’ recruitment gain 32 or changes in transsynaptic excitability. 33 For RM1, increasing slope while S50 and MEPMAX value remain the same indicates a higher recruitment gain in the corticospinal pathway controlling the ECU muscle. 32 Our results are consistent with the reports of suprathreshold LF-rTMS related increases in single intensity MEP amplitude of the non-stimulated M1.48,49 In contrast to the results of these studies and our study, others found no effect on RM1 curve parameter with LF-rTMS at 90% or 115% RMT. 50
Comparison of the present results to reports of other studies is limited by their very small sample sizes (n < 10), age differences of the study populations, and difference in the measurements of M1 excitability. 7 Specifically, in most studies, the effect of LF-rTMS is probed with single-pulse TMS of 1 intensity of about 120% RMT.7,51-53 or measurement of RMT7,19,54 (for review see Fitzgerald et al 7 ). The intensities fall in the range of about 65% MSO which corresponds to a location of the MEP on the slope of the SRC where any changes in M1 excitability will result in large changes of the MEP amplitude. In our study, LF-rTMS had no effect on the slope of the LM1 SRC curve which is therefore consistent with reports of no effect on measured MEP amplitude of stimulated M146,55,56 (for review see Fitzgerald et al 7 ).
Furthermore, few studies have evaluated the effects of rTMS dosing on the SRC (for review see Fitzgerald et al 7 ), particularly SRC curve parameters. 50 In one of the larger studies by Houdayer et al, 50 a differential effect on SRC curve parameters with 115% of RMT M1 1 Hz rTMS was reported where the slope increased while other curve parameters of LM1 and RM1 remained unchanged. 50 In contrast to the results of our study, there was no effect on either M1 with 1 Hz rTMS at 90% of RMT intensity. In a second study by Gangitano et al, 57 interindividual differences with opposite effects with 1 Hz rTMS at 90% of RMT intensity were reported. 57 The young age (mean ± SD age: 28.5 ± 6.7 years 50 and 26.3 ± 5.2 years 57 ) in their studies may explain these differences in the effects of the rTMS protocol. Older age is associated with more task-related bilateral distributed activation of brain areas when compared to relatively focal, lateralized activity in younger participants.13,58 Age-related differences are also seen in neurophysiological measures 14 and response to interventions including rTMS protocols. 15 Other differences between the studies include targeted muscles which have different input/output functions 59 and longer application of the rTMS protocol.
LM1 rTMS-Related Effects on Intracortical Inhibition
We replicated previous findings in healthy participants, where SICI60 and SICI80 with 2 ms ISI had significant inhibitory effects on the TS-evoked MEP amplitude. The effect was greater for LM1 compared to RM1 and greater for a SICI80 compared to SICI60.22,37,42 We did not find an effect on SICI with either intensity subthreshold LM1 LF-rTMS, which is consistent with previous reports in young adults.19,46,53 In extending these previous findings, here we report the lack of an overall effect on SICI for these protocols in older adults for both the stimulated LM1 and non-stimulated RM1. While pre-interventional SICI differed between individuals, no significant difference was found at the group level and cannot explain these findings. The lack of rTMS-related changes in SICI would not support altered GABAAergic inhibition-related control as a mechanism underlying the presently observed changes in SRC curve parameter. 60 However, although no group level differences in SICI were observed, we found that rTMS-related effects on change in SICI were significantly correlated with pre-intervention SICI (baseline SICI), a finding previously reported.45,46 Similar to these reports, we found that participants with stronger pre-intervention SICI tended to have rTMS-related weakening of SICI and participants with weaker pre-intervention SICI tended to have a stronger post-intervention SICI. These findings may indicate that post-intervention results also depend on homeostatic plasticity where synapses have a target range of synaptic modifiability and neural processes will maintain excitability within the target range.61-63 Interestingly, follow up correlations showed this effect to be significant for rTMS90, but not for rTMS80, in the stimulated LM1. In the non-stimulated RM1 the opposite was observed. Although these results are tentative, it provides further support for different neurophysiological effects of different rTMS sub-threshold intensity.
LM1 rTMS-Related Effects on Interhemispheric Inhibition
Consistent with previous reports, IHI evoked an inhibitory response at an ISI of 10 ms but not 2 ms 39 with a greater inhibitory effect for IHI of LM1 on RM1 when compared to RM1 on LM1. 64 RTMS interventions had a statistically significant effect on IHI across directions and ISI. As with previous measures reported above, we found opposing effects of rTMS90 and rTMS80 on IHI with significantly stronger IHI following rTMS90 compared to rTMS80. While they differed from each other, they were not different from sham stimulation. The bidirectional effect of LM1 LF-rTMS was reported previously 65 in a study where a suprathreshold intensity of 115% of RMT was used.19,48 Pre-intervention IHI was similar across days and cannot account for these findings. Similar to the findings for pre-intervention SICI findings and previous reports, 48 we found that the level of pre-intervention IHI had a significant effect on the rTMS related effect on IHI. However, no interaction between pre-IHI and intervention was observed, suggesting that these baseline effects were consistent for both rTMS intensities.
The different effects of the LF-rTMS on IHI and SICI are consistent with detailed studies reporting different neuronal populations mediating the effects of SICI and IHI.46,66 It is commonly believed that the TMS inhibitory effects of IHI are mediated by GABABergic inhibition while SICI is mediated by GABAAergic inhibition (for review Siebner et al 12 ).
Finally, the data demonstrate high variability relative to the expected small effect size. This occurred despite our careful screening of the participants to exclude variables that may contribute to variability such as medication and exclusion of non-modifiable variables such as handedness and age. We also controlled for the level of alertness with open eyes during all measurements and interventions, 12 and demonstrated comparable baseline measures across different conditions. This high variability has been previously reported and is a topic of reviews as it remains a challenging issue in the field.9,12
Limitations and Future Directions
We finally would like to acknowledge the limitations of this study. First, the observation of increased MEPMAX after rTMS90 was based on post hoc analysis. However, notably, the main analysis did not reveal any significant interaction effects. As such, a statistical type I error cannot be excluded. Given the exploratory nature of this study, we opted for this less strict statistical approach, but these results should therefore be interpreted tentatively. Second, participants were blinded prior to and throughout the experiment. A sham TMS coil was used that looks and sounds identical to the active coil. However, blinding was not assessed post-hoc. Third, it has been suggested that more (>10) TMS pulses can reduce overall variability.34-36 Further increasing the number of pulses in this study was not possible given the already extensive length (~4 hours) and number of experiments for each participant.
Implications
These results demonstrate direct and remote modulatory effect of subthreshold LF-rTMS on the neuronal network that depends on exact dosing and is not uniformly inhibitory or excitatory. Instead, there is a differential modulation of the stimulated and non-stimulated but connected neuronal network. This emphasizes the need to demonstrate target engagement when using rTMS protocols to modulate cortical excitability in future studies.
Supplemental Material
sj-docx-1-nnr-10.1177_15459683241292615 – Supplemental material for Intensity-Dependent Effects of Low-Frequency Subthreshold rTMS on Primary Motor Cortex Excitability and Interhemispheric Inhibition in Elderly Participants: A Randomized Trial
Supplemental material, sj-docx-1-nnr-10.1177_15459683241292615 for Intensity-Dependent Effects of Low-Frequency Subthreshold rTMS on Primary Motor Cortex Excitability and Interhemispheric Inhibition in Elderly Participants: A Randomized Trial by Miles Wischnewski, Lauren Edwards, Kate P. Revill, Daniel Drake, Gerald Hobbs and Cathrin M. Buetefisch in Neurorehabilitation and Neural Repair
Supplemental Material
sj-docx-2-nnr-10.1177_15459683241292615 – Supplemental material for Intensity-Dependent Effects of Low-Frequency Subthreshold rTMS on Primary Motor Cortex Excitability and Interhemispheric Inhibition in Elderly Participants: A Randomized Trial
Supplemental material, sj-docx-2-nnr-10.1177_15459683241292615 for Intensity-Dependent Effects of Low-Frequency Subthreshold rTMS on Primary Motor Cortex Excitability and Interhemispheric Inhibition in Elderly Participants: A Randomized Trial by Miles Wischnewski, Lauren Edwards, Kate P. Revill, Daniel Drake, Gerald Hobbs and Cathrin M. Buetefisch in Neurorehabilitation and Neural Repair
Footnotes
Acknowledgements
We thank our participants for their involvement in this study, Dr. Robert Chen for his insightful comments on the discussion of the results and Jim Hudson and Dr. Sebastian Buetefisch for their technical support.
Author Contributions
Miles Wischnewski: Data curation, Formal analysis, Investigation, Methodology, and Writing—review & editing. Lauren Edwards: Data curation, Formal analysis, Writing—original draft, and Writing—review & editing. Kate Revill: Data curation, Formal analysis, Funding acquisition, and Writing—review & editing. Daniel Drake: Formal analysis, Methodology, and Writing—review & editing. Gerald Hobbs: Formal analysis, Methodology, and Writing—review & editing. Cathrin Buetefisch: Conceptualization, Funding acquisition, Investigation, Methodology, Project administration, Resources, Supervision, Writing—original draft, and Writing—review & editing.
Declaration of Conflicting Interests
The author(s) declared no potential conflicts of interest with respect to the research, authorship, and/or publication of this article.
Funding
The author(s) disclosed receipt of the following financial support for the research, authorship, and/or publication of this article: This work was supported by the National Institute of Neurological Disorders and Stroke (R56NS070879, R01NS090677) and the National Institute of Child Development and Health (R21HD067906-01A1).
Supplementary material for this article is available on the Neurorehabilitation & Neural Repair website along with the online version of this article.
References
Supplementary Material
Please find the following supplemental material available below.
For Open Access articles published under a Creative Commons License, all supplemental material carries the same license as the article it is associated with.
For non-Open Access articles published, all supplemental material carries a non-exclusive license, and permission requests for re-use of supplemental material or any part of supplemental material shall be sent directly to the copyright owner as specified in the copyright notice associated with the article.