
Abstract
Background. Traumatic brain injury (TBI) has been associated with impairments in inhibiting prepotent motor responses triggered by infrequent external signals (ie, reactive inhibition). It is unclear whether proactive preparation to inhibit upcoming responses is also affected (ie, proactive inhibition). Successful inhibition relies on frontosubcortical interactions; therefore, impairments might be linked with gray matter atrophy in subcortical structures. Objective. We investigated reactive and proactive inhibition in TBI and control groups, and their relationship with subcortical gray matter. Methods. Participants performed a response inhibition task in which the probability of stopping was manipulated. Reactive inhibition was measured as the stop-signal reaction time (SSRT) when the probability of stopping was low. Proactive inhibition was measured as the change in SSRT and in go response time with increasing probability of stopping. Subcortical gray matter structures were automatically segmented with FSL-FIRST. Group differences in subregional volume and associations with reactive and proactive inhibition efficiency were investigated using shape analysis. Results. Reactive inhibition was impaired in TBI, as indicated by longer SSRTs. Moreover, the degree of atrophy in subregions of subcortical structures was predictive for SSRT in TBI. In contrast, proactive inhibition was not affected because both groups showed no response time slowing as a function of stopping probability. Proactive inhibition efficiency could be predicted by local volume in the anterior left putamen, bilateral pallidum, and right thalamus in controls but not in TBI. Conclusions. Our results reveal that proactive inhibition seems unaffected in TBI and that volume of subregions of subcortical nuclei is predictive for response inhibition proficiency and of clinical relevance in TBI.
Introduction
Traumatic brain injury (TBI) commonly results in executive dysfunction, which has a profound effect on patients’ work, relationships, and activities of daily living. 1 One example of executive dysfunction in TBI patients is impaired response inhibition, 2 clinically expressed as difficulties in inhibiting socially inappropriate, impulsive, and habitual behavior. 3
Converging evidence suggests that the ability to inhibit an inappropriate response is a moderately sized problem in adults with mild to severe TBI. 2 However, most studies have focused on the ability to cancel a planned action in response to an unexpected external signal (ie, reactive inhibition). Yet the ecological validity of reactive inhibition is limited because in most real-life situations, upcoming events can be anticipated. Under such circumstances, one can proactively prepare to stop (ie, proactive inhibition). It has been postulated that diffuse damage to the anticipatory neural network, responsible for generating predictions of future states and events, underlies the executive function deficits, sustained attention problems, and loss of goal-oriented behavior in TBI. 4 This suggests that TBI patients would be especially impaired in proactive response inhibition, but experimental evidence for this hypothesis is lacking.
The dominant paradigm in the reactive and proactive inhibition literature is the stop-signal task. In this task, participants respond frequently to go cues but are requested to inhibit their response if the go cue is followed by a stop signal. 5 This task allows the estimation of the efficiency of the reactive inhibition process by deriving the internal reaction time to the stop signal (ie, the SSRT). Proactive inhibition on the other hand, can be investigated by manipulating the probability of an upcoming stop and calculating the change in reaction time to go and stop cues. Research has shown that when the stop-signal probability increases, participants slow down their response on go trials to increase their chance of successfully stopping when a stop signal appears.6-10
On a neural level, successful inhibition is supported by an integrated frontosubcortical network.11-13 For reactive inhibition, the inferior frontal cortex, presupplementary motor cortex, and subthalamic nucleus have been suggested as key nodes of the network.13,14 Conversely, proactive response inhibition seems to rely more on the anterior striatum7,15 and pallidum. 15 These basal ganglia nuclei enforce strong inhibition on the thalamus, thereby braking movement.14,16 Interestingly, recent studies have shown that TBI can result in marked volume loss of the subcortical structures.17-19 Because subcortical structures are crucial nodes of the response inhibition network, volume loss of these regions might be associated with impaired response inhibition.
The purpose of this study was 2-fold. First, we investigated whether proactive inhibition, besides reactive inhibition, is affected in TBI patients. Second, we determined whether an impairment in response inhibition is associated with atrophy of the subcortical structures. TBI patients and healthy controls performed an anticipated response version of the stop-signal task in which stop-signal probability was manipulated. A recently developed automatic segmentation method was used to assess gray matter volumes of caudate, putamen, globus pallidus (GP), and thalamus. 20 The advantage of this technique is that it not only assesses total volume per subcortical structure, but also enables the localization of volumetric changes within a structure. The subregions of each structure that correlated with behavior were localized.
We hypothesized that (1) TBI patients show less reactive inhibitory control than controls, indicated by longer stop-signal reaction times (SSRTs); (2) TBI patients show less proactive inhibitory control, that is, response time on go trials does not increase as a function of stop-signal pro-bability; (3) TBI patients show atrophy in the subcortical structures; and (4) the amount of atrophy in subcortical structures relates to reactive and proactive inhibitory control efficiency.
Methods
Participants
A total of 19 TBI patients (7 men; mean age = 25.8 years; range = 18.4-33.7) and 24 healthy controls (13 men; mean age = 24.2; range = 19.3-33.7) were included in this study (see Figure 1 for flow chart of study participants). The groups did not differ significantly in age [t(41) = −1.196; P = .238] or gender (χ2 = 1.279; P = .258). All participants were right handed, as determined by the Oldfield Handedness Scale 21 (mean laterality quotient = 88.32; range = 25-100). The study was approved by the local Ethics Committee for Biomedical Research, and informed consent was obtained from each participant.
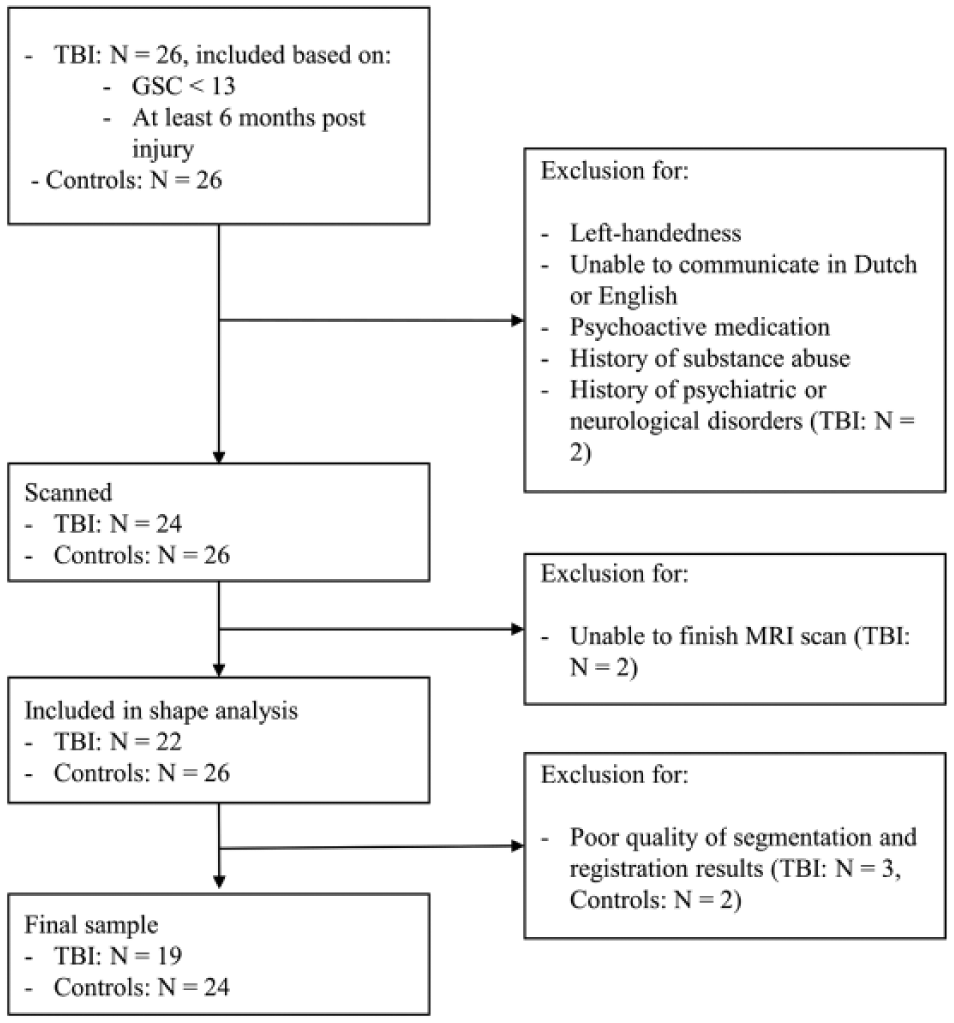
Flow chart of the included participants in the current study.
Clinical characteristics and demographics of the TBI patients are listed in Table 1. The TBI group was assessed at least 6 months postinjury (average time since injury = 4.64 years, range = 0.5-12.3; average age at injury = 21.14, range = 8.1-32.9). All patients had sustained “moderate-to-severe” head injury according to the Mayo classification system, which classifies patients based on loss of consciousness, lowest Glasgow Coma Scale in the first 24 hours postinjury, period of posttraumatic amnesia, and computed tomography or magnetic resonance imaging (MRI) images. 22
Summary of the Clinical Characteristics and Demographics of the TBI Group.
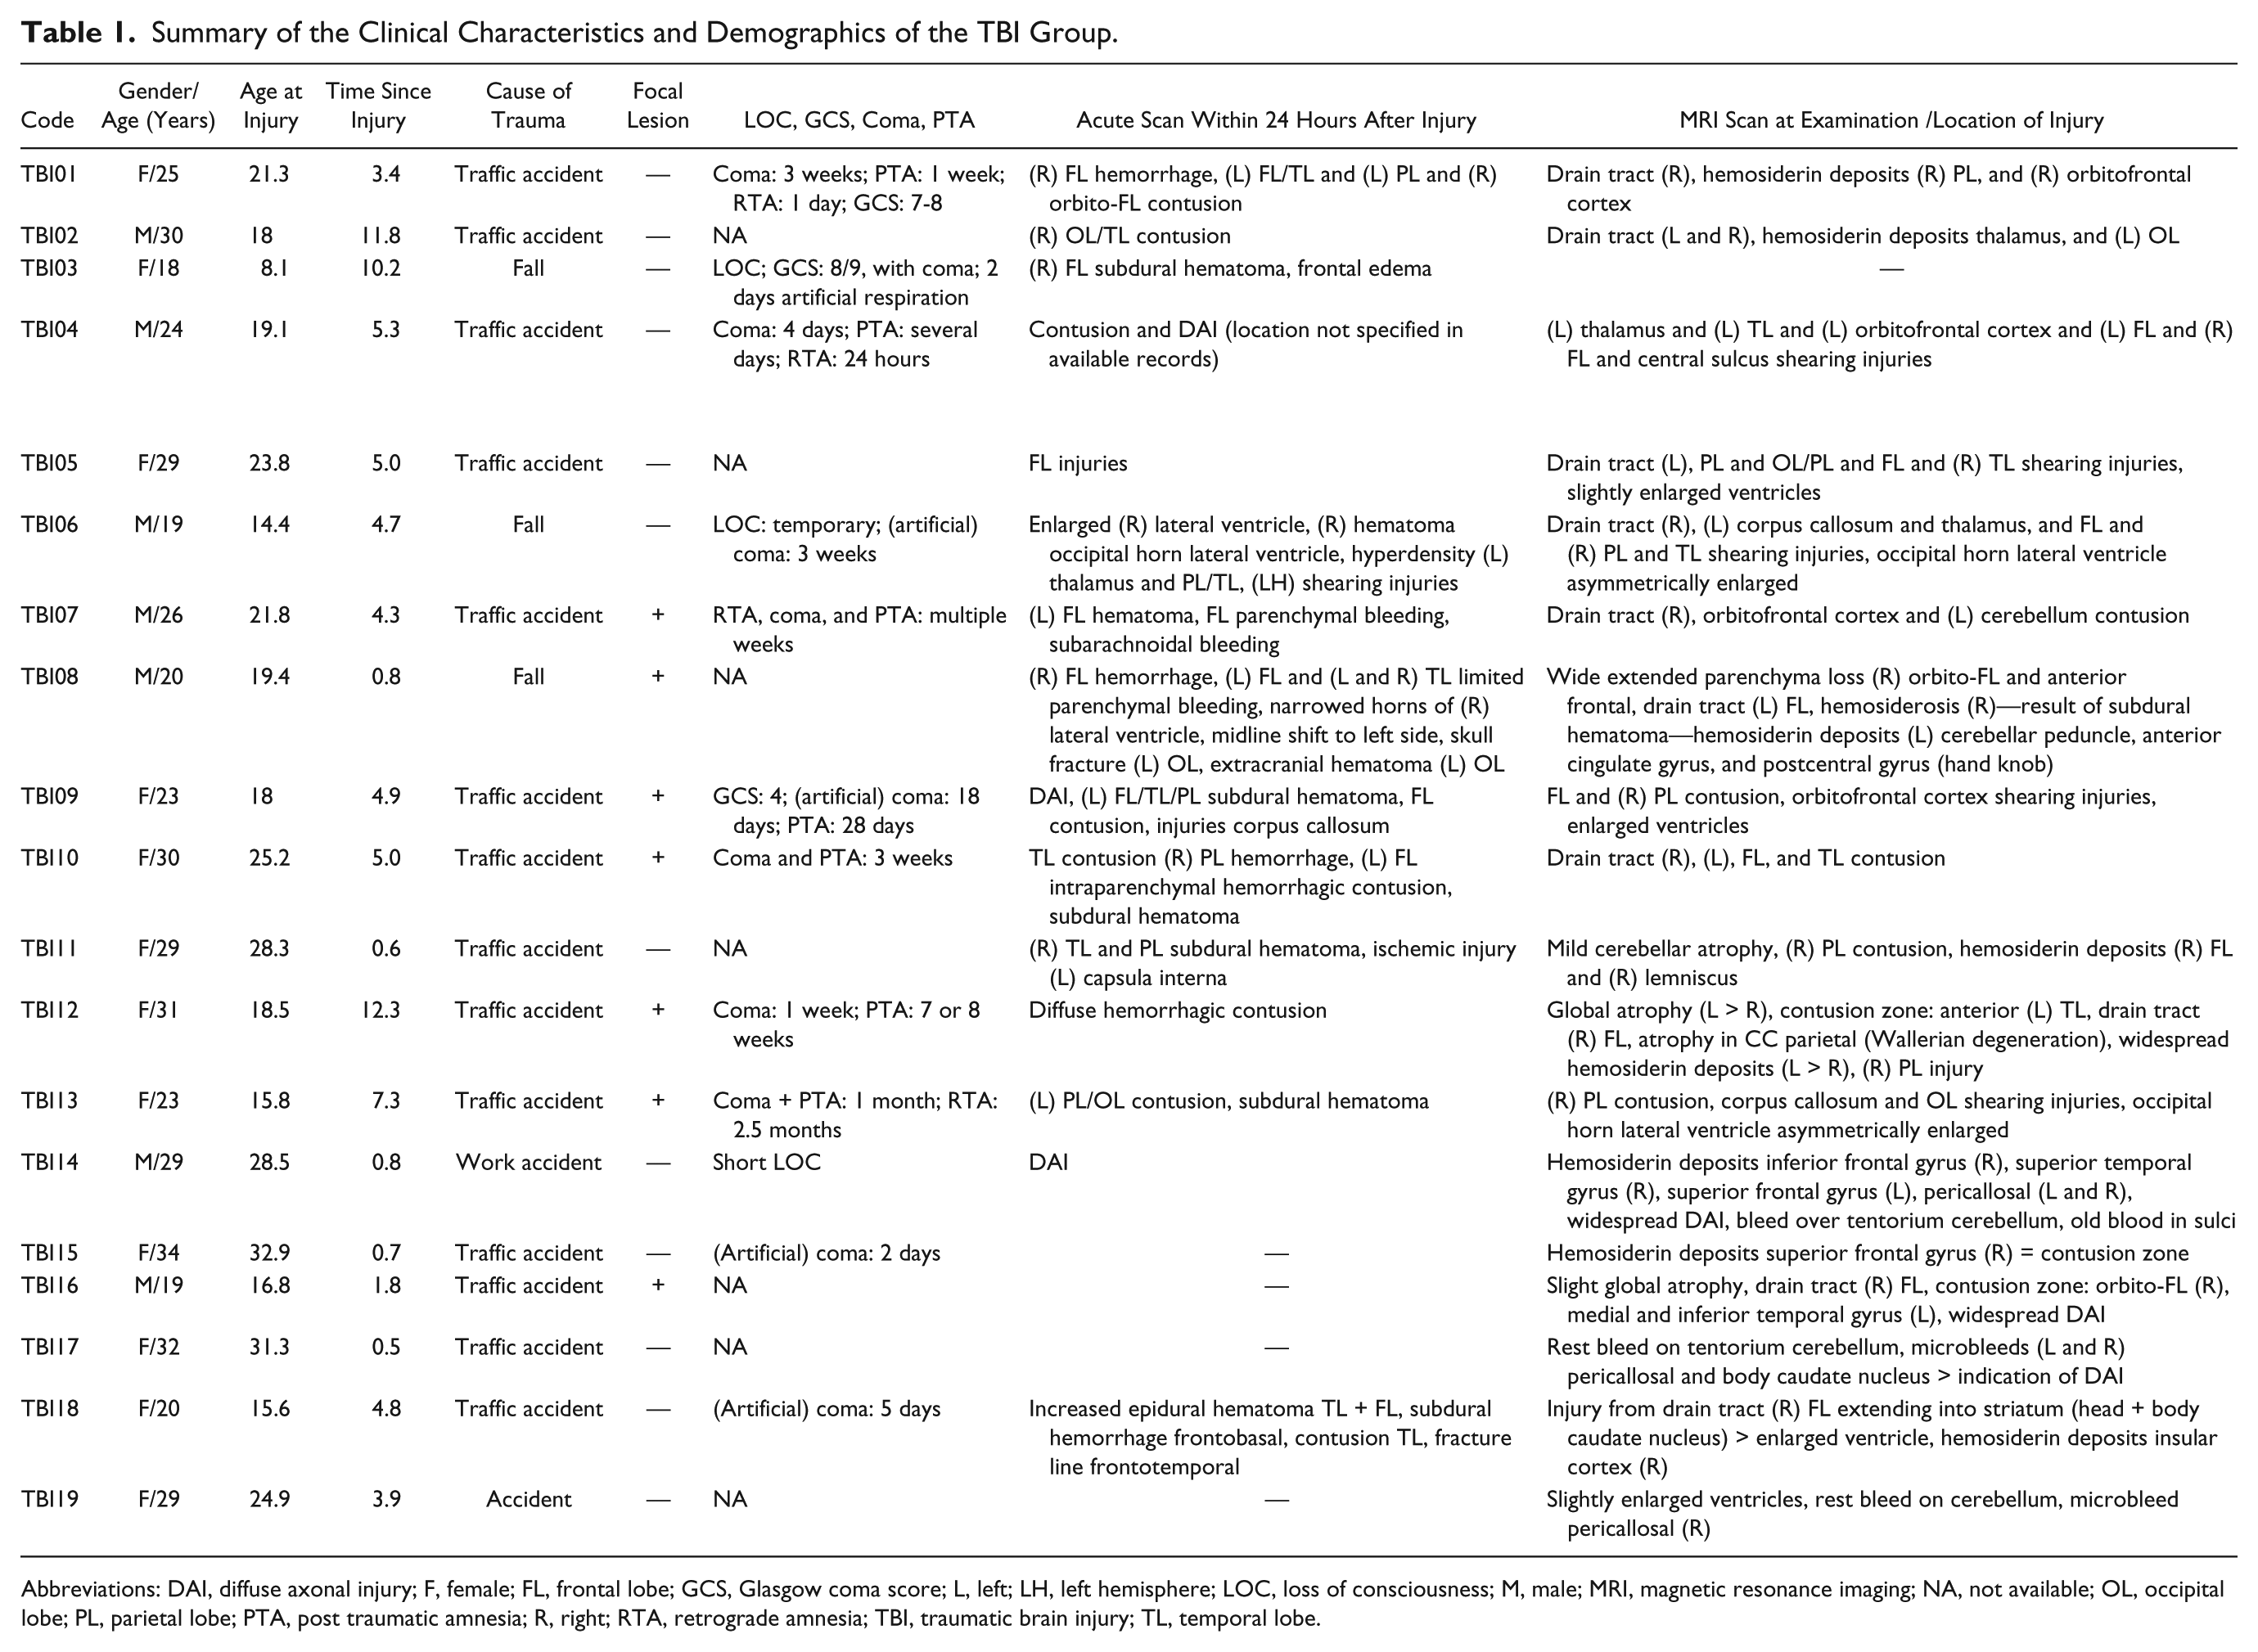
Abbreviations: DAI, diffuse axonal injury; F, female; FL, frontal lobe; GCS, Glasgow coma score; L, left; LH, left hemisphere; LOC, loss of consciousness; M, male; MRI, magnetic resonance imaging; NA, not available; OL, occipital lobe; PL, parietal lobe; PTA, post traumatic amnesia; R, right; RTA, retrograde amnesia; TBI, traumatic brain injury; TL, temporal lobe.
Stop-Signal Task
An anticipated response version of a stop-signal task was performed (Figure 2).7,23,24 The probability of an upcoming stop was manipulated to investigate both reactive and proactive inhibition.6-10 Participants were instructed to depress a mouse button switch with their right index finger. On a computer screen, a vertical indicator was presented, which moved upward at an equal and constant rate on each trial, crossing a horizontal target line at 800 ms from onset. The main task was to release the mouse button by lifting the right index finger when the indicator had reached the target line (ie, Go trials). To discourage participants from adopting a waiting strategy (ie, postpone the response to see if a stop signal would appear or not), we provided feedback to reinforce Go task performance. The color of the target line changed to green, yellow, orange or red at the end of the trial, depending on whether responses were within 20, 40, 60, or >60 ms of the target. In the remaining trials (ie, stop trials), the indicator stopped before reaching the target line, indicating that participants needed to cancel the movement of lifting their finger/releasing the switch. Stop trials occurred in 20% (ie, low stop-signal probability [LSP] condition) or 40% (ie, high stop-signal probability [HSP] condition) of trials for each condition. The stop-signal delay (SSD) was adjusted (in steps of 10 ms) separately for the LSP and HSP conditions, using 2 separate staircasing algorithms to ensure an equal number of successful and unsuccessful trials (ie, stop trial accuracy or P[inhibit] close to 50%). Before the start of the experiment, participants completed 1 practice run of the task to determine their initial SSD.
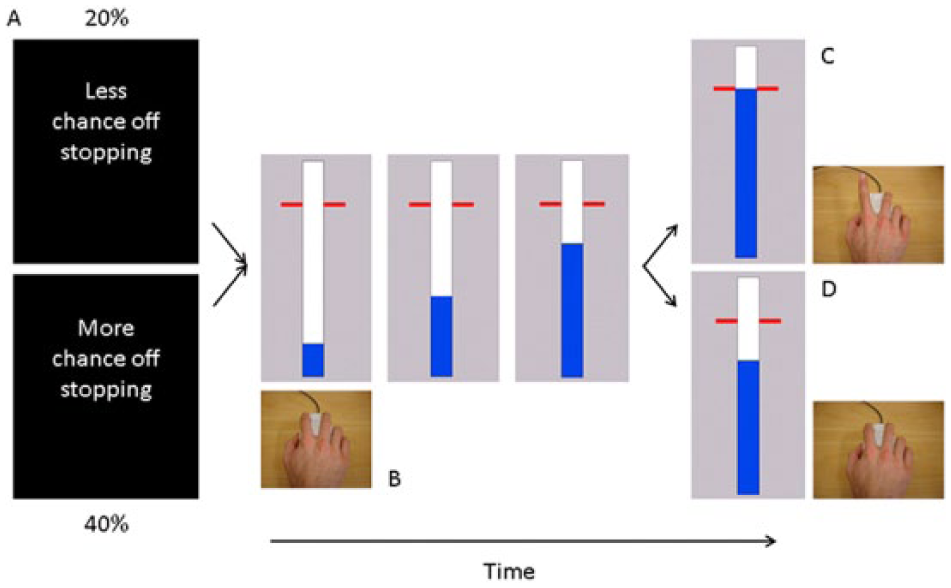
Behavioral task: A. Each block of trials started with the presentation of an instruction cue (1 s) indicating the likelihood of a stop signal. B. Participants viewed a vertically oriented indicator that increased from the bottom up at constant velocity reaching the top in 1 s. The indicator could be stopped by releasing the mouse key with the right index finger. C. Participants were required to stop the indicator as close to the target (800 ms) as possible. D. The bar stopped automatically on 20% (low stop-signal probability condition) or 40% (high stop-signal probability condition) of the trials. The time at which the bar stopped was adjusted online using 2 staircase algorithms to achieve 50% success on stop trials.
Participants had to complete 506 trials, which were presented in blocks of ~30 s consisting of 8 to 9 trials with an intertrial interval of 3.25 s. In total, there were 34 LSP blocks and 25 HSP blocks, resulting in 244 go and 62 stop trials in LSP and 120 go and 80 stop trials in HSP. At the start of each block, a visual instruction cue was presented for 1 s to indicate whether the probability of stopping was high (HSP) or low (LSP). In addition, 2 different colors (ie, blue and magenta) were used for the vertical indicator to indicate stop-signal probability. Color of the indicator was counterbalanced across participants. The indicator was reset to empty 1 s after trial onset, and response time was recorded relative to the target line on each trial. Trials were presented in a pseudorandomized order.
Behavioral Data Analysis
Reactive inhibition was determined as the SSRT in the LSP condition, where longer SSRTs are indicative of less-efficient reactive inhibitory control. Two measures of proactive inhibition were calculated: (1) the difference in Go RTs between trials in the HSP and LSP condition (ie, the amount of proactive slowing) and (2) the difference in SSRT in the LSP and HSP condition (ie, the change in SSRT with increasing stop-signal probability).7,25,26 SSRT was calculated according to the integration method, Go RTs were rank ordered, and SSRT was obtained by subtracting the mean SSD from the nth Go RT, where n is obtained by multiplying the number of Go RTs by P(inhibit). 25 Additionally, we included SSD, response time on failed stop trials (StopRespond RTs), and P(inhibit) to validate that the data met the requirements of the independent race model. 5 Go RTs and StopRespond RTs were measured relative to the target line. Early response times (ie, >400 ms before the target line) were considered errors, and response times more than 3 SDs from the mean Go RTs were defined as outliers. Behavioral data were analyzed using repeated-measures ANOVAs with group and stop-signal probability as independent variables (statistical threshold: P < .05). Significant interaction effects were further explored using simple effect analysis with Bonferroni correction for multiple comparisons.
Image Acquisition
A Philips 3T Achieva MRI scanner (Philips Healthcare, Netherlands) with a 32-channel head coil was used to acquire a 3D magnetization prepared rapid gradient echo (MPRAGE) high-resolution T1-weighted anatomical image (TR = 9.70 ms; TE = 4.60 ms; 230 sagittal slices, 1 × 0.65 × 0.65 mm3 voxels).
Image Processing
The subcortical structures (bilateral: caudate, putamen, GP, and thalamus) were automatically segmented from each participant’s anatomical image with FMRIB’s Integrated Registration Segmentation Toolkit (FIRST). 20 FIRST is a model-based segmentation/registration tool that uses a deformable mesh model constructed from manually segmented images provided by the Center for Morphometric Analysis, MGH, Boston, to create a surface mesh for each subcortical structure. This surface mesh is composed of a fixed set of connected vertices that correspond across subjects, which makes it possible to compare them across individuals or between groups and to investigate differences in shape, such as inward or outward deformations (ie, subregional volume decreases or increases). In addition, normalized intensities along the surface normal are sampled at each vector and modeled by searching through linear combinations of shape models of variation for the most probable shape, given the observed intensities of the input image.
The surface meshes that were used in the statistical analyses were reconstructed in the native space of the image (ie, subject space), and pose (global rotation and translation) was removed from these meshes by a rigid alignment with 6 degrees of freedom. Registration and segmentation results were visually inspected with FSLVIEW, and subjects were excluded when the registration and segmentation (n = 5) results were of poor quality.
Global Volumetric Changes
The global volume measurements of caudate, putamen, GP, and thalamus were obtained from the FSL FIRST segmentation output. All global volumes were corrected for individual variation in intracranial volume. For each participant, total intracranial volume (TIV) was calculated by adding the volumes of white matter, gray matter, and cerebrospinal fluid together using SPM8 (new segment toolbox). Global volumes were corrected with the following formula: Corrected global volume = [Global volume (mm³)/TIV (mm³)] × 1000. Differences in corrected global volume between TBI patients and controls were tested using 2-tailed Student t tests.
Subregional Volumetric Changes
The differences in shape between TBI and control groups were investigated by comparing the corresponding vertices between the groups using a general linear model approach as implemented in FSL. Because each vertex is analyzed independently, we corrected for multiple comparisons with a nonparametric permutation approach: threshold-free cluster enhancement correction at P = .05. 27 Correlations between shape and reactive/proactive inhibition were investigated in TBI, controls, and both groups together using a general linear model approach (FSL). As a measure of reactive inhibition, we included SSRT when the chance of stopping is low (ie, SSRT in LSP condition). As measures of proactive inhibition, we included the change in SSRT and the change in Go RT when comparing the 2 stop-signal probabilities. To obtain these changes, we subtracted SSRT/Go RT in the LSP condition from SSRT/Go RT in the HSP condition. Positive differences in Go RT (ie, increasing RTs with increasing stop-signal probability) are an indication of proactively preparing to stop. Negative differences in SSRT (ie, decreasing SSRT with increasing stop-signal probability) are an indication of a stopping benefit in the HSP condition. These 3 measures were included as variables of interest, and inference was carried out with threshold-free cluster enhancement correction for multiple comparisons. In all models, TIV was included as a covariate of no interest.
The Oxford-Imanova Striatal Connectivity Atlas 28 and the Oxford Thalamic Connectivity Probability Atlas 29 thresholded at 25% maximal probability were used to compare the cortical connectivity profile of the subregions.
Results
Behavioral Performance
The percentage of response times >400 ms before the target line (<0.8%) and outliers (<1.2%) was low and did not differ between groups, indicating that both groups understood the task instructions (Table 2). Furthermore, StopRespond RTs were shorter than Go RTs in each stop-signal probability condition for each group, meeting the assumption of the independent race model. 5 P(inhibit) was close to 50% in both groups for both stop-signal probability conditions, allowing a reliable estimation of SSRT with the integration method. The significant main effect of stop-signal probability indicates that P(inhibit) increased as a function of stop-signal probability. This effect was similar in both groups because the Group × Stop-signal probability interaction was not significant.
Summary of Behavioral Results. a
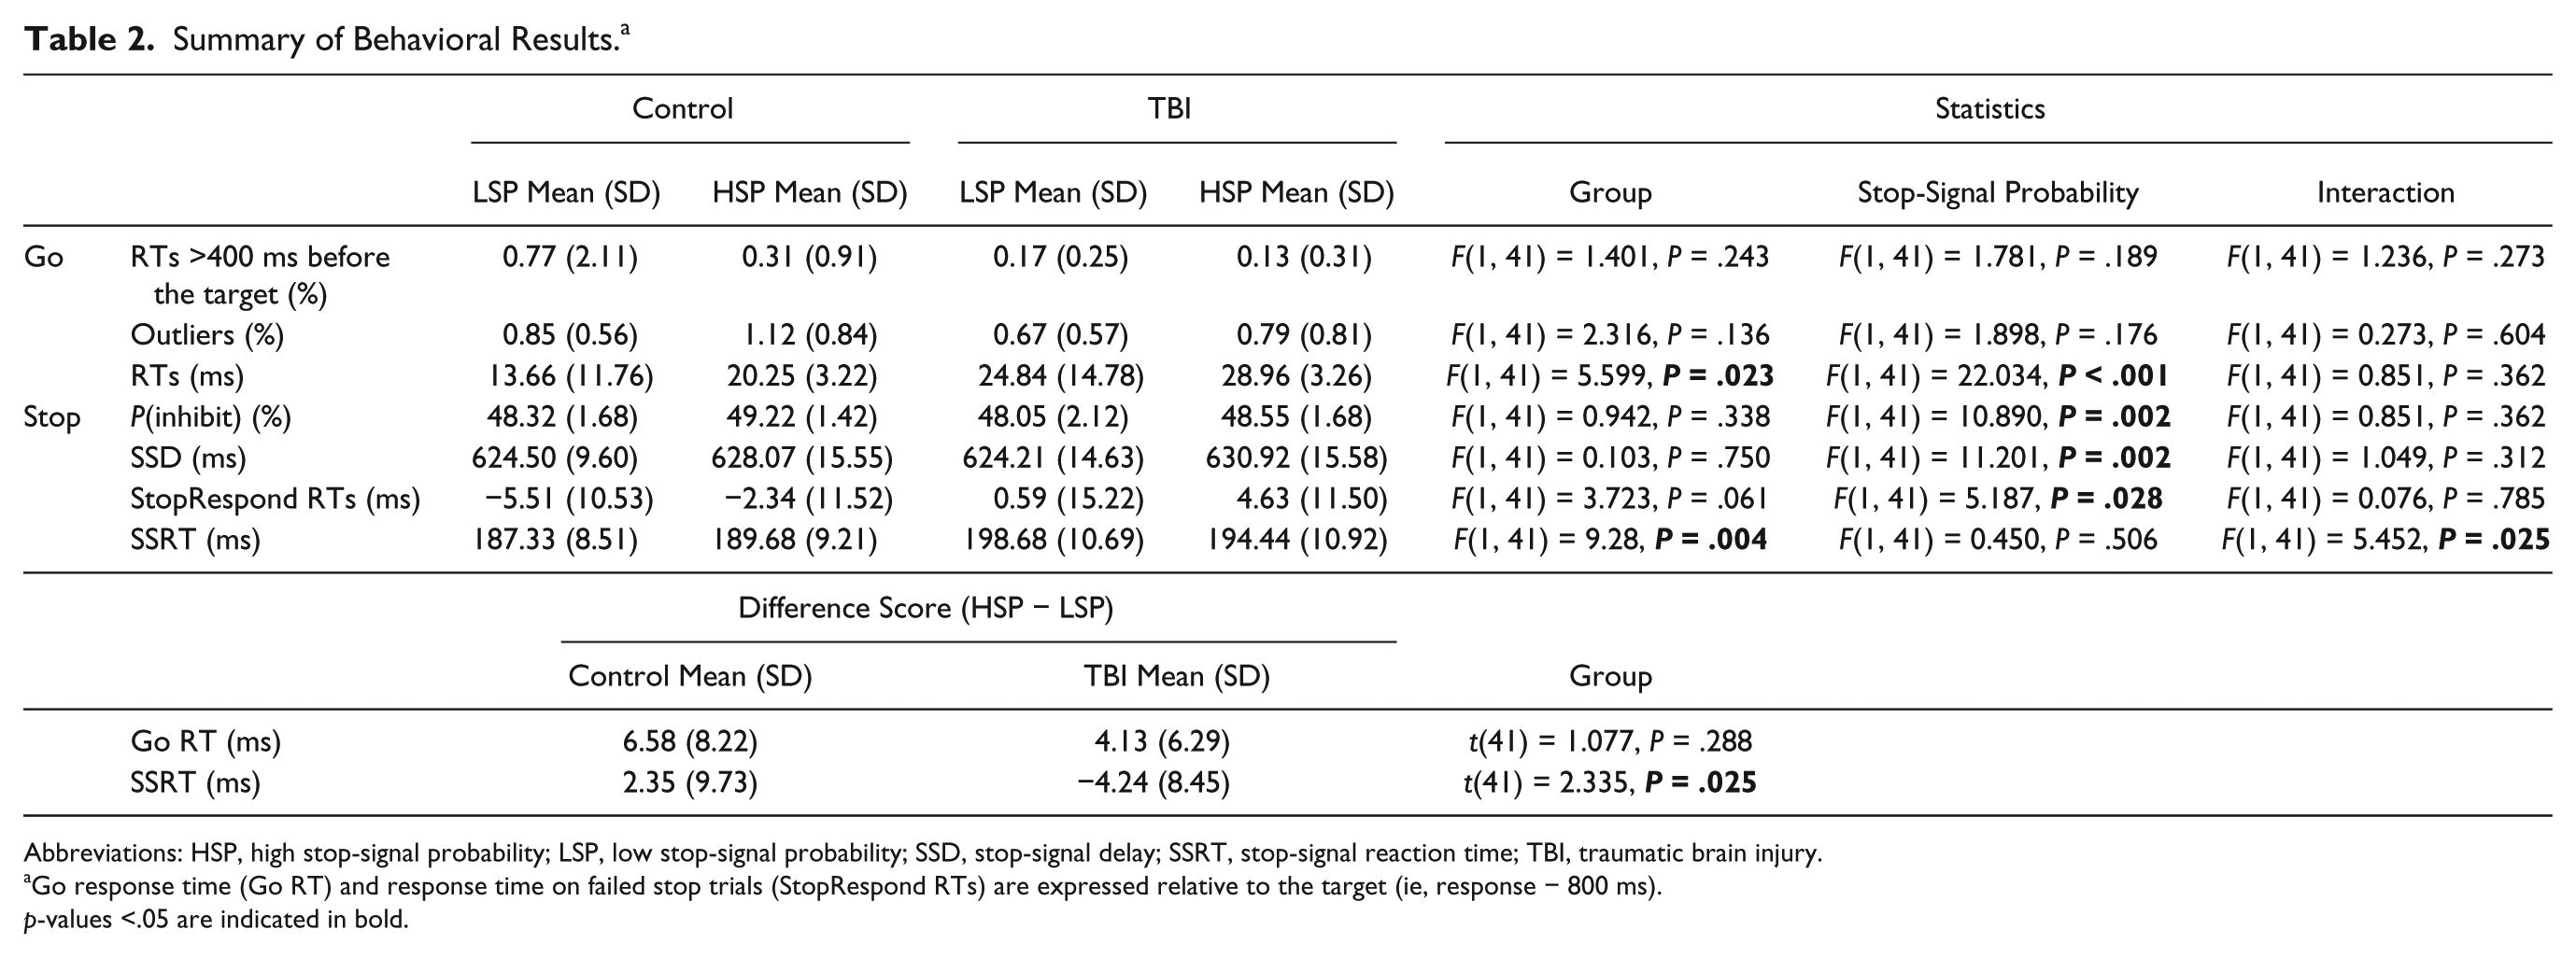
Abbreviations: HSP, high stop-signal probability; LSP, low stop-signal probability; SSD, stop-signal delay; SSRT, stop-signal reaction time; TBI, traumatic brain injury.
Go response time (Go RT) and response time on failed stop trials (StopRespond RTs) are expressed relative to the target (ie, response − 800 ms).
p-values <.05 are indicated in bold.
A significant group and interaction effect was observed for SSRT. Simple effects analysis of the interaction effect indicated that TBI patients had longer SSRT than controls in the LSP condition (P < .001; measure of reactive inhibition). There was no difference in SSRT between the 2 stop-signal probabilities in controls nor in TBI, indicating that there was no change in SSRT with increasing stop-signal probability (measure of proactive inhibition).
TBI patients had longer Go RTs in both task variants compared with controls. Furthermore, Go RTs were significantly longer in HSP versus LSP, whereas the interaction effect was not significant. These results indicate that there was a change in Go RT with increasing stop-signal probability (measure of proactive inhibition): both groups slowed down their response as a function of stop-signal probability.
Global Volumetric Changes
Table 3 shows the results of the global volumetric changes analysis. Analysis of group differences with Bonferroni correction for multiple comparisons showed that the volume of the bilateral thalamus was significantly lower in TBI patients [left thalamus: t(41) = 3.213, P < .01; right thalamus: t(41) = 4.685, P < .001].
Differences in Subcortical Volume Between the TBI and Control Groups. a
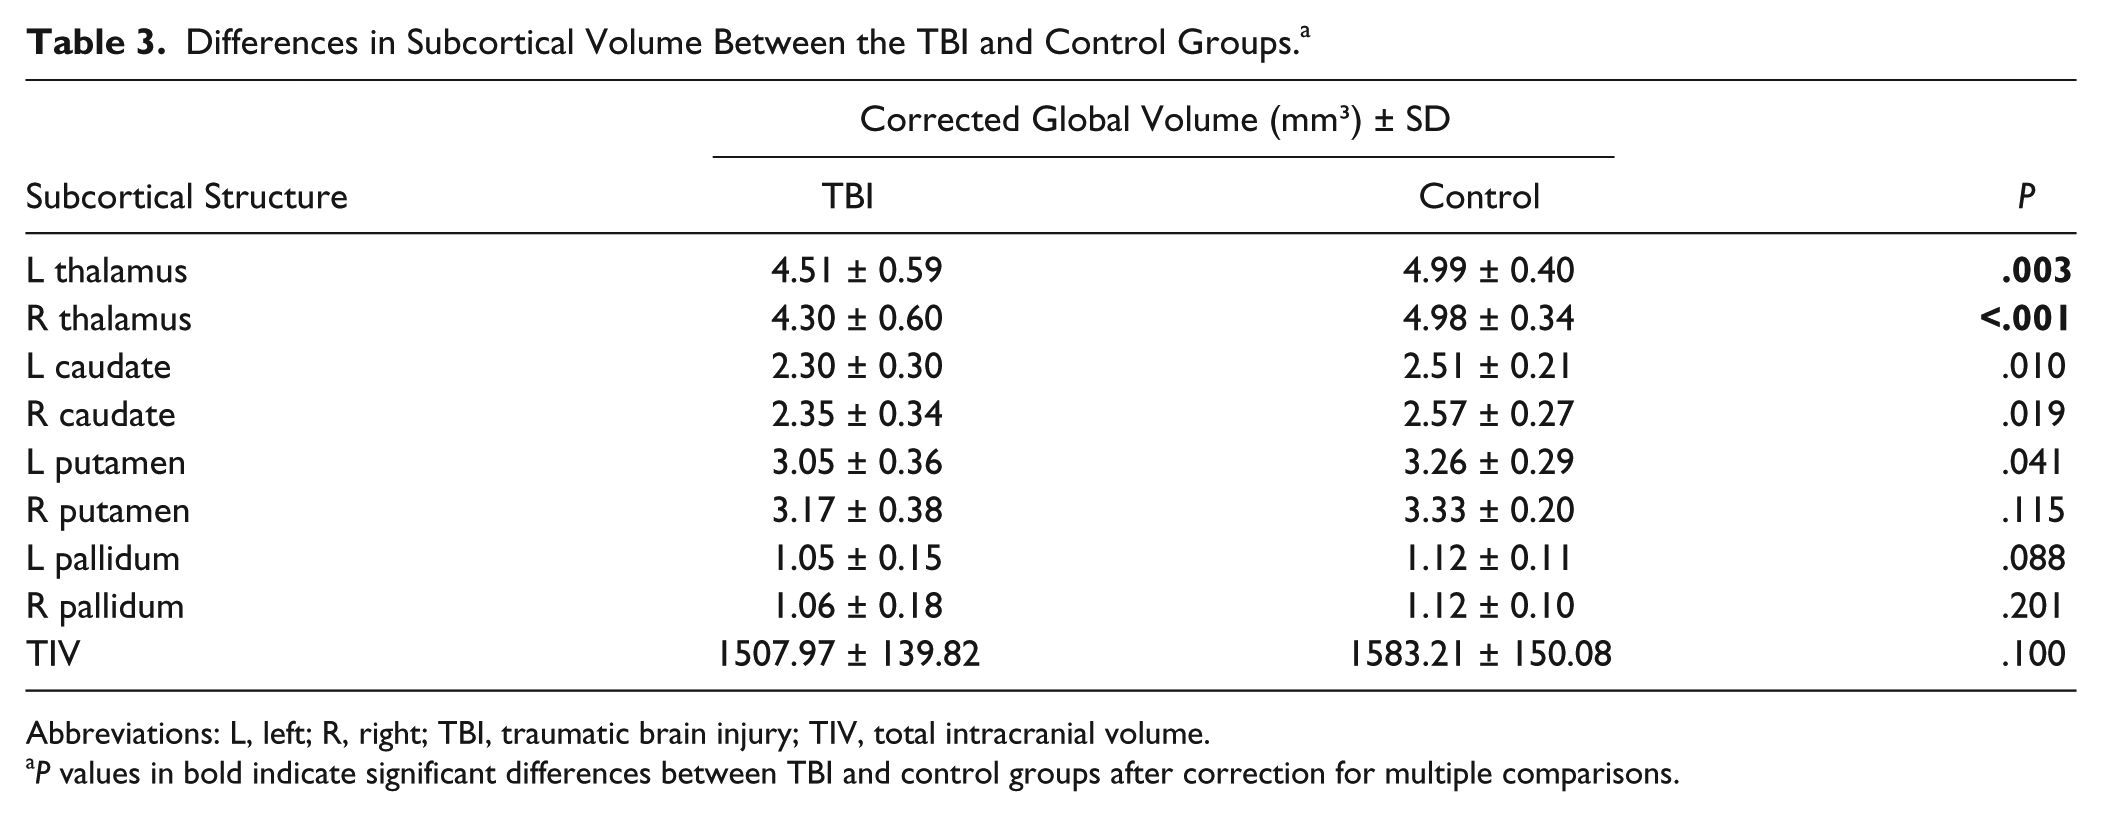
Abbreviations: L, left; R, right; TBI, traumatic brain injury; TIV, total intracranial volume.
P values in bold indicate significant differences between TBI and control groups after correction for multiple comparisons.
Subregional Volumetric Changes
Results of the shape analysis indicated that there was local atrophy in all subcortical structures in TBI patients compared with controls (Figure 3). In the caudate and putamen, atrophy was localized in the executive, limbic, parietal, caudal-motor, and rostral-motor zones. In the bilateral thalamus, atrophy was widespread. Finally, there was atrophy in the internal and external bilateral GP (GPi and GPe). The shape analysis also showed that the volume in a small cluster localized in the executive zone of the left caudate was expanded in TBI patients with respect to controls.
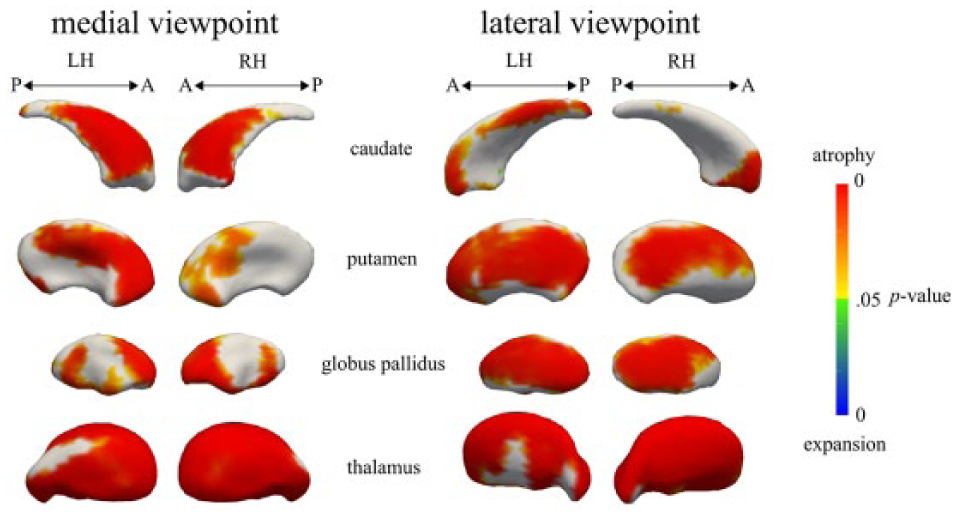
Vertex-wise comparisons of the caudate, putamen, globus pallidus, and thalamus: TBI versus controls: subregional atrophy was observed in all regions in the TBI group. Subregional expansion was observed in a small cluster in the left caudate in the TBI group.
Relation Between Subcortical Volume and Behavior
The shape analysis revealed the following relationships between local volume of the subcortical structures and behavioral measures.
Reactive Inhibition
Significant negative correlations were found between subregional subcortical volume and SSRT in the LSP condition for the TBI group. Patients with lower volumes in the medial wall of the bilateral caudate body, lateral-posterior left putamen, global bilateral thalamus, and left GPe needed more time to stop (Figure 4A). No significant correlations were found for SSRT in controls or in both groups together.
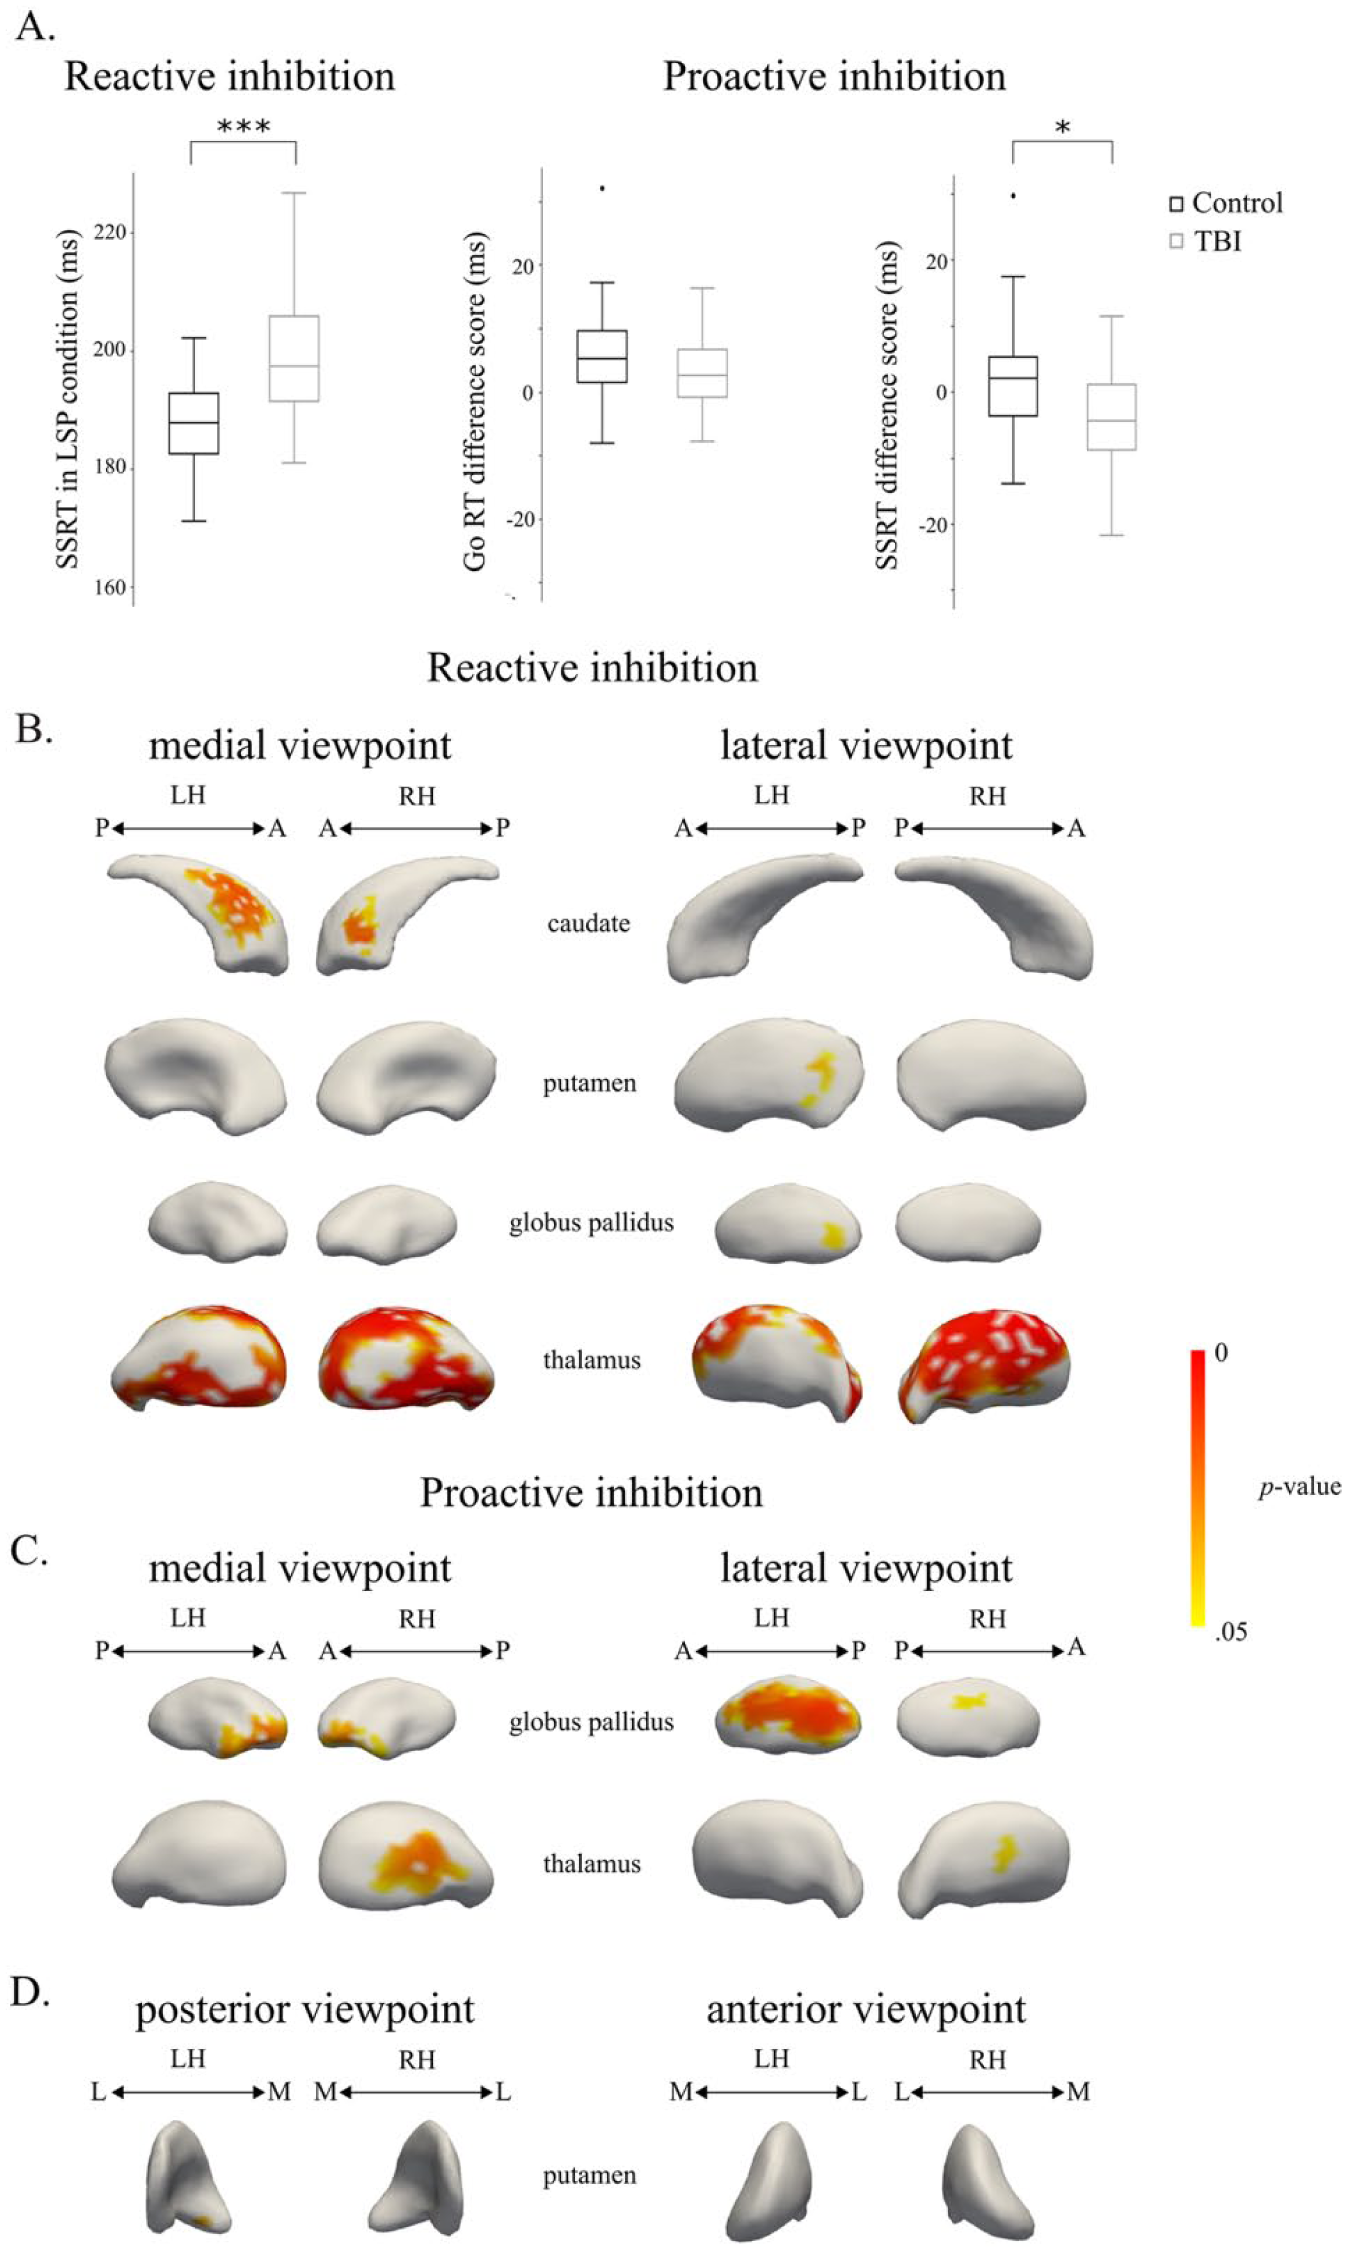
Correlations between subregional volumes and behavioral measures of the stop-signal task: A. Reactive inhibition was measured as SSRT in the LSP condition, whereas proactive inhibition was measured as the change in Go RT and SSRT with increasing stop-signal probability (ie, Go RT difference score = Go RT in HSP condition − Go RT in LSP condition and SSRT difference score = SSRT in HSP condition − SSRT in LSP condition). B. Regions with a significant negative correlation between shape and SSRT in the LSP condition in the TBI group. C. Regions with a significant positive correlation between shape and the Go RT difference score in the control group. D. Regions with a significant negative correlation between shape and the SSRT difference score in the control group. *P < .05, ***P < .001.
Proactive Inhibition
For the Go RT difference score between the HSP and LSP conditions (indicative of proactive inhibition, Table 2), a significant positive correlation was found in the lateral and medial regions of the right thalamus and in the bilateral GPi and GPe (Figure 4B). Controls who slowed down their response as a function of stop-signal probability had higher volumes in these subregions. No significant correlations were found for the Go RT difference score in TBI or in both groups together.
For the SSRT difference score, a significant negative correlation was found in the medial-anterior wall of the left putamen in controls. Thus, controls who had shorter SSRT in the HSP compared with the LSP condition had increased volume in the medial-anterior wall of the left putamen (Figure 4C). No significant correlations were found for the SSRT difference score in TBI or in both groups together.
Discussion
Previous work has shown that TBI is linked with response inhibition deficits. Most research, however, has focused on the reactive component of inhibition, whereas the ability to proactively prepare to stop a motor response has not been investigated yet in TBI patients. Our data suggest that response inhibition deficits in TBI reflect a slower stop process rather than a failure to anticipate stopping. This novel result deviates from the widely held assumption that TBI patients are less able to adjust their behavior in anticipation of future events. Furthermore, we showed, for the first time, that a slower stop process in TBI was accounted for by lower volume of subcortical subregions.
Consistent with previous studies,2,30-33 we found that reactive inhibition was less efficient in TBI compared with controls, as indicated by a longer SSRT in the LSP condition. Change in Go RT and SSRT with increasing stop-signal probability provided measures of proactive inhibition. Go RTs were significantly longer in TBI patients compared with controls, and Go RTs were longer in the HSP condition compared with the LSP condition. Contrary to our expectations, this effect was similar in both groups (the Group × Stop-signal probability interaction was not significant), indicating that these adult TBI patients still have the ability to proactively slow down their response in anticipation of an upcoming stop. With respect to SSRT, there was no difference between the stop-signal probability conditions. Although these results are in agreement with previous studies,8-10 other studies reported shorter SSRT with increasing stop-signal probability.26,34 This discrepancy can result from a trade-off between speed and accuracy. Most participants in this study might have slowed down on Go trials in order to improve stopping accuracy instead of the speed of inhibition, which is further illustrated by the finding that P(inhibit) increased from LSP to HSP in both groups.35,36 Together, these results suggest that response inhibition deficits in TBI reflect a slower stop process, rather than a failure to anticipate stopping. Similar results were reported in an aging study, stating that reactive inhibition deteriorates with aging, whereas proactive selective inhibition stays intact. 26 These results suggest that the neural pathways for proactive inhibition are more redundant or robust to diffuse degeneration of the brain as a consequence of TBI or aging.
As expected, we observed atrophy in the subcortical structures in TBI compared with controls. More specifically, we found global atrophy of the bilateral thalamus using both the global volume measure of the whole structures and the subregional (shape) analysis, whereas differences in volume in the basal ganglia were only observed using the shape analysis. The vertex analysis allowed us to visualize the topography of atrophy. With respect to bilateral caudate and putamen, atrophy was mainly localized in the zones having connections with the prefrontal cortex and rostral motor zones, corroborating previous results. 18 Atrophy of the global pallidus was localized in both the internal and external segments. Most studies investigating subcortical volume in TBI only report a global volume measure for the nucleus as a whole.19,37-39 Our results highlight that global measures might underestimate the volumetric changes in subcortical gray matter in TBI.
Surprisingly, a small cluster in the left caudate was expanded in the TBI group. Several potential explanations can be put forward, but these are to be considered hypothetical. Because the cluster is very small and just borders significance, it might be a false positive as a result of registration and segmentation inaccuracies. Registration and segmentation results were visually inspected for each structure of each subject, and subjects were excluded from further analyses when errors were detected. However, the FIRST model only includes a limited number of patients with neurodegeneration. Even though the Bayesian approach should be able to identify variations in shape and intensity that are not explicitly present in the model, it is possible that small biases in shape identification are present in the TBI group. More research is needed to investigate if such biases indeed occur when applying the FIRST model to a TBI sample. Alternatively, the cluster might reflect a real expansion caused by a change in overall shape of the left caudate in TBI, perhaps as a result of ventricular changes.
Correlational analyses showed that the degree of atrophy in subregions of the bilateral thalamus, bilateral caudate, left putamen, and left GPe was negatively related to the speed of the inhibition process in TBI patients. To exert inhibitory control over a prepotent response, the cortex conveys stop-signal information to the basal ganglia via the hyperdirect (subthalamic nucleus) and indirect pathways (striatum and GPe).9,13,40 For inhibition to be successful, this signal should reach the output nuclei of the basal ganglia (GPi and substantia nigra) before the execution signal reaches a point of no return. 16 This will lead to a strong inhibition of thalamocortical output to the primary motor cortex. Our results demonstrate that damage to each of these subcortical structures can contribute to response inhibition deficits. The results also reveal that the relationship between volume and behavior can be very specific. Examination of the connectivity profile of the striatal subregions that correlated with inhibitory speed showed that the correlations were mainly localized within subregions with connections to the prefrontal, motor, and parietal regions. These cortical regions are critical parts of an integrated corticosubcortical network achieving efficient motor inhibition.11-13,41 When only studying global volume, such observations are likely to be missed.
The relationship between thalamic atrophy and SSRT was more widespread. This fits with the notion that thalamic integrity is of great importance in understanding executive dysfunction following TBI.18,42,43 The thalamus is a strategically critical brain region because it relays information between subcortical and cortical structures. Previously, it has been shown that damage to thalamic projection fibers could account for variance in executive dysfunction in TBI patients. 42 Furthermore, abnormal thalamic resting state networks have been identified in patients with mild TBI, which were associated with diminished neurocognitive functions. 44
With respect to controls, we found that the degree of proactive slowing on go trials was positively correlated with volume in the lateral and medial regions of the right thalamus with connections to the premotor, prefrontal, and temporal regions and in bilateral GPi and GPe. Although, on average, no difference in SSRT between both stop-signal probability conditions was observed, we did find that controls who had a longer SSRT in the HSP than in the LSP condition had lower volume in the medial-anterior wall of the left putamen. This would suggest that participants with a lower volume in this subregion of the left anterior putamen are less able to incorporate the stop-signal probability information to improve SSRT. Overall, these results are consistent with findings of several studies indicating the importance of the anterior striatum and pallidum and their interaction with the thalamus in proactive inhibition. For example, greater anterior striatal and pallidal activation is associated with greater proactive motor suppression.7,9,15 Premanifest Huntington’s patients with reduced striatal and pallidal volume have great difficulties with proactively suppressing a movement. 15 Moreover, deep brain stimulation of GPi in Parkinson disease patients interferes with proactive inhibition. 45 The left putamen has been found to be part of a functionally coherent network involved in proactive inhibition that might use top-down control over motor preparation. 46 Here, we show that, also in healthy young adults, variations in volume of the anterior striatum, pallidum, and thalamus relate to the ability to exert proactive inhibitory control.
Contrary to the findings in controls, we did not observe any correlation between shape and proactive inhibition in TBI. It might be that TBI patients used a more proactive strategy already in the LSP condition to compensate for their reduced ability to reactively stop a motor response. This would lead to a smaller difference in Go RT/SSRT between the LSP and HSP conditions in TBI compared with controls, compromising the search for correlations with shape. The variance of the proactive inhibition measures was (although not significantly) smaller for TBI patients compared with controls (Table 2), which may have resulted in lower correlation coefficients. In combination with the relatively modest sample size (n = 19), this might underlie the absence of a relation between shape and proactive inhibition in the TBI group. Future studies would benefit from including a condition with only go trials and making use of techniques such as drift diffusion modeling 47 to investigate the hypothesis that TBI patients already use a more proactive response strategy when the probability of a stop signal is low.
Conclusion
The present findings demonstrate that TBI patients are able to take into account the probability of upcoming events and to proactively prepare to stop even though reactive inhibition is impaired. Moreover, volume of subregions of the basal ganglia and thalamus is predictive for reactive inhibition in TBI and for proactive inhibition in controls. These results illustrate the importance of the structural gray matter integrity of the subcortical structures for successful response inhibition and the clinical relevance to executive function in TBI.
Footnotes
Declaration of Conflicting Interests
The authors declared no potential conflicts of interest with respect to the research, authorship, and/or publication of this article.
Funding
The authors disclosed receipt of the following financial support for the research, authorship, and/or publication of this article: This work was supported by the Research Program of the Research Foundation–Flanders (FWO; G.0708.14 and G.0721.12), the Interuniversity Attraction Poles program of the Belgian federal government (P7/11), and Special Research Fund KU Leuven (C16/15/070). IL is funded by a postdoctoral fellowship of the Research Foundation–Flanders (FWO).