
Abstract
Background. Attention is frequently impaired after stroke, and its impairment is associated with poor quality of life. Physical activity benefits attention in healthy populations and has also been associated with recovery after brain injury. Objective. We investigated the relationship between objectively measured daily physical activity, attention network connectivity, and attention task performance after stroke. We hypothesized that increased daily physical activity would be associated with improved attention network function. Methods. Stroke patients (n = 62; mean age = 67 years, SD = 12.6 years) and healthy controls (n = 27; mean age = 68 years, SD = 6 years) underwent cognitive testing and 7 minutes of functional magnetic resonance imaging in the resting-state. Patients were tested 3 months after ischemic stroke. Physical activity was monitored with an electronic armband worn for 7 days. Dorsal and ventral attention network function was examined using seed-based connectivity analyses. Results. Greater daily physical activity was associated with increased interhemispheric connectivity of the superior parietal lobule in the dorsal attention network (DAN; P < .05, false discovery rate corrected). This relationship was not explained by stroke lesion volume. Importantly, stronger connectivity in this region was related to faster reaction time in 3 attention tasks, as revealed by robust linear regression. The relationship remained after adjusting for age, gray matter volume, and white matter hyperintensity load. Conclusions. Daily physical activity was associated with increased resting interhemispheric connectivity of the DAN. Increased connectivity was associated with faster attention performance, suggesting a cognitive correlate to increased network connectivity. Attentional modulation by physical activity represents a key focus for intervention studies.
Introduction
The beneficial effects of physical activity on brain structure and function, with concomitant improvements in cognitive functioning, have been well established.1 -4 Investigators are now seeking to describe the brain mechanisms that mediate the relationship between physical activity and cognitive function.3,5,6 The motivation is often to capitalize on these benefits in order to drive cognitive recovery after brain injury or to prevent or delay cognitive decline in aging and disease.6,7 Indeed, there is accumulating evidence that physical activity has neuroprotective effects in both normal aging8 -10 and degenerative dementia syndromes,11 -14 as well as promoting cognitive recovery after traumatic brain injury. 15
Meta-analyses and a recent review have shown attention to be a key cognitive domain to benefit from physical activity.2,3,16 When measured by event-related functional magnetic resonance imaging (fMRI), physical activity levels 17 are associated with increased activity in prefrontal and posterior parietal cortices during performance of attention tasks. These regions are well established nodes in the distributed attention networks of the brain. 18 Two key attention networks—the dorsal attention network (DAN) and the ventral attention network (VAN)—coordinate endogenously deployed and exogenously captured attention, respectively.19 -21 The DAN shows significant activation in line with tasks eliciting directed attention such as cued detection tasks. 19 Importantly, DAN function has also been associated with upper-arm and walking ability 22 as well as steady gait maintenance 23 in stroke patients. This highlights the DAN as a key network for targeting rehabilitation after stroke. The VAN shows significant activation in line with tasks eliciting detection of salient targets or unexpected events. 19 Disruption to the VAN or promotion of its recovery after stroke has not been well investigated. The DAN and VAN can be reliably reproduced, without task demands, by examining spontaneous, low-frequency blood oxygenation level dependent (BOLD) brain activity while patients rest in an MRI scanner.18,24 Functional connectivity networks derived from the resting state are ideal for the assessment of brain function in stroke patients because data can be acquired quickly and without putting performance demands on patients.25,26 Task-based functional imaging reliant on BOLD signal change is notoriously difficult to interpret in stroke patients because of significant deviations from the typical hemodynamic response to neural activity in these patients.25,27,28
Given the relationship with attention task performance and attention network function in healthy populations, increasing physical activity is a promising avenue for the promotion of cognitive recovery after stroke. Cognitive impairment affects up to two-thirds of stroke patients.29,30 Attention is the most commonly impaired cognitive domain following stroke,31,32 and its impairment is associated with poor quality of life after stroke.32,33
Yet the relationship between daily physical activity and cognitive function after stroke has not yet been well described. 34 Where an association has been explored, the measurement of physical activity has been crude, often in the form of self-reports or surveys, which fails to give an accurate picture of all physical activity. 7 Accelerometers provide an objective estimate of daily physical activity that includes sedentary behavior, light-intensity activities, and more strenuous activities that may or may not be typically considered exercise (eg, walking, cycling, gardening, housework). Accurately assessing the level of physical activity after stroke in a natural environment can provide a realistic starting point for designing activity-boosting interventions or guiding rehabilitation after stroke.
We examined the relationship between objectively measured daily physical activity and attention network function after stroke and related this to performance across 3 attention tasks. We hypothesized that daily physical activity after stroke would be associated with attention network function, as measured by network-based connectivity analyses and attention task performance.
Methods
Participants
Data from the Cognition and Neocortical Volume after Stroke (CANVAS) study were analyzed. 35 The study includes cognitive and neuropsychological testing and MRI scanning within 1 month, 3 months, 1 year, and 3 years of ischemic stroke. Healthy control participants undergo the same protocol. Patients were recruited from Stroke Units at the Austin, Box Hill, and Royal Melbourne Hospitals in Melbourne, Australia. The study was approved by each hospital’s human research ethics committee in line with the World Medical Association Declaration of Helsinki. Patients and healthy controls gave informed written consent. Those unable to give consent were excluded from participation. Patients with hemorrhagic stroke or venous infarction were excluded from participation, and those with significant medical comorbidities precluding participation in cognitive testing or those unlikely to survive the length of the longitudinal study (3 years) were excluded from participation. Patients were also excluded if they did not meet standard MRI safety checks. Strokes were classified by a stroke neurologist (AB) according to cause 36 and site of clinical presentation. 37 Participants were interviewed for medical history, existing vascular risk factors, and medications. We used the following scales to assess impairment and disability: National Institutes of Health Stroke Scale (NIHSS) 38 for stroke severity, modified Rankin Scale 39 for functional level, and the NIHSS and Star Cancellation test for neglect. 40 In all participants, depression was assessed using the Patient Health Questionnaire–9. Anxiety was evaluated using the Generalized Anxiety Disorder–7.
Outcome Measures
Physical Activity
Physical activity was monitored in all participants with a SenseWear armband (BodyMedia Inc, Pittsburgh, PA) worn for 7 days following the scanning session. The armband integrates information from a triple-axis accelerometer with multiple physiological sensors, including galvanic skin resistance, heat flux, body temperature, and near-body ambient temperature. Data from these sources are combined with participants’ sex, age, height, weight, and smoking status in a proprietary algorithm to estimate minute-by-minute energy expenditure. The armband detects dedicated exercise as well as all incidental activity, such as climbing stairs or doing housework. It has been shown to be a valid measure of energy expenditure in free-living conditions, both in healthy 41 and stroke 42 populations, as tested against independent measures of energy expenditure such as the gold standard, double-labeled water. The SenseWear monitor has also been shown to have high reliability. Brazeau et al 43 reported excellent test-retest reliability (intraclass correlation r = 0.97; P < .001), between 2 repeated days of supervised structured activity protocols (each involving 13 hours of observation). Energy expenditure is reported in metabolic equivalent of task units (METs), which are calculated as multiples of the resting metabolic rate (1 MET). For this study, in line with those in other sedentary populations, 44 we set the threshold for physically active at 1.5 METs to capture even light-intensity activity. The percentage of the day spent active was calculated as the number of minutes spent physically active as a proportion of monitor wear time (the armband automatically detects when it is on- and off-body).
Cognitive Testing
A simple reaction time task (detection), a choice reaction time task (identification), and a 1-back task from Cogstate (Cogstate Ltd, Melbourne, Australia) were presented on a 13-inch screen laptop. These tasks are sensitive and reliable tests of cognitive impairment in elderly populations and of attentional deficits after stroke. 45 Instructions were read aloud to the participants, followed by a brief practice. A playing card was presented face down centrally on a green background. In the detection task, a single joker card flipped face up at random intervals between 2.5 and 3.5 s. Participants pressed the “yes’ mapped response button (“K” on a standard qwerty keyboard) on detection of the card flipping to face up. The task was completed after 35 correct detections. In the identification task, participants responded “yes” if the card was red as soon as it flipped face up and no (“D” on the keyboard) if it was not. Red and black joker cards were used in all trials. The task was completed after 30 correct identifications. In the 1-back task, the full deck of playing cards were used as stimuli. Participants pressed “yes” if the centrally presented card matched the card on the previous trial and “no” if it did not. The task was completed after 30 correct trials. In all 3 tasks, visual and auditory feedback denoted correct and incorrect responses, with an additional auditory cue for anticipatory responses given before the trial. Speed and accuracy of responses were recorded. The primary outcome measure was reaction time.
Image Acquisition and Processing
Images were acquired on a Siemens 3T Tim Trio scanner (Erlangen, Germany) with a 32-channel head coil. An MPRAGE volume was acquired with 160 sagittal slices, 1 mm isotropic voxels using a 1900-ms repetition time (TR), 2.55 ms echo time (TE), 9° flip angle, and a 256 × 256 acquisition matrix. A high-resolution 3D SPACE-FLAIR image was acquired with 160 sagittal slices, 1 mm thick, with 6000 ms TR, 380 ms TE, 120° flip angle, and a 256 × 256 acquisition matrix. Seven minutes of T2* weighted, single-shot echoplanar images were collected while participants rested with their eyes closed. Around 5 to 6 minutes of fMRI in the resting state has been shown to be sufficient for connectivity analyses, as average correlation strengths plateau at this time. 46 This consisted of 132 volumes of interleaved slices, with 3 mm isotropic voxels, 3 mm slice gap, 3000 ms TR, 30 ms TE and 85° flip angle, 100% field of view, and a 72 × 72 acquisition matrix.
Functional images were preprocessed in SPM8 (Wellcome Department of Imaging Neuroscience, London, UK). Image preprocessing included slice-time correction, 6-parameter rigid body realignment, and coregistration to the structural image. Participants with movement exceeding 0.8 mm of head translation or 1° of head rotation in the resting-state scan or with significant movement artefacts within their high-resolution structural scans were excluded from further image processing (9 stroke patients). Lesions were manually traced on the high-resolution FLAIR image to create binarized lesion masks. Lesion tracing was verified by the stroke neurologist (AB). The volume of stroke lesion masks was calculated using FSL’s 47 inbuilt volume estimation tools. Lesion masks were used to improve patient image segmentation and normalization to the Montréal Neurological Institute (MNI)-152 template using the Clinical Toolbox SPM extension. 48 Failure to mask the lesion has been shown to result in poor tissue segmentation and minimization of the lesion size.48,49 Tissue segmentations were manually inspected for quality assurance. Functional images were smoothed with an 8-mm full width at half maximum Gaussian kernel. Conn Toolbox 50 was used for despiking, to reduce the influence of outlier scans, and component-based noise correction 51 was used to remove spurious signals from non–gray matter tissue and head movement. Nuisance regression and band-pass filtering (0.01-0.1 Hz) were performed simultaneously using the Simult. This is a better control for noise associated with head motion and nonneural BOLD fluctuations than band-pass filtering alone. 52
Imaging Analysis
Seeds for the functional connectivity analysis were created as spheres with a 15-mm radius around Talairach coordinates taken from Fox et al, 18 converted to MNI coordinates with tal2mni (http://imaging.mrc-cbu.cam.ac.uk/imaging/MniTalairach). These represent the peak of activation derived from a meta-analysis of attention tasks. 18 A dorsal frontal eye field (DFEF) region (MNI coordinates 24.24, −16.01, 54.66) and a dorsal intraparietal sulcus (DIPS) region (27.27, −62.24, 50.04) were seeds for the DAN. A ventral frontal cortex region (MNI coordinates 37.37, 18.48, 2.06) and a ventral temporoparietal junction region (53.54, −50.45, 19.10) were seeds for the VAN. The average time course of signal fluctuation between the seeds per network was correlated with the average signal time course across the brain using bivariate correlation with no hemodynamic response function weighting. Normalized daily physical activity levels were entered into a second-level random-effects regression model for the DAN and the VAN separately but with group status as a regressor of interest and stroke lesion volume as a regressor of no interest.
White matter hyperintensities (WMHs) were manually segmented with Slicer version 4.3 (http://www.slicer.org/). Manual segmentation remains the gold standard for segmentation to ensure accurate delineation of lesions. 53 WMHs were identified by the operator (QL) on the FLAIR image and outlined by adjusting the intensity threshold of the lesion to create binary masks. The accuracy and validation of WMH labeling was confirmed by interrater comparison on 20 randomly selected, independent FLAIR images (intraclass correlation coefficient = 0.9).
Absolute gray matter volume was extracted from T1-weighted MPRAGE images using Freesurfer version 5.3 (http://freesurfer.net 54 ), with default processing settings. All segmented images were visually inspected; white matter was manually edited and skull stripping was corrected where necessary.
Statistical Analysis
Data were analyzed using Stata, Release 14 (2015). Performance in the Cogstate tasks was compared with Welch’s t-tests. Robust linear regression 55 examined the relationship between network connectivity (normalized correlation coefficient of connectivity strength) and performance in the tasks across all participants, adjusting for age, group (patient or control), WMH load, and GM volume. We tested the relationship between network connectivity and performance across all participants because we expected attention performance to be associated with attention network connectivity regardless of patient status. We adjusted the model for group status to detect any group interactions.
Results
Participants
The patient and healthy control groups were matched in age. Control participants had greater years of education (Table 1). Neither the amount of activity data collected nor time spent physically active was significantly different between patients and controls. The stroke patients and healthy controls were well matched in terms of adherence to monitor wear; stroke patients wore the monitor for an average of 22.9 hours (SD = 1.76 hours) per day for an average of 6.2 days (SD = 1.61 days). The healthy control participants wore the monitor for an average of 23 h/d (SD = 0.95 hours) for 6.3 days (SD = 1.75). For stroke patients, there was an expected mixture of stroke etiologies and lesion locations, given our broad inclusion criteria: 16 lacunar infarcts, 30 partial anterior circulations (including cortical and subcortical lesions to frontal, temporal, and parietal lobes), 15 posterior circulations (including strokes affecting the brainstem and cerebellum), and 1 total anterior circulation. 37 Among the strokes, 43 occurred in the right hemisphere and 22 were subcortical infarctions (Figure 1). Nine stroke patients were excluded from further analysis because their structural and functional imaging data contained significant movement artefacts. The group was well matched to the analyzed subgroup, with a mean age of 68 (SD = 11) years, mean years of education = 11 (SD = 2), and median NIHSS score at 3 months = 1 (interquartile range = 0-3).
Summary of Participant Demographic, Neuropsychological, and Physical Activity Data. a
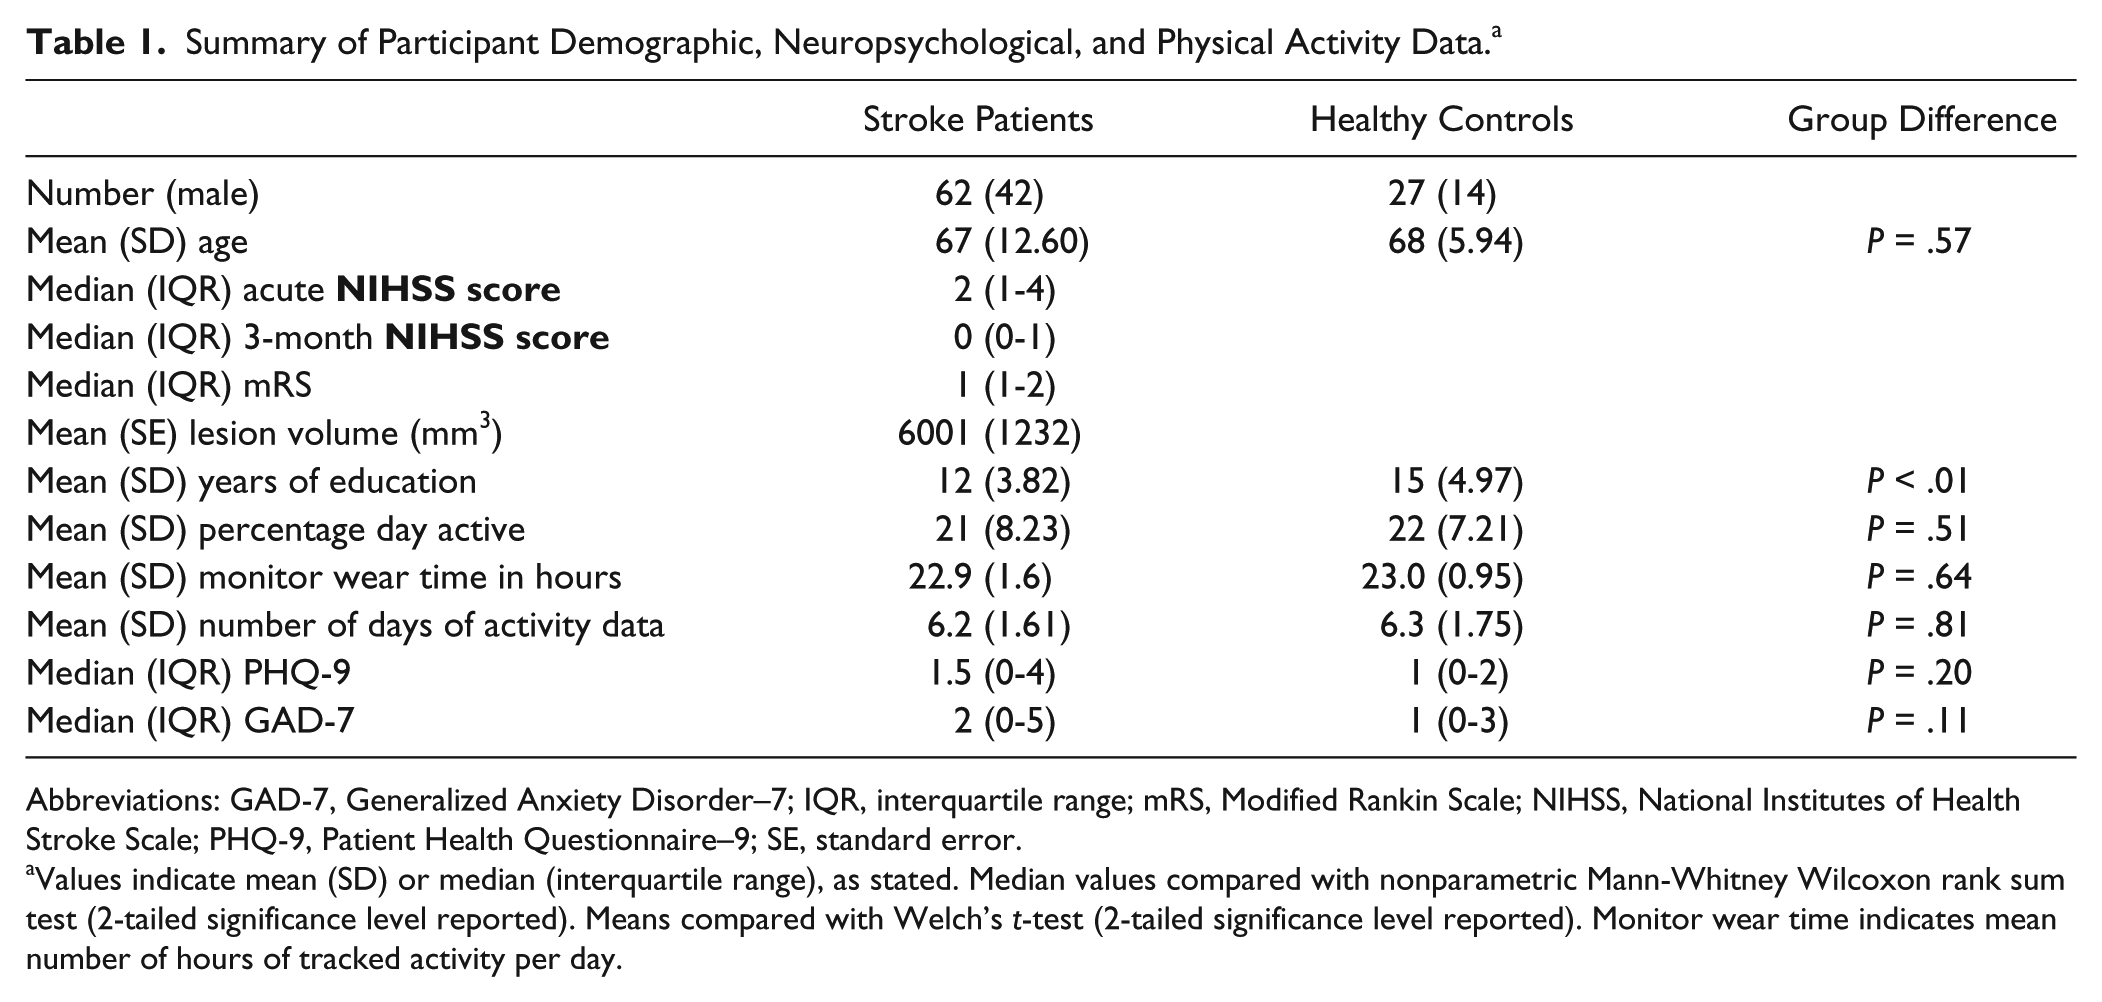
Abbreviations: GAD-7, Generalized Anxiety Disorder–7; IQR, interquartile range; mRS, Modified Rankin Scale; NIHSS, National Institutes of Health Stroke Scale; PHQ-9, Patient Health Questionnaire–9; SE, standard error.
Values indicate mean (SD) or median (interquartile range), as stated. Median values compared with nonparametric Mann-Whitney Wilcoxon rank sum test (2-tailed significance level reported). Means compared with Welch’s t-test (2-tailed significance level reported). Monitor wear time indicates mean number of hours of tracked activity per day.
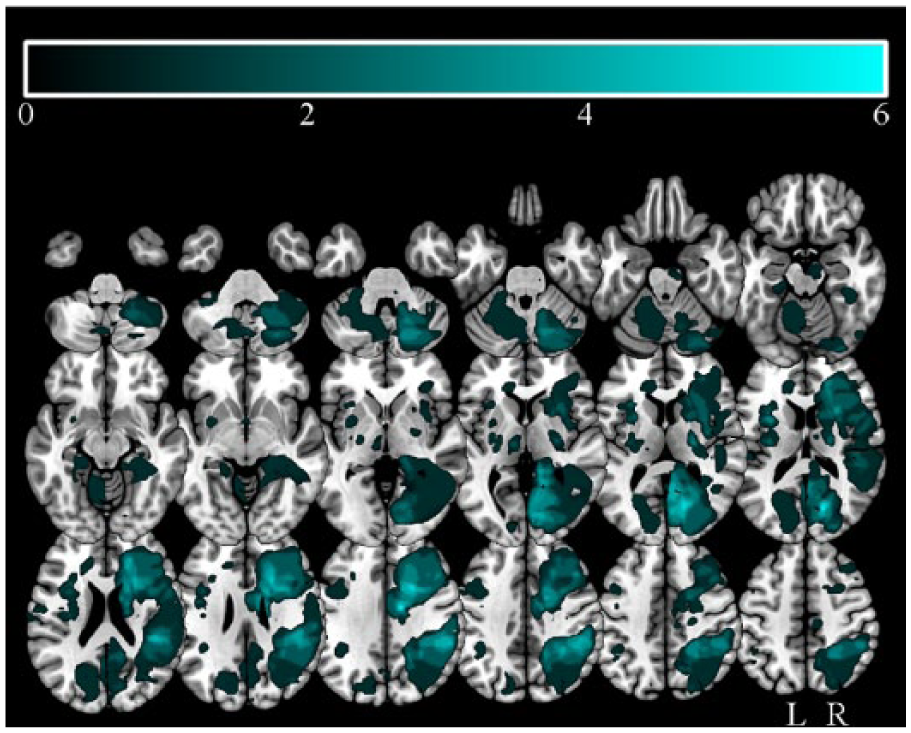
Stroke lesion overlap map: Stroke lesion overlap maps overlaid onto normalized axial slices; color bar indicates number of patients with lesions overlapping.
Behavioral Results
Two patients showed some signs of neglect, scoring 1 on the “Extinction and Inattention” subscale of the NIHSS. In both groups, performance on the Star Cancellation test, a highly sensitive measure of neglect, 40 exceeded 94% accuracy.
Accuracy in the healthy control participants was high in all 3 Cogstate tasks. One stroke patient was excluded from the analysis of the detection task, and 3 participants were excluded from the analysis of the 1-back task because performance fell below 60% accuracy. Healthy control participants were more accurate and faster than stroke patients in the detection task [accuracy t(80) = 3.40, P < .001; reaction time t(62) = −2.80, P < .01]; the identity task [accuracy t(69) = 2.24, P < .05; reaction time t(85) = −3.20, P < .01], and the 1-back task [accuracy t(82) = 4.61, P < .001; reaction time t(58) = −3.92, P < .001].
Resting-State Connectivity
The resting-state connectivity analyses produced a canonical DAN and VAN in the stroke patients and the healthy controls (Figure 2). Direct contrasts of VAN and DAN between the stroke and healthy control groups revealed no significant difference in the VAN (height uncorrected, P < .001; extent FDR corrected, P < .05) and greater connectivity in the stroke group in the temporal pole, prefrontal cortex, and the posterior cingulate in the DAN (Figure 3). The regions showing increased connectivity are not typically associated with the DAN, 18 suggesting that they represent hyperconnectivity. 56 Hyperconnectivity is common in studies of neurological disease and is more common than hypoconnectivity in studies of traumatic brain injury. 56
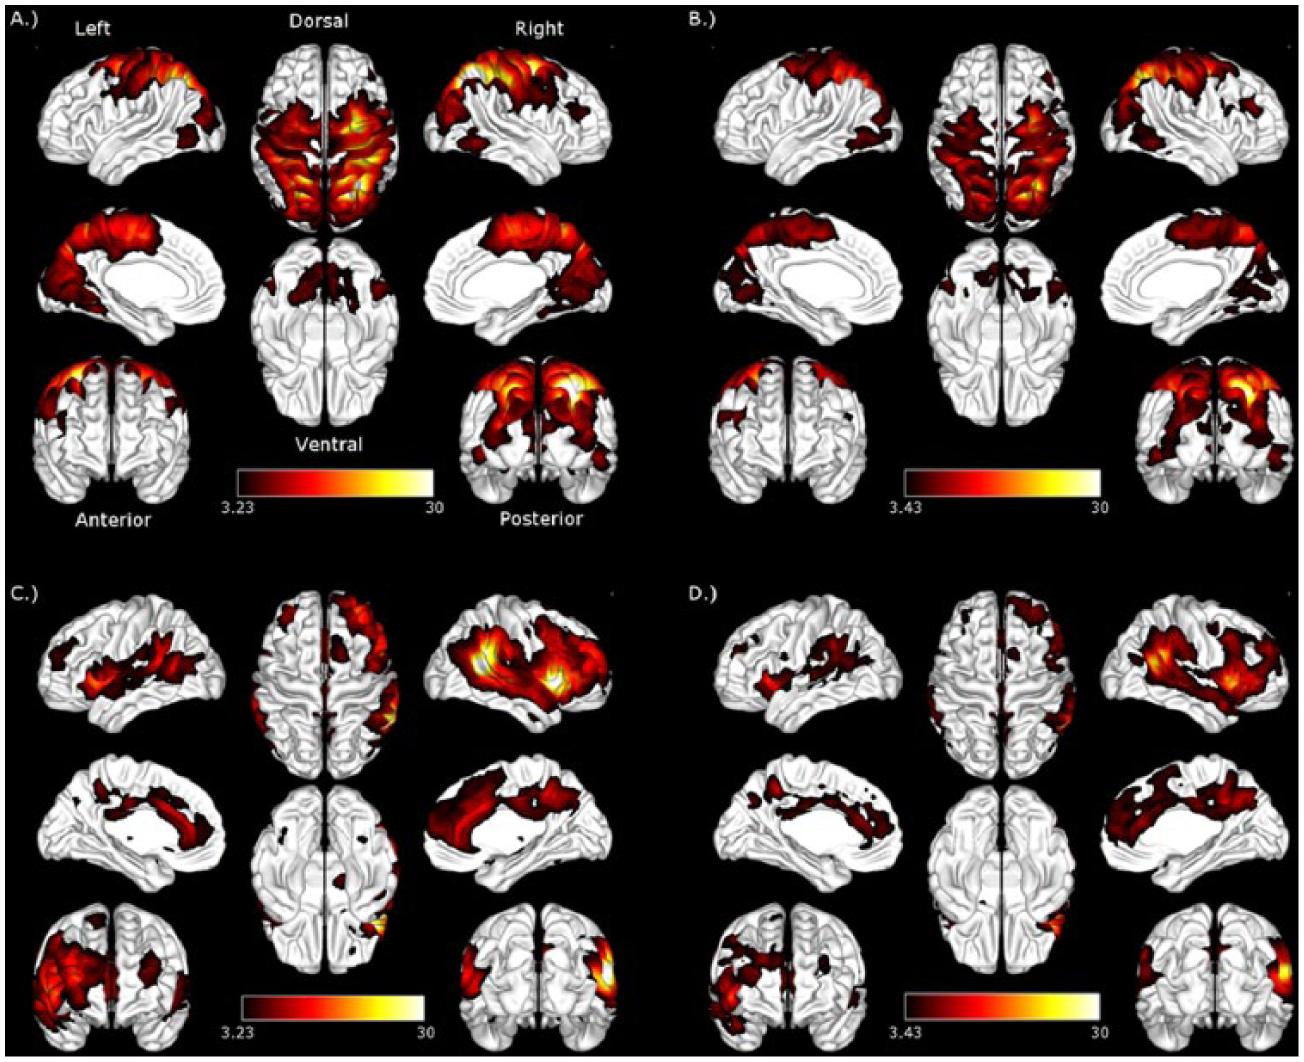
Dorsal and ventral attention networks: Dorsal attention network in (A) stroke patients and (B) controls. Ventral attention network in (C) stroke patients and (D) controls. Height threshold uncorrected, P < .001; false discovery rate corrected to P < .05. Color maps represent z-values.
Greater connectivity in the dorsal attention network (DAN) regions, with significantly greater connectivity with DAN seeds in stroke patients compared with healthy controls. Height threshold uncorrected, P < .001; false discovery rate corrected for multiple comparisons to P < .05. Color maps represent t-values.
The degree of damage to the DAN and VAN was assessed quantitatively by calculating the percentage of voxels across the entire network, defined in the control group, overlapping with at least a single lesioned voxel in the stroke patient group. Only 13% of voxels in the VAN and 14% of voxels in the DAN overlapped with at least a single lesioned voxel.
The Relationship Between Daily Physical Activity and Attention Network Connectivity
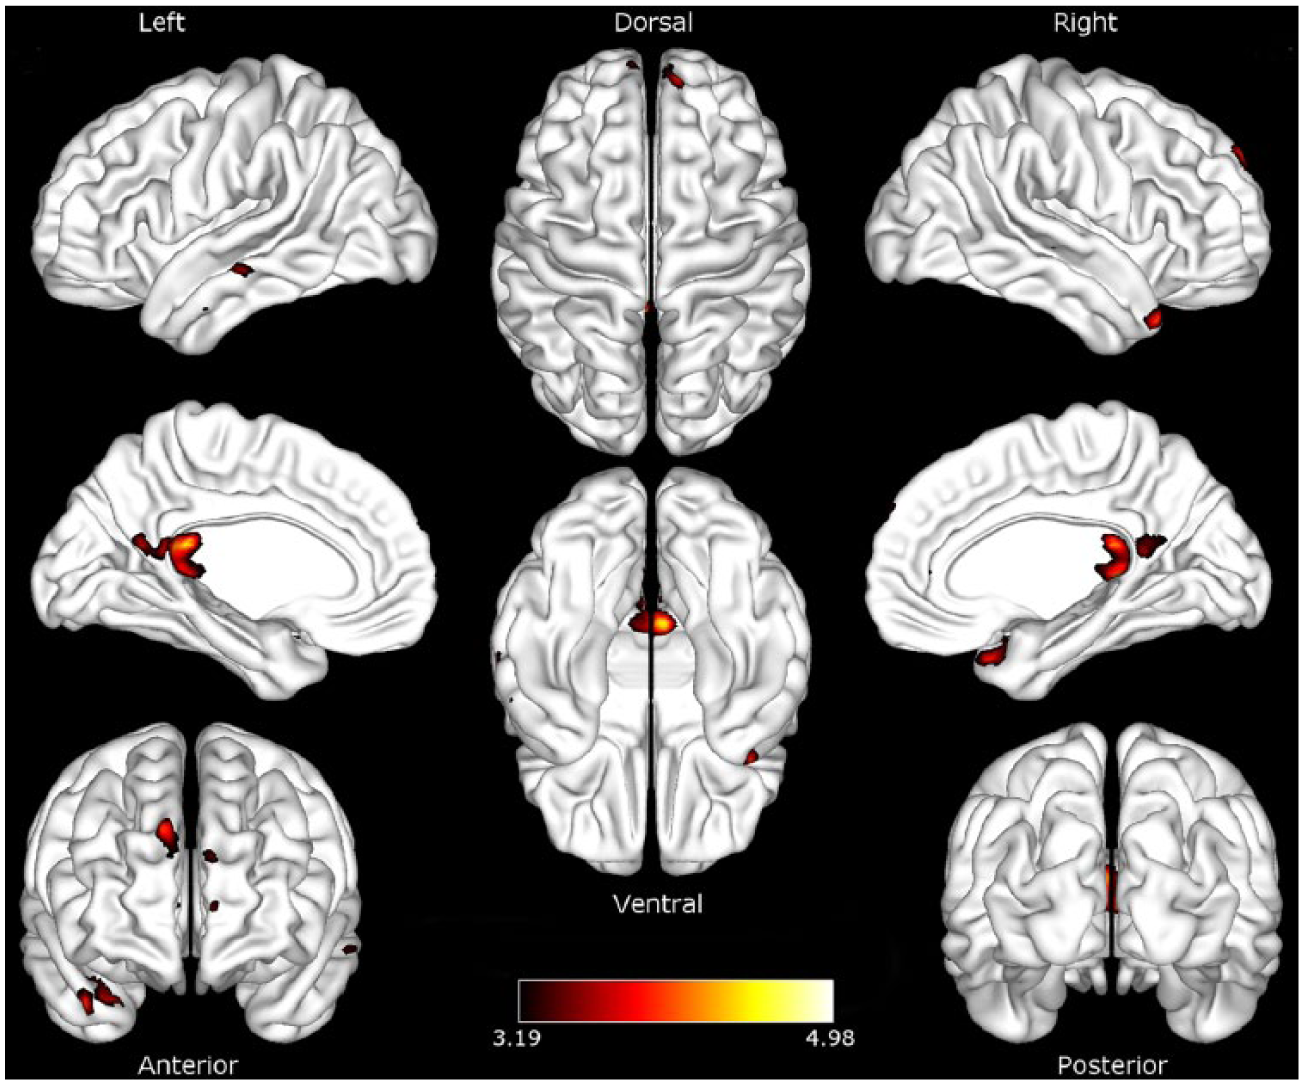
Interhemispheric connectivity between the right DIPS and DFEF seeds of the DAN and the left superior parietal lobule (SPL) was positively associated with daily activity in stroke patients, controlling for stroke lesion volume. This relationship was not evident in the control group. A semipartial correlation analysis clarified the contribution of each seed in the DAN to the observed relationship. This examines the unique connectivity of DIPS and DFEF with the rest of the brain, removing the influence of the other region. 50 The strength of inter-hemispheric connectivity between the SPL and DIPS, but not DFEF, was significantly associated with daily physical activity in stroke patients (FDR corrected, P < .05; Figure 4), independently of stroke lesion volume. Physical activity was not significantly associated with connectivity in the VAN in either stroke patients or healthy controls.
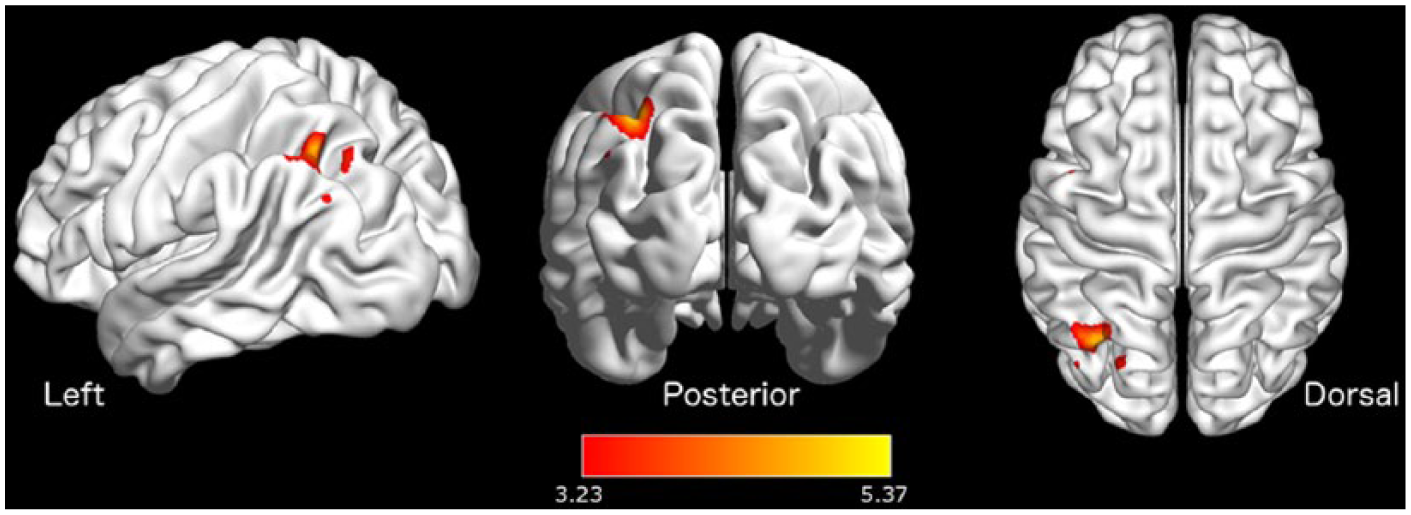
Dorsal attention network connectivity modulated by physical activity Significant association between strength of connectivity and daily physical activity in stroke patients in the superior parietal lobe. Height threshold uncorrected, P < .001; false discovery rate corrected for multiple comparisons to P < .05. Color maps represent t-values.
The Relationship Between Attention Network Connectivity and Attention Task Performance
To determine whether increased network connectivity was associated with performance in attention tasks, we tested the association between the strength of interhemispheric connectivity in the SPL and reaction time in the Cogstate tasks using robust linear regression. Fisher normalized correlation coefficients were extracted from a 15-mm sphere around the peak in the superior parietal lobe region (MNI coordinates: −33, −69, +51) in all participants. A primary motor cortex control region of interest was created to ensure that any observed relationship between network connectivity and performance in the Cogstate tasks was specific to the DAN. The primary motor cortex region was created as a mask from the Julich histological atlas provided as part of FSL. 47 Normalized connectivity values between the primary motor cortex and superior parietal lobe regions and the DIPS were extracted from all participants and entered into a robust linear regression model, which was adjusted for age, WMH load, gray matter volume, and group.
Increased connectivity between the superior parietal lobe and DIPS was associated with decreased reaction time in the 3 Cogstate tasks. The slope of this relationship was significantly different to the relationship between reaction time and primary motor cortex connectivity (Table 2).
Relationship Between Strength of Connectivity and Attention Task Performance. a
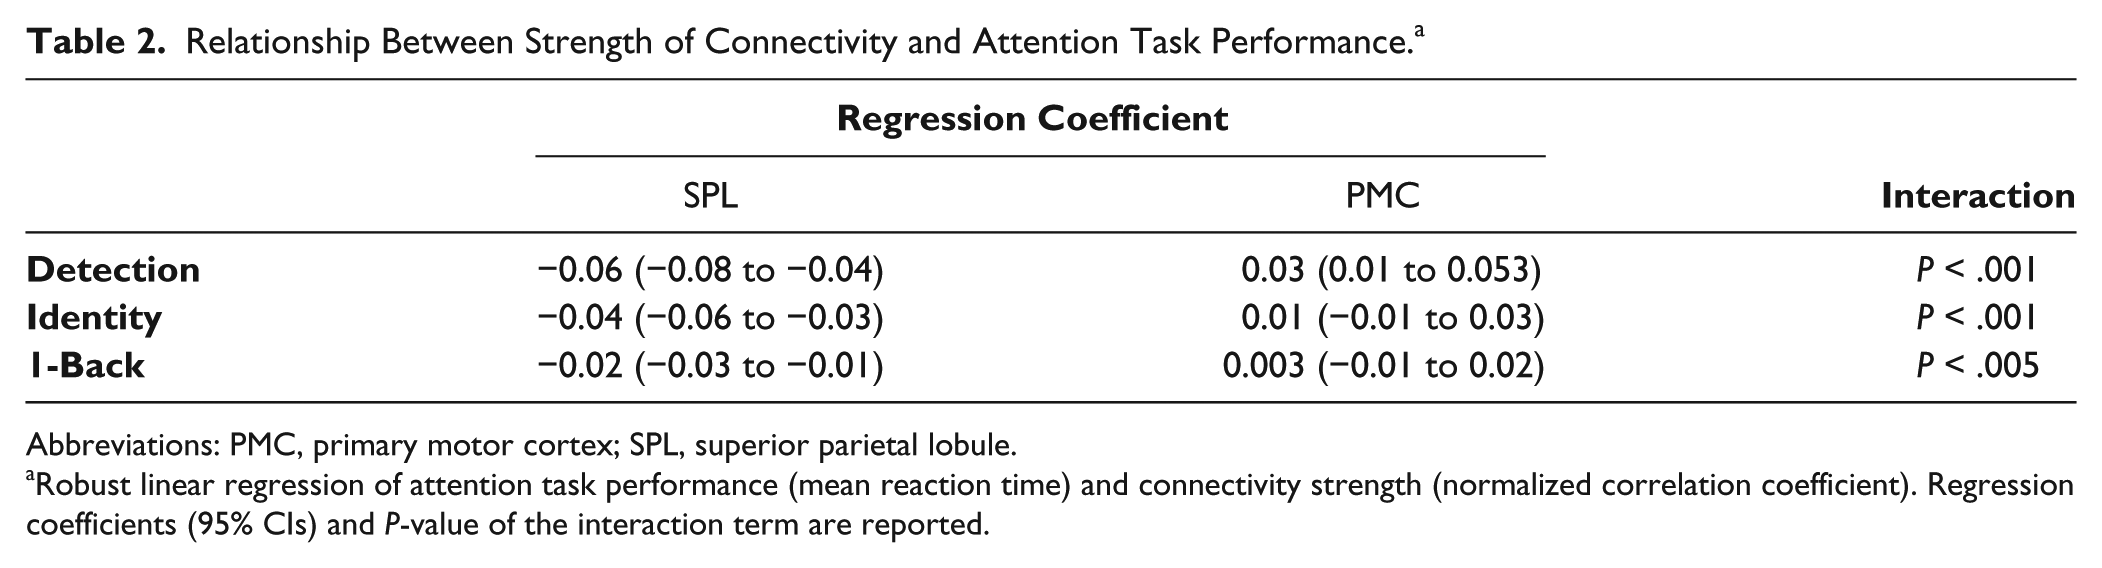
Abbreviations: PMC, primary motor cortex; SPL, superior parietal lobule.
Robust linear regression of attention task performance (mean reaction time) and connectivity strength (normalized correlation coefficient). Regression coefficients (95% CIs) and P-value of the interaction term are reported.
Discussion
Daily physical activity was associated with DAN function 3 months after stroke. The degree of interhemispheric connectivity was associated with performance across 3 attention tasks. This finding was independent of stroke location and stroke volume. These findings present important extensions to the current literature. First, we provided objective measurements of daily physical activity after stroke in community-dwelling participants. We used resting-state connectivity methods to examine the relationship between daily physical activity and attention network function without putting performance demands on patients. We then related network function to performance in attention tasks in a large group of stroke patients and age-matched controls. Finally, we took care to account for WMH burden, stroke lesion volume, as well as gray matter atrophy, all of which may alter network function, independently of stroke or physical activity. 7
Physical Activity Is Associated With Increased Interhemispheric Connectivity in the DAN
A number of studies have shown increased task-related activity in the superior and posterior parietal cortex regions associated with increased cardiovascular fitness as well as physical activity.8,17,57 These regions are well established nodes of the DAN. 18 We found increased interhemispheric connectivity associated with increased daily physical activity. This provides evidence of the benefit of physical activity to intrinsic attention network function, beyond just task-based activity. 8 This finding was specific to stroke patients, despite no significant difference in the average daily time spent physically active between stroke patients and healthy controls. The finding was also not explained by structural damage relating to the volume of the stroke infarct. Imbalances in interhemispheric connectivity in the posterior parietal cortex are frequently observed in stroke patients and predict performance in attention tasks.22,58,59 The degree of interhemispheric disruption in the posterior parietal cortex is a better predictor of attention performance than intrahemispheric connectivity, even within the damaged hemisphere.22,59 The degree of imbalance in interhemispheric connectivity in the motor network is known to be a predictor of poor recovery after stroke. 60 There is now growing evidence that similar interhemispheric disruption in attention networks may underlie attention deficits after stroke, including in neglect.58,59 Attention is often impaired after stroke,30 -32 and therefore, increasing daily physical activity may be an important intervention to aid attention network functioning. However, increased connectivity itself is not evidence of improved network functioning. Resting-state networks have been repeatedly demonstrated to have high correspondence with task-based functional networks,18,61 but the behavioral significance of connectivity between groups is often neglected. Concomitant improvements in performance in tasks measuring attention function provide evidence of a cognitive benefit to increased connectivity. We, therefore, sought to determine the behavioral relevance of increased superior parietal interhemispheric connectivity with increased daily physical activity.
Strength of Connectivity in DAN Is Associated With Performance in Attention Tasks
The degree of interhemispheric connectivity between SPL and DIPS predicted reaction time on 3 tasks of attention. Greater interhemispheric connectivity was associated with faster performance. This mirrors previous studies in which resting-state interhemispheric connectivity in the posterior parietal cortex was predictive of reaction time in the Posner attention task, 22 providing clear evidence of behavioral significance of DAN connectivity. This relationship was evident across stroke patients and healthy age-matched controls, in line with evidence that suggests that attention network connectivity predicts individual differences in attention performance. 61 Importantly, this relationship remained after adjusting for age, white matter hyperintensity burden, and gray matter volume, suggesting that it was not driven by brain atrophy or white matter pathology after stroke.
The Cogstate tasks have been shown to be sensitive to cognitive impairment in elderly populations, 62 in mild cognitive impairment, 63 and a reliable predictor of attentional deficits after stroke. 45 The tasks have shown construct validity when tested against standardized neuropsychological tests of attention and memory. 64 Performance in the detection and identity tasks correlate most strongly with neuropsychological tasks requiring visual attention, visual processing, and divided attention, such as the Trail Making Test Part A and B. 64 Performance in the 1-back task correlates most strongly with performance in neuropsychological tasks testing visual scanning and working memory, such as the Spatial Span Subtest. 64 The degree of interhemispheric connectivity correlated with reaction time in all 3 Cogstate tasks, with the common domain underlying these tasks being visual attention—the core function of the DAN. 18
The current evidence does not preclude a relationship in which increased interhemispheric connectivity in the DAN results in increased physical activity. Indeed, there is some evidence that the relationship between attention and physical activity is bidirectional 65 and that improving executive function can increase adherence to physical activity programs. 66 Further work is needed to firmly establish the direction of this relationship. Intervention studies or clinical trials will be better suited to directly determine the relationship between physical activity and attention after stroke.
Independent Nodes of the DAN
The DIPS and DFEF are commonly used to reliably derive the DAN, based on meta-analyses of tasks requiring top-down orienting of attention. 18 A semipartial correlation analysis allowed us to separate the influence of DFEF and DIPS on each other while examining regions of the DAN whose strength of connectivity was associated with daily physical activity. As would be expected, both seeds independently produced a canonical bilateral DAN. Only the DIPS seed showed a significant association with physical activity. DIPS and DFEF nodes may have distinct roles within the DAN. 67 For example, combined fMRI and transcranial magnetic stimulation (TMS) have shown differential disruption of visual cortex modulation when TMS is directed toward DIPS compared with DFEF. 67 DIPS modulation of visual cortex activity may be dominated by bottom-up processing, whereas the DFEF region exerts more top-down control within the DAN. 67 Our results support this dissociation—connectivity with DIPS, but not DFEF, showed a significant association with daily physical activity. Here, we have shown an association between physical activity and the endogenous attention network (DAN), but not the exogenous attention network (VAN). Future studies should assess which aspects of endogenously controlled attention benefit from daily physical activity. While Cogstate tasks are sensitive measures of broad attention function in stroke patients and healthy elderly populations, 45 they are not designed to test specific aspects of attentional processing, such as the hypothesized role of DIPS in bottom-up modulation of the visual cortex.
Limitations
Our study was limited by the need to group stroke patients across stroke etiologies and stroke locations in order to maximize the power to detect changes in network function. We took care to account for stroke lesion volume and generalized atrophy; however, there may be more subtle network changes, depending on stroke location and etiology, that we were unable to detect. There was also a degree of damage to the attention networks in the stroke group. However, the greatest degree of stroke overlap across patients was far inferior to the posterior parietal regions associated with physical activity. There may be limits to the generalizability of our sample because our stroke group was relatively unimpaired at the 3-month time point and showed rates of physical activity similar to that of the healthy control group. Further studies that include more severely impaired patients may clarify whether the benefits of physical activity to attention and brain network function would remain with increasing stroke severity. Our study is observational, not interventional, and so we were limited in our ability to extrapolate our findings across patients from mild to severe impairment after stroke. There are many advantages to using resting-state methods in stroke patients that overcome limitations in task-based fMRI. 25 However, as with all BOLD-based functional imaging, there must be caution in interpreting differences between groups as reflecting neural activity as opposed to altered neurovascular coupling.
Conclusions
We show an association between daily physical activity and DAN function 3 months after stroke. Importantly, we also show a cognitive benefit to increased interhemispheric resting connectivity that suggests that modulation of attention networks by physical activity may have measurable clinical benefit. Increasing levels of daily physical activity may be a candidate intervention for improving attention functioning after stroke.
Footnotes
Authors’ Note
Toby Cumming and Amy Brodtmann are equal last authors.
Declaration of Conflicting Interests
The authors declared no potential conflicts of interest with respect to the research, authorship, and/or publication of this article.
Funding
The authors disclosed receipt of the following financial support for the research, authorship, and/or publication of this article: This work was supported by the National Health and Medical Research Council (APP1020526), the Sid and Fiona Myer Family Foundation, and the Mason Trust.