
Abstract
Background. The use of exercise in amyotrophic lateral sclerosis (ALS) is controversial. Although moderate exercise appears to be beneficial for limb muscles in ALS, the effects of exercise on bulbar muscles such as the tongue have not been studied. Objective. To determine the effects of tongue force training on bulbar motor function in the SOD1-G93A rat model of ALS. Methods. We compared the effects of tongue force training on bulbar motor function and neuromuscular junction innervation in female SOD1-G93A rats and age-matched female wild-type controls. Half of each group underwent afternoon tongue force training sessions, and all rats were tested under minimal force conditions in the mornings. Results. Tongue force did not differ between the SOD1-G93A rats and healthy controls during the morning testing sessions, nor was it affected by training. Surprisingly, decreases in tongue motility, the number of licks per session, and body weight were greater in the tongue force–trained SOD1-G93A rats. Forelimb grip force, survival, and denervation of the genioglossus (GG) muscle did not differ between the trained and untrained SOD1-G93A rats. GG innervation was correlated with changes in tongue force but not tongue motility in SOD1-G93A rats at end stage. Conclusions. The results indicate a potential deleterious effect of tongue force training on tongue motility in female SOD1-G93A rats. The lack of a relationship between GG innervation and tongue motility suggests that factors other than lower–motor neuron integrity likely accounted for this effect.
Introduction
Amyotrophic lateral sclerosis (ALS) is a devastating neurodegenerative disease that targets both lower and upper motor neurons in the brain and spinal cord. Initial symptoms of muscle weakness progress rapidly to paralysis and death, typically within 5 years of diagnosis. 1 Disease onset can occur in the arms or legs (spinal onset) or in muscles of the face (bulbar onset). There is no cure for ALS, and current treatments have a minimal effect on survival. Consequently, therapeutic interventions to maintain muscle strength are being sought. Exercise is an obvious candidate, but its use in ALS is controversial. Preclinical studies report that moderate exercise of limb muscles can delay disease onset and increase lifespan in animal models of ALS,2-4 whereas high-intensity exercise can hasten disease.2,5 Effects of exercise on bulbar muscles have not been studied.
The goal of the current study was to determine the effects of tongue force training on bulbar motor function in the SOD1-G93A rat model of ALS. Like human ALS, both lower and upper motor neurons are affected in SOD1-G93A rats. 6 Also, like the human disease, SOD1-G93A rats exhibit heterogeneity with regard to spinal and bulbar deficits. 7 We reported tongue motility deficits in this model 7 and found that these deficits are related to survival. 8 Because of the greater incidence of bulbar deficits in female rats, 9 we divided female SOD1-G93A rats and healthy wild-type littermate controls into a training group and a control group. All rats were tested for bulbar function as well as for forelimb grip force, body weight loss and survival (defined as the rat’s age on the day that it exhibited limb paralysis). Neuromuscular junction (NMJ) innervation was measured in genioglossus (GG; tongue protruder) muscles postmortem in SOD1-G93A rats.
Methods
Animals
Female SOD1-G93A rats (n = 12) and female wild-type littermates (n = 12) were used. Breeders were obtained from Taconic, and offspring were genotyped using the protocol described in the Jackson Laboratory website, Tg(SOD1) (https://www2.jax.org/protocolsdb/f?p=116:5:0::NO:5:P5_MASTER_PROTOCOL_ID,P5_JRS_CODE:9877,004435). Genomic DNA extracted from tail biopsies was amplified in a GeneAmp 2720 thermocycler (Applied Biosystems). The specific primers used for the transgene detection were the following: human SOD1 transgene: oIMR0113, CATCAGCCCTAATCCATCTGA, and oIMR0114, CGCGACTAACAATCAAAGTGA; internal positive control: oIMR7338, CTAGGCCACAGAATTGAAAGATCT, and oIMR7339, GTAGGTGGAAATTCTAGCATCATCC. We did not track estrus cycle. At 4 months of age, rats were gradually water restricted and placed into individual customized Gerbrands operant chambers as described below and in our recent studies.7,8 Testing began when rats were presymptomatic (body weight was still increasing) at 19 weeks of age and continued through late stage for each rat until a humane end point was reached. End point was defined as visible limb paralysis. Studies were approved by the local Institutional Animal Care and Use Committee and were conducted according to the Guide for the Care and Use of Laboratory Animals.
Tongue Motor Testing and Strength Training
Rats were placed in a modified rodent operant chamber that had a front panel containing a 6-cm square hole at floor level. Affixed to the square hole was a 6-cm cubic transparent enclosure that, on its lower horizontal surface, contained a 12-mm diameter hole through which the rat’s tongue extended down to reach the operandum. The operandum was an 18-mm diameter aluminum disc rigidly attached to the shaft of a Model 31 load cell (Sensotec, Columbus, OH) and was centered 2 mm beneath the hole in the plastic enclosure. A computer-controlled peristaltic pump (Series E; Manostat Corp, New York, NY), fitted with a solid-state relay (Digikey, Thief River Falls, MN) and controlled by a LabMaster computer interface (LabMaster, Solon, OH), delivered water to the center of the lick disk through a 0.5-mm diameter hole. The force transducer was capable of resolving force measurements to 0.2-g equivalent weights. A PC recorded the transducer’s force-time output sampled at 100 samples/s. Computer programs allow for customized force requirements and for the number of licks that are necessary to activate the pump.
Generally, rats learned quickly to lick water from the force-sensing disc during the initial 2-minute session. Each session started with a free 0.05-mL delivery of water. Rats were required to lick the water from the disc to register a required force for subsequent pump activation. For the initial training and daily testing sessions, the pump delivered 0.05 mL water for every 12 tongue contacts ≥1 g. Rats were exposed to the licking task under this minimal force requirement until they licked reliably (≥100 licks during the 2-minute session). On stabilization of baseline, rats in each group (SOD1-G93A and wild type) were divided into training and control groups. Groups were assigned so that training and control groups had similar means for measures of tongue motility and tongue force during baseline sessions at 19 weeks of age. Beginning at 20 weeks of age, rats in the training groups underwent afternoon training sessions. During these 6-minute sessions, rats in the training groups were required to produce 4 licks at ≥10 g to activate the dipper. In morning testing sessions, rats in both the training and control groups were tested under the minimal (≥1 g) force requirements for 2 minutes as in their initial baseline training sessions. Testing continued 5 d/wk throughout the rats’ presymptomatic and symptomatic stages. Representative waveforms from a testing and training session are shown in Figure 1.
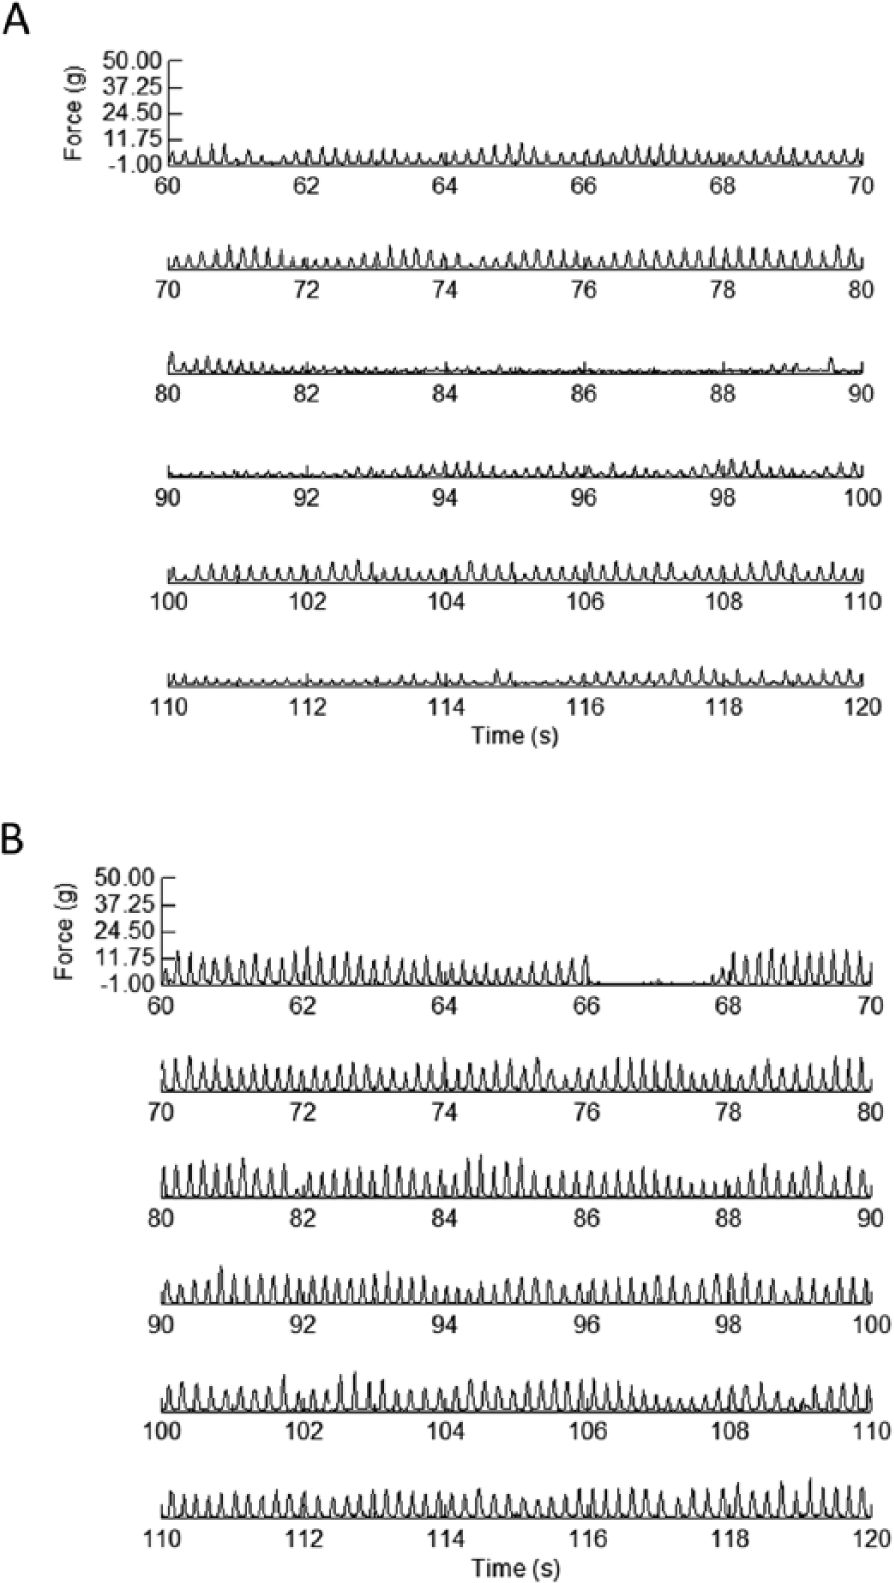
Force-time waveforms taken from an SOD1-G93A rat during an early testing (A) and training session (B). Each graph shows a 2-minute sample from a 6-minute session. The rat was 22 weeks of age. The waveforms demonstrate that the rat’s behavior was under control of the different force requirement contingencies of the 2 tasks.
Body Weight, Grip Force, and Survival Analysis
Each rat’s body weight was recorded 5 d/wk (prior to the morning testing sessions), and each rat’s forelimb grip force was tested using a rodent grip force monitor (San Diego Instruments) 2 d/wk. Individual rats were removed at the onset of limb paralysis (a humane end point), and the date was recorded for survival analysis. We verified limb paralysis by observing that a limb was not functional during a rat’s movement as we placed it on a table in different positions.
NMJ Innervation Analysis
On each SOD1-G93A rat’s terminal day, it was deeply anesthetized with sodium pentobarbital (50 mg/kg) and euthanized, and the GG muscle was removed. The muscle was fixed in 4% paraformaldehyde in phosphate-buffered saline (PBS) at room temperature for 1 hour, cryoprotected in 20% sucrose/PBS, and frozen in Optimal Cutting Temperature compound (Sakura). Cryostat sections were cut at a thickness of 20 µm and blocked in PBS containing 2% BSA, 2% normal goat serum, and 0.1% Triton. The denervation analysis methods have been described previously.7,10 In brief, oblique and horizontal cryostat sections of the GG muscle were stained with antibodies against nerves (neurofilament and SV2) and endplates (Alexa594-α-bungarotoxin to label acetylcholine receptors). Adult motor nerve terminals show perfect overlap with endplates, which shows innervated NMJs. Any nonoccupied areas of the endplates, whether in part (partial innervation) or in full (full denervation), were judged as denervated. Technical issues prohibited the identification of NMJs in the GG horizontal sections in 3 of the 12 SOD1-G93A rats (this still yielded between 41-128 NMJs per animal). We first calculated the percentage of fully innervated NMJs for both sections of the GG muscle and then calculated the means as the overall GG innervation rate. This provided 1 mean percentage innervation rate value from each of the SOD1-G93A rats.
Data Analysis
Bulbar motor function was measured through the following dependent variables: mean peak tongue force, the number of licks/s (tongue motility), and the number of licks per session (a measure of task engagement). For analysis of tongue force and licks/s, sessions were divided into contiguous segments of 10.24 s (2-minute testing sessions had 11 segments, and 6-minute training sessions had 35 segments). Mean peak tongue force was calculated as the mean of the peak forces across these segments. To quantify licks/s, we subjected the segments to a Matlab (The Math Works, Inc, Natick, MA) program that produced a power spectrum for each segment. Spectra were then truncated to 25 Hz and averaged. A peak-find program written in Free Pascal was used to identify the peak in the averaged power spectrum, and the frequency at this peak was identified as the licking frequency, or licks/s. The number of licks was the number of tongue contacts above 1 g during each session. Body weight was measured daily, and forelimb grip force was measured 2 d/wk. The median grip force for 3 trials for each testing day was used for data analysis. Each variable was averaged across each testing week for analysis. We first analyzed these variables across the first 8 weeks of testing using 2-way analysis of variance (ANOVA), with group (SOD1-G93A trained, SOD1-G93A untrained, wild-type trained, wild-type untrained) as between-subjects factor and week as repeated measures (SYSTAT). We used Tukey’s test to determine between-groups effects. Because of variability in the onset of limb paralysis across SOD1-G93A rats (and their removal from the study), the number of missing data points increased progressively over time, beginning with the 10th testing week. Therefore, for the primary outcome variables of bulbar function, body weight, and grip force, values for each dependent variable for each rat’s last 4 weeks of testing were expressed as a percentage of presymptomatic (weeks 22-24) baseline and aligned for analysis (ie, data for each rat’s last 4 weeks were aligned with data for the other rats’ last 4 weeks). This not only maintained statistical power, but also provided a more accurate and sensitive analysis of decline. These primary outcome measures were then analyzed using 2-way ANOVA with group (trained vs untrained) as between-subjects factors and testing week (last 4 weeks) as repeated-measures. For the primary outcome measures, we analyzed SOD1-G93A and wild-type groups separately because we have already reported the effects of disease progression in this model. 7 For secondary analyses, we compared the SOD1-G93A and wild-type rats’ bulbar function during the last 4 weeks of afternoon training sessions. To measure potential effects of fatigue on tongue function during the longer afternoon training sessions, we derived separate power spectra for the first and second halves of a 6-minute training session during week 27. This was the last week prior to the beginning of dropout for SOD1-G93A rats (we had to use data from week 26 for 1 SOD1-G93A rat in the training group). We quantified licks/s (as previously described) as well as the integrated power (ie, sum of all values) within the 3- to 7-Hz frequency band for each session half. We did not compare within-session changes in tongue force because of the presence of a “floor” (the 10 g force requirement). Kaplan-Meier curves (GraphPad Prism) were used to compare survival between the trained and untrained SOD1-G93A rats. Innervation of GG NMJs was compared between the trained and untrained SOD1-G93A rats using 1-way ANOVA. These values were then correlated with each SOD1-G93A rat’s final percentage change in peak force, tongue motility, and number of licks.
Results
There were no between-group differences in bulbar motor measures, body weight, or grip force during the first week of the morning testing sessions (see week 19 in Figures 2 and 3). During weeks 19 to 26, neither peak tongue force (Figure 2A) nor number of licks (Figure 2E) differed between groups during the morning testing sessions. There was an overall effect of time for both measures, however: both increased across these first 8 weeks (peak force: F = 4.696, P < .001; number of licks: F = 56.758, P < .001). There was a main effect for time for tongue motility (F = 2.091, P < .05) and a significant Group × Time interaction (F = 2.132, P = .005), likely as a result of the emerging onset of slower licking in the trained SOD1-G93A group during week 26 (Figure 2B).
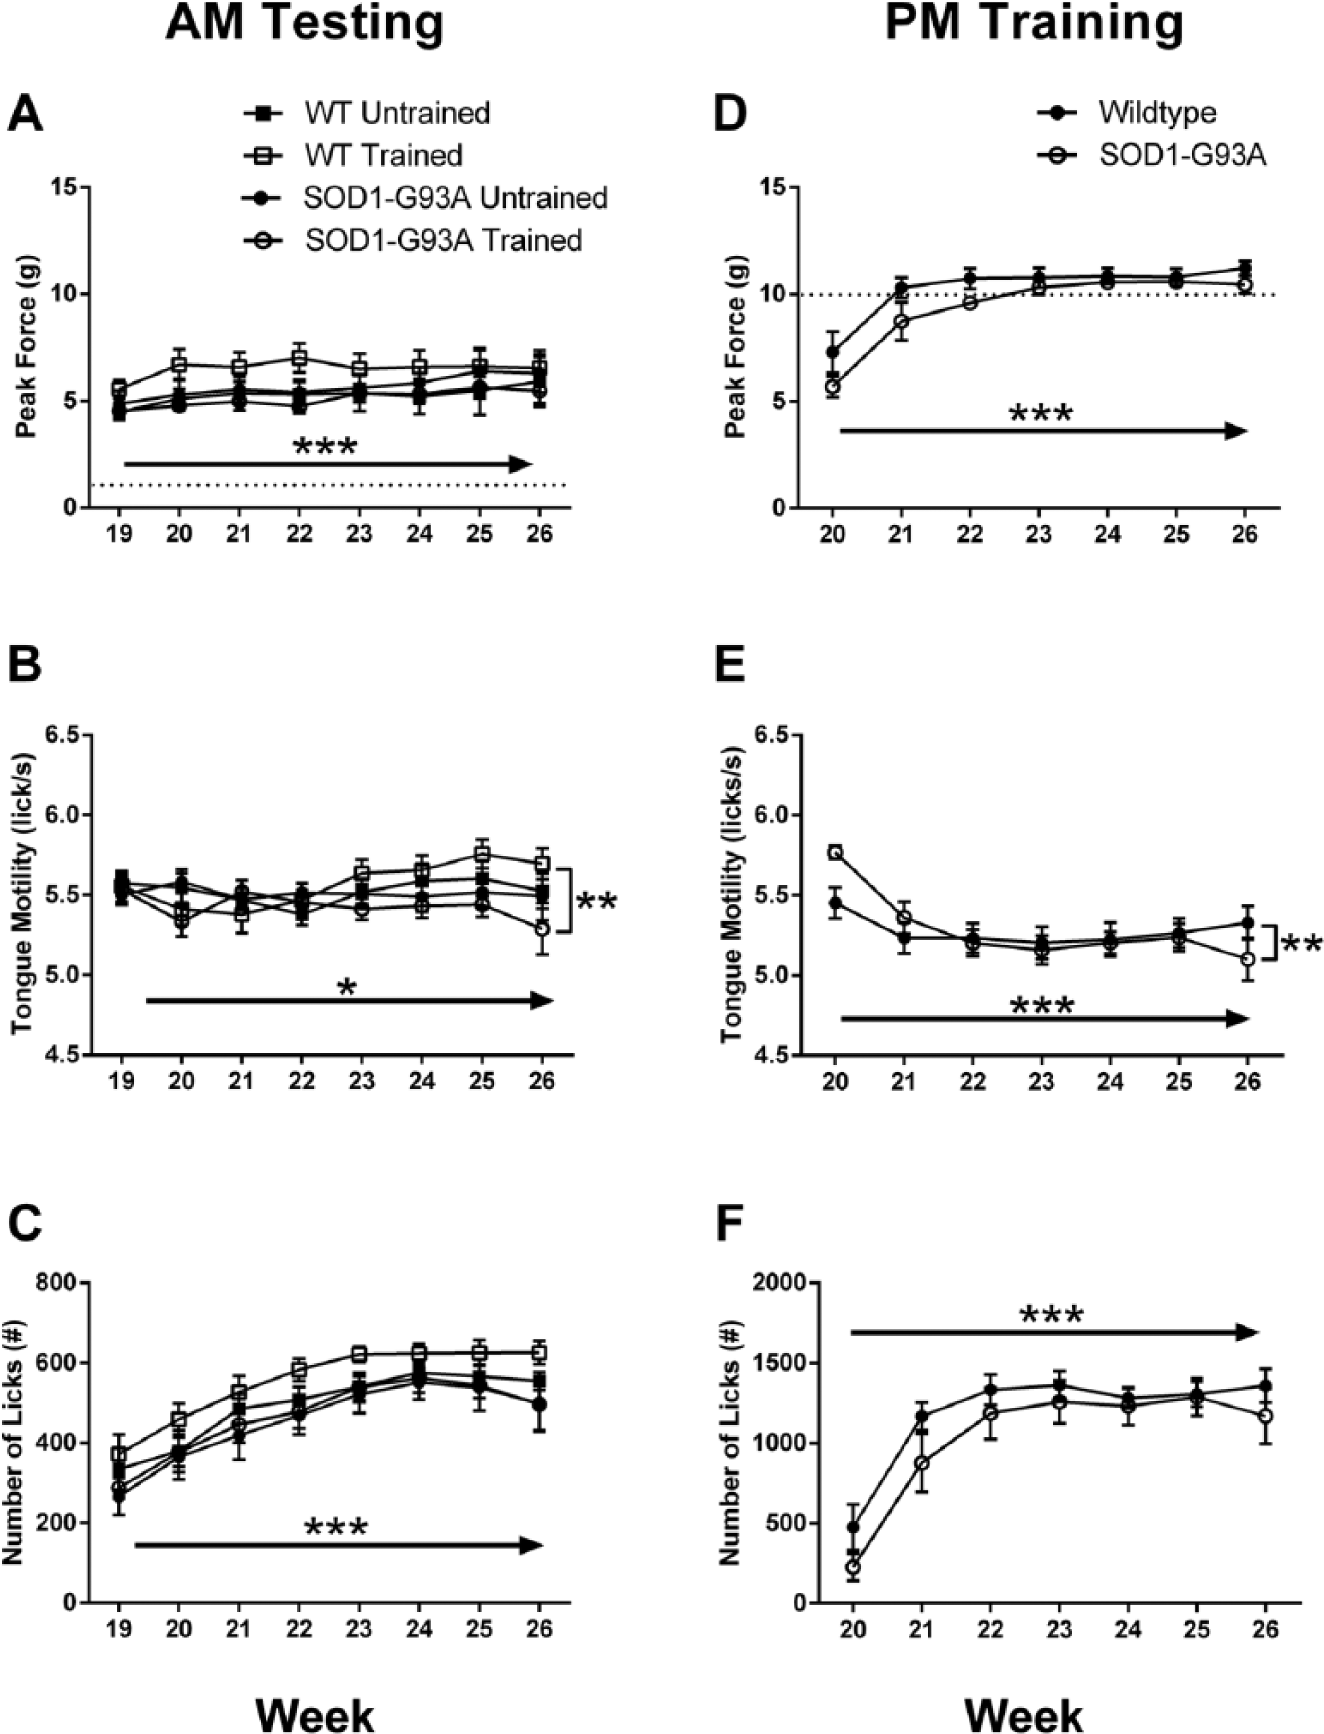
Measures of bulbar motor function during the initial weeks of morning testing (A-C) and afternoon training (D-F) sessions. Age in weeks is denoted on the abscissa. Week 19 was the week prior to the beginning of afternoon training sessions. Tongue forces increased slightly but significantly over time in all groups during testing sessions (A). Tongue motility increased in wild-type rats over time but began to decline in SOD1-G93A rats during the testing sessions (B). Number of licks also increased over time during the testing sessions (C). Rats in the training group successfully achieved the 10-g force requirement during the afternoon training sessions (D). As force requirements increased, tongue motility decreased initially during training sessions, with a further decrease with disease during week 26 in the SOD1-G93A rats (E). Number of licks increased with time during training sessions (F). Dashed lines in A and D indicate force requirement. Solid arrows indicate a significant main effect for time. Brackets placed at the final week indicate a significant Group × Time interaction. *P < .05; **P < .01; ***P < .001.
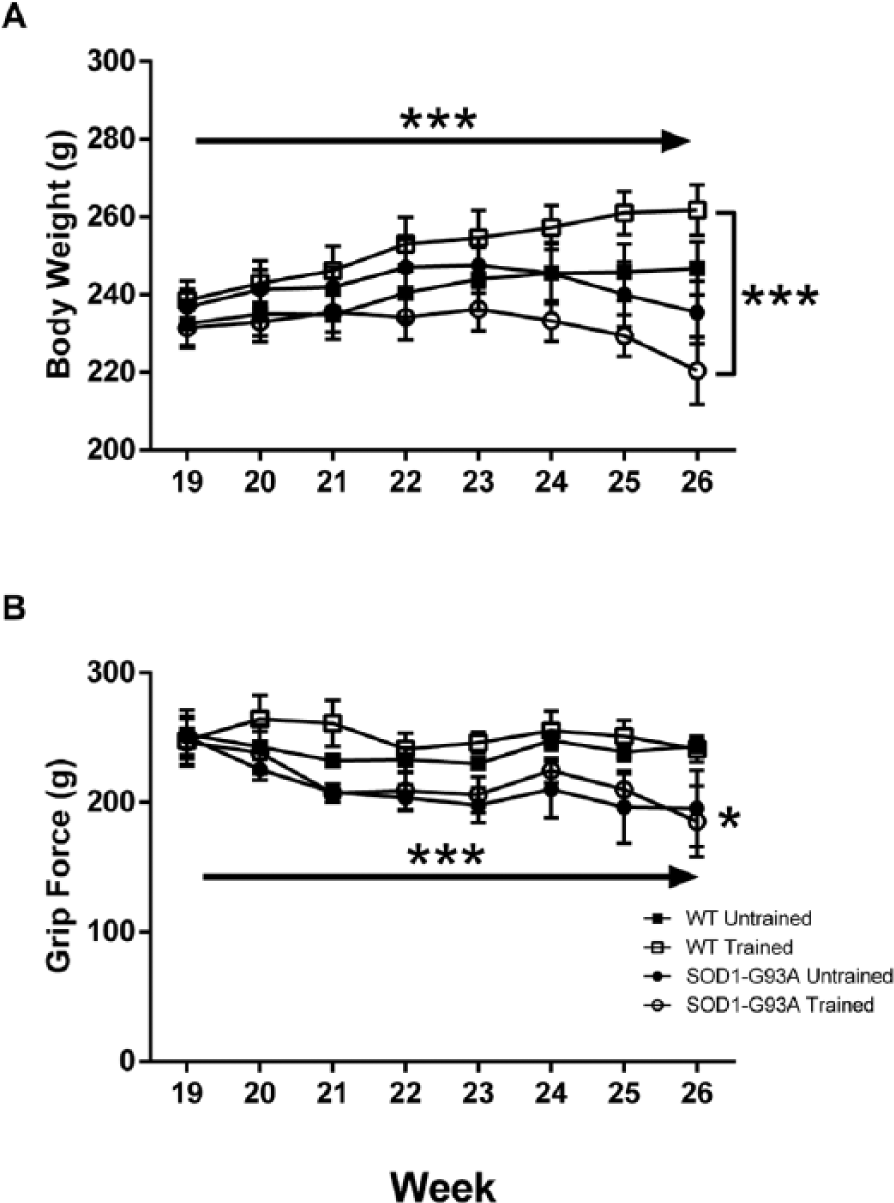
Body weight (A) and forelimb grip force (B) as a function of group and time. Age in weeks is denoted on the abscissa. Body weight increased in both groups initially, but peaked in the SOD1-G93A rats in week 23. Forelimb grip force deficits decreased slightly but significantly in both groups over time. The single asterisk indicates a main effect for group. Solid arrows indicate a significant main effect for time. Brackets placed at the final week indicate a significant Group × Time interaction. *P < .05; ***P < .001.
Rats in the training group quickly adapted to the increased force requirement, as indicated in Figure 2D. This led to a significant main effect for time on peak tongue force (F = 46.821; P < .001). During the higher-force training sessions, there was a significant main effect for time on tongue motility (F = 10.465; P < .001; Figure 2E). This was a result of the effect of a higher force requirement on licking speed in both groups. There was also a significant Group × Time interaction on tongue motility during the training sessions (F = 4.288; P = .001) because of the faster licking speed during week 20 and slower licking speed during week 26 in the SOD1-G93A group. With time, the number of licks/session increased in both groups during the training sessions (F = 31.174; P < .001; Figure 2F).
The first indications of disease in the SOD1-G93A rats were decreased body weight and grip force (Figure 3). Whereas body weight gradually increased in both wild-type groups, the measure peaked in the SOD1-G93A rats at 23 weeks of age. Body weight then gradually decreased in both the trained and untrained SOD1-G93A rats (Figure 3A). These effects led to a significant main effect of time on body weight (F = 10.259; P < .001) and a significant Group × Time interaction (F = 5.442; P < .001).There was a significant main effect for group on grip force during weeks 19 to 26 (F = 5678; P < .05) because this measure was lower in the SOD1-G93A rats as early as 21 weeks of age. Grip force declined in all 4 groups across initial testing, leading to a significant main effect for time on the measure (F = 5.084; P < .001; Figure 3B).
Tongue force during the testing sessions was not affected in the SOD1-G93A rats during their last 4 weeks of testing (Figure 4A). Tongue motility declined in the SOD1-G93A rats during the last 4 weeks, leading to a significant main effect for time (F = 8.713; P < .001; Figure 4B). This decrease was greater in the trained SOD1-G93A rats, leading to a significant Group × Time interaction (F = 3.058; P < .05). A similar effect was measured for the number of licks. This measure decreased in both SOD1-G93A groups, leading to a significant main effect for time (F = 10.320; P < .001). The decrease in number of licks was greater in the trained SOD1-G93A group, leading to a significant Group × Time interaction (F = 5.348; P < .001; Figure 4C). The only statistically significant effects within the wild-type rats during the last 4 weeks were main effects of time for tongue motility (F = 3.807; P < .05) and number of licks (F = 3.225; P < .05). Polynomial tests of order revealed that both effects were the result of a quadratic effect of time within the last 4 weeks because both measures declined slightly over time and then increased during the final week (data not shown).
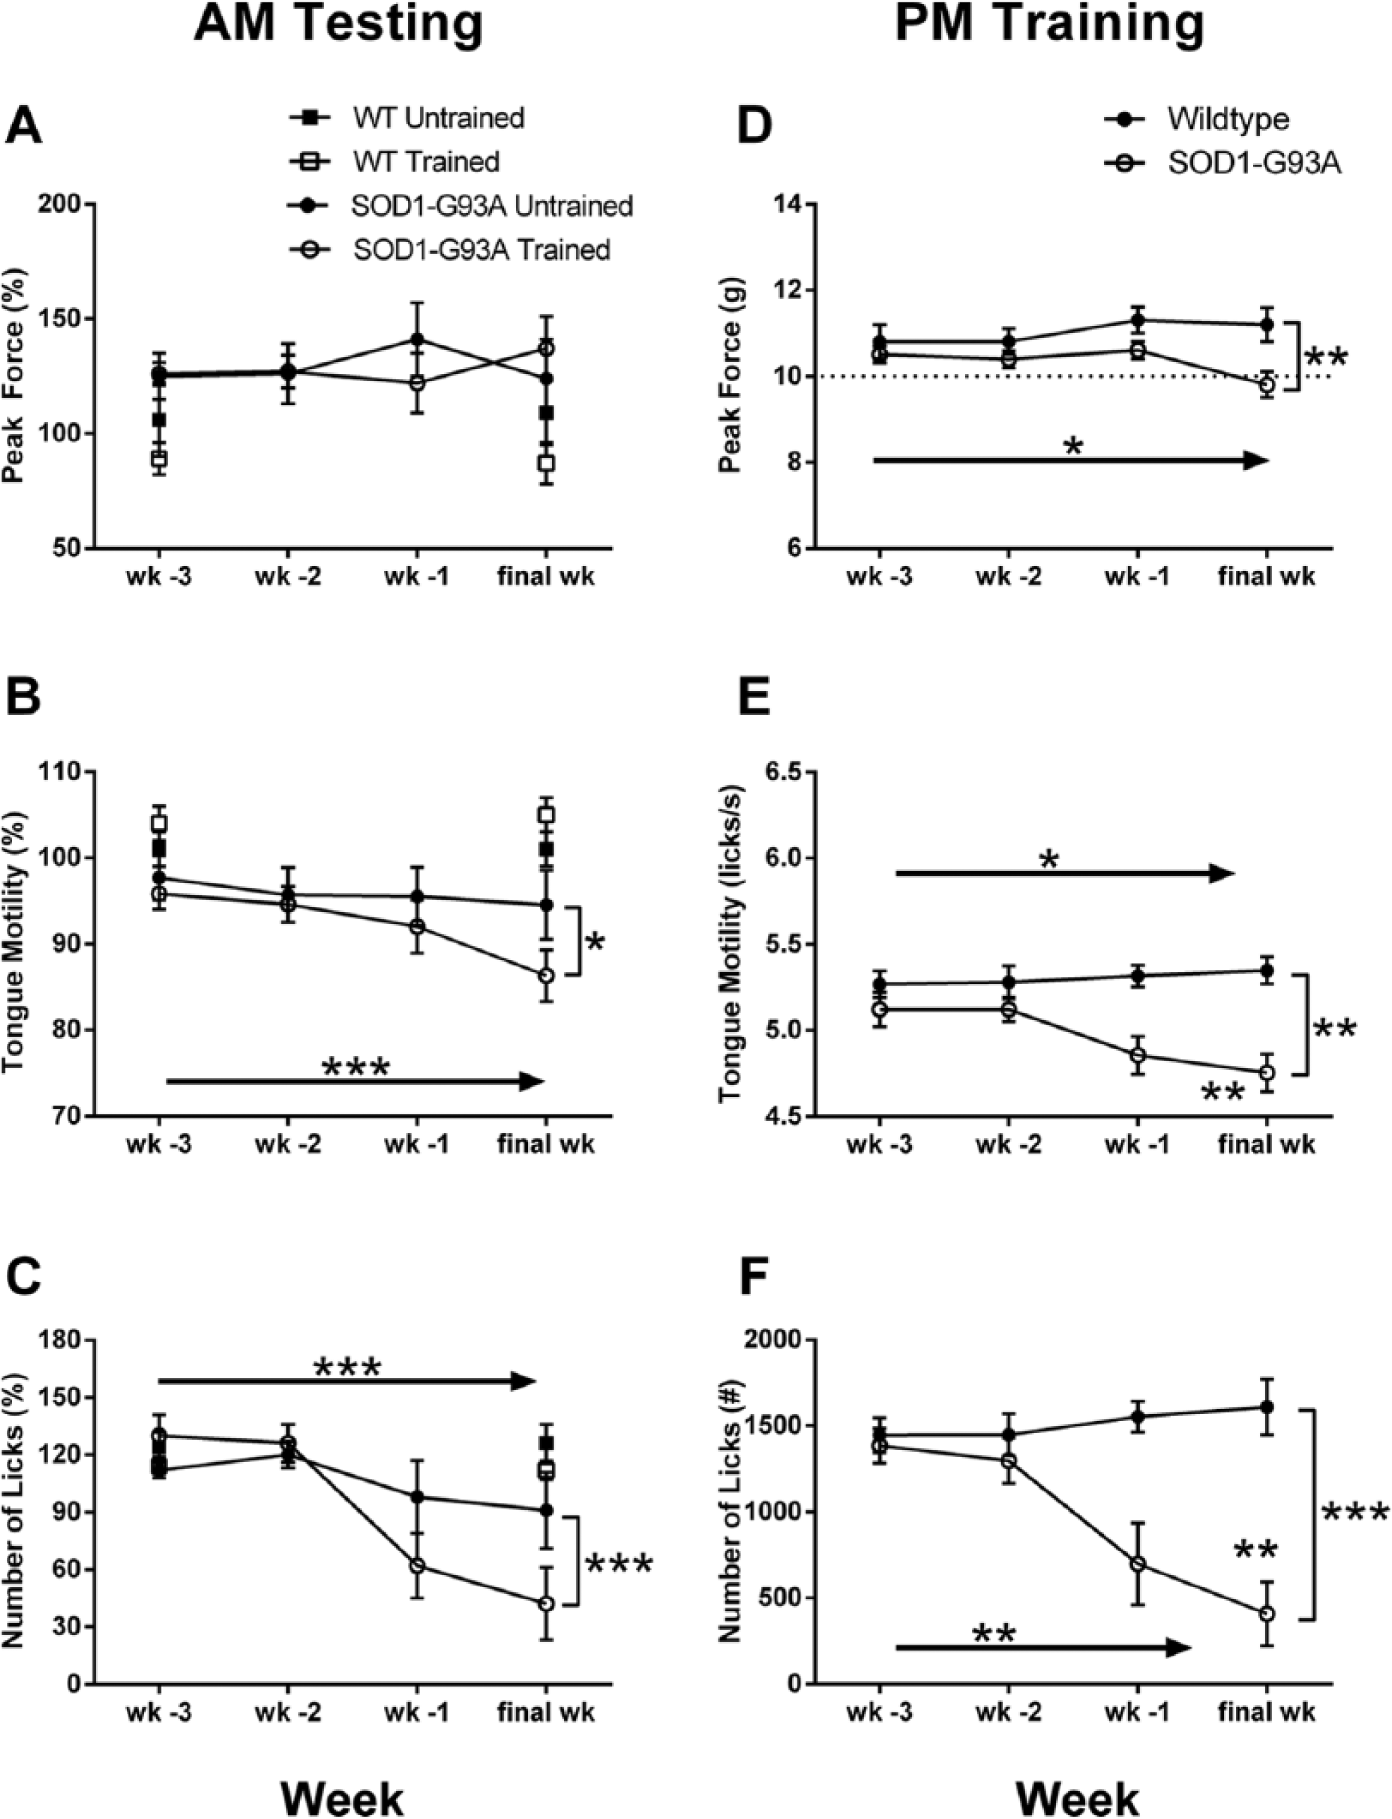
Measures of bulbar function during morning testing (A-C) and afternoon training (D-F) sessions for the last 4 weeks of testing. Week of testing (wk-3, wk-2, wk-1, and final wk) is denoted on the abscissa. For clarity, only values for week 3 and the final week of testing are provided for the wild-type (WT) groups. There were no significant effects of time or group on peak force during the testing sessions (A). Tongue motility declined in both SOD1-G93A groups across the last 4 weeks, with a greater decline in the training group (B). The number of licks/session declined in both SOD1-G93A groups across the last 4 weeks, with a greater decline in the training group (C). During the afternoon training sessions, there was a significant main effect of week and a significant Group × Week interaction on peak force (D), tongue motility (E), and number of licks (F) as all measures declined in the SOD1-G93A rats (raw data shown for clarity). Solid arrows indicate a significant main effect for time. Brackets placed at the final week indicate a significant Group × Time interaction. *P < .05; **P < .01; ***P < .001.
During their last 4 weeks, SOD1-G93A rats exhibited a decline in tongue force during the higher-force training sessions (Figure 4D). This led to a significant main effect for time (F = 3.183; P < .05) and a significant Group × Time interaction (F = 5.497; P < .01). Consistent with the testing sessions, tongue motility during the training sessions declined significantly in the SOD1-G93A rats during the last 4 weeks (Figure 4E). This led to a significant main effect for group (F = 17.280; P < .01), a significant main effect for time (F = 3.658; P < .05), and a significant Group × Time interaction (F = 7.838; P = .001). The number of licks also declined significantly in the SOD1-G93A rats during the training sessions during their last 4 weeks (Figure 4F). This led to a significant main effect for group (F = 42.131; P < .01), a significant main effect for time (F = 6.126; P < .01), and a significant Group × Time interaction (F = 11.375; P < .001).
To measure within-session fatigue during the more demanding training sessions, we compared power spectra between the first and second halves of sessions during week 27 (Supplemental Figure 1). At this time point, the tongue motility of SOD1-G93A rats was decreased compared with that of wild-type rats (F = 8.362; P < .05). There was a clear within-session decrease in the integrated power within the 3- to 7-Hz frequency band for both groups (F = 45.065; P < .001). This effect was a result of less vigorous licking and did not differ between the SOD1-G93A and wild-type rats. Despite this effect, tongue motility did not decrease between the first and second halves of the session for either group (F = 0.055; P = .82).
During the last 4 weeks, body weight declined significantly in the SOD1-G93A rats, leading to a significant main effect for time (F = 74.504; P < .001; Figure 5A). This decline was modestly but significantly greater in the trained SOD1-G93A rats, leading to a significant Group × Time interaction (F = 4.501; P = .01). Grip force also declined significantly in both SOD1-G93A rats, leading to a main effect of time (F = 6.299; P < .01; Figure 5B). This effect did not differ between the trained and untrained SOD1-G93A rats.
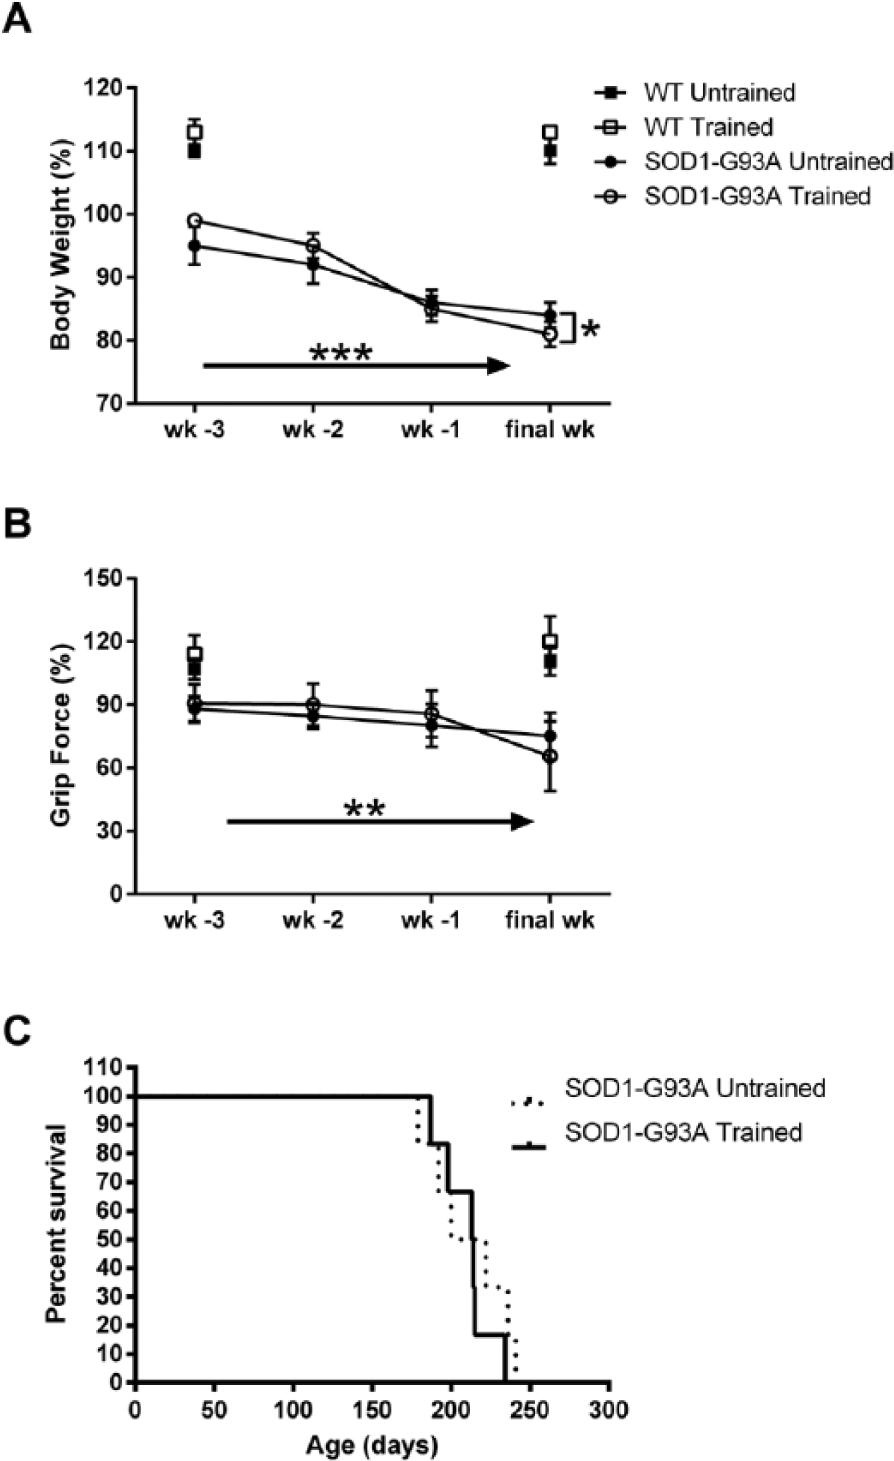
Body weight (A) and forelimb grip force (B) as a function of group and time for the last 4 weeks of testing. Week of testing (wk-3, wk-2, wk-1, and final wk) is denoted on the abscissa. Body weight declined significantly in the SOD1-G93A rats, but the decline was significantly greater in the trained group. Grip force also declined significantly over time in the SOD1-G93A rats. (C) Survival did not differ between the trained and untrained SOD1-G93A rats. Solid arrows indicate a significant main effect for time. Brackets placed at the final week indicate a significant Group × Time interaction. *P < .05; **P < .01, ***P < .001.
Survival did not differ between the trained and untrained SOD1-G93A rats (Figure 5C). We divided SOD1-G93A rats into groups based on those that exhibited decreased licking speed (<90% baseline at end stage; n = 6) and those that did not (n = 6). The numbers did not differ between the trained and untrained groups (n = 6/group; χ2 = 0, P = 1.0). When we examined NMJ innervation in the GG (Figure 6A), we found that both the trained and untrained SOD1-G93A rats exhibited similar levels of NMJ innervation (40% ± 7% trained vs 44% ± 7% untrained). Surprisingly, correlation analyses revealed a statistically significant negative correlation between GG NMJ innervation and end-stage tongue force (r = −0.74; P < .01) but not tongue motility (r = 0.09, P = .79; Figure 6B) or number of licks (r = 0.07, P = .83; not shown).
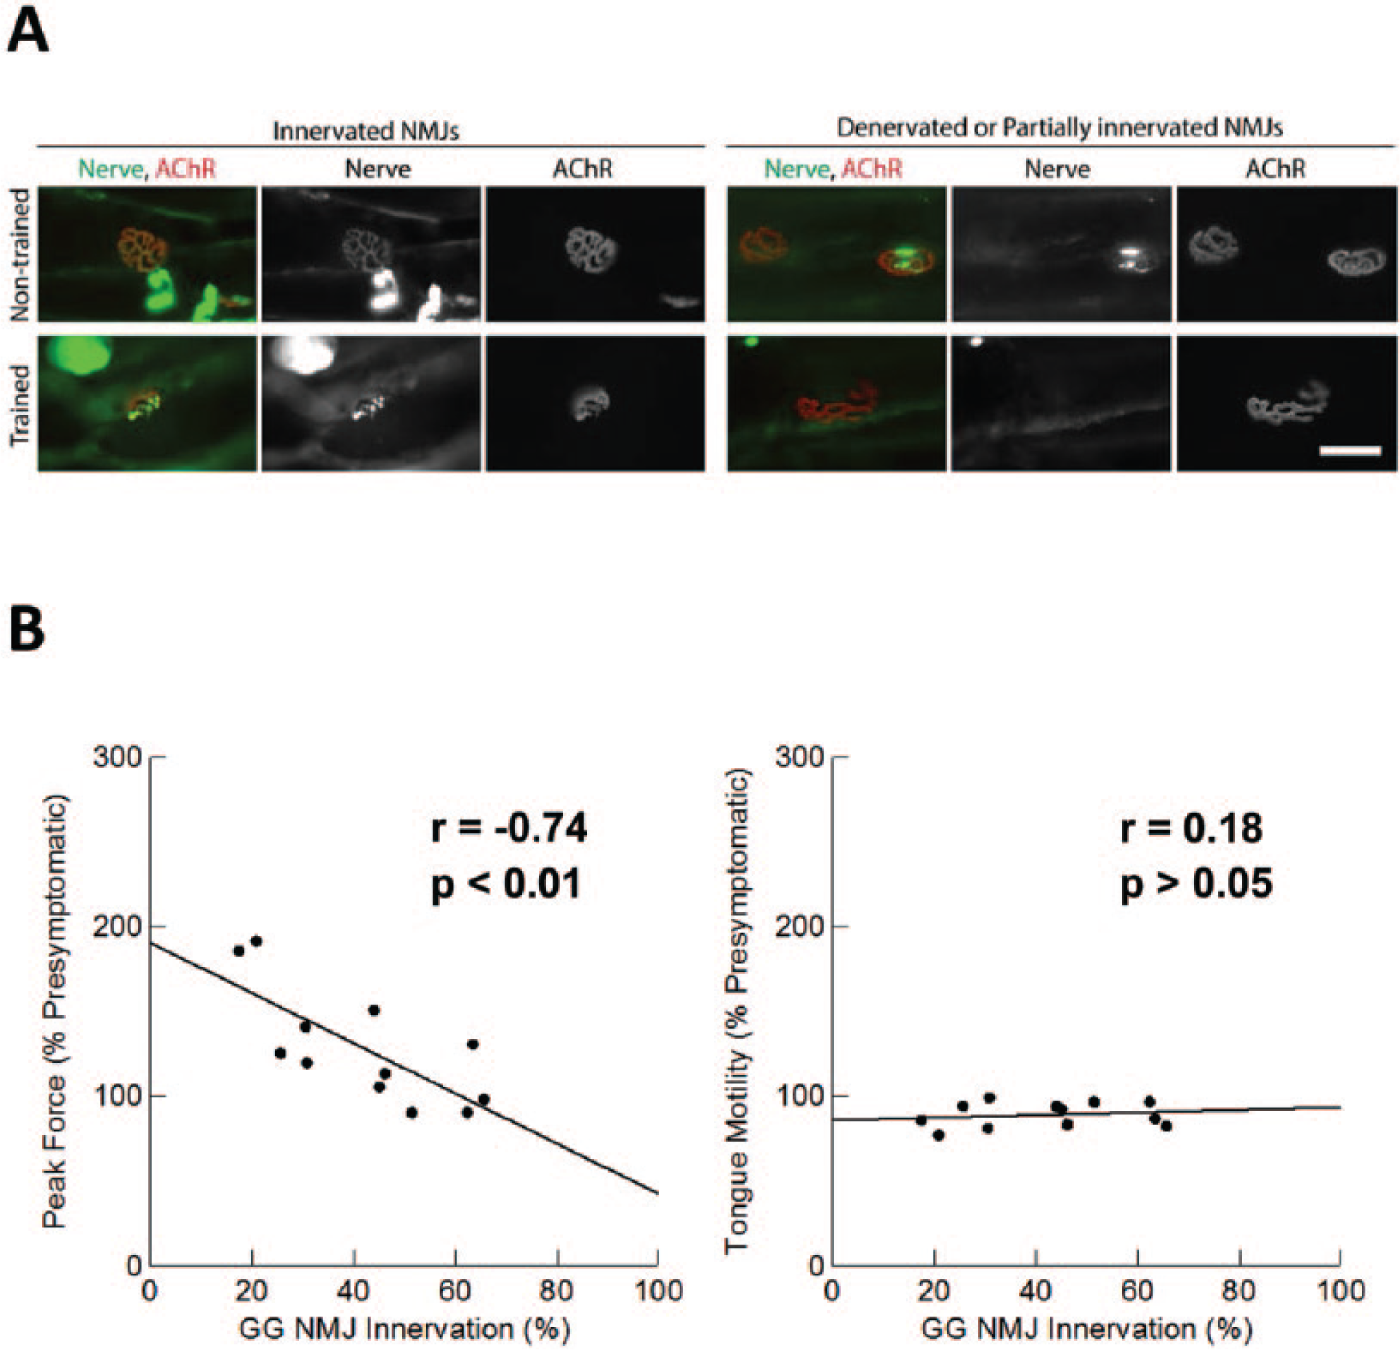
Tongue force training did not affect neuromuscular junction (NMJ) denervation. (A) Representative NMJs from genioglossus (GG; tongue protruder) muscles from untrained and trained SOD1-G93A rats. NMJs were detected using antibodies against neurofilament and SV2 (nerve; green) and α-bungarotoxin (acetylcholine receptors [AChR]; red). Overlap of the nerve and receptor cluster indicates NMJ innervation. Scale bar: 50 µm. Innervation rate did not differ between the trained and nontrained SOD1G93A rats (P = .6633, data not shown). (B) Scatterplots showing relationships between NMJ innervation and peak tongue force and tongue motility for SOD1-G93A rats during their final testing sessions. There was a negative correlation between GG NMJ innervation and peak tongue force. Tongue motility did not correlate with GG NMJ innervation, nor did the number of licks (data not shown).
Discussion
In the current study, we found that a tongue force training regimen resulted in greater declines in tongue motility, task engagement, and body weight in female SOD1-G93A rat model of ALS. Training did not affect tongue force output, nor did denervation of the GG muscle differ between the trained and untrained SOD1-G93A rats. Despite their greater tongue motility deficits, rats in the tongue force training group did not exhibit differences in grip force deficits or survival compared with the untrained group.
The lack of tongue force deficits in SOD1-G93A rats under the minimal force conditions in this study was consistent with our previous work. 7 Although this finding is consistent with previous work reporting a sparing of hypoglossal motor neurons in end-stage SOD1-G93A rats, 11 our finding of an emerging difference between tongue force between the affected and healthy rats during the higher force training sessions was novel. This modest but significant difference in tongue force during the training sessions during the last week of testing was consistent with our finding of GG denervation in the SOD1-G93A rats. It is also consistent with a recent report of modest but significant hypoglossal motor neuron loss and tongue muscle NMJ denervation in SOD1-G93A rats. 12 It is possible that differences in lifespan caused by genetic drift accounted for the disparity between reported findings of NMJ denervation and hypoglossal motor neuron loss in SOD1-G93A rats. The SOD1-G93A rats in our study and in the Kashlan et al 12 study reached end stage later (~30 and 27 weeks, respectively) than those in the Llado et al 11 study (18 weeks). It is possible that tongue muscle denervation and tongue force deficits are relatively late-stage phenomena in this model, requiring longer-lived SOD1-G93A rats. It also demonstrates that a force challenge may be necessary to reveal differences in bulbar muscle force production in this model.
Despite the lack of decline in tongue force under minimal conditions, our finding that GG NMJ innervation was correlated with tongue force but not tongue motility in the SOD1-G93A group supports a relationship between force production and NMJ integrity. The negative correlation between NMJ innervation and tongue force was surprising, however. One possible explanation is that water licking in SOD1-G93A rats with greater NMJ innervation was more efficient, leading to more tongue contact with water and less contact with the force disc. The fact that the percentage of presymptomatic values increased for peak force in both SOD1-G93A groups compared with wild-type rats supports this hypothesis. It is also possible that surviving motor neurons were producing greater force generally in SOD1-G93A rats, with fewer innervated NMJs. These hypotheses are speculative, however, and need to be explored further.
We have reported tongue motility deficits in both the SOD1-G93A mouse and rat models of ALS.7,8,13 Our finding that these deficits were exacerbated by tongue force training was surprising. GG denervation did not differ between the trained and untrained SOD1-G93A rats. The lack of within-session decreases in tongue motility during the more demanding afternoon training sessions and the fact that the short testing sessions occurred in the mornings after an overnight rest argue against an explanation involving greater fatigue in SOD1-G93A rats in the training group. Although we did not measure cortical motor neuron integrity, it may be that the greater tongue motility deficits in the trained SOD1-G93A rats were an indication of corticobulbar dysfunction. Muscle weakness, atrophy, and hyporeflexia are signs of lower motor neuron involvement, whereas speed of repetitive voluntary movements reflects upper motor neuron integrity.14,15 Recent studies have reported abnormalities in cortical motor neurons in SOD1-G93A mice and rats.6,16-18 We reported that tongue force training increases excitability of oromotor cortical regions in healthy rats. 19 Glutamate regulation is impaired in animal models of ALS as well as in both familial and sporadic forms of human ALS.20-23 Glutamate is cleared from the synaptic cleft in motor neurons primarily via glial excitatory amino acid transporter 2 (EAAT2; GLT-1 in rodents). Depletion of EAAT2/GLT-1 causes neuronal death. 24 SOD1-G85R mice and SOD1-G93A rats exhibit decreased levels of GLT-1 in the spinal cord,25,26 and SOD1-G93A mice exhibit increased glutamate levels in the cortex. 27 It may be that increased excitability resulting from tongue force training increased glutamate excitotoxicity in motor neurons that were already vulnerable because of these existing deficits.
Modulation of excitatory activity via GABA-ergic interneurons in the motor cortex may also play a role in impaired glutamate regulation. Increasing blood lactate, through exercise or intravenous infusion, increases motor cortical excitability. 28 Exercise-induced increases in blood lactate result in greater cortical excitability in female volunteers than in male volunteers. 29 Estrogen receptors (the β isoform) are coexpressed with GABA-ergic inhibitory neurons in the motor cortex, where they are believed to modulate inhibitory tone.30,31 Although speculative, these findings suggest that the effects of tongue force training on tongue motility might not extend to male SOD1-G93A rats. Further studies examining cortical motor neurons after training in male and female SOD1-G93A rats are necessary to test these hypotheses.
We previously reported heterogeneity with regard to tongue motility deficits in SOD1-G93A rats. 8 Despite exacerbating these deficits, our tongue force training regimen did not influence their presence in the SOD1-G93A rats in the current study (ie, the number of rats exhibiting bulbar deficits did not differ between the trained and untrained groups). This is interesting because it suggests that whereas focal strength training of a cranial muscle during the presymptomatic phase does not produce a bulbar phenotype, it can exacerbate the phenotype. The effects of exercise on spinal motor function and survival in ALS differ depending on intensity.2-5 Based on our previous studies requiring middle-aged and aged Sprague-Dawley rats to lick at forces of 30 g,10,19 we believe that the 10-g force requirement was low intensity. Further studies using a range of force requirements are necessary to determine whether cranial motor function likewise differs according to the intensity of bulbar exercise intensity.
Conclusions/Implications
Overall, our findings suggest that tongue force training may result in detrimental effects on some measures of bulbar function, at least under the conditions in this study. They also suggest that neuromuscular denervation of the tongue muscles does not contribute to these detrimental effects. Although the decline in tongue motility appears modest, ingestive licking in rodents is a highly stereotyped behavior that must be coordinated with mastication, swallowing, and respiration.32,33 It is not surprising that licking rate is more resistant to modification than other voluntary motor behaviors. 34 Given the number of brainstem neurons that exhibit both licking- and swallowing-related activity, 33 an important next step is to determine the relationship between slowed licking and oropharyngeal dysphagia. Future studies should also test the hypothesis that tongue force training increases motor cortical excitability, exacerbating disease processes in cortical motor neurons in ALS.
Footnotes
Acknowledgements
We thank Tomohiro Tanaka for technical assistance.
Declaration of Conflicting Interests
The authors declared no potential conflicts of interest with respect to the research, authorship, and/or publication of this article.
Funding
The authors disclosed receipt of the following financial support for the research, authorship, and/or publication of this article: This work was supported by NIH grants GM103418, NS078214, and HD02528.