
Abstract
Background. Upper limb (UL) poststroke hemiparesis commonly leads to chronic disability. Despite moderate-to-good clinical recovery, many patients with UL hemiparesis still do not fully use their arm in daily tasks. Decreased arm use may be related to deficits in performance of more complex movement than what is usually assessed clinically. Objective. To identify differences between poststroke and nondisabled control subjects in making complex corrective movements to avoid an obstacle in the reaching path. Methods. Subjects rapidly reached for a juice bottle on a refrigerator shelf with their hemiparetic or dominant (controls) arm viewed in a large-screen projected 3D virtual environment. In random trials, a sliding door partially obstructed the reaching path. A successful trial was one in which subjects touched the bottle without their arm or hand hitting the door. Results. Fewer participants with stroke (12%) were successful at a 65% success rate in avoiding the door compared to controls (42%). Subjects with stroke also initiated corrections later (further) in the reaching path (100.7 ± 77.6 mm) compared to controls (51.6 ± 31.0 mm) resulting in a reduced margin of error. While both groups used similar endpoint movement strategies for obstructed reaching, subjects with stroke used less elbow and more trunk movement. Participants who reported being more confident using their hemiparetic arm had higher success rates. Conclusion. Arm movement deficits can be identified when complex tasks are evaluated. Deficits in higher-order motor function such as obstacle avoidance behavior may decrease actual arm use in individuals with mild-to-moderate hemiparesis and should be evaluated in routine clinical practice.
Keywords
Introduction
Up to 75% of people with stroke have persistent upper limb (UL) sensorimotor deficits.1,2 Although UL interventions improve motor outcomes, 3 evidence for transfer of clinical UL improvements to activities of daily living is lacking. Even though patients may score highly on clinical tests, they do not fully use their UL in daily activities.4-6 For example, daily use of the less-affected UL, monitored with accelerometers, was 3 times greater than the more-affected UL. 6 Although not studied directly, decreased arm use may be related to diminished self-efficacy. For example, perceived success (self-efficacy) in reaching targets in a 2-dimensional center-out array was lower for the more-affected arm compared to the less-affected arm in stroke. 7
Delineating key reasons for poor carryover of improved UL function to real-world activities is thus of interest to clinicians and researchers. Real-world activities often occur in complex and unpredictable environments and involve cognitive and motor skills such as movement selection and dexterity. UL dexterity, an element of higher-order motor control strategies such as error correction or obstacle avoidance (ObsAv), has been extensively studied, 8 but not routinely considered when characterizing motor recovery. Higher-order motor control concerns the processes by which the nervous system selects and controls appropriate goal-directed motor actions for highly skilled tasks. 9 For example, UL ObsAv tasks involve adapting movement trajectories in sometimes unpredictable environments and include inhibiting and switching plans when unexpected obstacles arise.10,11 In nondisabled subjects, reaching trajectories during ObsAv are characterized by minimal margins of error between the hand and the obstacle,12-14 which depend on how different UL degrees-of-freedom are combined. 15 In these subjects, a large number of joint combinations are possible due to kinematic abundance.8,16 After stroke, however, complex coordination of UL and trunk movements is diminished.17-19 For example, during trunk-assisted reaching, individuals with mild-to-moderate stroke had deficits coordinating arm and trunk movements and could not rapidly adapt shoulder and elbow coordination to compensate for sudden trunk arrests. 19 Although deficits have been identified in arm-trunk and interjoint coordination during simple reaching tasks after stroke, skilled UL motor behavior such as error correction and ObsAv strategies have not been described nor related to decreased arm use.
The present study objectives were to identify higher-order motor control deficits underlying skilled UL motor behavior not measured by current clinical scales and to ascertain the relationship between these deficits and arm use. We characterized differences between poststroke and nondisabled controls in an UL ObsAv task and related task success to clinical UL motor scores.
We hypothesized that (1) stroke subjects with moderate-to-good UL recovery would have less success in rapidly correcting endpoint movement during a 3D reaching ObsAv task compared to controls; (2) decreased success would be related to altered UL endpoint and joint kinematics compared to controls; and (3) decreased success would be related to lower clinical scores, patient-reported arm use, and self-efficacy. Preliminary results have appeared in abstract form. 20
Methods
Subjects
A convenience sample of 17 poststroke individuals with moderate-to-good UL sensorimotor recovery and 12 nondisabled controls participated (stroke = 62.7 ± 9.3 years, controls = 60.8 ± 8.1 years). Poststroke individuals had a single hemisphere ischemic or hemorrhagic clinical stroke event at least 3 months previously and ≥5/7 on the Chedoke-McMaster Arm Stroke Assessment. 21 Since the task involved precision reaching likely affected by arm dominance, only subjects with dominant hemisphere stroke were included based on the Edinburgh Handedness Inventory. 22 Stroke subjects were excluded if they had visuospatial neglect (Line Bisection Test), 23 marked cognitive deficits (<22/30 on Montreal Cognitive Assessment), 24 marked sensory deficits (<9/12 on Fugl-Meyer sensory scale), 25 marked spasticity (>7/16 on Composite Spasticity Index), 26 >10° joint contracture, depression (>10/15 on Geriatric Depression Scale), 27 and for both groups, orthopedic or other neurological conditions affecting the UL or trunk. Participants signed consent forms approved by local ethics committees.
Clinical Evaluation
For stroke subjects, clinical evaluations quantified impairments, activity limitations, and participation restrictions according to the International Classification of Functioning. 28 At the Body Function level, Fugl-Meyer Upper Limb Motor Assessment (FMA) assessed UL impairment (reflexes, voluntary movement, coordination; 0-66 scale). 25 Activity limitations were assessed with Box and Blocks Test (BBT) 29 and Streamlined Wolf Motor Function Test (sWMFT). 30 BBT measured gross manual dexterity of the more-affected hand compared to the less-affected hand (% difference). sWMFT evaluated time (max 120 seconds/task) and quality (0-30 scale) to perform 6 UL tasks. Participation restrictions were assessed with Motor Activity Log (MAL) 31 as amount of use (MAL-AOU, 0-5 scale) and quality of movement (MAL-QOM, 0-5 scale) for 30 UL activities. A self-efficacy scale based on MAL (MAL-SES, 0-10 scale) identified confidence in task completion.
Experimental Setup
Subjects sat on a chair without armrests, 1 m in front of a 2 m × 1.5 m screen (Figure 1A). Arm initial position was standardized by placing the third fingertip on a support at seat height with 30° elbow flexion, where full elbow extension was 180°.
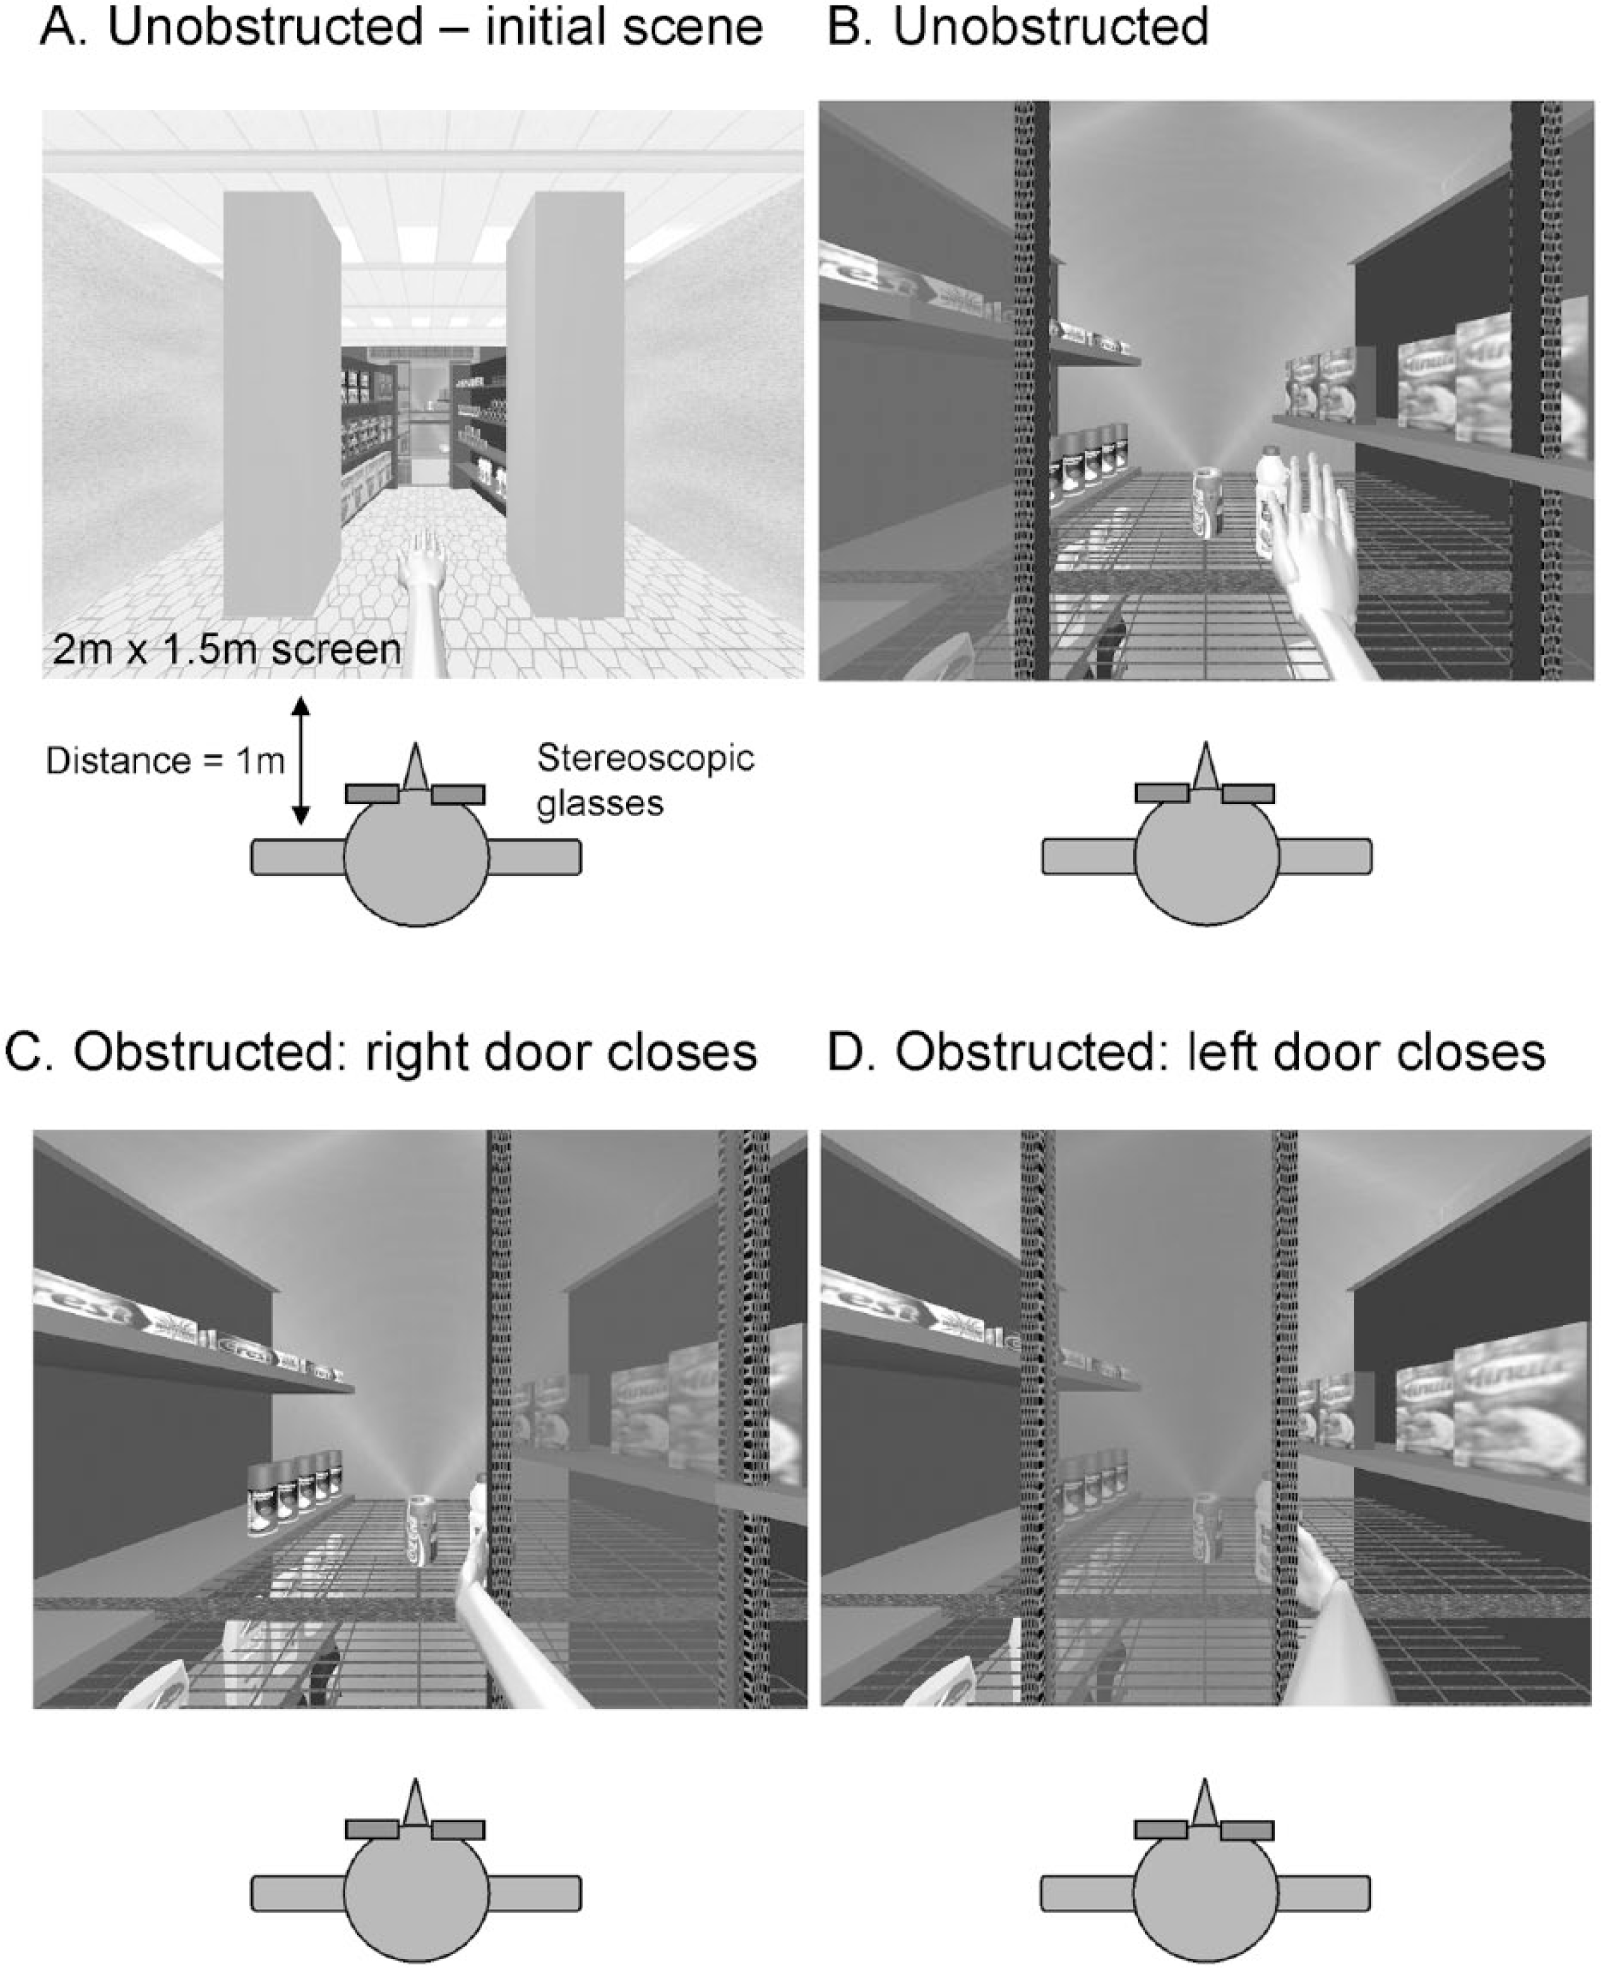
Schematic diagrams of the obstacle avoidance task. Participants sat 1 m in front of a 2 × 1.5 m screen wearing stereoscopic glasses. The virtual scene depicted bottles on a shelf in a refrigerator with double sliding doors. Participants reached as quickly as possible without touching the door. (A) Initial context generating scene. (B) Reaching for the bottle with no door obstruction. (C, D) In random trials, when subjects began to reach forward, the right (C) or left (D) door began to close and obstructed a straight line path to the bottle.
A 3D virtual environment (3DVE; CAREN2, Motek BV, Amsterdam, the Netherlands) consisted of a reaching task rear-projected on the screen and viewed through stereoscopic glasses. Subjects visualized a forearm and hand avatar and an object (5 cm diameter juice bottle) on a refrigerator shelf behind double sliding doors (Figure 1B). The bottle was located at 90% arm length in the midsagittal plane. Aside from other visual cues (binocular disparity, convergence angle), 2 flanking objects (cans) were located behind the bottle to enhance 3D perspective and restrict hand trajectory. 32 UL 3D kinematics controlled avatar movements in real-time (delay ~12 ms), allowing subjects to perceive (first-person view) and move the virtual arm as an extension of their own body. The 3DVE allowed performance of the complex ObsAv task without danger of injury from arm collision with the door and permitted manipulation of environmental variables not easily modified in a physical environment. Performance in 3DVE, however, also removed the physical consequences of missing or toppling the bottle. While task conditions might have differed in 3DVE compared to a physical environment, both groups were exposed to the same 3DVE and therefore performed reaching movements under similar circumstances.
With their dominant arm, subjects performed 5 blocks of reaching tasks under different conditions. In the familiarization block, at a computer-generated GO signal, subjects reached and retrieved the bottle fast and accurately and returned the arm to the initial position. Subjects were instructed to reach without bending the trunk and grasp the bottle by extending the wrist and opening and closing their hand, but no restrictions on UL configuration were imposed. A grasp was recorded when any part of the avatar hand touched the bottle within 5 seconds, and success was signaled with a “ping” sound. Practice continued until 10 consecutive successful trials were completed (n = 10-30 trials). One block of unobstructed reaching trials was performed (Block U, 15 trials, Figure 1B), and results were used as a template comparator for subsequent conditions. Next, subjects practiced avoiding the door when it slid across the scene from either the right (Block RD) or left side (Block LD; Figure 1C and D). If the door was hit, a cracking glass sound indicated a failed trial. The number of practice trials for the ipsilateral and contralateral doors were 10 to 60 and 10 to 30 trials, respectively. Once learned, a final block was completed (Block R, 60 trials) in which an equal number of the 3 trial types (U/RD/LD) randomly occurred to avoid subject anticipation of the upcoming condition. Subjects rested between blocks to avoid fatigue.
Door closure was triggered at 10% of mean endpoint peak velocity (determined from Block U) measured from the wrist marker (see below) so that 30% of the bottle was obstructed by the door at peak arm velocity. Since the initial arm motor command is completed by the time of endpoint peak velocity, 33 coincidence of door closure with endpoint peak velocity time also minimized early corrections so that the obstacle avoidance strategy required a secondary corrective movement and not an on-line correction.
Data Acquisition
Trunk and arm movements were recorded from 24 infrared-emitting markers for 5 seconds (120 Hz) after the GO signal with a 2-camera bar Optotrak Certus motion analysis system (Northern Digital, Waterloo, Ontario, Canada). Rigid bodies consisting of groups of 3 to 6 non–coaxial markers were placed on the dorsal hand, mid-forearm, mid-upper arm, and sternal notch. Six individual markers were also placed on the sternal angle, acromia, lateral epicondyle, mid-dorsal wrist crease (endpoint), and third fingertip.
Data Analysis
Endpoint velocity was computed from wrist marker x-y-z positional data. Movement initiation/end was defined as times at which velocity rose/fell and remained above/below 10% of the mean peak velocity calculated from Block U for at least 50 ms. Endpoint peak velocity (EPV, m/s) and time to peak velocity (TPV, seconds) values were computed. Reaching was characterized by trajectory length defined as the endpoint distance (mm) between movement initiation to end and Index of Curvature (IC) defined as the ratio of trajectory length to length of a straight line joining initial and final positions. 34
For planar joint angles, shoulder flexion/extension angle was defined by vectors between acromial and elbow markers relative to the trunk vertical where the arm alongside the body was 0°. For shoulder horizontal abduction/adduction, the arm positioned at 90° lateral abduction was 0°. Elbow angle was defined by vectors between acromial, elbow, and wrist markers where a fully extended arm equaled 180°. Wrist angles were defined by vectors between the markers on elbow, wrist, and hand dorsum. For trunk pitch (flexion/extension), initial vertical position was 0° with positive values indicating forward flexion. For all axial rotations, initial positions were 0° with positive values indicating shoulder external rotation, trunk counterclockwise rotation, and forearm supination. For avatar visualization, 3D reconstruction using rotational matrices was done using rigid body data. Joint angles were computed when the avatar hand (wrist marker) spatial coordinates corresponded to those of the virtual door location.
Interjoint coordination between elbow (flexion/extension) and shoulder (horizontal adduction/abduction) movements was characterized by slopes of elbow-shoulder angle-angle plots and compared between trial types (U/S/F) and groups. Elbow/shoulder covariance was calculated for 2 angle-angle plot segments. Segment 1 was defined from movement initiation to end of initial elbow flexion, and Segment 2 was from end of initial elbow flexion to movement end.
Success rate was calculated as the number of avoided ipsilateral obstructed trials divided by the total trials in Block R. To determine where trajectories of obstructed and unobstructed trials differed, a divergence point (DP) was calculated using endpoint velocity/position phase profiles for each trial type (U/S/F). Phase profiles were averaged for S and F trials separately and superimposed on mean U phase profiles. The first significant difference between S/F and U phase profiles (running t test, P < .05) was the DP expressed in absolute sagittal distance from the starting position and as percentage of total reaching path.
Statistical Analysis
Primary outcomes were success rate and DP, interjoint coordination, and clinical measures of arm use and self-efficacy. Secondary outcomes were changes in endpoint velocity and trajectory measures, arm and trunk configurations at the door location, and clinical scores.
For Hypothesis 1, the primary outcome, mean success rate, was compared between groups (control, stroke) with Student’s t tests. In addition, to determine the success rate that discriminated between groups, the number of subjects in each group who achieved increasing levels of success (eg, 50%, 55%, 60%, etc) was compared with 2-proportion z tests.
For Hypothesis 2, primary outcomes were DP at the endpoint level and interjoint coordination at the joint level. DPs, slopes, and joint kinematics (secondary outcomes) were compared between groups and trial types using repeated-measures ANOVAs, with P values corrected (Bonferroni) for 10 joint angles, so that P < .005. In addition to simple correlations (1-tailed Pearson/Spearman), backward-elimination linear regression analyses related success rate (dependent) to kinematic variables (independent) in each group. 35 In addition, logistic regression determined kinematic factors contributing to successful task performance (odds ratio), where task success was the binary (yes/no) dependent measure and kinematics were independent measures.
For Hypothesis 3, relationships between task success and arm-use and self-efficacy (primary) as well as clinical outcomes (secondary) were identified with 1-tailed correlations (Pearson/Spearman; P < .05).
Results
Stroke subjects had moderate-to-good recovery according to clinical scores (Table 1). In both groups, endpoint trajectories of unobstructed reaches (Figure 2A-D, black traces) were slightly curved (IC: control = 1.09 ± 0.06, stroke = 1.07 ± 0.03, P = .25), and EPV (control = 2240 ± 766 mm/s, stroke = 1979 ± 595 mm/s, P = .31) and trajectory length (control = 687 ± 99.7 mm, stroke = 705 ± 84.5 mm, P = .59) were similar. In addition, joint angles were similar between groups for unobstructed reaches.
Demographic Characteristics and Clinical Scores of Stroke Subjects. All Stroke Subjects Had Lesions in the Dominant Hemisphere.
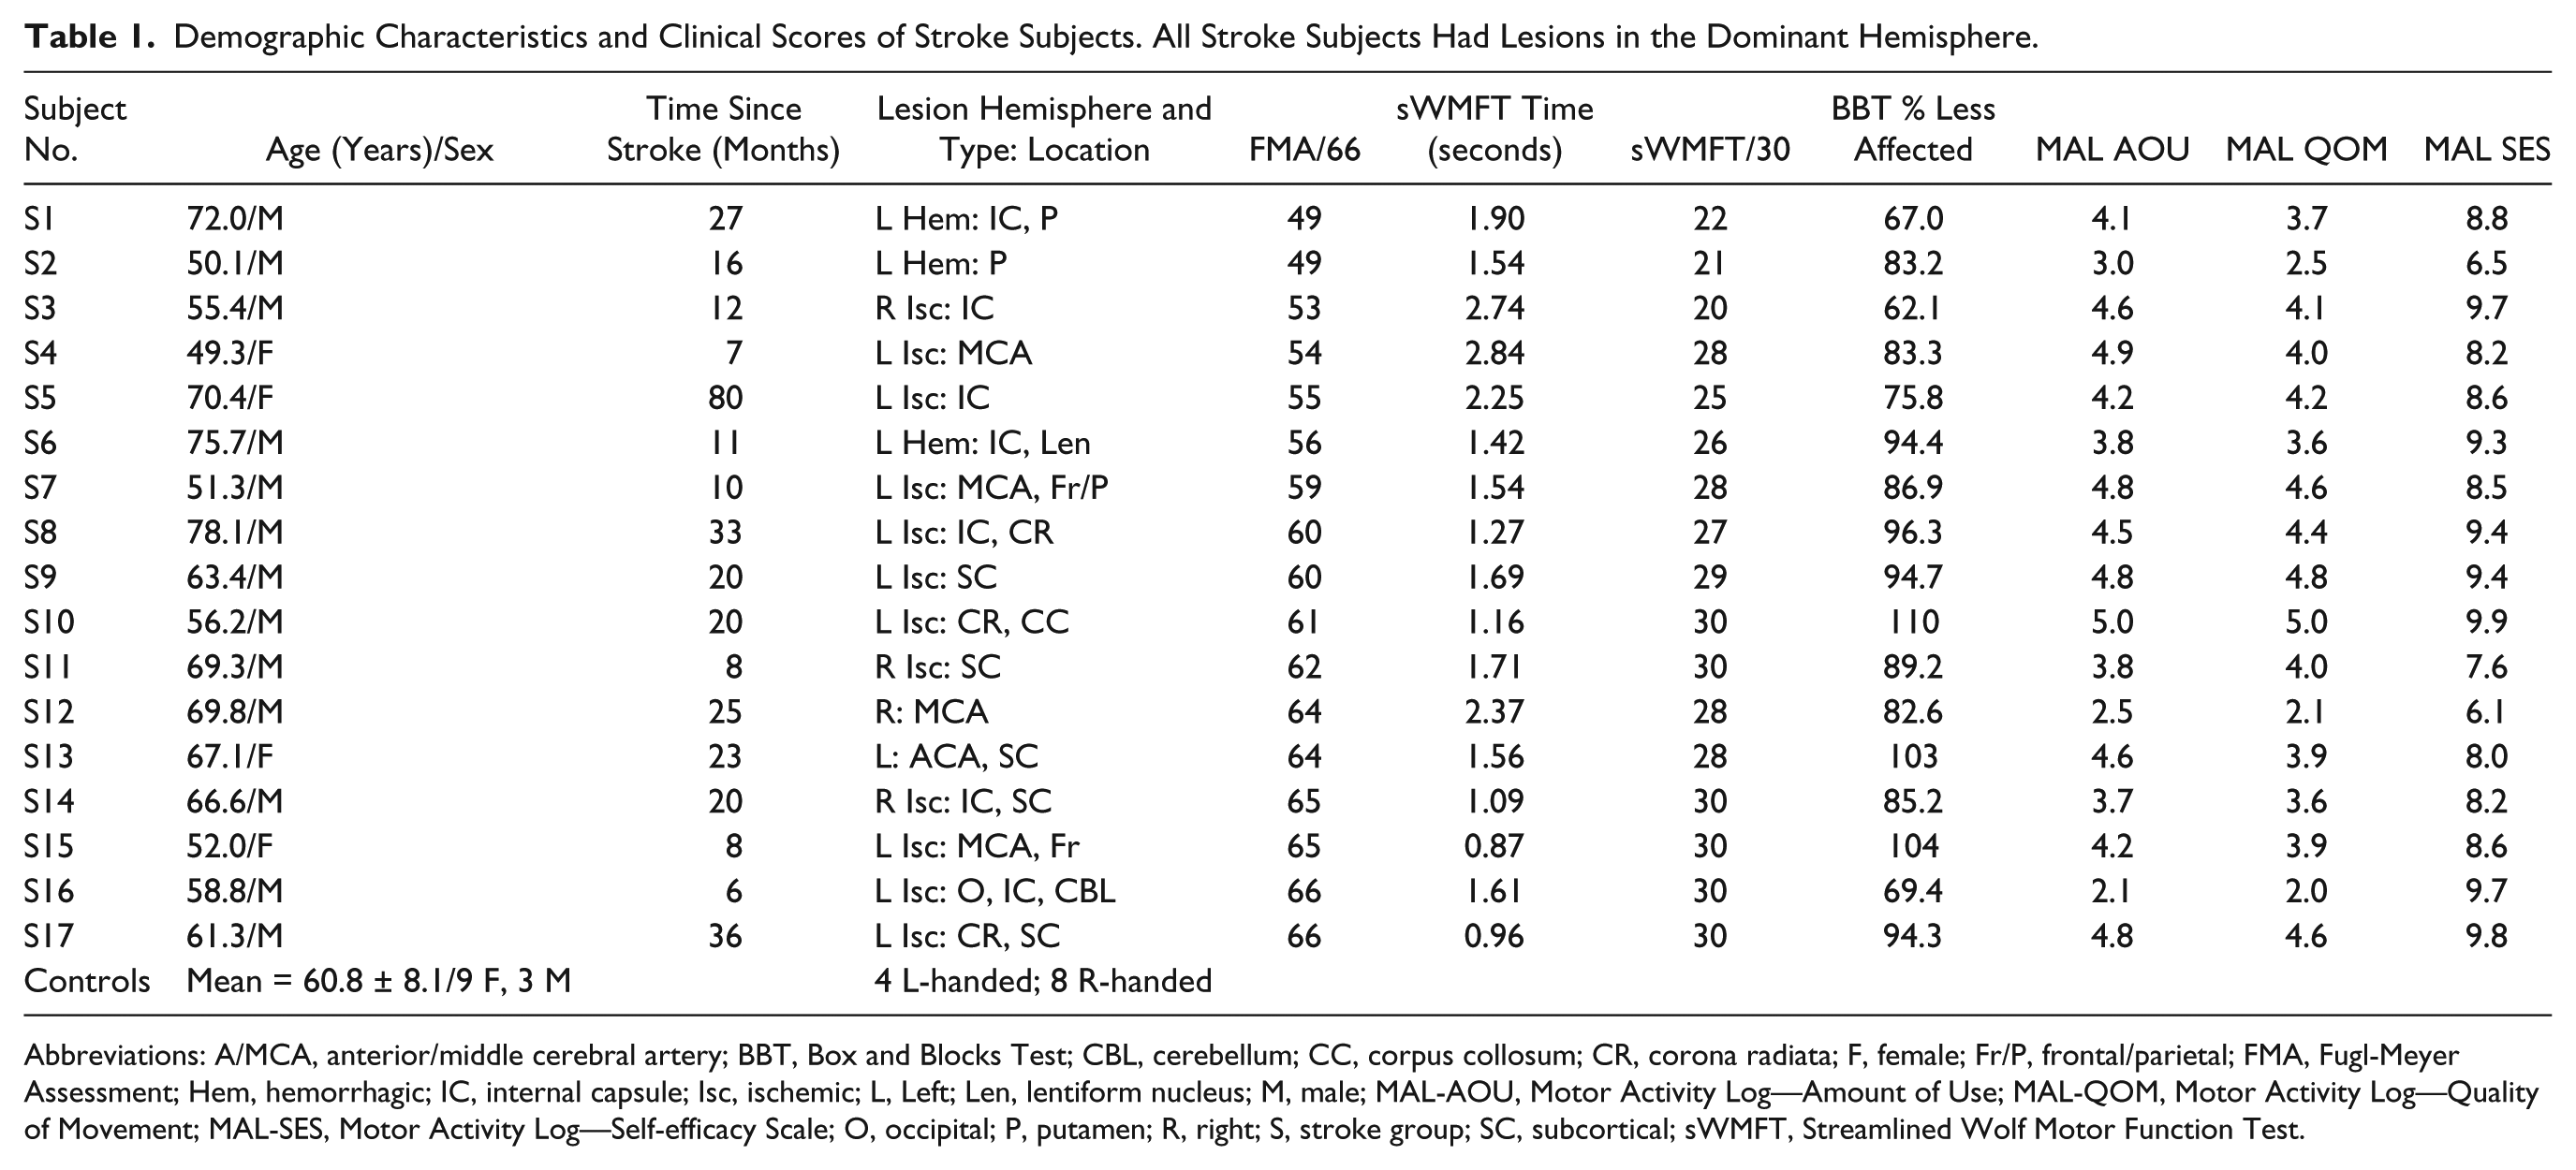
Abbreviations: A/MCA, anterior/middle cerebral artery; BBT, Box and Blocks Test; CBL, cerebellum; CC, corpus collosum; CR, corona radiata; F, female; Fr/P, frontal/parietal; FMA, Fugl-Meyer Assessment; Hem, hemorrhagic; IC, internal capsule; Isc, ischemic; L, Left; Len, lentiform nucleus; M, male; MAL-AOU, Motor Activity Log—Amount of Use; MAL-QOM, Motor Activity Log—Quality of Movement; MAL-SES, Motor Activity Log—Self-efficacy Scale; O, occipital; P, putamen; R, right; S, stroke group; SC, subcortical; sWMFT, Streamlined Wolf Motor Function Test.
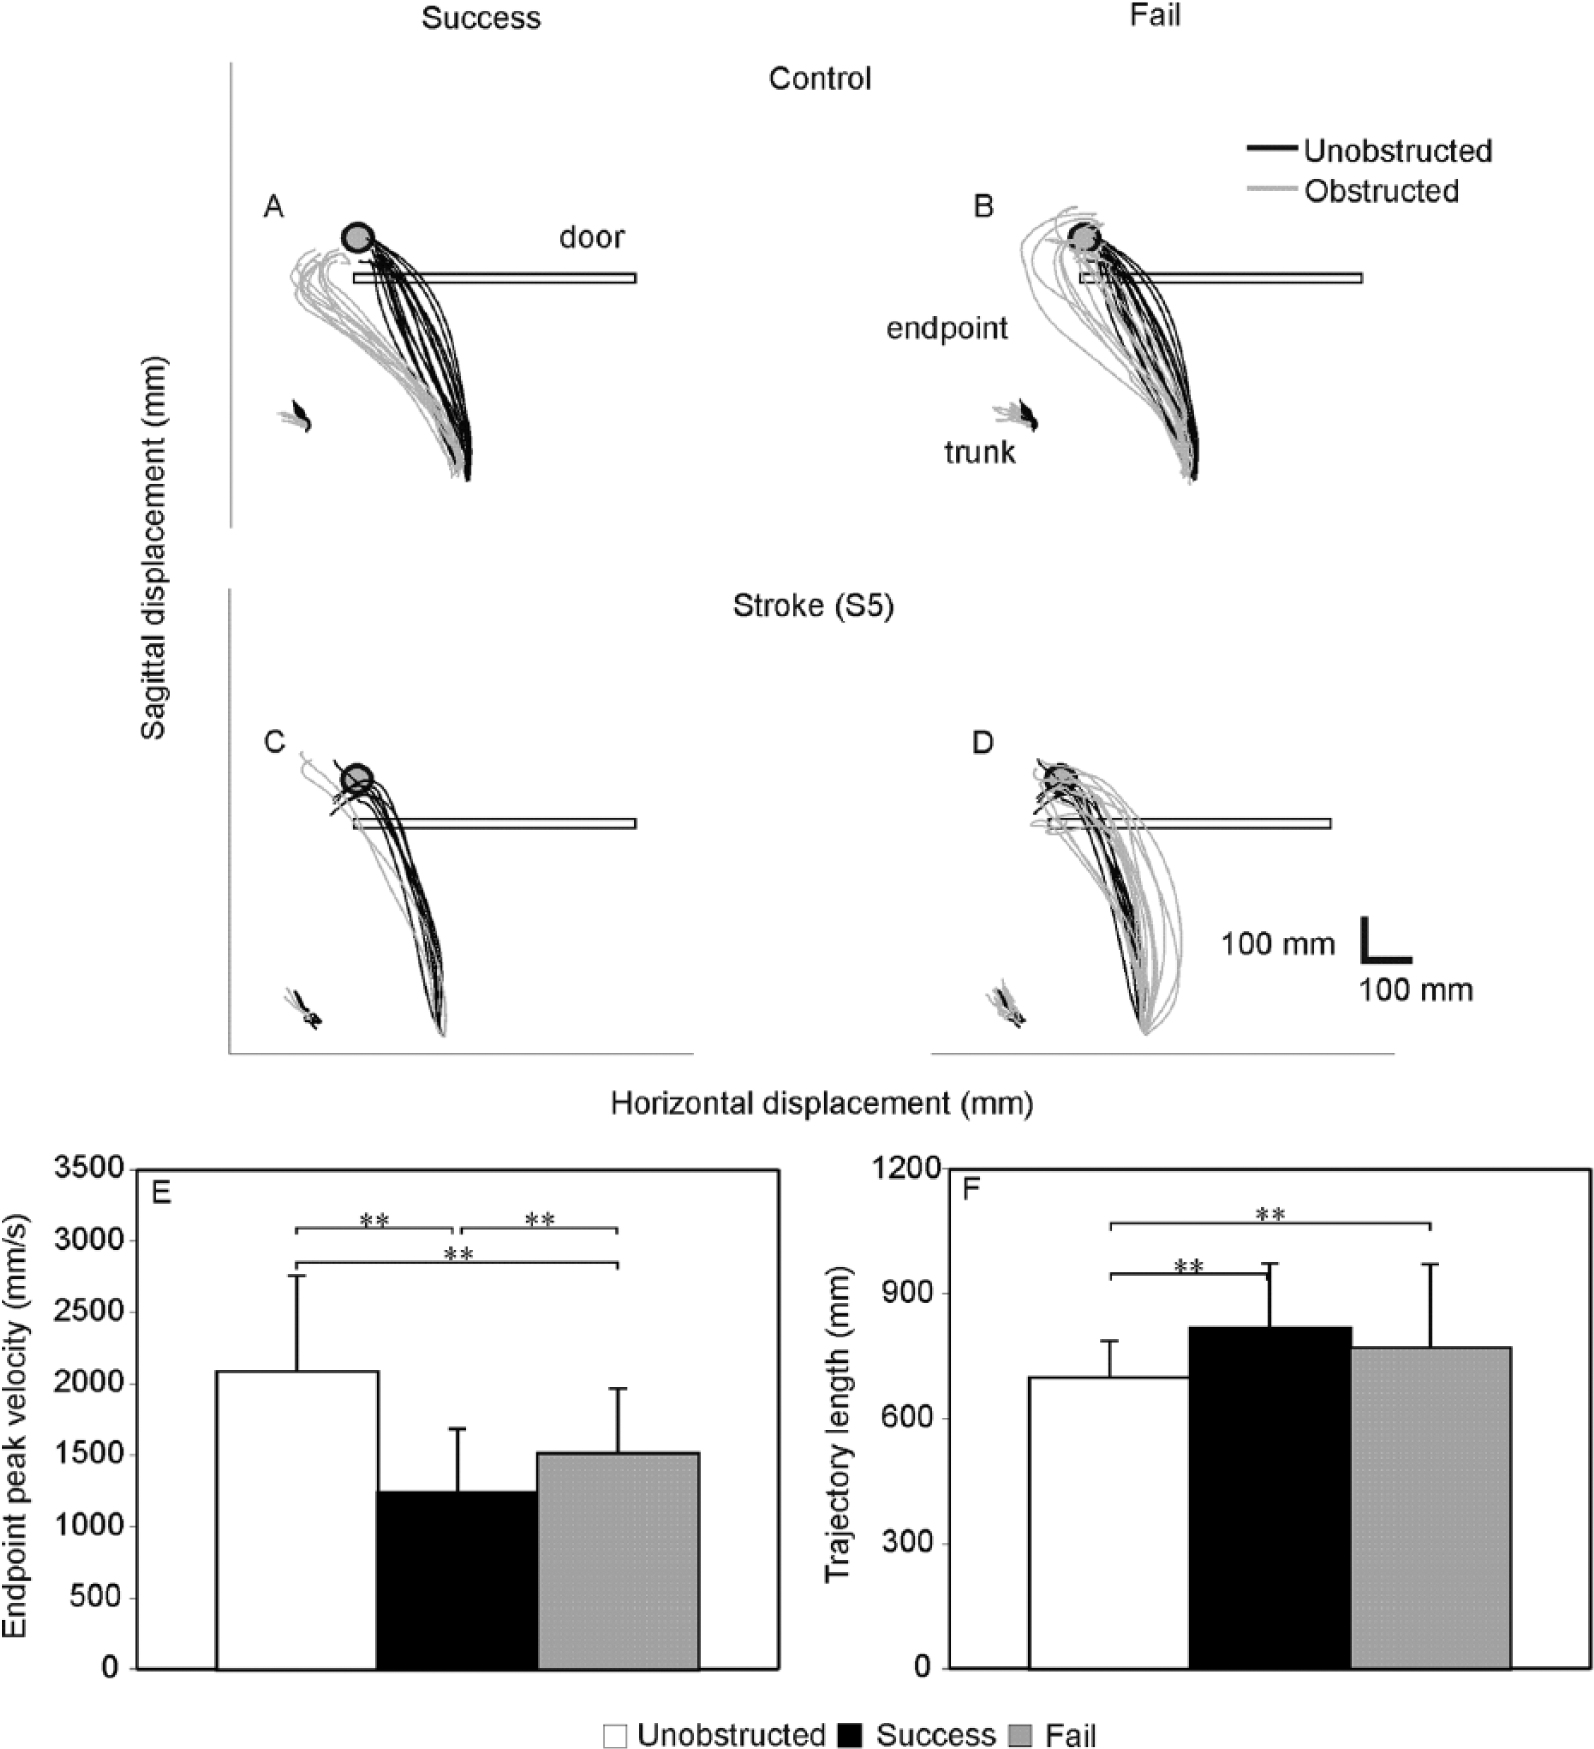
(A-D) Examples of endpoint and trunk trajectories during unobstructed (black traces) and obstructed (grey traces) reaching trials to a bottle (grey circles). The final position of the obstruction (door) is shown by the horizontal rectangle. Data are shown for successful (A, C) and failed (B, D) obstacle avoidance trials in control (A, B) and stroke (S5; C, D) subjects. S5 had a Fugl-Meyer Assessment score of 57/66. (E-G) Histograms of mean (±SD) endpoint measures for each trial type (unobstructed: white; success: black; fail: grey) for both groups. (E) Endpoint peak velocity, (F) Trajectory length. **P < .01.
Success rate was 100% in practice blocked-door conditions (RD, LD) as a requirement for random block (R) testing. Success rate for the easier contralateral door in Block R did not differ between groups (controls = 82.6 ± 15.4%; stroke = 75.6 ± 18.1%, P = .29).
Hypothesis 1: Stroke Subjects Were Less Successful Avoiding the Ipsilateral Door Than Controls
Success Rate
Mean overall success rate was similar between groups (control: 55.9 ± 24.0%; stroke: 41.6 ± 26.4%, P = .15). However, a higher percentage of control subjects succeeded in obstacle avoidance more often than stroke subjects. For example, an equal number of subjects in each group succeeded in the task 50% of the time, but fewer subjects with stroke could achieve higher levels of success. The difference in proportions was significant at the 65% level (stroke = 12%, control = 42%; z = 1.85, P < .05).
Hypothesis 2: Decreased Success Was Related to Altered Kinematics
Differences in Divergence Point
Figure 3A to D shows examples of mean endpoint velocity/position phase plots for one control (Figure 3A and B) and one stroke (Figure 3C and D) subject. The S trial DP of the control subject (Figure 3A) occurred at ~100 mm from the starting position, while that of the stroke subject (Figure 3C) occurred at ~150 mm. In contrast, a DP did not occur in failed trials in either subject (Figure 3B and D), indicating that endpoint movement did not differ between trial types. Successful trials in controls were characterized by DPs occurring closer to the starting position compared to failed trials (t = −2.310, P = .041; Figure 3E). The stroke group had the same pattern (t = −5.869, P < .001), but successful DPs occurred further from the starting position (t = −2.628, P = .014).
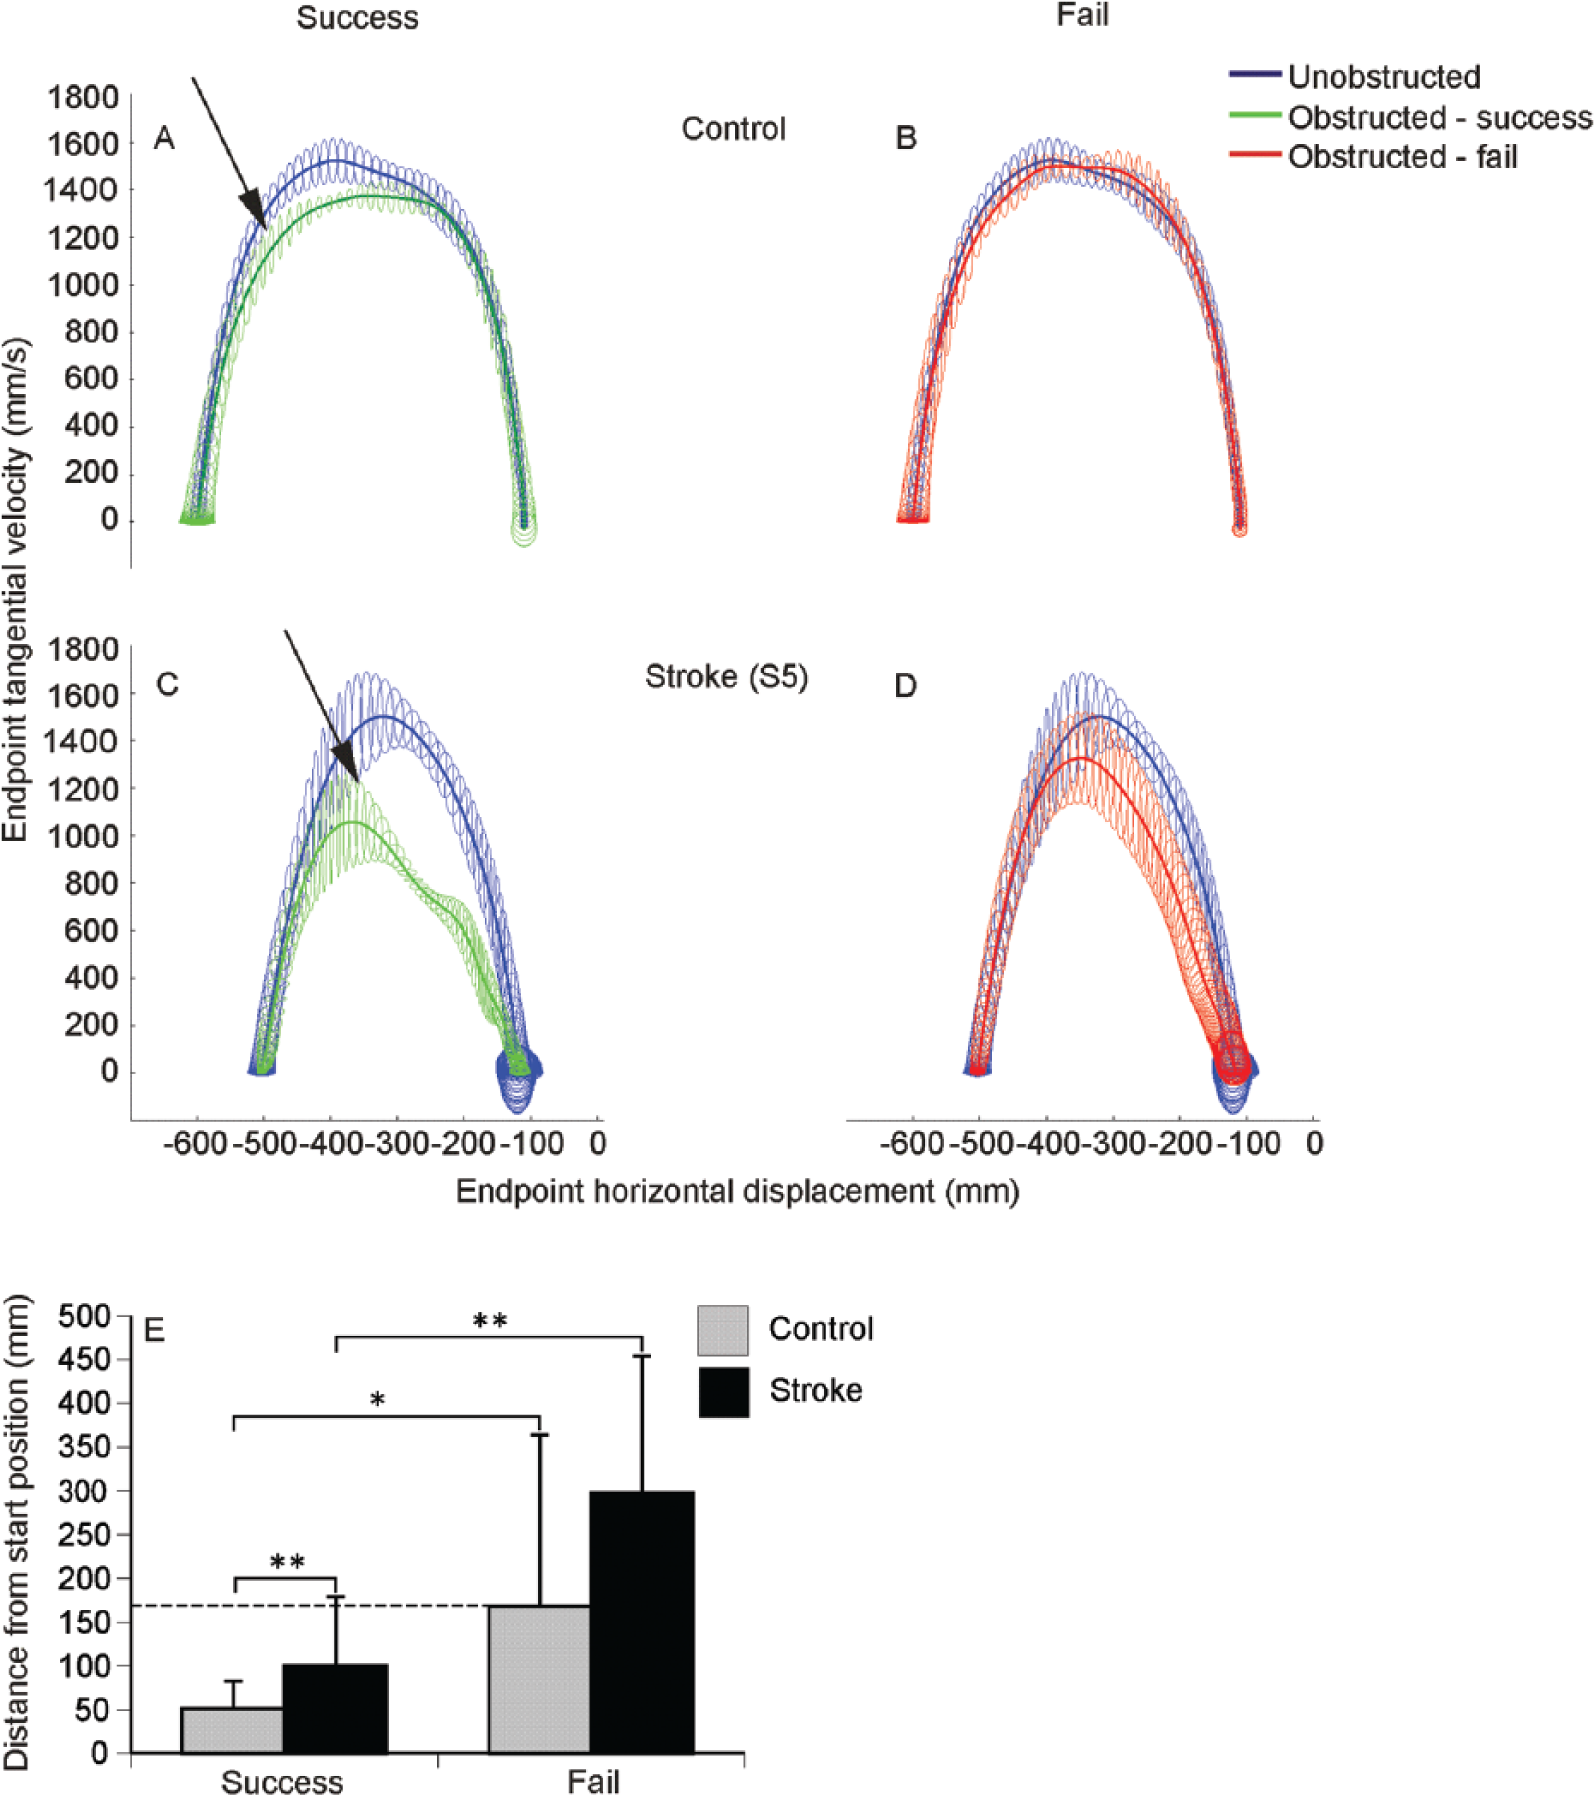
(A-D) Examples of average (±SD; ellipses) phase plots between endpoint velocity and endpoint forward displacement for unobstructed (blue traces) and obstructed reaches (green/red traces) in one control (A, B) and one stroke (S5; C, D) subject. Arrows in A and C show the point at which the obstructed trials diverge from the unobstructed trials. (E) Mean divergence points of phase plots for each group. Grey and black bars show the mean divergence points of the successful (left 2 bars) and failed (right 2 bars) trials for control and stroke subjects, respectively. The dashed horizontal line indicates the distance from the start position at which control subjects failed the task (critical failure point). *P < .05, **P < .01.
The mean failed DP of controls (168.2 mm) was considered as the critical failure point for both groups (Figure 3E, horizontal dashed line). Thus, in Figure 3E, successful DPs of controls occurred at ~31% of the critical failure point distance (51.6 mm/168.2 mm * 100%), while those in stroke occurred closer (~60%) to the failure point (100.7 mm/168.2 mm * 100%). Some stroke subjects, however, had DPs below the critical failure point but still made unsuccessful reaches. To examine why this occurred, we analyzed individual elbow/shoulder angle-angle plots.
Differences in Interjoint Coordination
Two different elbow-shoulder interjoint coordination patterns were identified. Pattern 1, occurring in ~70% of both groups (control: 8/11; stroke: 11/17) was characterized by different coordination in early and late reach phases. The slope of the first segment, where the rate of change of elbow flexion was larger than that of shoulder horizontal adduction (Figure 4A and C, left of vertical dotted line), was greater in both groups for S compared to U and F trials (F2,16 = 23.180, P < .001). The second segment (Figure 4A and C, right of vertical dotted line) was characterized by a balanced contribution of elbow extension and shoulder horizontal adduction until the end of the reach. In the remaining subjects (control: 3/11; stroke: 6/17), interjoint coordination was characterized only by the second segment (Pattern 2, Figure 4B and D). Second segment slopes of both patterns tended to be greater in controls for all trial types compared to stroke (P = .059) and were significantly greater for S trials (control = 0.357, stroke = 0.199; F1,23 = 5.713, P = .025; Figure 4E). Within-group analysis showed that slopes did not vary between trial types in control subjects, while stroke subjects had lower slopes in obstructed compared to unobstructed trials (F2,22 = 3.412, P = .027; Figure 4E). The lower slopes of Pattern 2 for the stroke subjects indicated that while some stroke subjects might have had DPs below the critical failure point, not varying elbow/shoulder relationship may have contributed to the difference in successfully avoiding the door.
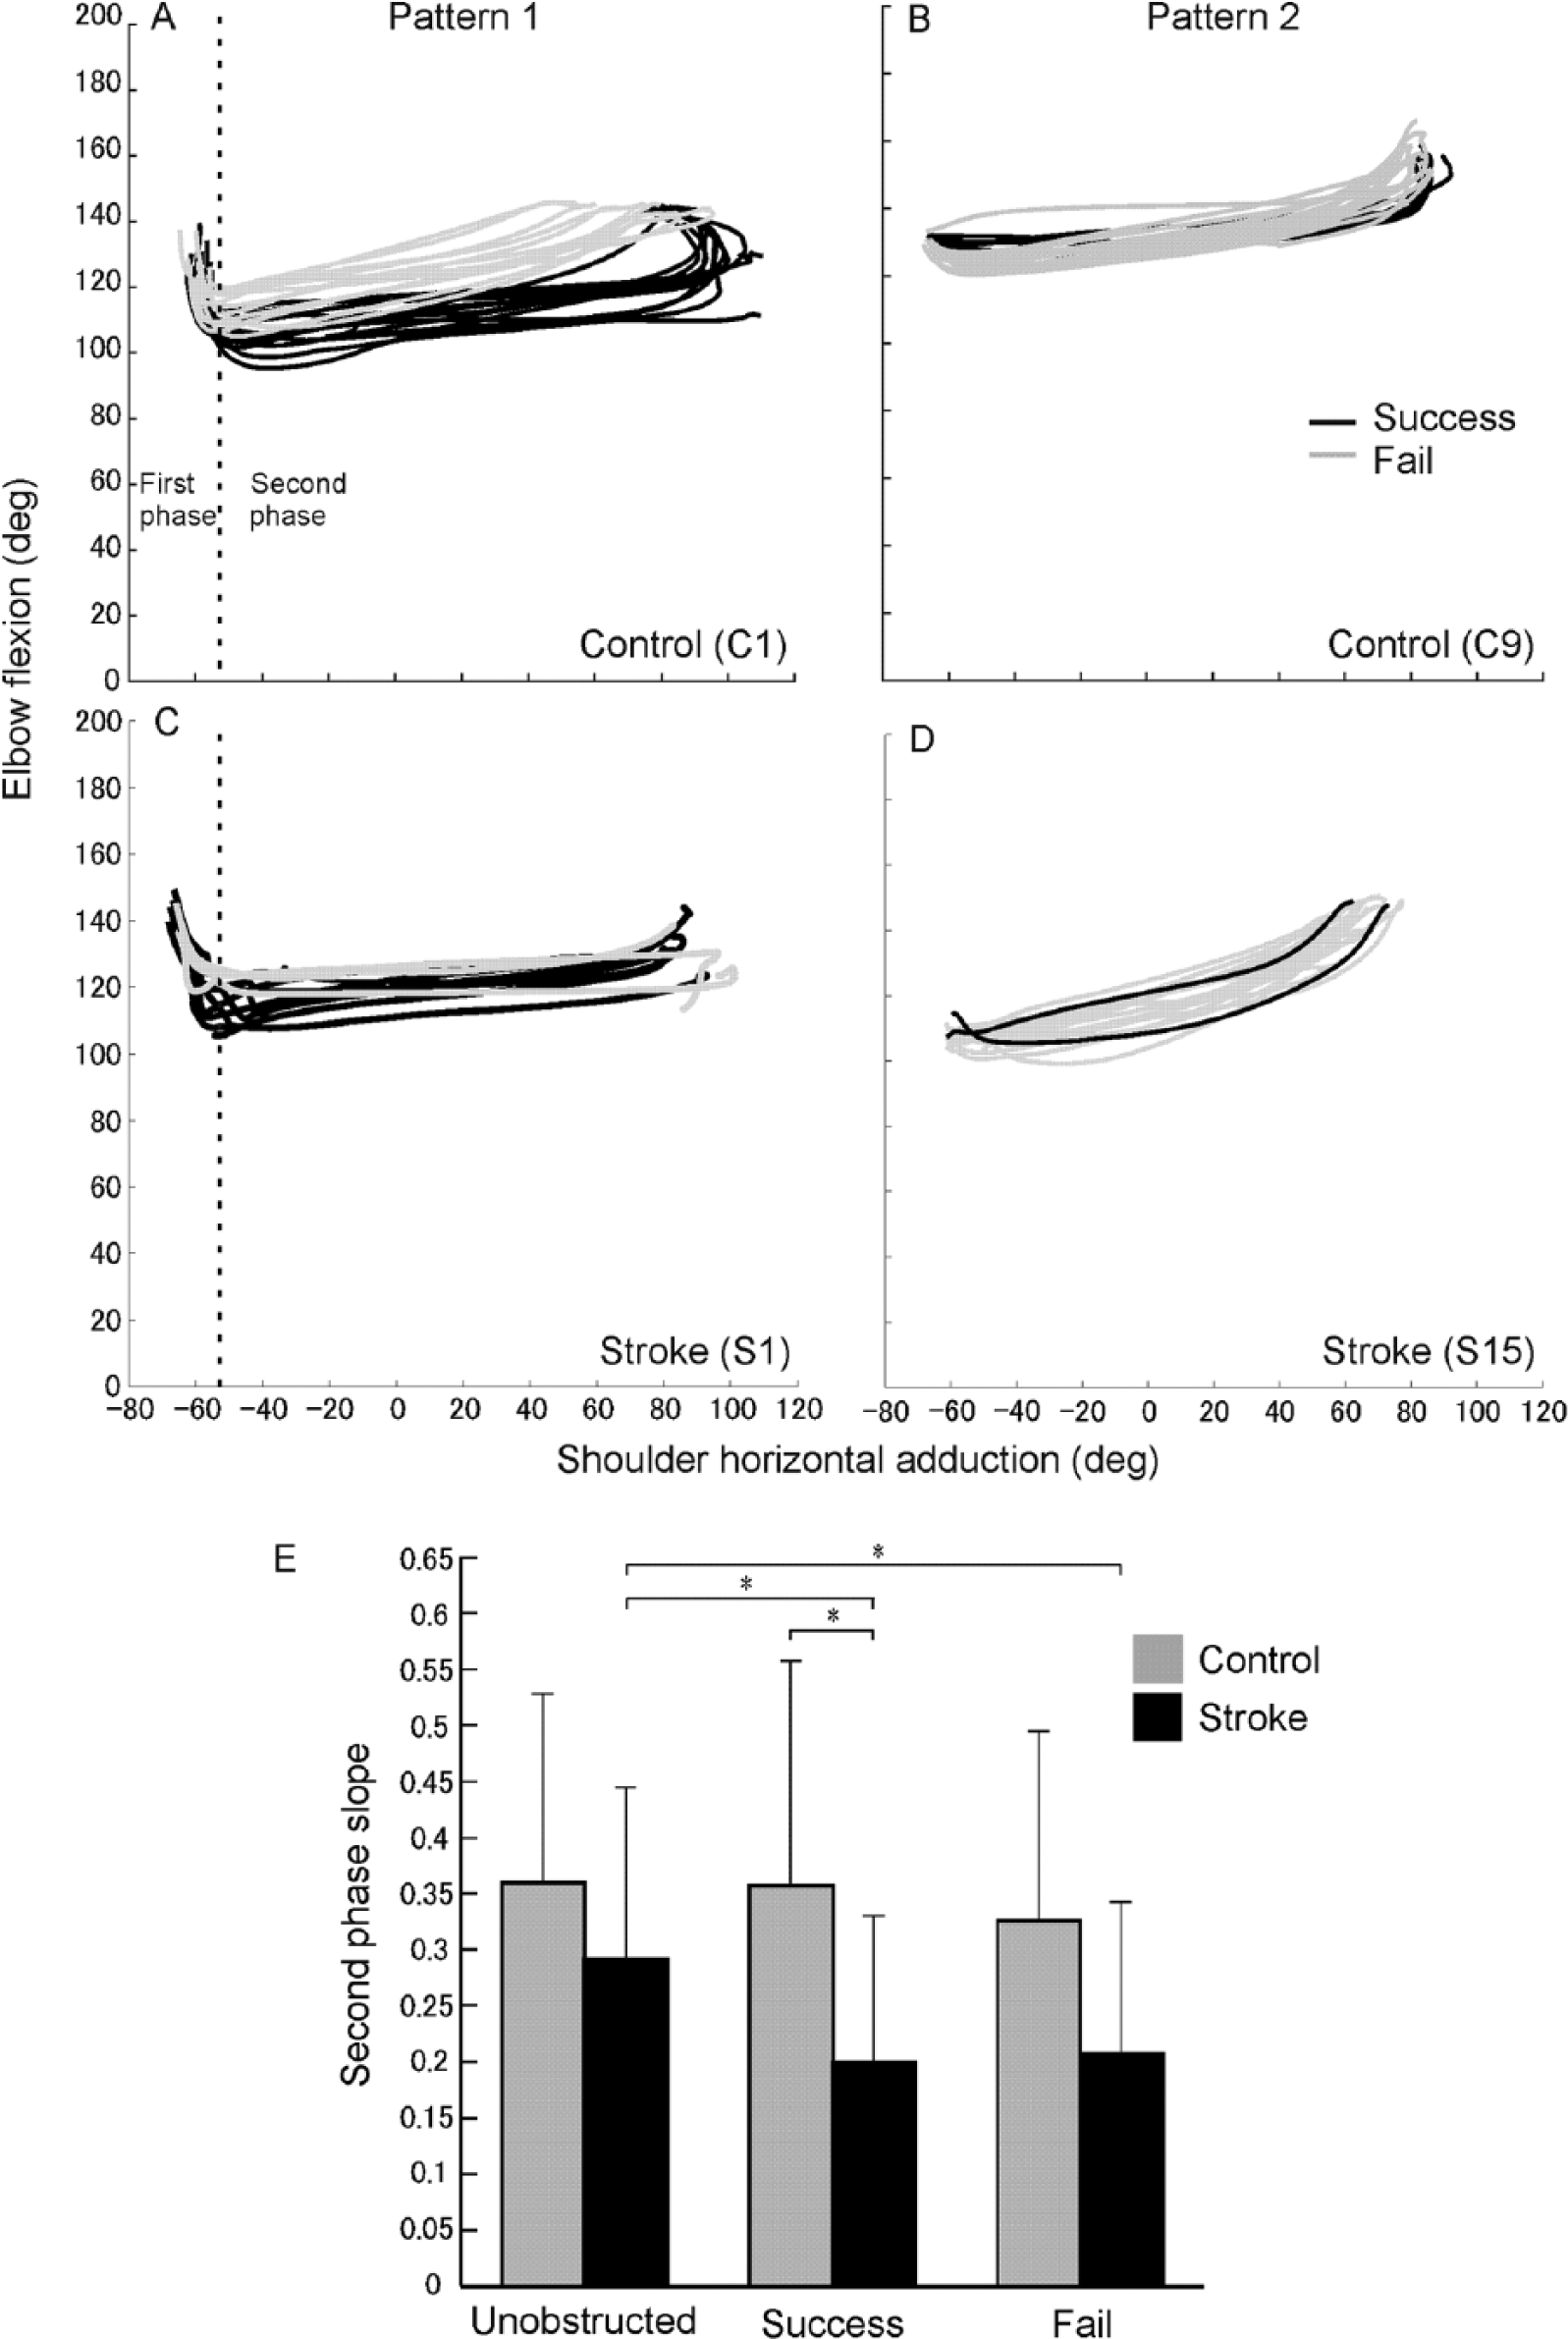
(A-D) Examples of elbow flexion/shoulder horizontal adduction angle-angle relationships during successful (black traces) and failed (grey traces) reaching trials. Data are shown for 2 control (A, B) and 2 stroke (S1, S15; C, D) subjects. Diagrams on the left depict Pattern 1 that consists of 2 movement phases separated by a vertical dashed line. Diagrams on the right depict Pattern 2 that has only 1 phase. (E) Histogram of mean (±SD) slopes of the second phase of the angle-angle relationships showing differences between all trial types in the stroke group (black bars) and between control (grey bars) and stroke groups for successful trials. *P < .05.
Differences in Joint Kinematics
For both groups, in obstructed trials, the endpoint trajectory initially followed the unobstructed trajectory and then deviated medially (Figure 2A-D, grey traces). Compared to U trials, ObsAv behavior was characterized by slower EPVs (decreased by ~40% for S and ~28% for F; F2,26 = 35.811, P < .001; Figure 2E) and lengthened endpoint trajectories for S trials (~125 mm; F2,26 = 10.898, P < .001; Figure 2F) with no differences between groups.
There were significant differences in the amount of elbow flexion (F2,26 = 9.227, P = .001; Figure 5C), trunk flexion (F2,26 = 7.952, P = .002; Figure 5D), and trunk rotation used (F2,26 = 6.569, P = .008; Figure 5E). Controls used more elbow flexion to avoid hitting the door in both S (114 ± 18.5°) and F (109 ± 20.0°) trials compared to U trials (129 ± 16.4°; P < .001), while stroke subjects did not vary elbow angle across trial types (range: 122-125°, P = .65). Stroke subjects used more trunk flexion (8.8 ± 5.2°) compared to controls (5.0 ± 5.2°; P = .041) in S trials and more trunk rotation in S (10.2 ± 5.3°) and F trials (6.5 ± 4.6°) compared to controls (S = 3.9 ± 3.5°; P = .001; F = 2.7 ± 2.5°; P = .015).
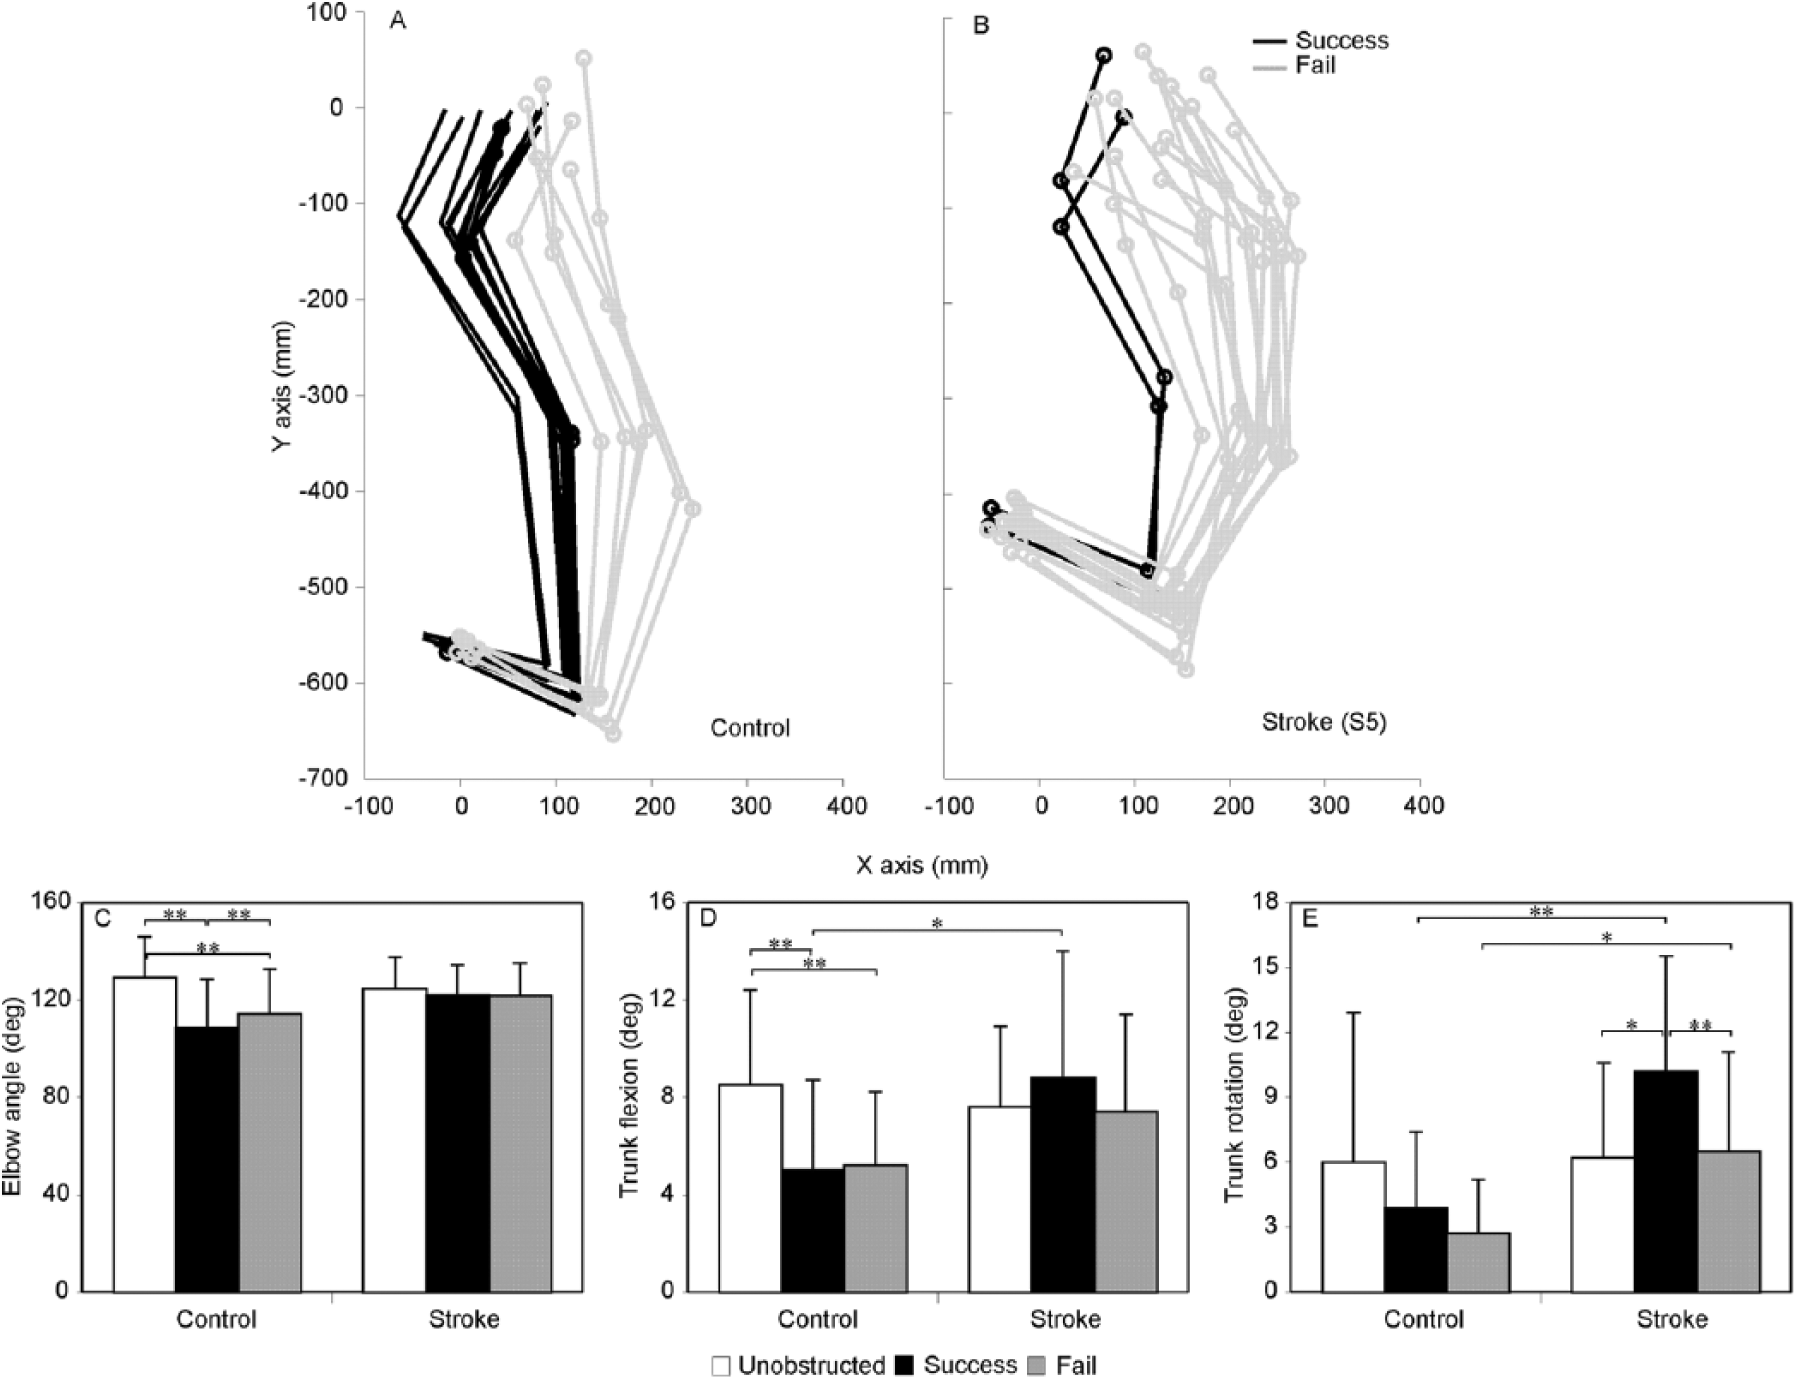
(A, B) Stick diagrams showing representative examples of joint configurations when the arm reached the level of the door in one control (D) and one stroke (E) subject for successful (black lines) and failed (grey lines) reaching attempts. (C-E) Histograms of mean (±SD) joint angles when the endpoint was at the level of the door for each trial type (unobstructed: white; success: black; fail: grey). Differences are indicated between trial types for elbow angle (C) and trunk flexion (D) in controls as well as for trunk rotation (E) in stroke subjects. Group differences are also shown for trunk flexion (D) and rotation (E). *P < .05, **P < .01.
Relationship Between Success Rate and Kinematic Measures
In controls, higher success rates correlated with longer TPV (r = 0.54, P = .035), higher IC (r = 0.60, P = .020), more wrist extension (r = −0.52, P = .041), and more elbow flexion near the position of door contact (r = −0.58, P = .025). In contrast, in stroke, higher success rates were related to lower EPV (r = −0.51, P = .018), longer TPV (r = 0.50, P = .021), and more shoulder external rotation (r = 0.63, P = .004).
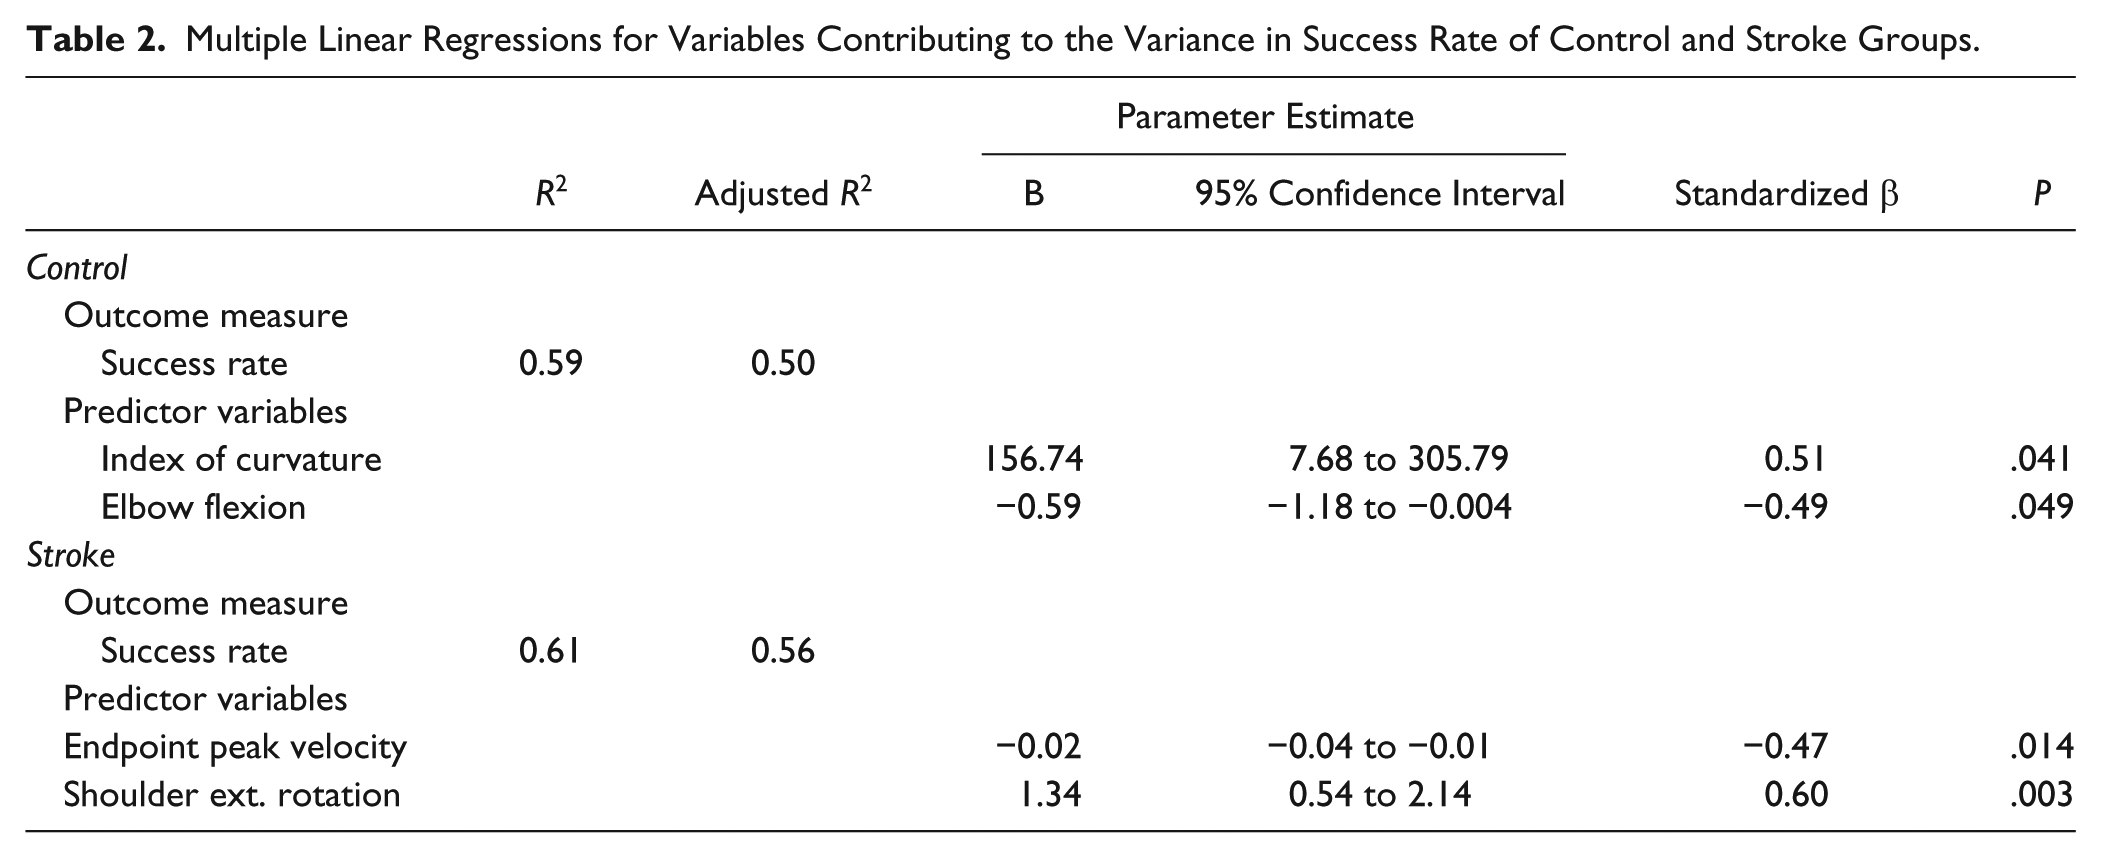
Based on regression analysis, success rate was explained by IC and elbow flexion (50% of variance) in controls (F2,9 = 6.505, P = .018) and by EPV and shoulder external rotation (56% of variance) in stroke (F2,14 = 11.109, P = .001; Table 2).
Multiple Linear Regressions for Variables Contributing to the Variance in Success Rate of Control and Stroke Groups.
Relationship Between DP and Clinical Scales
A DP closer to the initial position correlated with higher sWMFT-FAS scores (r = −0.59, P = .011) and higher BBT scores (r = −0.79, P < .001).
Odds Ratio
For both groups, odds of failure increased for every unit increase in EPV (control: 0.2%; stroke: 0.1%) and elbow extension (control: 8.7%; stroke: 7.8%). Greater use of shoulder external rotation (9.4%) in controls and shoulder flexion in stroke (4.9%) also led to greater odds of failure. Conversely, odds of failure decreased for every unit increase in arm trajectory length in both groups (control: 0.6%; stroke: 0.5%) and the use of trunk rotation in controls (25.2%) or shoulder horizontal adduction in stroke (4.1%).
Hypothesis 3: Task Success Was Not Related to Clinical Scores
Subjects with the highest sWMFT scores did not necessarily have high success rates. Five out of the 10 stroke subjects (Table 1) with high clinical scores (FMA >60, sWMFT >27) had low success rates (<50%) on the ipsilateral door task. In addition, there was no correlation between success rate and sWMFT or FMA. In the stroke group, success rates only correlated with reports of greater UL self-efficacy (MAL-SES, r = 0.53, P = .022) and not with other clinical or self-report scales. Higher self-efficacy was also related to better self-reported quality of movement (MAL-QOM, r = 0.51, P = .025).
Discussion
The ability of patients with mild-to-moderate UL hemiparesis to perform an obstacle avoidance task was compared to controls. Consistent with Hypothesis 1, poststroke individuals were less successful avoiding obstacles than nondisabled controls indicating that they had residual higher-order UL sensorimotor deficits not detected by clinical scales. In accordance with Hypothesis 2, decreased success rates in stroke were related to later endpoint divergence (resulting in smaller margins of error) when avoiding the obstacle, and altered UL kinematics. When poststroke subjects reached for the unobstructed bottle or when they avoided the contralateral door, their UL kinematics and interjoint coordination were similar to controls. For ipsilateral door obstructed reaches, slower movement and more curved trajectories in both groups were related to greater success (odds of failure analysis). In addition, to avoid failure, stroke subjects used less elbow extension, more trunk displacement, more shoulder horizontal adduction, and different elbow-shoulder interjoint coordination patterns compared to controls. For Hypothesis 3, successful ObsAv behavior in stroke was not related to clinical scores or levels of arm use, but correlated with perceived self-efficacy in using the more-affected arm. This has important implications for stroke rehabilitation since high self-efficacy has been linked to better functional stroke outcomes. 36
Capacity for Kinematic Adaptability
Previous studies in stroke have identified deficits in adapting movement to task conditions. For example, Shaikh et al 19 studied the ability of stroke subjects to adapt trunk-assisted reaching when trunk displacement was unexpectedly blocked. Control subjects preserved the same hand trajectory (up until arm reaching extent) whether the trunk was free or blocked, by rapid adaptation of arm interjoint coordination patterns. However, arm movements in stroke subjects only partially compensated for trunk displacement resulting in trunk movement contributing to arm movement earlier and to a larger extent during reaching. Thus, subjects with stroke had a decreased ability to adaptively use kinematic redundancy, called “motor equivalence.”8,37 van Kordelaar et al 38 and Levin et al 39 reached similar conclusions about diminished kinematic adaptability in stroke subjects during reaching tasks.
In our study, stroke subjects also had deficits adaptively combining shoulder horizontal adduction and elbow extension, which diminished successful obstacle avoidance. Stroke subjects did not adapt elbow movement and used more trunk displacement across trial types compared to controls (Figure 5A-E). Even in trials in which DP occurred within the range of successful DPs of controls, deficits in shoulder and elbow kinematic adaptability resulted in hitting the obstacle. This suggests that individuals with mild-to-moderate stroke have persistent deficits adaptively coordinating arm and trunk movements according to task demands (simple reaching, trunk-assisted reaching, and reaching around obstacles).
Another explanation for later DPs and resultant smaller error margins in stroke is longer time to process visual information about obstacle appearance and plan corrective movements, due to cognitive deficits.40-42 While information processing speed and executive function (planning, task flexibility, reasoning, decision-making. problem-solving) are the cognitive processes most impaired after stroke,43,44 other domains such as attention, memory, visuospatial and constructive skills may also be affected.43,45 However, findings that subjects with stroke had similar movement patterns and success rates to controls when avoiding hitting the easier contralateral door suggest that poorer obstacle avoidance performance was related to deficits in movement execution rather than to slower cognitive processing.
Role of Trunk Compensation
Stroke subjects used more trunk flexion and rotation than controls, which are common motor compensations in patients with chronic stroke.17,39,46 The amount of compensatory trunk displacement used during sagittal reaching tasks has been related to motor deficit severity. For simple reaching tasks, compensatory trunk movement increases reaching accuracy, 46 orients the hand for grasping, 47 and assists arm swing in standing. 48 Stroke subjects may have attempted to use trunk movement to achieve better hand positioning for avoiding the obstacle or compensating decreased shoulder strength. However, since the large mass of the trunk requires more time to accelerate, it is unlikely that the additional trunk displacement assisted obstacle avoidance in our task that required rapid arm adjustments.
Limitations
The environment was viewed on a large screen display using 3D glasses. Although differences have been reported between movements made in 3DVE and physical environments, studies in similar groups have reported only minor differences in arm and hand kinematics when performing reaching tasks.49,50 Differences in visual acuity in VR, however, would be similar in both groups (stroke and healthy). However, it cannot be ruled out that visuospatial processing deficits in the stroke subjects may have contributed to between-group differences.
Clinical Implications
Our participants had moderate to no impairment (FMA: 49-66) and moderate-to-good motor function (sWMFT: 20-30) but still had deficits compared to controls performing a complex reaching task often occurring in daily life. Indeed, half of the participants with the highest clinical scores (FMA = 60-66, sWMFT = 28-30) had very low success rates (mean = 10.3 ± 3.4%). This suggests that good clinical scores did not reflect the existence of higher-order motor control deficits needed for the rapid adaptation task. Thus, in order to assess higher order UL skills, movement kinematics should be analyzed during performance of functional, real-world tasks.
Contrary to our hypothesis, a relationship between success on our task and arm use was not found in the stroke group. Subjects in our study were considered to have moderate-to-well-recovered arm movement with high MAL scores (AOU = 4.1 ± 0.9, QOM = 3.8 ± 0.9). Although scores higher than 3 may reflect independence for activities itemized in MAL, 51 the activities do not reflect performance on more complex timed tasks. It is likely that subjects may not even try to engage in more challenging UL tasks. This is supported by our finding that the level of self-efficacy was related to the individual’s self-reported perception of the quality of their movement as well as to their actual success rate on the ObsAv task.
The quantification of higher-order motor control deficits may identify barriers to UL recovery not currently detected by clinical scales. Accelerometry may help address this problem but it is unclear how data from individual transducers may discern complex movement patterns used for everyday life activities. Alternatively, clinical tests could be designed to measure the ability to perform skillful movements that have time constraints and require cognitive processes, like unimanual/bimanual catching/throwing gestures and obstacle avoidance tasks. Knowledge about higher-order motor deficits may be used to better tailor rehabilitation approaches for UL recovery.
Footnotes
Acknowledgements
The authors wish to thank Rhona Guberek for clinical evaluations and experimental assistance and Christian Beaudoin and Valeri Goussev for technical support. Thanks are also extended to the study participants who volunteered their time for this study.
Declaration of Conflicting Interests
The authors declared no potential conflicts of interest with respect to the research, authorship, and/or publication of this article.
Funding
The authors disclosed receipt of the following financial support for the research, authorship, and/or publication of this article: MFL holds a Canada Research Chair in Motor Recovery and Rehabilitation. AAM is funded by Heart and Stroke Foundation of Canada. MCB was funded by the Richard and Edith Strauss Doctoral Fellowship (McGill University). The study was funded by the Canadian Institutes of Health Research.