
Abstract
Background. Conventionally, change in motor performance is quantified with discrete measures of behavior taken pre- and postpractice. As a high degree of movement variability exists in motor performance after stroke, pre- and posttesting of motor skill may lack sensitivity to predict potential for motor recovery. Objective. Evaluate the use of predictive models of motor learning based on individual performance curves and clinical characteristics of motor function in individuals with stroke. Methods. Ten healthy and fourteen individuals with chronic stroke performed a continuous joystick-based tracking task over 6 days, and at a 24-hour delayed retention test, to assess implicit motor sequence learning. Results. Individuals with chronic stroke demonstrated significantly slower rates of improvements in implicit sequence-specific motor performance compared with a healthy control (HC) group when root mean squared error performance data were fit to an exponential function. The HC group showed a positive relationship between a faster rate of change in implicit sequence-specific motor performance during practice and superior performance at the delayed retention test. The same relationship was shown for individuals with stroke only after accounting for overall motor function by including Wolf Motor Function Test rate in our model. Conclusion. Nonlinear information extracted from multiple time points across practice, specifically the rate of motor skill acquisition during practice, relates strongly with changes in motor behavior at the retention test following practice and could be used to predict optimal doses of practice on an individual basis.
Introduction
Motor outcomes after stroke rely on capacity for learning as individuals work to relearn old, and acquire new, motor skills. 1 The amount, or “dose,” of practice required to stimulate learning after stroke is an important topic among clinicians and researchers alike. 2 Motor learning refers to “relatively permanent changes in the capability for skilled behavior” and has conventionally been quantified with discrete measures of behavior taken at postpractice time points.3-9 It is known that the acquisition of motor skills that result in behavioral change do not occur in a linear manner. 9 Pre- and posttesting of motor skill may lack sensitivity to delineate nonlinear information regarding how quickly individuals improve as well as whether, and when, performance plateaus. 9 In the early phase of motor skill acquisition, individuals acquire basic movement patterns through trial-and-error movement strategies that are used to achieve the desired goal. 10 If sufficient practice is provided, large improvements in motor performance typically occur in a nonlinear fashion, followed by smaller rates of improvement when approaching a plateau in behavior. 1 While previous works have modeled motor behavior using a curvilinear function in individuals with stroke,11-14 the possibility of exploiting the relationship between rate of motor skill acquisition and the number of trials until asymptote to determine whether this information can be used to enhance motor learning after stroke has not been studied. 15 Undertaking this effort is important as it may enable prediction of the appropriate dose of practice on an individual basis, which could lead to optimized motor learning after stroke. Some work has used post hoc analyses to quantify the dose of practice needed to induce clinically meaningful change, 2 or dose escalation methods to identify the maximum tolerated dose. 16 However, at this time no methodology exists that uses the rate of skill acquisition to predict retention performance and the dose of practice necessary to achieve performance plateau during motor skill acquisition. 17 Additionally, this approach could enable the individualized prediction of the dose of practice required for rehabilitation of impaired motor skills after stroke. Understanding how skills are acquired on an individual level, beyond change scores, in the medical field has called into question the use of fixed numbers of procedures for credentialing and licensing. 18 Understanding the progression of learning through a proportional progress can help in the development of efficient practice paradigms in rehabilitation settings as the numbers of trials (ie, dose) necessary for motor learning may vary from person to person.
Presently, motor outcomes are described with summary values, such as mean response time or percent of correct responses, taken at discrete points in time to produce pre-post change scores.4-7,15 However, behavioral changes can be characterized using models that encompass the evolution of performance changes over time. For example, curve fitting uses all data points, as opposed to small blocks, and as such captures the overall trend or the “evolution of performance of practice.” The most suitable method for quantifying how performance evolves is the learning curve, as learning does follow a robust pattern of change, and suggests that practice always helps improve performance with the most observable improvements occurring in the early phase of practice. 19 In addition, with an adequate dose of practice individuals can achieve comparable levels of performance. 20 This work has considered healthy adults,15,21-24 and detected differences in motor skill acquisition in healthy people and individuals with stroke. 11 Yet, the application of these principles in clinical research has lagged. In addition, pre and post measurements have been viewed as limiting our understanding of the mechanisms actively involved in an intervention. 25 In a recent review discussing the neural mechanisms supporting stroke rehabilitation, pre- and posttesting was posed as a hindrance to our understanding of how an intervention works, disallowing the isolation of the “active ingredient” involved. 25 The benefit of an approach that estimates parameters, is that it does not restrict nor define change solely to initial and final performance, but instead captures a broad scope of skill acquisition compared with a discrete change score calculated from the beginning to end of practice. 26
Based on theoretical models of learning, in the current work we used an exponential function to generate a curve of improvement in implicit motor skill performance of a continuous tracking task (CTT) as a function of time.7,27 The use of a learning curve is advantageous in the investigation of the dynamic nature of performance as skill acquisition for the CTT involves known transitions throughout the learning process. 28 Modeling mean scores as a continuous curve, so neighboring blocks may have some influence on the succeeding block, accurately depicts the CTT learning process. Rather than calculating mean scores from each block individually, curve fitting incorporates more information to make a prediction; performance in the initial blocks sequentially influence performance in the latter blocks. Thus the purpose of the present study was 2-fold: (a) to derive and compare practice parameters estimated from an exponential function between individuals with stroke and a healthy control group during implicit motor skill acquisition and (b) to determine the relationship between estimated practice parameters within groups and the retention of performance following practice. We hypothesized that exponential curve fitting of implicit sequence-specific motor performance across 6 days of skilled motor practice would result in group differences in the predictor values that would be associated with retention test performance. In addition, we hypothesized that a clinical measure of motor function, the Wolf Motor Function Test (WMFT), when added to the regression model, would help to predict the magnitude of change associated with implicit motor learning.
Methods
Participants
The stroke (ST) group included 14 individuals with chronic middle cerebral artery (MCA) stroke (mean age = 64.7 years; SD = 7.24 years). Physical impairment level was assessed using the Fugl-Meyer (FM) upper extremity motor scale (mean = 52.7; SD = 13.0; maximal score 66). 29 Ten right-handed, older healthy individuals made up the control group (HC; mean age = 64.8 years; SD = 8.5 years) (Table 1). Individuals were recruited from the university and local communities. The rights of all participants were protected by the ethical review board at the University of British Columbia; each individual signed an approved institutional informed consent form prior to enrollment.
Participant Characteristics.
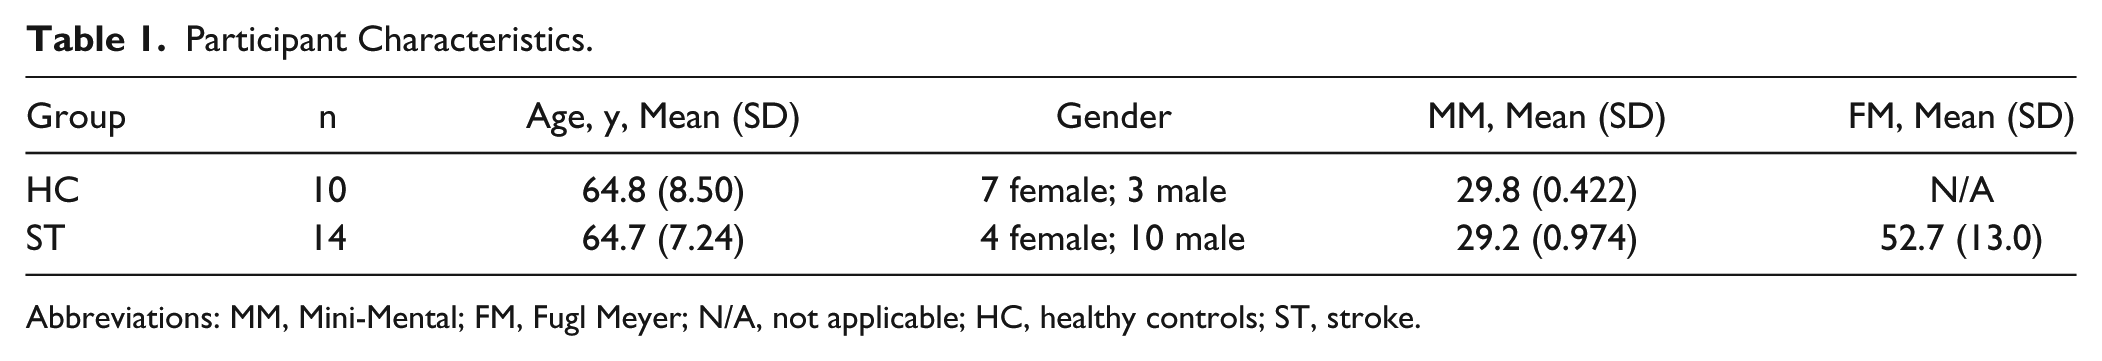
Abbreviations: MM, Mini-Mental; FM, Fugl Meyer; N/A, not applicable; HC, healthy controls; ST, stroke.
Experimental Design
Individuals participated on seven separate days over a 2-week span, with no more than 5 days between practice sessions. On the first day, the ST group completed the WMFT and both groups (ST, HC) performed 4 pretest training blocks (30 trials/block) of the CTT. Days 2 to 6 involved CTT practice and on day 7, a 24-hour retention test consisting of four blocks was performed (30 trials/block). We selected this dose of practice for our study as our past work has shown that it is enough to facilitate motor learning26,30; however, it is unclear whether it is a sufficient dose to lead to asymptote in performance. On each practice day (ie, days 2-6) participants practiced 100 trials (5 blocks; 20 trials/block); completion of each practice session took approximately 30 minutes (Figure 1A).
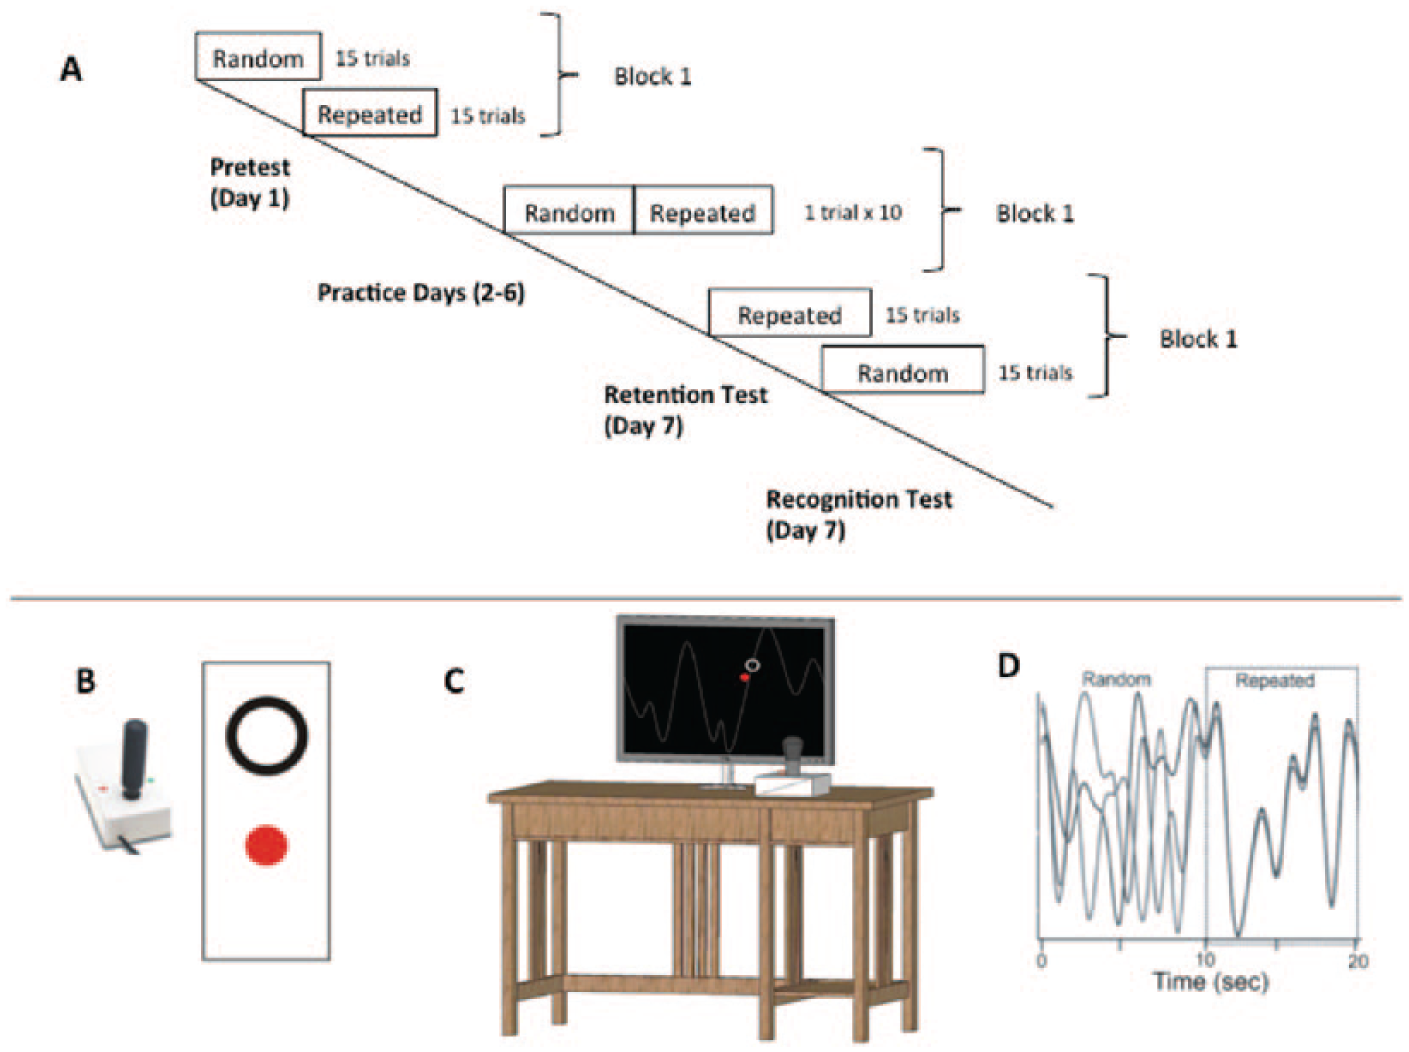
Continuous tracking task (CTT). (Panel A) During the pretest and posttest, the repeated and random waveforms segments were performed in separate blocks. During practice days (2-6) individuals tracked continuous 20-second waveform segments (multiple overlapping lines represent different trials) repeating sequences were flanked with random sequences in a single block (Panel D). (Panels B and C) Pictorial of the CTT apparatus used to perform the task during pre and posttesting and practice. Participants operated a joystick to move a closed red dot inside an open black circle on a computer screen. Examples provided for 1 block of practice only, see text for full details of the practice and testing schedule.
Motor Function Assessment
On day 1, the WMFT of upper extremity function was assessed by a registered physical therapist. Movement time to complete 15 items of the WMFT with the paretic and nonparetic arms was determined. A task rate was calculated as 60 seconds/performance time(s) with a score of “0” given if a participant was unable to perform the task. 30 The WMFT mean rate has been shown to be a more sensitive method to characterize motor function of the upper extremity in individuals with stroke. 30
Behavioral Task
The ST group used their paretic, left arm and the HC group used their nondominant, left arm to track the vertical path of a target with wrist movements that controlled a joystick (Current Designs Inc, Philadelphia, PA, USA). Participants’ movements were represented as a red filled circle and the target circle was outlined in white; both objects were visible on a black background (Figure 1B and C). See Wadden et al 31 and Supplementary Material for in-depth CTT details.
Motor performance was evaluated using root mean squared error (RMSE), which is the average difference between the target pattern and participant movements, and reflects overall tracking errors in the kinematic pattern. RMSE was calculated separately for random and repeating segments on every trial. For the pretest and retention test, performance in the first block (15 trials of both random and repeated sequences) was evaluated. For each participant, a pretest to retention test change score was calculated separately for random and repeated sequences (eg, mean RMSE on day 1, block 1 minus mean RMSE from block 1 at the retention test on day 7; Change ScoreDay1-7).
Practice Exponential Curve
Individual changes in implicit sequence-specific performance and motor control, as measured by the RMSE for repeated and random sequences, respectively, were fit to an exponential function with a least squares regression analysis. 29 RMSE value for each trial across the pretest (day 1) and 5 days of task performance (days 2-6) for each participant were parameterized using the following equation 32 :
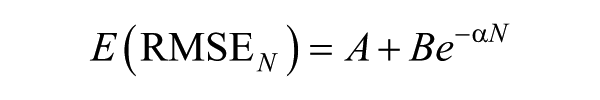
E(RMSE N ) is the expected value of RMSE on practice trial N; A is the expected value of RMSE after practice has been completed (asymptote parameter); B is the change in the expected value of RMSE from the beginning of practice to the end of practice (change score parameter); alpha (α) is the exponential learning rate parameter (Figure 2 for HC single subject example). 27
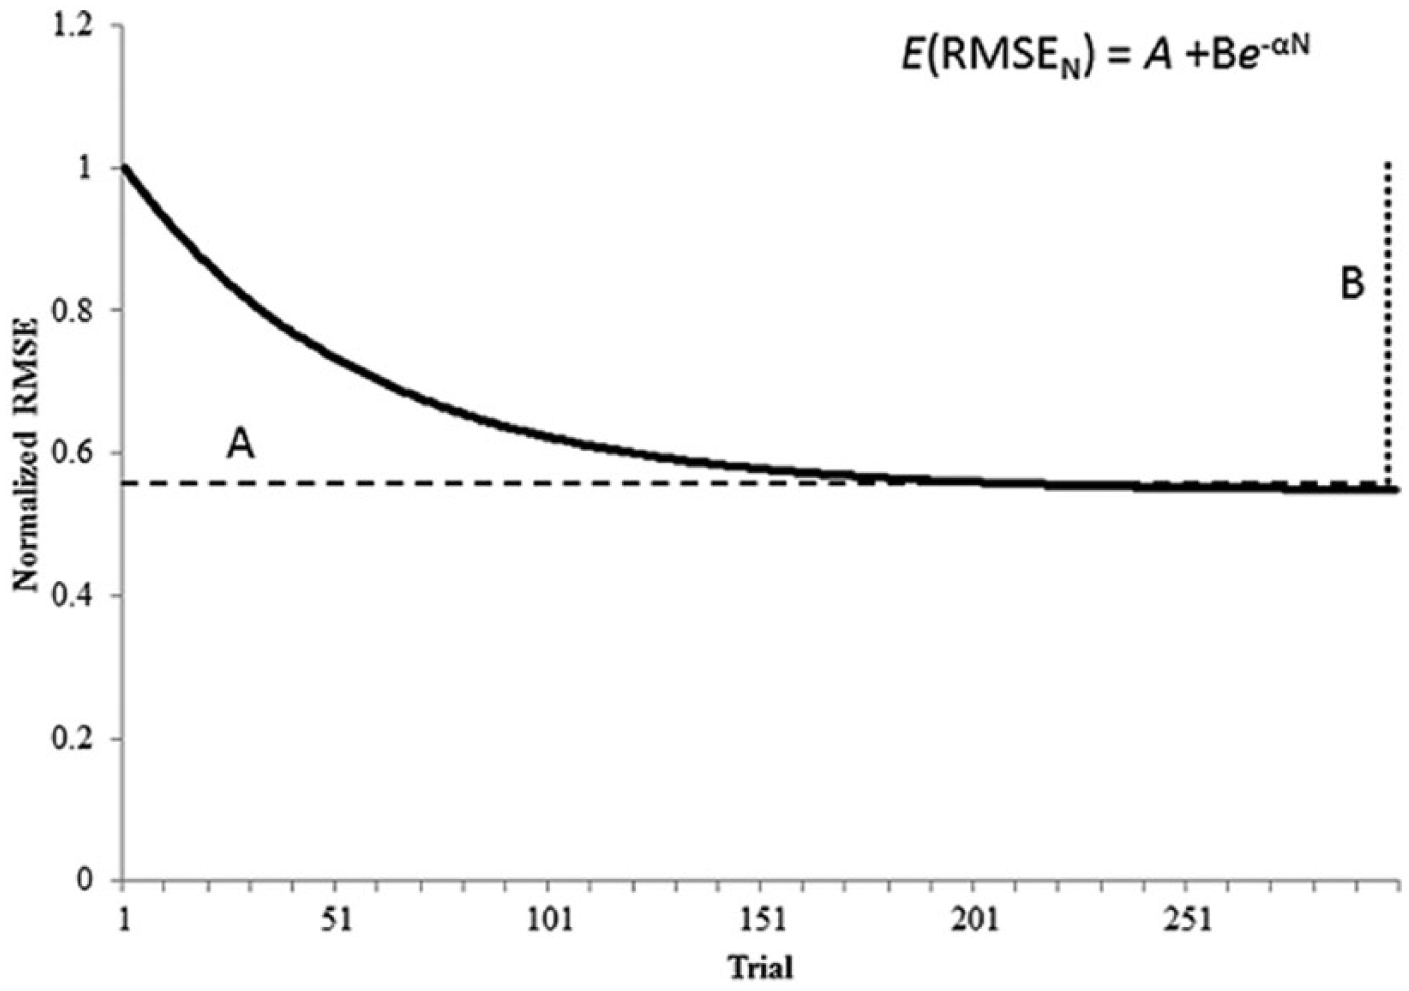
Skill acquisition follows an exponential decay as performance improves. Fitting root mean square error (RMSE) data extracted from a motor skill practice to the function, E(RMSE N ) = A + B−αN, produced practice parameters based on the nonlinear decay of performance during skill acquisition. E(RMSE N ) is the expected value of RMSE on practice trial N; A is the expected value of RMSE after practice has been completed (asymptote parameter); B is the change in the expected value of RMSE from the beginning of practice to the end of practice (change score parameter); alpha (α) is the exponential rate parameter. 27 Data shown here were derived from a sample healthy control participant.
Retention Test Score
A retention test score (RTS) was calculated to determine the change in motor behavior associated with learning. By accounting for early practice performance and the change score parameter, B, as predicted from the exponential function, a direct comparison between practice and retention was possible. The mean RMSE for block 1 for the pretest (day 1) and retention test were calculated (RMSEPT and RMSERT, respectively).33,34 The RTS was determined as follows:
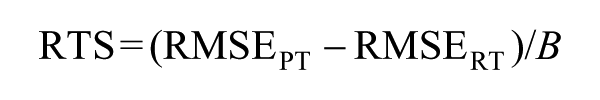
In this equation, a higher score indicates better retention (ie, larger change in motor behavior) of the motor skill. The RTS is interpreted as the increase or decrease in performance following the retention interval, and has been deemed the most informative measure of retention. 35
Predicting Dose of Practice to Asymptote
To evaluate the predictive capabilities of the exponential function to determine optimal dose of practice for motor learning, the exact trial was calculated that indicated individual performance was within 1% tolerance of the A value. The number of trials until asymptote was determined by the following equation:
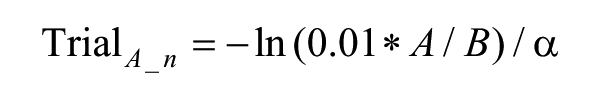
Trial A_n is the expected trial N until asymptote; A is the expected values of RMSE after practice has been completed (asymptote parameter); B is the change in the expected value of RMSE from the beginning of practice to the end of practice (change score parameter); α is the exponential learning rate parameter (Figure 2). 27
Statistical Analysis
Motor Performance
A between-group analysis of variance (ANOVA) was used to evaluate differences in motor performance between ST and HC groups on mean practice RMSEDays1 to 6 for each sequence separately (repeated and random).
Separate between-group multivariate analysis of variance (MANOVA) for each sequence (repeated and random) were used to evaluate differences in motor performance between ST and HC groups on the exponential practice parameter dependent measures (A, B, α) derived from the exponential function.
Motor Learning
Between-group ANOVAs were used to evaluate differences in motor learning for individuals in the ST and HC groups using mean retention RMSE and Change ScoreDay1-7 separately for each sequence as the dependent measures (repeated and random).
A between-group ANOVA was used to evaluate differences in motor performance for individuals in the ST and HC groups with the RTS ((RMSEPT − RMSERT) / B) for each sequence as the dependent measure (repeated and random).
To evaluate the relationship between exponential practice parameters and RTS in the HC group, simple linear regression analyses were conducted, where the rate of skill acquisition parameter, α, was regressed on the RTS separately for repeated and random sequences. 1 Because stroke-related movement deficits may interfere with motor behavior, we conducted hierarchical regression analyses in the stroke group designed to examine the relationship between α and RTS while accounting for individuals’ level of motor function. These hierarchical regression analyses were conducted separately for the repeated and random sequences; paretic WMFT rate was entered as a predictor in the first block, and the rate of skill acquisition parameter, α, was entered in the second block and these variables regressed on the RTS.* The variance inflation factor (VIF) and tolerance statistics indicated minimal collinearity within the data as VIF value was less than 2.0. 36
Prediction of Optimal Dose
A between-group ANOVA was used to evaluate differences in the predicted numbers of trials until asymptote between individuals with chronic stroke and healthy individuals on the log transformed Predicted trialA_n by Group (ST, HC) for each sequence (repeated and random).
For all statistical tests, significance level was set to P < .05. SPSS 22.0 (IBM Corp, Somers, NY, USA) statistical software was used for analyses. A Bonferroni correction was used on post hoc analyses to correct for multiple comparisons.
Results
Differences in Motor Performance Metrics Between ST and HC Groups
During practice, there was a near significant difference and significant difference between groups (ST, HC) in mean RMSE for repeated and random sequence (mean practice RMSEDays 1 to 6). Across practice days, the ST group demonstrated worse performance than the HC group; mean RMSE for the repeated sequence for the ST group was 13.02 (SD = 3.75) and for the HC group mean RMSE was 9.7 (SD = 4.12), F(1, 22) = 4.255, P = .051,
Using our exponential function to characterize change in motor performance across practice we discovered a significant main effect of group (ST, HC) for the exponential practice parameters derived from the repeated sequences (A, B, α), Wilks’ λ = 0.614, F(1, 20) = 4.198, P = .019,
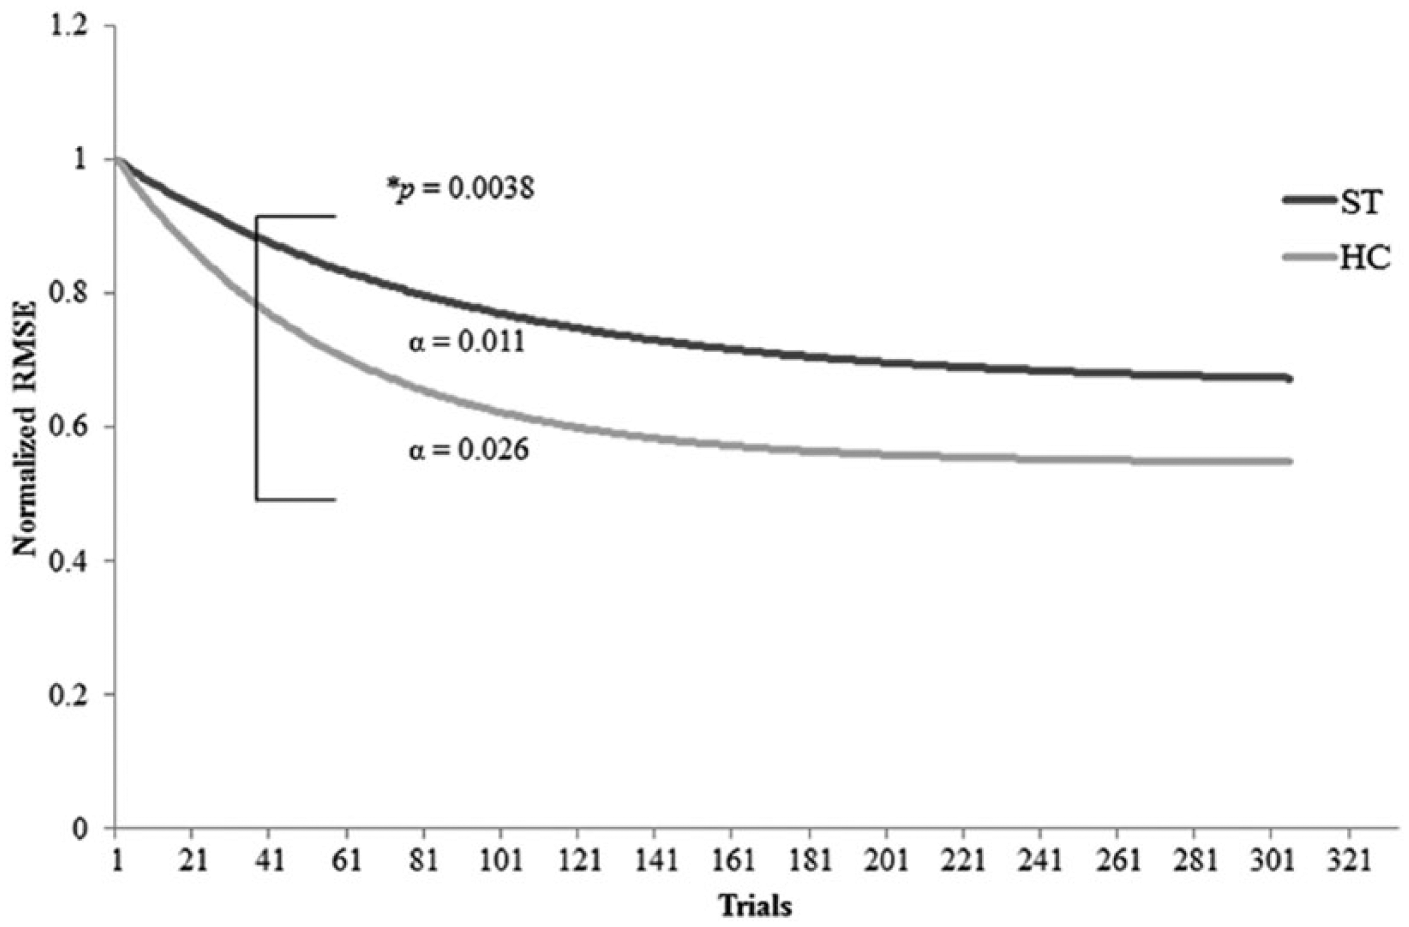
Repeated sequence practice curves showing a significant difference between the healthy controls (HC) and stroke (ST) groups for exponential practice parameters for the extracted alpha (α) value, F(1, 22) = 4.9, P = .0038,
Differences in Motor Learning Metrics
At retention, there was significant main effect of group (ST, HC) for mean RMSE for repeated sequence and near significant difference for random sequence as detected by the ANOVAs. Similarly to practice, the ST group performed worse than the HC group at retention; mean RMSE for the repeated sequence was higher in the ST group (11.8; SD = 4.51) than the HC group (8.2; SD = 1.74) F(1, 22) = 5.732, P = .026,
Using our exponential function to characterize change in motor learning from practice to retention, there was no significant main effect of group (ST, HC) on the RTS for repeated and random sequence as detected by the ANOVAs. The RTS for the repeated sequence for the ST group was 0.55 (SD = 0.385), and for the HC group was 0.63 (SD = 0.248), F(1, 22) = 0.286, P = .598,
Relationship Between α and Retention Score for HC Group
Simple linear regressions were used to evaluate the relationships between α and the RTS ((RMSEPT − RMSERT) / B) for both repeated and random sequence performance for the HC group. The practice parameter, α, accounted for significant variance in repeated sequence RTSs (R 2 = .465, F(1, 8) = 6.952, P = .03) (Figure 4A), indicating a significant relationship between rate of skill acquisition in practice and motor behavior at the retention test; however, this was not observed in the analysis of random sequence performance at the retention test (R 2 = .094, F(1, 8) = 0.827, P = .39, respectively).
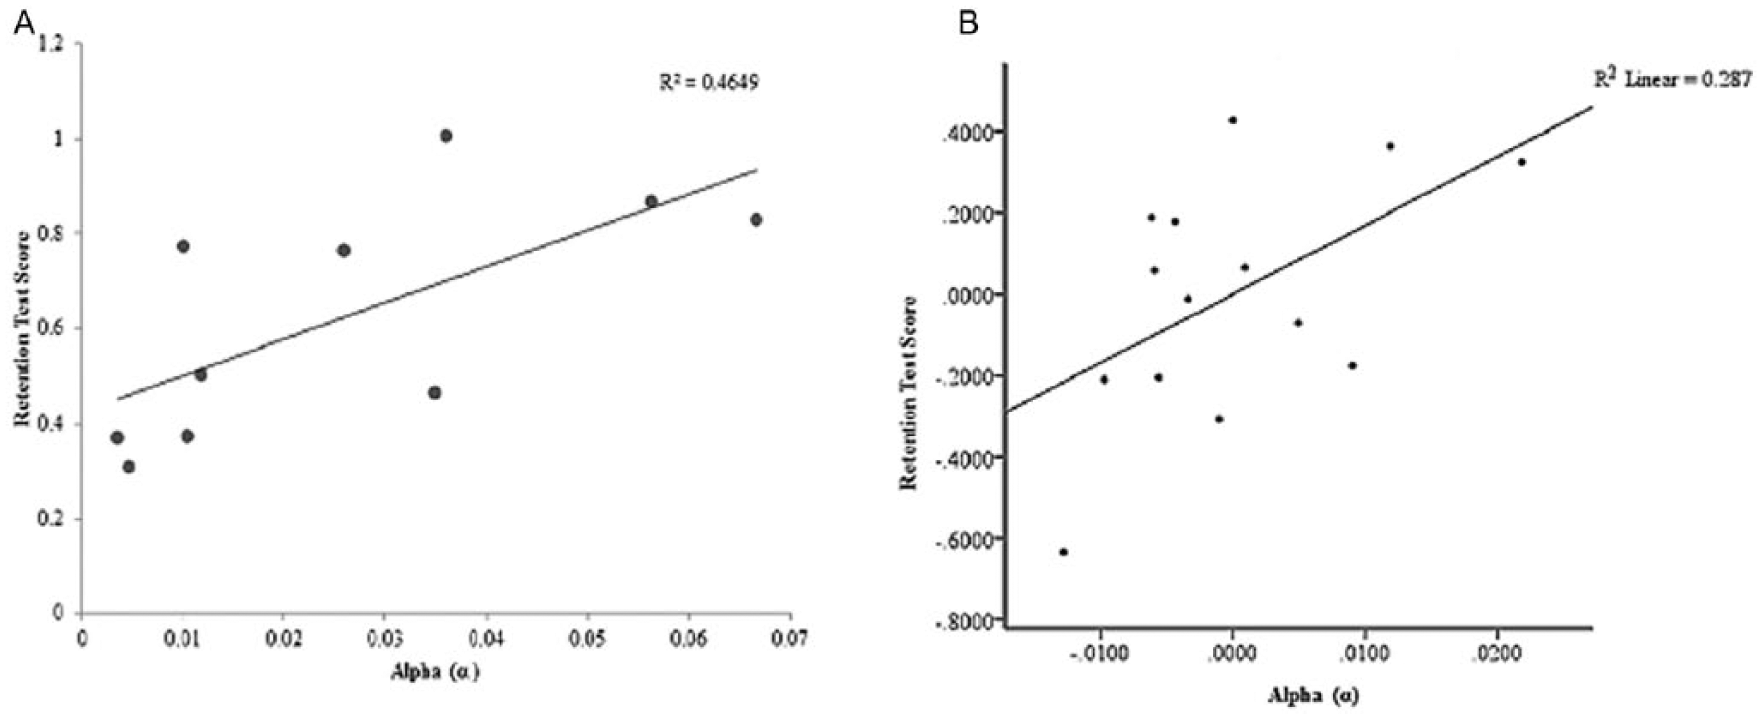
(A) Relationships of retention test score (RTS) and alpha (α) during repeated sequence performance in healthy individuals (healthy controls [HC] group) (P < .05). (B) Partial plot generated by hierarchical regression analysis for repeated sequence performance. The relationship between RTS and α was significant after accounting for Wolf Motor Function Test (WMFT) rate for the hemiparetic limb in individuals with chronic stroke (ST group) (P < .05).
Relationship Between α, WMFT, and RTS for ST group
In the hierarchical regression models, paretic WMFT rate accounted for significant variance in RTS for both repeated and random sequences (R 2 =.424, F(1, 12) = 8.825, P = .012; R 2 = .410, F(1, 12) = 8.335, P = .014, respectively). Addition of α in the second block significantly improved the repeated sequence model (ΔR 2 = .165, F(1, 11) = 4.425, P = .05) (Figure 4B, Table 2), indicating a significant relationship between α and repeated sequence RTS when accounting for level of motor function. In contrast, addition of α did not significantly improve the random sequence model (ΔR 2 = .059, F(1,11) = 1.229, P = .291). The VIF was 1.074.
Summary of Regression Modeling for Repeated Sequence for Individuals With Stroke.
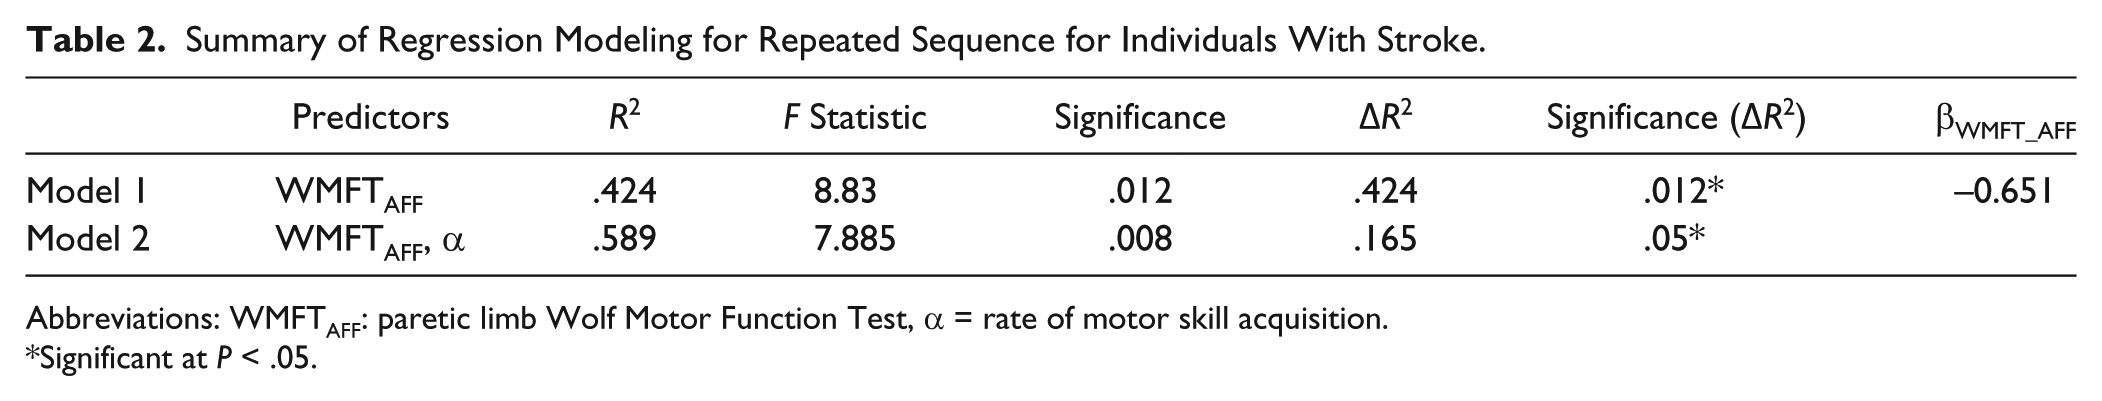
Abbreviations: WMFTAFF: paretic limb Wolf Motor Function Test, α = rate of motor skill acquisition.
Significant at P < .05.
Predicted Dose of Practice Between ST and HC Groups
There was not a significant main effect of group (ST, HC) for repeated and random sequence in predicted number of trials to asymptote (Predicted trialA_n) by the ANOVAs. Predicted trial
A
_
n
for repeated sequence performance was greater for the ST than the HC groups for the repeated sequences (ST predicted trials = 1755.2, SD = 3504.68; HC predicted trials = 414.3, SD = 436.66), F(1, 22) = 2.968, P = .099,
Testing of Explicit Knowledge
Participants could only recognize sequences at a chance level, and failed to gain explicit knowledge of the repeated sequence. The ST group correctly identified 53.4% of sequences; the HC group accurately recognized 53.3%.
Discussion
The present study demonstrates that individual implicit sequence-specific motor learning can be successfully modeled by an exponential function and this shows significant relationships with the retention of the newly learned motor skill. During motor sequence acquisition individuals with chronic stroke demonstrated significantly slower improvements in skilled motor performance compared with the HC group. Inferior motor sequence performance and retention by individuals with stroke as compared with matched controls has been previously reported.22,32 The current study expands on these previous findings11-14; the rate of motor skill acquisition both differed between individuals with stroke and healthy controls and was predictive of changes in motor learning when combined with clinical measures of motor function. The HC group showed a positive relationship between a faster rate of change in motor performance during practice and superior performance at the delayed retention test for the repeated sequence. Interestingly the same relationship was shown for individuals with stroke after we accounted for overall motor function by including WMFT rate in our model. Thus when controlling for level of clinical motor function, the rate of motor skill acquisition during practice related strongly with individuals’ ability to retain previously acquired motor skills.
A pre- to posttesting approach ignores large amounts of information that characterizes individual capacity for change, rate of improvement and time to asymptote. Within-individual variability has been reported to be between 37% and 53% of between-individual variability, which challenges the idea that motor performance on 1 day represents a person’s characteristic performance. 37 Furthermore, when motor performance scores, such as clinical outcome measures, are used to prognosticate and determine whether therapeutic resources should be deployed, a measurement at a single point in time may not adequately reflect the full potential of the individual. Findings from the present study in combination with previous motor learning literature, 38 demonstrate that performance across multiple practice sessions may be useful in predicting the retention of motor skills. Here we extend this finding and showed that for individuals with stroke, incorporating clinical assessment measures of motor function (WMFT), enhanced our ability to predict capacity to learn a new motor skill. RTS was calculated from ratio of the exponential derived parameter B (similar to the change score from the beginning to the end of practice) and the change in performance from the beginning to retention. This is a unique approach as a change in practice performance (y values) across their entire practice (x values) is based on their expected asymptotic value A. Parameterizing practice and learning to an individual’s predicted performance values may offer more insight into her or his potential capacity for change beyond constraints of the limited number of trials.
The asymptotic value that we derived in the present work describes the estimated value of an individual’s performance when an apparent plateau is achieved. Some individuals may achieve their asymptote relatively quickly, while others may take substantially more trials to do so, which will significantly affect the α value. We did not observe a significant difference in the predicted trial to asymptote between individuals with stroke and healthy controls. This finding may result from our testing of individuals with relatively mild levels of stroke related motor impairment (average upper extremity Fugl-Meyer motor score 52 of 66). However, calculating predicted time to asymptote (A) immediately following practice has the potential to guide decisions regarding the correct dose of practice required for optimal improvement in motor behavior and functional outcomes. Optimal dose of practice is an attractive concept in the field of rehabilitation following stroke as the dose required for neuroplastic change to occur is extremely high. 2 The optimal dose of practice is an individualized number of repetitions a patient would need in order to maximize retention of the desired task. Because of the exponential nature of learning, if dose prescription could be calculated based on performance data from individual learning curves and therapists could quantify an amount of practice necessary for the retention of motor skills, then the somewhat abstract concept of dose could become a tangible notion. In addition, this predictive methodological approach may not only specify if the individual may require more practice trials but also provide an indication of the challenge level of the practice session. If the practice or rehabilitation session was too easy, the predicted rate of skill acquisition during practice will be high and the number of trials to asymptote low; this may translate into lower long-term retention of the motor skill performance.39,40 Thus, the present study contains a roadmap for future rehabilitation research that employs predictive models of motor learning based on individual performance curves and clinical characteristics of motor function.
Limitations and Future Directions
There are limitations to the present study. We studied a relatively small (n = 14) group of mildly impaired individuals with stroke. This limits our ability to form robust association between practice parameters, clinical measures and motor learning. To increase the ecological validity between clinical research and rehabilitation settings, where tests are administered by researchers and treatments are delivered by clinicians, respectively, a deeper understanding of the performance and learning relationship must be achieved in larger patient populations and across a variety of motor tasks. We do not claim that our curve fitting approach is better than other methods; instead we present it as an alternative method that captures different data that are useful in understanding patterns of change and doses of practice associated with motor learning. Additionally, we present the idea that information about patterns of change may be more helpful in the rehabilitation setting than is pre to post characterization of behavioral change. Performance in each block of practice are connected, meaning performing a block will make the participant better at the task, and thus perform better in the next block. 41 Rather than narrowing our focus on the performance score of one block of data in sequential order, functional forms (ie, exponential function) fit a curve through the middle of all the data. Neighboring blocks have an influence on performance score the participant is predicted to obtain in each block, which is more ecological valid and representative of the learning process. Better characterization of skill acquisition measures could enable data-driven manipulation of motor practice (to ensure adequate dose of practice is delivered) and task (to optimize rates of change). Together, these shifts should enhance the impact of practice or rehabilitation sessions to optimize motor learning.
Conclusions
While rates of skill acquisition have been used to quantify performance following stroke, no study has investigated the association with retention performance. Furthermore, the use of exponential functions to estimate the number of trials until plateau in motor behavior has not been considered. Therefore, we propose an innovative use for these curvilinear measures. Individualized dose of practice is an important step in the field of rehabilitation following stroke, not only to attain economic efficiency but also to work toward optimizing personalized treatment plans. Currently, the most documented use of learning curves in a practical setting is the evaluation of skill acquisition for health care professionals.42-44 In a rehabilitation setting, where individuals with stroke are receiving interventions to relearn motor skills, learning curves could be used to determine an individualized set number of trials that predict when performance will reach a plateau. In addition, the rate of skill acquisition between different interventions could be compared to determine practice conditions (ie, feedback, contextual interference) that yield a more productive method of learning. For example, if the physiotherapist understands the normal or excepted and rate of skill acquisition then she or he can determine suitable practice conditions to positively affect the length of time and difficulty level to achieve an intended outcome. If the rate of skill acquisition is abnormally slow, the physiotherapist could decrease the level of difficulty, that is, increase the target size, shorten the distance of a reaching task, and so on. If performance is only assessed by the final level of behavior then large amounts of valuable information are lost that could have been used to update how interventions were being administered. Prescribing rehabilitative exercises based on predictive values could help to construct an idealized practice paradigm on a subject wise basis.
Footnotes
Declaration of Conflicting Interests
The authors declared no potential conflicts of interest with respect to the research, authorship, and/or publication of this article.
Funding
The authors received no financial support for the research, authorship, and/or publication of this article.
*
There was no significant relationship between the exponential function parameters alpha (α) and B within the ST and HC groups (P = .425). Therefore, the parameter B, used to calculate the retention score and did not confound the correlational analysis between practice parameter α and the retention score.