
Abstract
Background. After cerebral ischemia, disruption and subsequent reorganization of functional connections occur both locally and remote to the lesion. Recently, complexity of brain connectivity has been described using graph theory, a mathematical approach that depicts important properties of complex systems by quantifying topologies of network representations. Functional and dynamic changes of brain connectivity can be reliably analyzed via electroencephalography (EEG) recordings even when they are not yet reflected in structural changes of connections. Objective. We tested whether and how ischemic stroke in the acute stage may determine changes in small-worldness of cortical networks as measured by cortical sources of EEG. Methods. Graph characteristics of EEG of 30 consecutive stroke patients in acute stage (no more than 5 days after the event) were examined. Connectivity analysis was performed using eLORETA in both hemispheres. Results. Network rearrangements were mainly detected in delta, theta, and alpha bands when patients were compared with healthy subjects. In delta and alpha bands similar findings were observed in both hemispheres regardless of the side of ischemic lesion: bilaterally decreased small-worldness in the delta band and bilaterally increased small-worldness in the alpha2 band. In the theta band, bilaterally decreased small-worldness was observed only in patients with stroke in the left hemisphere. Conclusions. After an acute stroke, brain cortex rearranges its network connections diffusely, in a frequency-dependent modality probably in order to face the new anatomical and functional frame.
Introduction
Several studies have revealed that after cerebral ischemia, disruption and subsequent reorganization of functional brain connections occur both locally and remote to the lesion.1-6 Recently, complexity of brain connectivity has been described using graph theory, a mathematical approach that depicts important properties of complex systems by quantifying topologies of network representations. 7 In this model, anatomically defined brain regions are represented as nodes (vertices), while links (edges) between pairs of nodes represent functional or effective connectivity. While effective connectivity is used to test hypothesis concerning coupling of brain structures that have been proved experimentally, 8 functional connectivity is aimed to simply establish if there is a statistically significant correlation, in the domain of frequency and/or time, between activities in separate brain areas.8,9 For this reason functional connectivity is applied in resting-state paradigms, in which there are minimal performance confounds when studying patients who may have functional deficits. 8 Brain functional activity requires a balance between local specialization and global integration. 10 This balance is properly quantified by 2 graph indices, namely, clustering coefficient (C), an index of functional segregation, and path length coefficient (L), an index of functional integration.11,12 A connectivity pattern characterized by high C and short L, known as a small-world network model, 13 reflects the need of the brain networks to satisfy the parallel and integrated needs of local and global processing. 14 Recently, some topological studies have demonstrated that stroke can disrupt the balance and chronology between local processing and global functioning brain interconnections.6,15 Moreover, it has been demonstrated that the recovery process of motor deficits after stroke is associated to the shift of the motor execution network toward a more random mode, 15 which could be a common final pathway of brain reaction to acute lesions or slowly progressive neurodegenerative processes.12,16-22 Nowadays, the available data on the functional reorganization after stroke in terms of small-worldness are mainly derived from connectivity studies based on resting-state functional magnetic resonance imaging.6,15 However, cortical electroencephalography (EEG) activity is a mix of overlapping electrical signals with a level of integration extremely different according to the functional state 23 and/or the presence of pathological lesions, the slow frequencies being more present in the “disconnected” state. 24 EEG signals reflect spontaneous time-varying oscillations of postsynaptic excitatory/inhibitory potentials of pyramidal cells at the cortical level, and hence, EEG rhythmic oscillations are directly related to cyclic firing of the neuronal assemblies; moreover, EEG can reach a time discrimination of few tens of milliseconds when faster frequencies (ie, beta and gamma) are analyzed. 25 Oscillatory signals and phase changes in and across different frequencies of rhythmic oscillations at the various scalp sites where the EEG signals are simultaneously recorded describe the functional state of the underlying cortical networks; this type of information is complementary to that obtained from BOLD signals reflecting time-varying neurovascular coupling. EEG studies report that delta activity and depression of faster alpha or beta rhythms in the ischemic hemisphere26-28 as well as the increase of delta power in the unaffected hemisphere predict poor clinical outcomes. 29 Moreover, resting-state EEG coherence analysis in stroke patients shows that decrease in alpha band functional connectivity between a given node and the rest of the brain is highly predictive of permanent deficits in the function of the disconnected brain area corresponding to the node. 24 On the contrary, coherence between contralesional areas and the rest of the brain is negatively associated with patient performance. 24 For instance, during a finger extension task, EEG alpha band coherence is reduced in the stroke hemisphere, while EEG beta band coherence is relatively increased in the contralateral hemisphere, indicating functional integration of the contralesional region around the central sulcus in the reorganized cortical network. 30 One previous pioneering study depicted the cortical network reorganization in one stroke patient during a finger-tapping task by using a graph theory approach applied to EEG signals. 31 The authors found a reduced functional segregation and integration in beta and gamma bands reflecting a lower local and global functional communication between nodes. Altogether these findings are consistent with a bilateral frequency-dependent disruption of functional connectivity in stroke. However, whether acute stroke causes a frequency-dependent modification of small-world cortical architecture at rest is unknown at present. In this review, we investigated whether ischemic stroke may determine changes in small-worldness of the cortical networks as measured by graph theory methodology applied on cortical sources of EEG data in the resting state condition. The evaluation of C and L changes in the acute poststroke stage is pivotal to the analysis of poststroke cortical remodeling approached via graph theory connectivity measurement and also for follow-up studies aiming to test whether these EEG parameters could represent markers for functional recovery prognostication.
Methods
Participants
Thirty consecutive patients (mean age 66.3 years, SD 10.6; 23 males and 7 females) with ischemic lesion in the territory of the middle cerebral artery, regardless of the side, location, and extension of the lesion, were enrolled within 5 days after the stroke onset. Patients with previous ischemic stroke and with hemorrhagic stroke were excluded. The patients were clinically evaluated by the National Institutes of Health Stroke Scale (NIHSS) at the moment of EEG recording and 3 months after stroke. The lesion load was coded by the ASPECT score. Table 1 shows clinical and demographic data of the enrolled stroke patients. Furthermore, 30 age- and sex-matched healthy subjects (mean age 65.6 years, SD 11.1; 21 males and 9 females) were included in the study as a normative control group. All patients and controls were right handed.
Clinical and Demographic Characteristic of Stroke Patients.
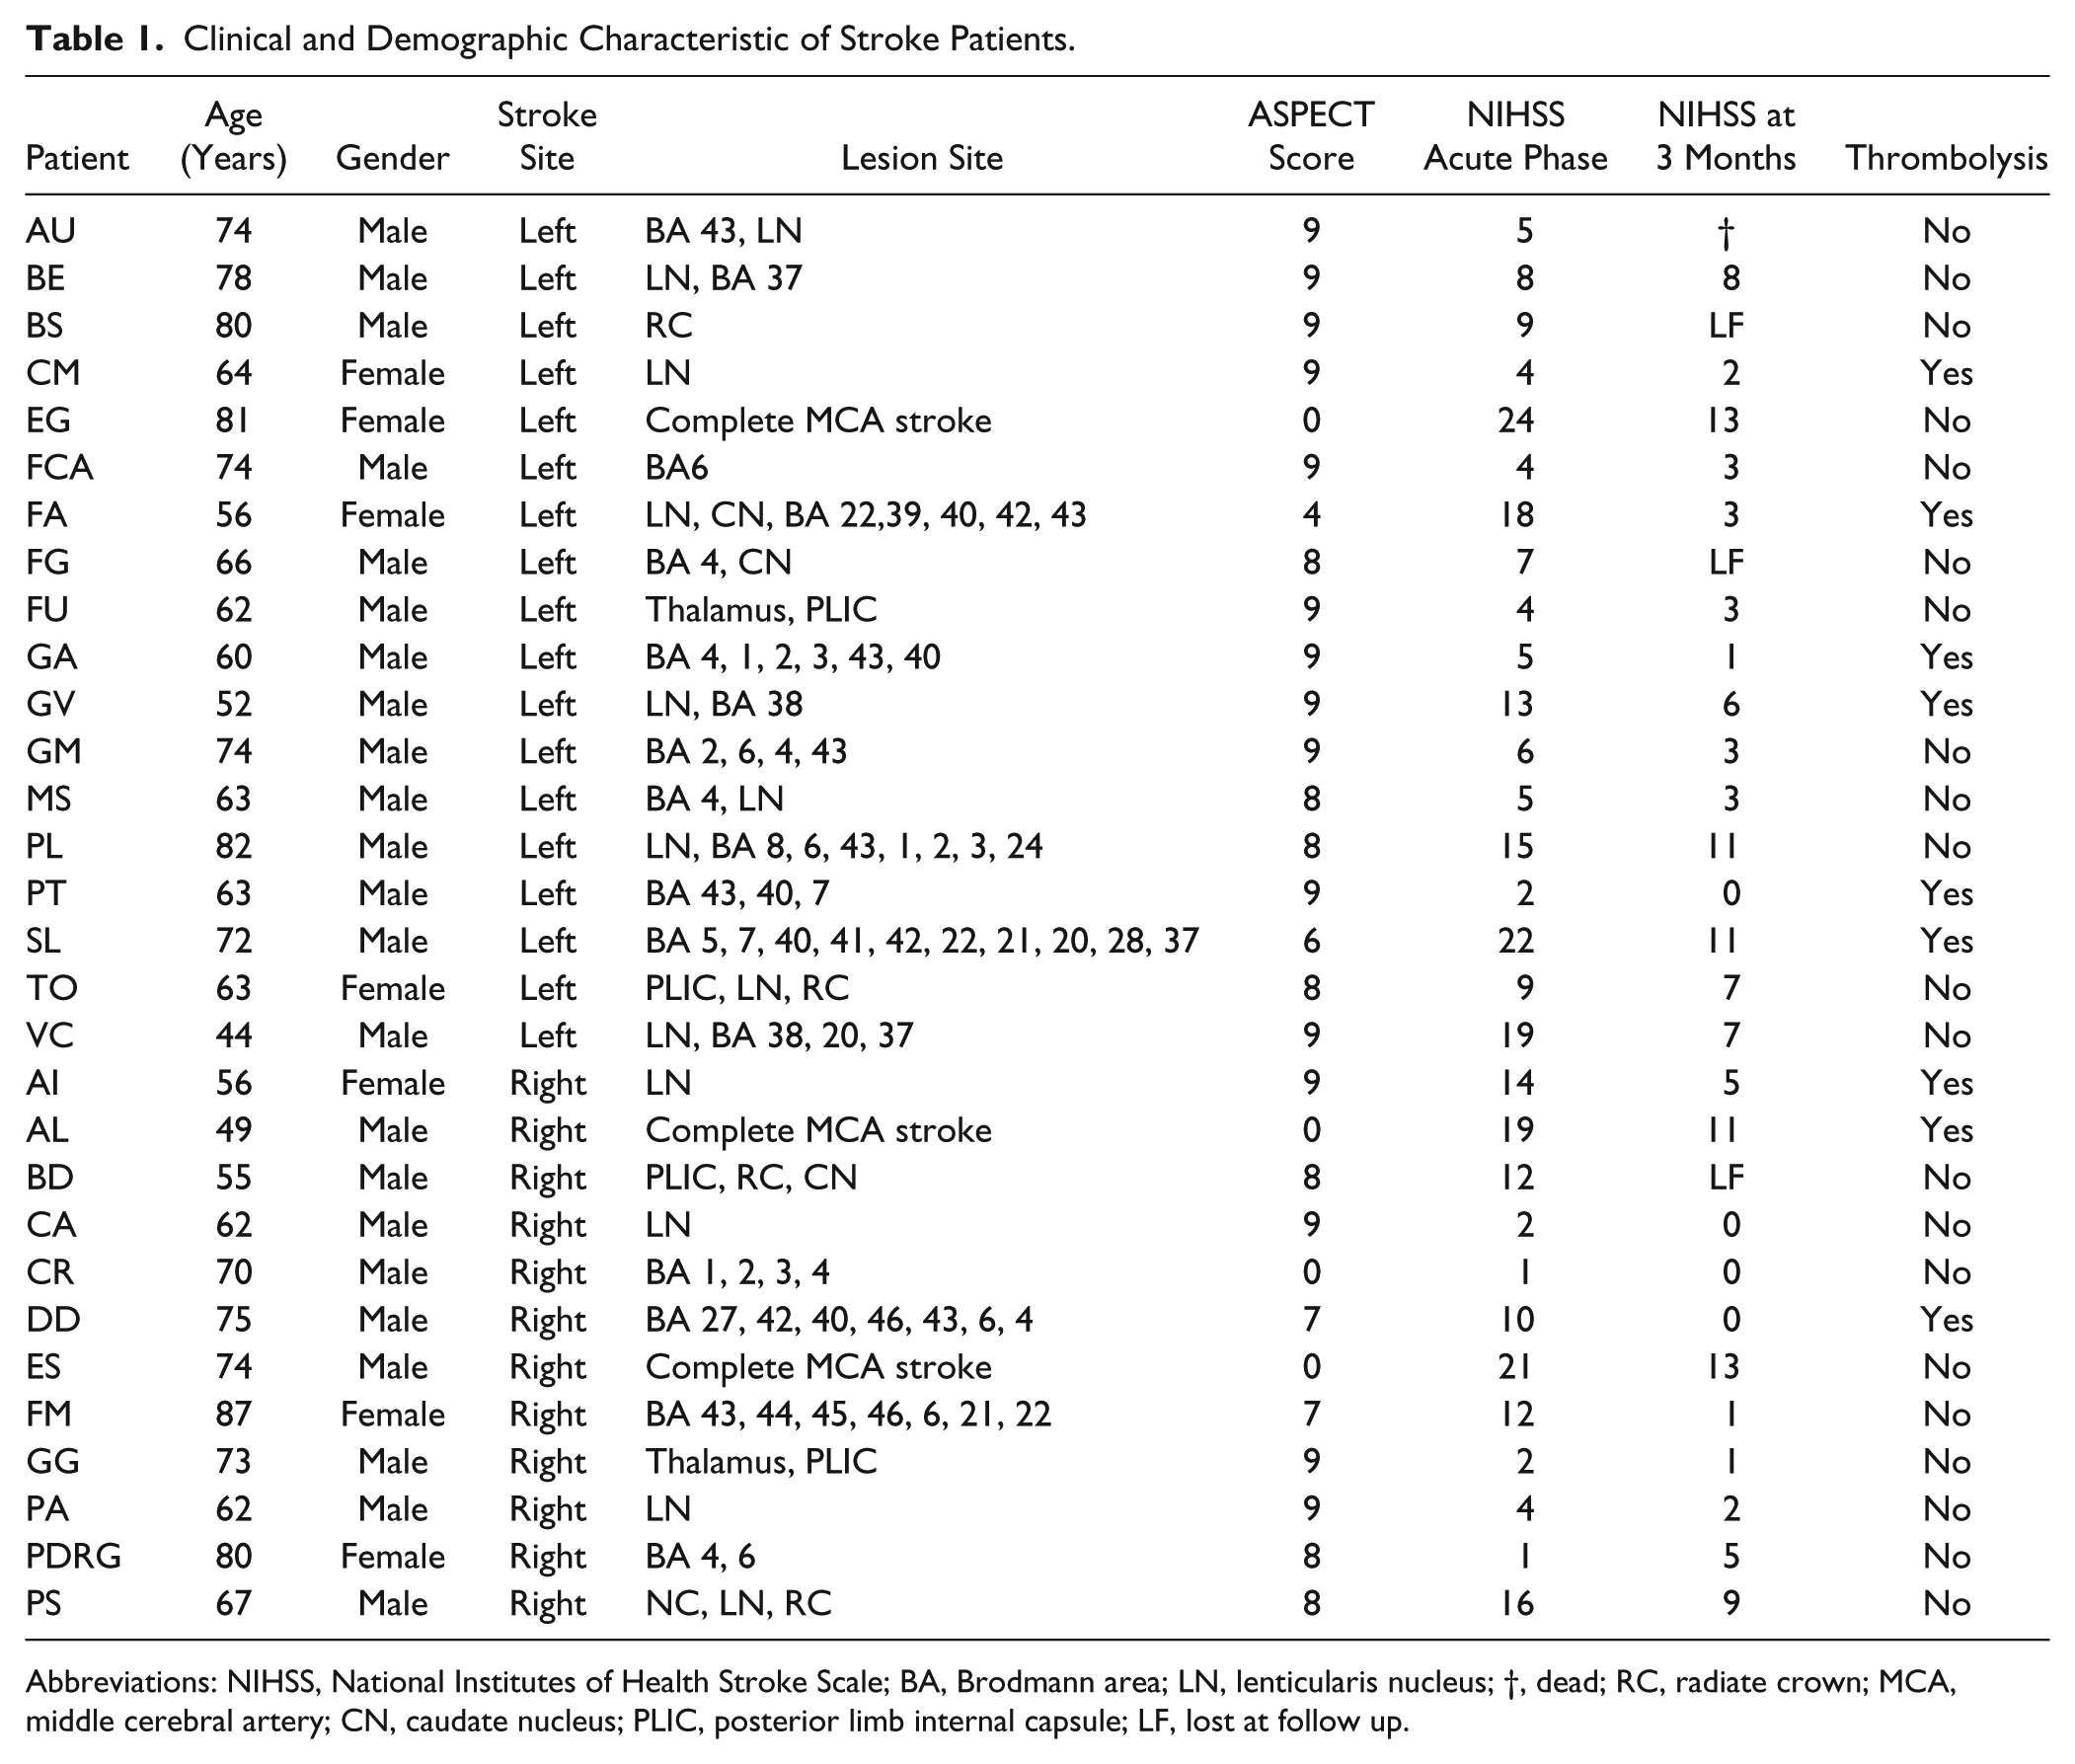
Abbreviations: NIHSS, National Institutes of Health Stroke Scale; BA, Brodmann area; LN, lenticularis nucleus; †, dead; RC, radiate crown; MCA, middle cerebral artery; CN, caudate nucleus; PLIC, posterior limb internal capsule; LF, lost at follow up.
Electrophysiological Recordings and Data Preprocessing
The EEG recording was performed at rest, with eyes closed and no task condition for at least 5 minutes, while the subject was in a sound-attenuated and dimly lit room. Electroencephalographic signals were recorded from 19 electrodes (Fp1, Fp2, F7, F8, F3, F4, T3, T4, C3, C4, T5, T6, P3, P4, O1, O2, Fz, Cz, and Pz) positioned according to the international 10 to 20 system. The monitoring of the eye movements was obtained from 2 different channels: vertical and horizontal EOGs. Skin/electrode impedances were lowered below 5 kΩ. Data were analyzed with Matlab R2011b software (Math Works, Natick, MA) and using scripts based on the EEGLAB 11.0.5.4b toolbox (Swartz Center for Computational Neurosciences, La Jolla, CA; http://www.sccn.ucsd.edu/eeglab). The EEG recordings were band-pass filtered from 0.2 to 47 Hz using a finite impulse response filter, and the sampling rate frequency was set up at 256 Hz. In order to eliminate interference caused by ocular, muscular, cardiac, and other types of artifacts, imported data were fragmented in 2-second epochs and used 2 processes. First, the data were reviewed, and the epochs with aberrant waveforms were manually discarded (no evident epileptiform activity was detected in the studied subjects). Second, detection and rejection of artifacts were completed through independent component analysis (ICA) using the Infomax ICA algorithm, 32 as implemented in the EEGLAB. ICA is a blind source decomposition algorithm that enables the separation of statistically independent sources from multichannel data. It has been proposed as an effective method for separating ocular movements and blink artifacts from EEG data.33-35 The components were visually inspected and epochs containing artifacts were discarded.
Graph Theory Estimates
Functional Connectivity Analysis
EEG power spectral and connectivity analysis have been performed using the exact low-resolution electromagnetic tomography eLORETA software,19,36 as provided by Roberto Pascual-Marqui (The KEY Institute for Brain-Mind Research University Hospital of Psychiatry, Zurich;http://www.uzh.ch/keyinst/NewLORETA/LORETA01.htm). The eLORETA algorithm is a linear inverse solution for EEG signals that has no localization error to point sources under ideal (noise-free) conditions. 37
Following whole brain sources reconstruction, connectivity was computed by sLORETA/eLORETA software in the whole brain on 84 regions of interest (ROIs) and separately for the left and right hemispheres, on 42 ROIs for each hemisphere defined according to the 42 Brodmann areas (BAs 1, 2, 3, 4, 5, 6, 7, 8, 9, 10, 11, 13, 17, 18, 19, 20, 21, 22, 23, 24, 25, 27, 28, 29, 30, 31, 32, 33, 34, 35, 36, 37, 38, 39, 40, 41, 42, 43, 44, 45, 46, 47). ROIs in the 2 networks are needed for the estimation of electric neuronal activity that is used to analyze brain functional connectivity.
In the patients group, we evaluated EEG power spectra in 6 ROIs for each hemisphere, defined on the basis of BAs, corresponding to the following brain lobes: frontal, central, parietal, occipital, temporal, and limbic regions. Power in each frequency was compared between homologous ROIs of the 2 hemispheres.
In the whole brain and separately in each hemisphere, among the eLORETA current density time series of the ROIs, intracortical Lagged Linear Coherence, extracted using a sphere with 19 mm of radius,38,39 was computed between all possible pairs of the ROIs for each of the 7 independent EEG frequency bands of delta (2-4 Hz), theta (4-8 Hz), alpha 1 (8-10.5 Hz), alpha 2 (10.5-13 Hz), beta 1 (13-20 Hz), beta 2 (20-30 Hz), and gamma (30-45 Hz) rhythms for each subject.
The Lagged Linear Coherence in the frequency band ω is defined by the following equation3,38:
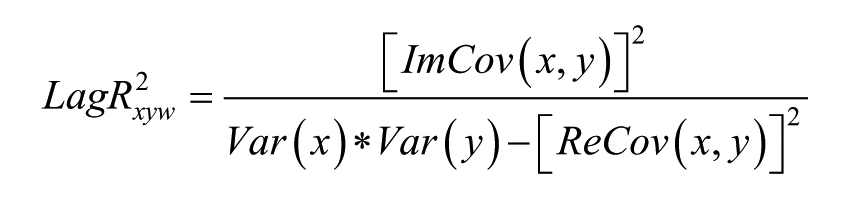
where x and y are the time series of 2 BAs, Im and Re are the imaginary and real parts, Var and Cov are variances and covariance of the signals (for more details see Pascual-Marqui 38 ).
Graph Analysis
Connectivity parameters between all pairs of ROIs for each frequency band and for each subject were used as measure of weight of the graph in the following graph analyses.
A network is a mathematical representation of a real-world complex system and is defined by a collection of nodes (vertices) and links (edges) between pairs of nodes. Nodes in large-scale brain networks represent brain regions, while links represent anatomical or functional connections, 9 depending on the data set. Anatomical connections typically correspond to white matter fiber tracts between pairs of grey matter brain regions (cortical areas or subcortical relays). Functional connections correspond to magnitudes of temporal correlations in activity and may occur between pairs of anatomically unconnected regions.
Combinations of brain mapping methods, anatomical parcellation schemes, and measures of connectivity determine the nature of nodes and links in individual brain networks. Many combinations occur in various experimental settings. 40 Nodes should ideally represent brain regions with coherent patterns of anatomical or functional connections. 18
In the following we summarize the main concepts of graph theory but refer the interested reader to the respective references for a more exhaustive description. We computed the core measures of graph theory that summarize the aspects of segregation and integration of a network. Segregation (or specialization) refers to the degree to which network elements form individual and separate clusters; the tendency to be organized in clusters is measured by the clustering coefficient (C). Integration refers to the capacity of the network as a whole to become interconnected and exchange information; the level of integration is measured by the parameter characteristic path length (L).11,12 The networks of the present study are designed as undirected and weighted cerebral networks. The nodes are represented by the BAs and the edges are weighted by lagged linear connectivity values. 38 Weighted clustering coefficient (Cw) and weighted characteristic path length (Lw) were computed as a measure of segregation and integration of the network.
Weighted clustering coefficient of a single node defined as18,41

where weights scaled by the largest weight in the network, ŵij = wij/max(w)18,41 are utilized (max(w) represents the value of the edge with the largest weight in the network).
The mean weighted clustering coefficient (Cw) is computed by averaging the weighted clustering coefficient of all single nodes (Ĉi) in the network. Cw is a measure for the tendency of network elements to form local clusters. Starting with the definition of Watts and Strogatz for unweighted network, 13 the characteristic path length is defined as
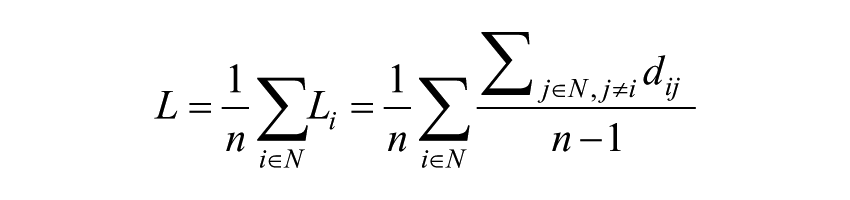
where Li is the average distance between node i and all other nodes, dij the shortest path length between nodes i and j, defined as

where gi↔j is the shortest path (geodesic) between i and j, weighted characteristic path length (Lw) is defined as18,41:

where
Originally described in social networks, the “small-world” property combines high levels of local clustering among nodes of a network (to form families or cliques) and short paths that globally link all nodes of the network. This means that all nodes of a large system are linked through relatively few intermediate steps, despite the fact that most nodes maintain only a few direct connections—mostly within a clique of neighbors. The measure of network small-worldness (Sw) is defined as18,41 the ratio between Cw and Lw individually normalized with respect to the frequency bands. The Sw coefficient is used to describe the balance between the local connectedness and the global integration of a network. When Sw is larger than 1, a network is said to have small-world properties. Small-world organization mixes short path length (typical of random networks) and high clustering (typical of regular networks).
Statistical Evaluation
The statistical analysis was carried out using the SPSS software package for Windows, release 12.0.The Shapiro-Wilk probability test was used to assess the normality of the distributions. Wilcoxon test was used to compare the power in each frequency between homologous ROIs of the 2 hemispheres.
For each EEG frequency band, a multiple regression analysis was conducted with Sw as dependent variable. We adopted 2 different approaches: in the first one, Sw in whole brain was the dependent variable while the covariates were age, gender, NIHSS score at the moment of EEG recording, side of the lesion (patients with right and left lesion vs control subjects). The 3 groups (right and left stroke patients and healthy subjects) were treated as dummy variables (healthy subjects were coded as 0-0). In the second approach, Sw of each hemisphere was the dependent variable and the covariates were the same as described above. In this approach, the hemispheres of control subjects were stratified so that Sw of each hemisphere of patients was related with Sw of the ipsilateral hemisphere of healthy subjects.
Moreover, in order to evaluate if NIHSS subscores influence cortical connectivity reorganization, in the patients sample we performed the same multiple regression analysis as described in the first approach but substituting the total score with all NIHSS subscores and not considering healthy subjects. About the motor function subscores (arm and leg) we have considered the subscores of the symptomatic side.
The goodness of fit of the model was always tested using the R2.
When the regression model explained the variation of Sw in a specific frequency, we analyzed the group effect (stroke patients and healthy subjects) on Cw and Lw values in that frequency using Mann-Whitney U test according to the results of the Shapiro-Wilk test for normal distribution. In this analysis, we compared each hemisphere of patients with the ipsilateral hemisphere of healthy subjects. Mann-Whitney U test was also used to compare ASPECT scores between patients with left and right stroke.
The Spearman correlation test was used to evaluate the correlation between NIHSS total score variation at 3 months after stroke and Sw in whole brain and in each hemisphere. The α level was set at P < .05.
Results
It must be preliminarily emphasized that the reported findings mainly refer to the acute poststroke stage (ie, within 5 days from symptoms onset) although a clinical follow-up at 3 months is available. Therefore, all the connectivity changes are related to the acute damage. Follow-up of connectivity data in parallel with clinical outcome will be necessary to disentangle eventual changes due to neuroplastic rewiring either “good” or “aberrant.”
About the EEG power spectra analysis in stroke patients, we found no difference in each EEG frequency band power between homologous regions of the 2 hemispheres.
We found no difference in lesion load between patients with left and right stroke.
Small-World Differences Between Patients and Healthy Subjects
Table 2 shows the results of the regression model adopted for the whole brain network. Cortical connectivity changes were mainly detected in delta, theta, and alpha 2 bands both in patients with right and left stroke compared with healthy subjects (theta Sw was significant only for left stroke patients). Delta and theta Sw of patients was smaller than Sw of healthy subjects (theta Sw was significant only for left stroke patients), while alpha 2 Sw was greater. Age, gender, and NIHSS total score in acute phase were not significant in our model.
Multiple Regression Analysis, Sw of All Brain as Dependent Variable. Beta Coefficient and P Value.
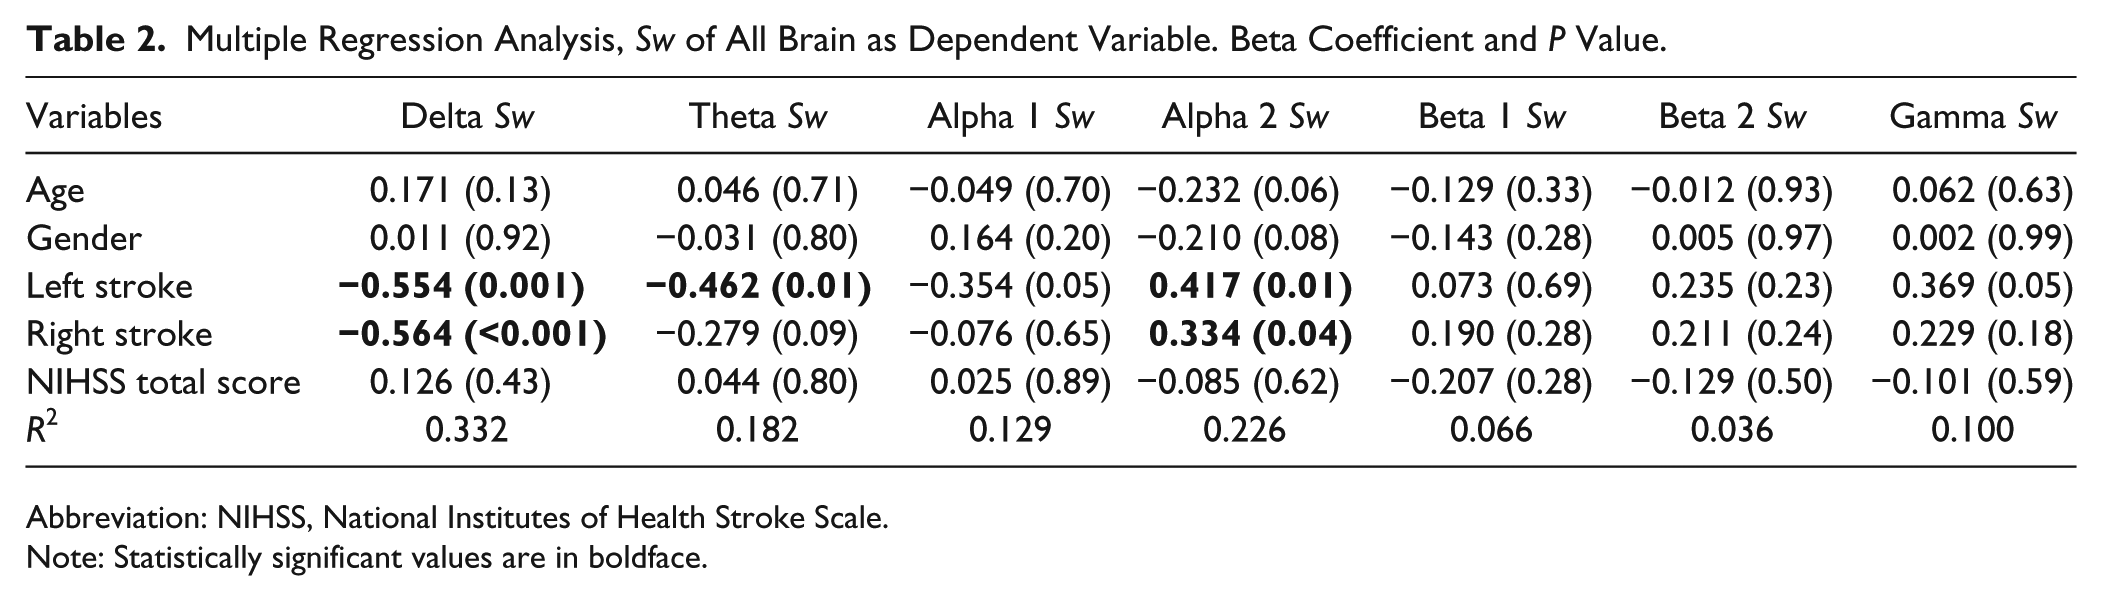
Abbreviation: NIHSS, National Institutes of Health Stroke Scale.
Note: Statistically significant values are in boldface.
Table 3 shows the results of the regression model for each hemisphere network.
Multiple Regression Analysis, Sw of Each Hemisphere as Dependent Variable. Beta Coefficient and P Value.
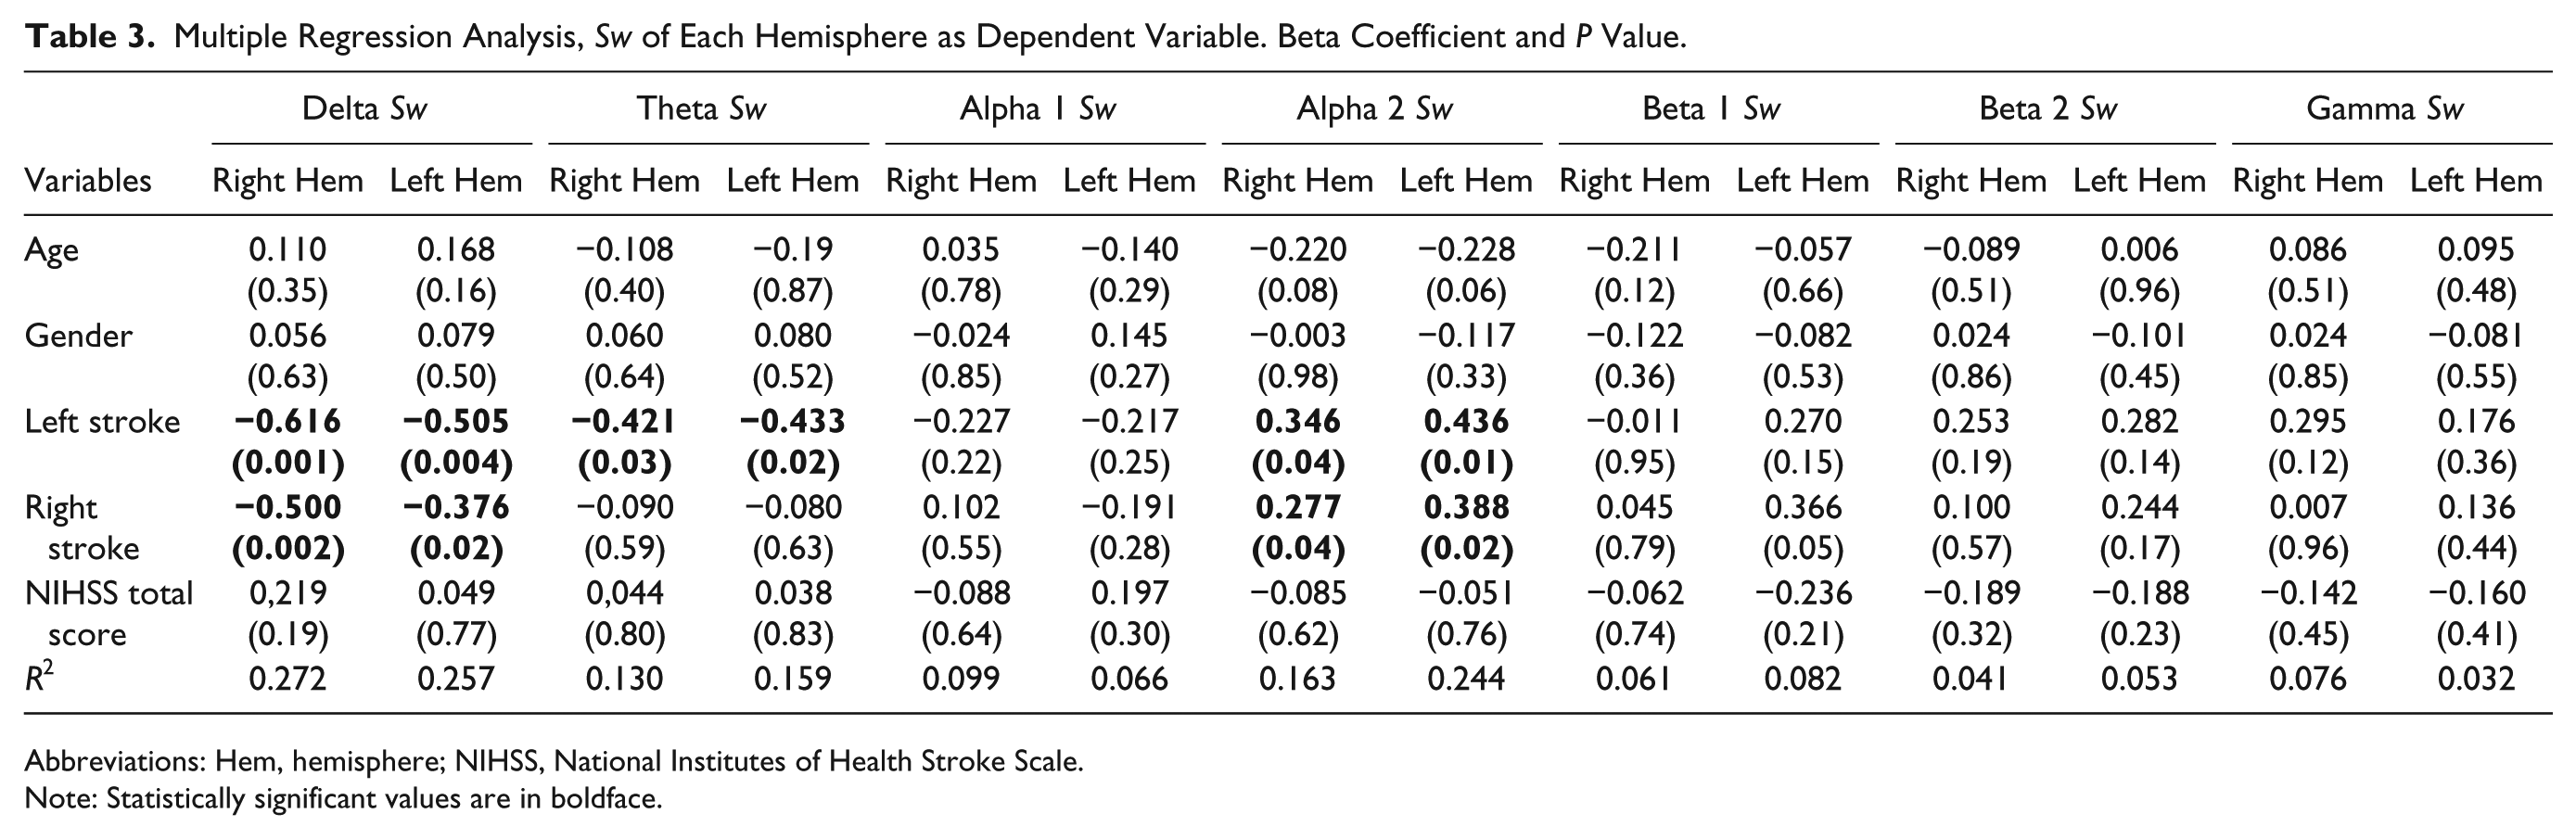
Abbreviations: Hem, hemisphere; NIHSS, National Institutes of Health Stroke Scale.
Note: Statistically significant values are in boldface.
In delta and alpha 2 bands similar findings were observed in both hemispheres regardless the side of ischemic lesion: bilaterally decreased Sw in delta band and bilaterally increased Sw in alpha 2 band compared to healthy subjects. In the theta band, bilaterally decreased Sw was observed only in patients with stroke in the left hemisphere. Age, gender, and NIHSS total score in the acute phase were not significant.
The regression model performed only in stroke patients, and adopting NIHSS subscores as independent variables reveals that the subscore vigilance is directly related with alpha 2 Sw in whole brain (R2 of the model: 0.516; beta coefficient of the vigilance sub-score: 1.102; P = .03). At 3-month follow-up all patients had a complete resolution of their consciousness impairment observed in the acute stage.
Sw in the whole brain and in each hemisphere do not correlate with NIHSS total score variation at 3 months.
Clustering and Path Length Differences Between Patients and Healthy Subjects
Left hemispheric stroke caused higher segregation and lower functional integration in the cortical networks of both hemispheres in delta and theta bands compared to the healthy subjects (Mann-Whitney U test). Indeed, in delta and theta frequencies Cw (Figure 1A and B for Cw in delta band, Figure 1C and D for Cw in theta band with P values) and Lw (Figure 2A and B for Lw in delta band, Figure 2C and D for Lw in theta band with P values) parameters of both hemispheres were greater than the respective values of the matched healthy subjects. Moreover, alpha 2 band of both hemispheres was characterized by a lower segregation and a greater global functional integration (Mann-Whitney U test). Indeed, in these patients a greater Sw in alpha 2 band was associated to Cw and Lw values bilaterally smaller than healthy subjects (Figure 1E and F for Cw; Figure 2E and F for Lw). A similar pattern in alpha 2 band was present in patients with right hemispheric stroke (Mann-Whitney U test). Also in this case, both hemispheres showed lower segregation and greater global functional integration in alpha 2 band than controls. Indeed, the Cw and Lw values in alpha 2 were bilaterally smaller (Figure 1E and F for Cw; Figure 2E and F for Lw with P values). In delta and theta bands, Cw (Figure 1A, B, C, and D) and Lw (Figure 2A, B, C, and D) parameters tended to be bilaterally greater in right hemispheric stroke patients than controls although a statistically significant difference was not achieved.
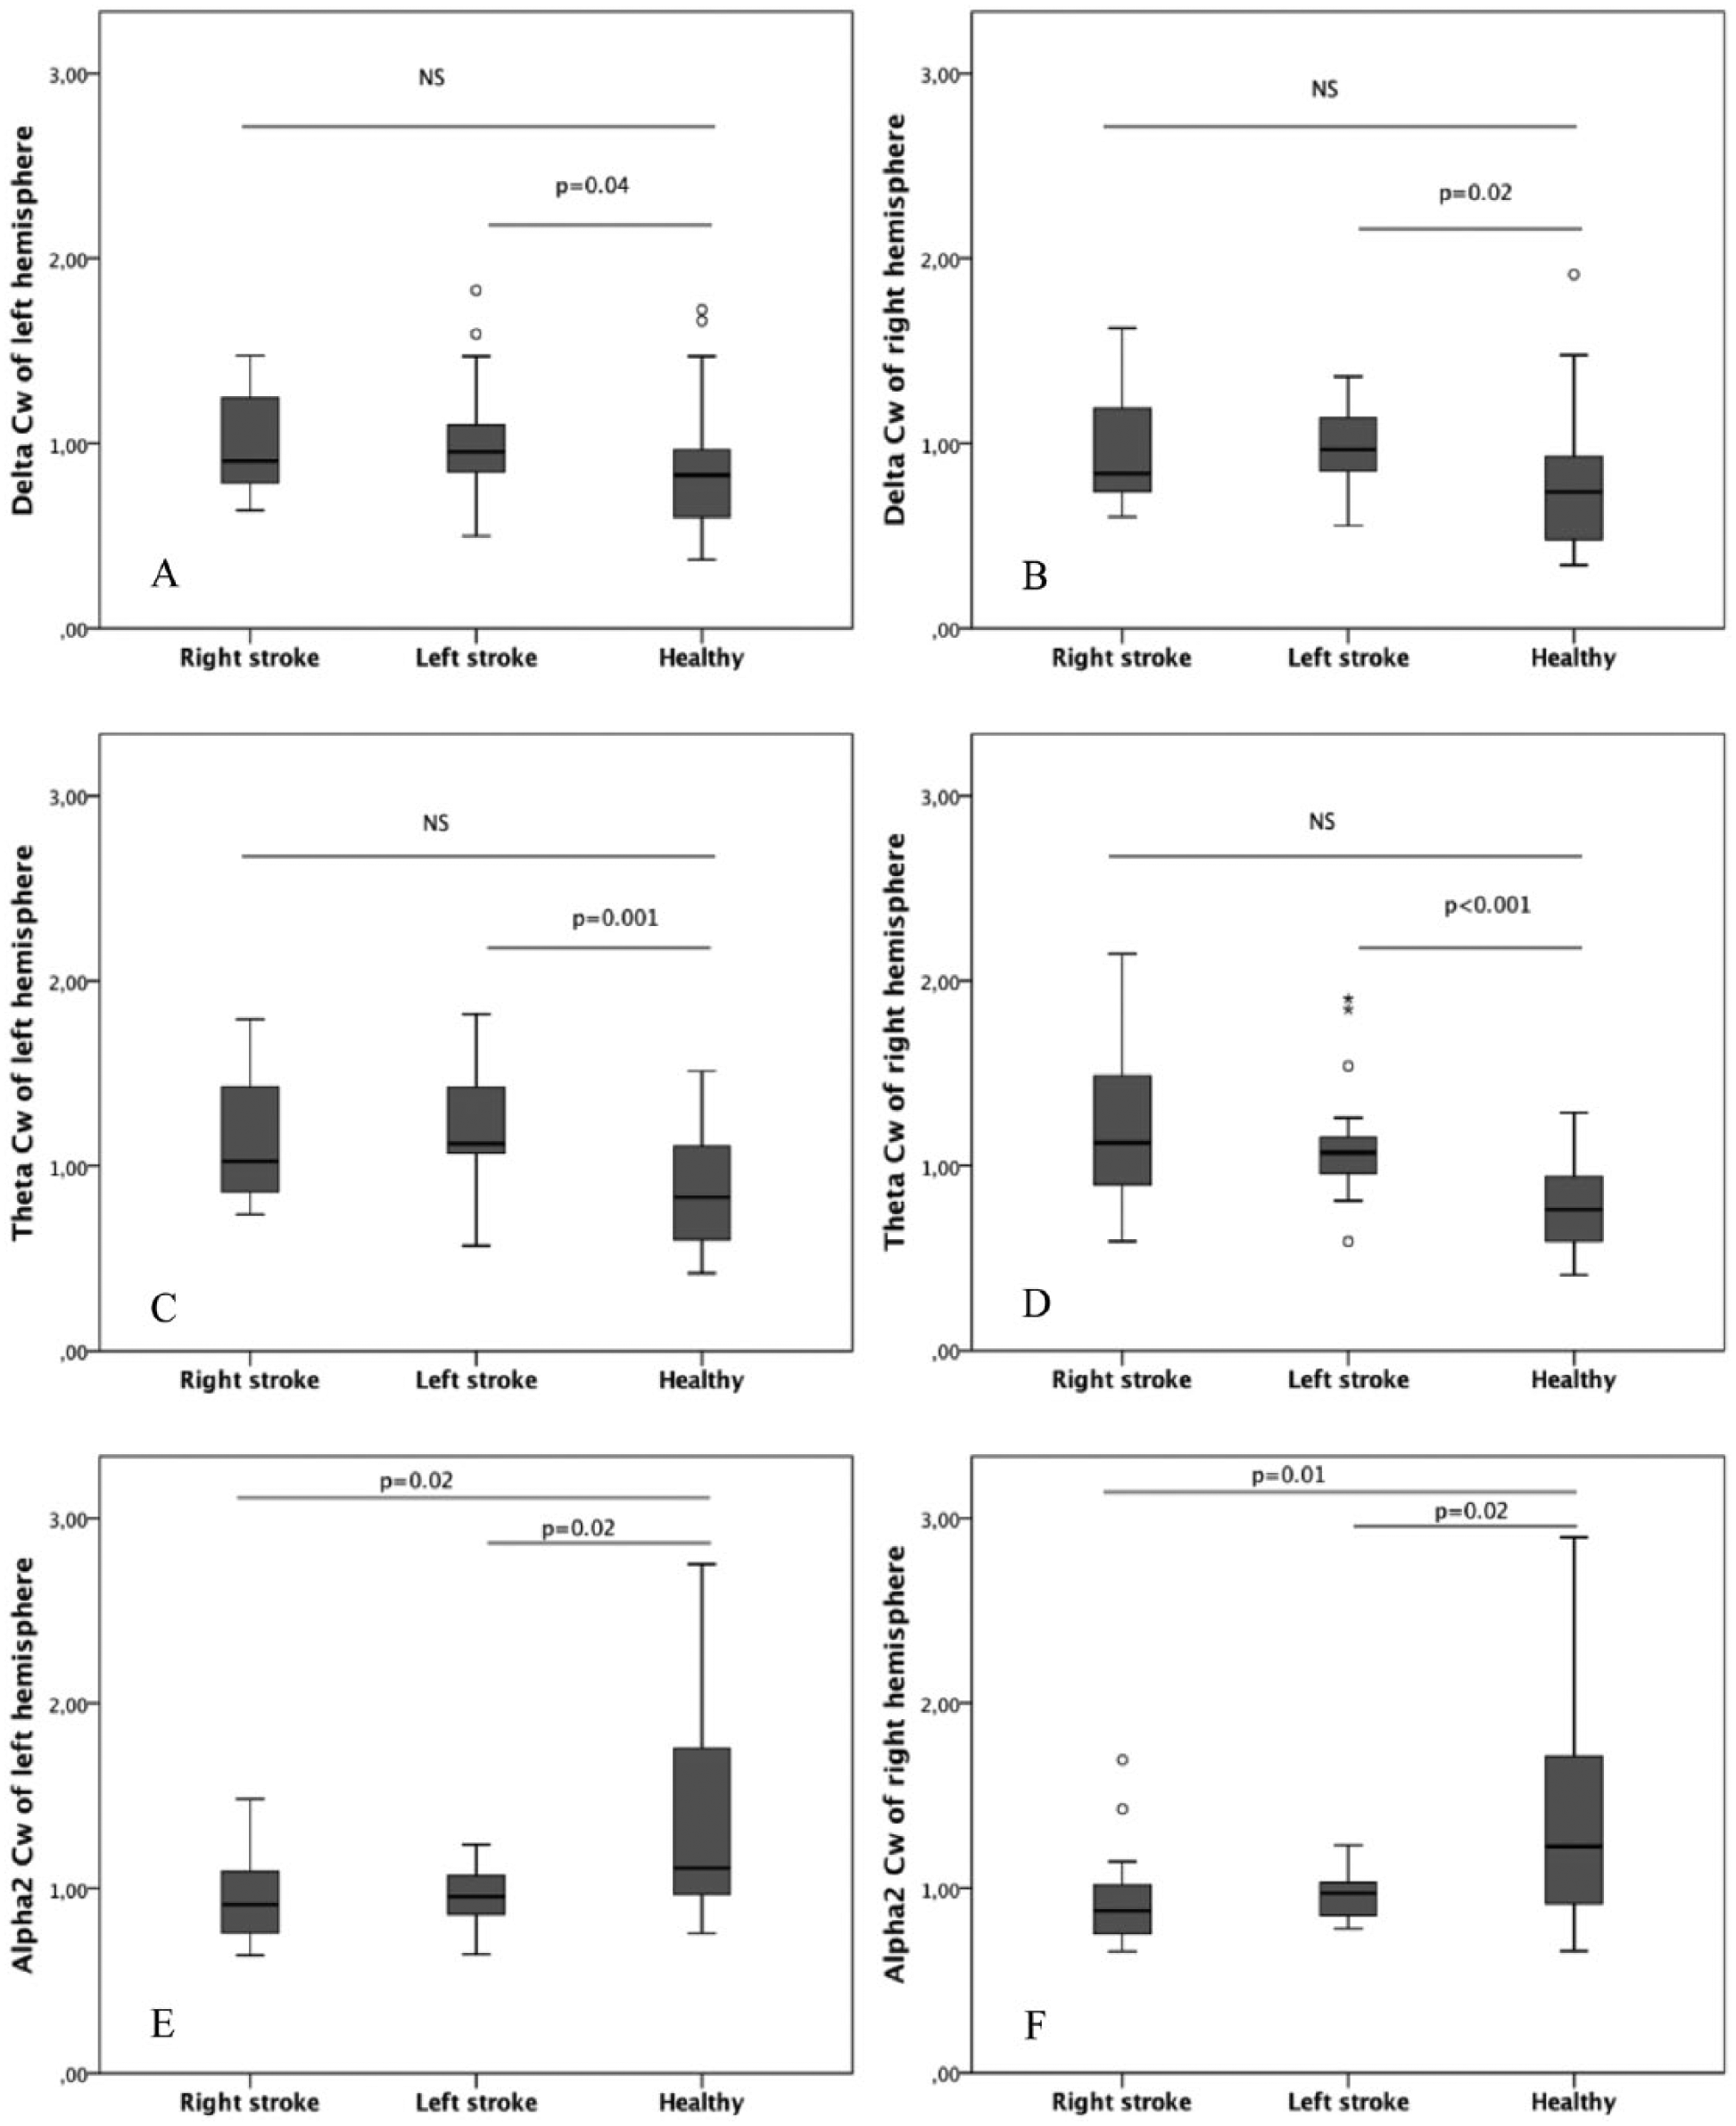
Clustering in different EEG frequency bands: comparison between stroke patients and healthy controls. The panels on the left side show clustering of the left hemisphere in delta, theta, and alpha 2 bands (respectively, A, C, E) in the samples of patients and controls. The panels on the right side show clustering in delta, theta, and alpha 2 bands (respectively, B, D, F) of the right hemisphere.
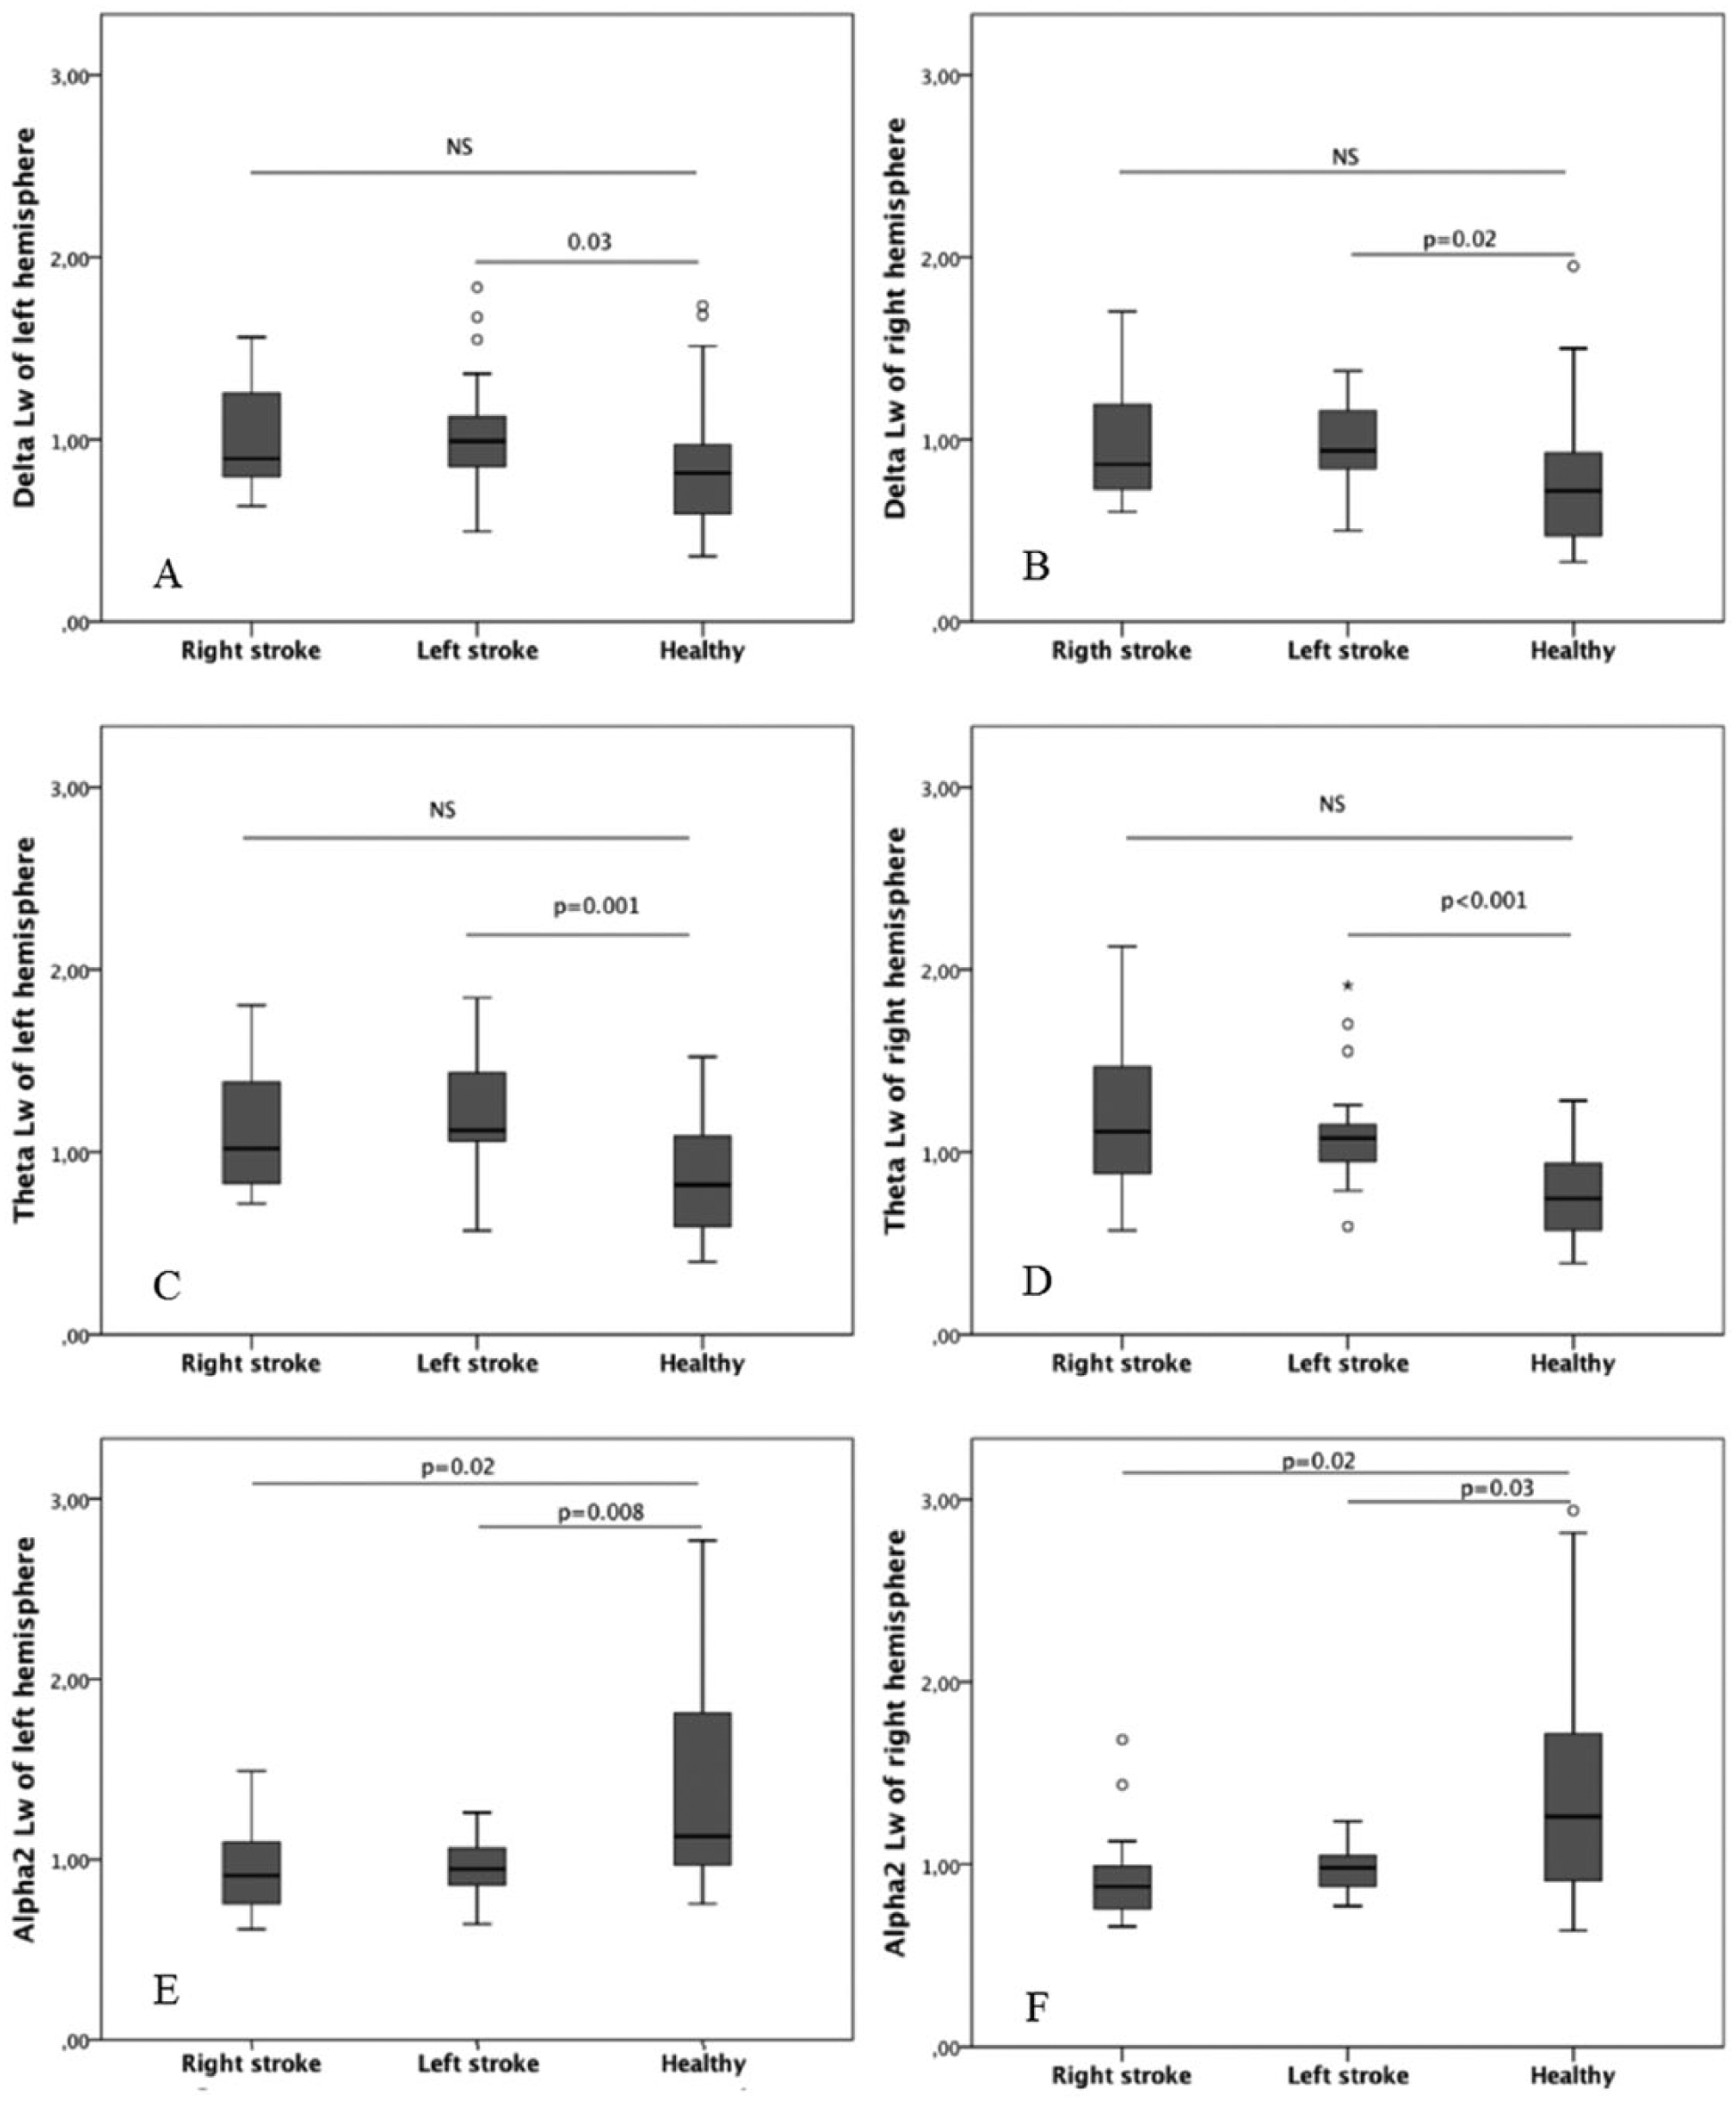
Path length in different EEG frequency bands: comparison between stroke patients and healthy controls. The panels on the left side show path length of the left hemisphere in delta, theta, and alpha 2 bands (respectively, A, C, E) in the samples of patients and controls. The panels on the right side show path length in delta, theta, and alpha 2 bands (respectively, B, D, F) of the right hemisphere.
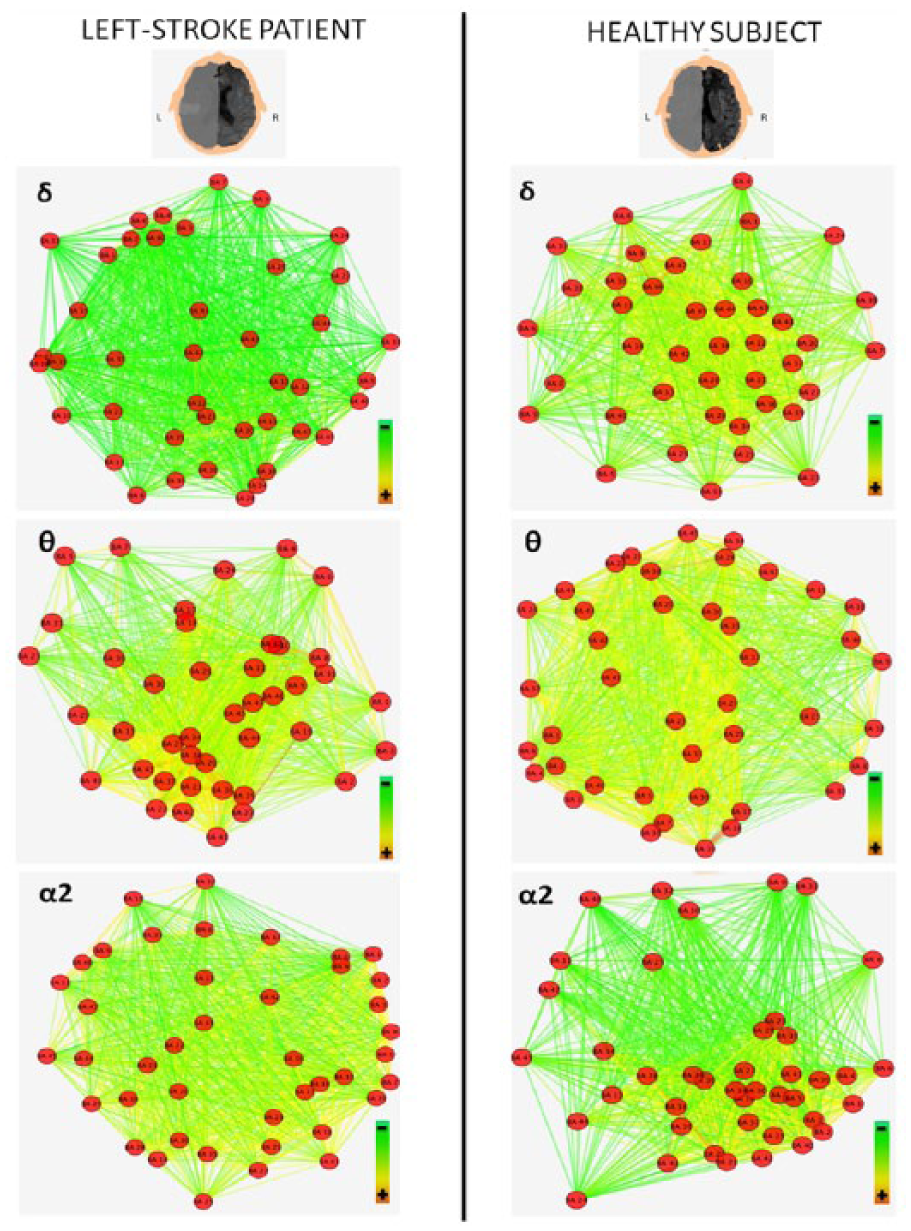
Figures 3 and 4 illustrate the variation of cortical connectivity of delta, theta, and alpha 2 EEG bands, respectively, of left and right hemispheres, in a left-stroke patient and a healthy subject. Red dots (nodes) represent the 42 BAs. Colored lines (weighted edges) represent the functional connections between the 42 BAs: edges characterized by the hottest colors and the shortest lengths indicate the strongest connections among the nodes of each analyzed network. In particular, Figure 3 shows that the left-stroke patient is characterized by higher clustering of nodes (closer nodes) and lower proportion of high-weighted edges (less number of yellow edges) compared to the healthy subject in the delta and theta bands. In other words, stroke determines rearrangement of delta and theta bands network, which results in an increased segregation (high Cw) and a reduced integration (high Lw). This last finding depends on the low proportion of high-weighted edges in the stroke patient and consequently on a long weighted characteristic path length. Conversely, the rearrangement of alpha 2 band network results in a lower clustering of nodes (more distant nodes) and higher integration (higher number of yellow edges). Figure 4 shows how the network rearrangement is very similar in the hemisphere contralateral to the lesion.
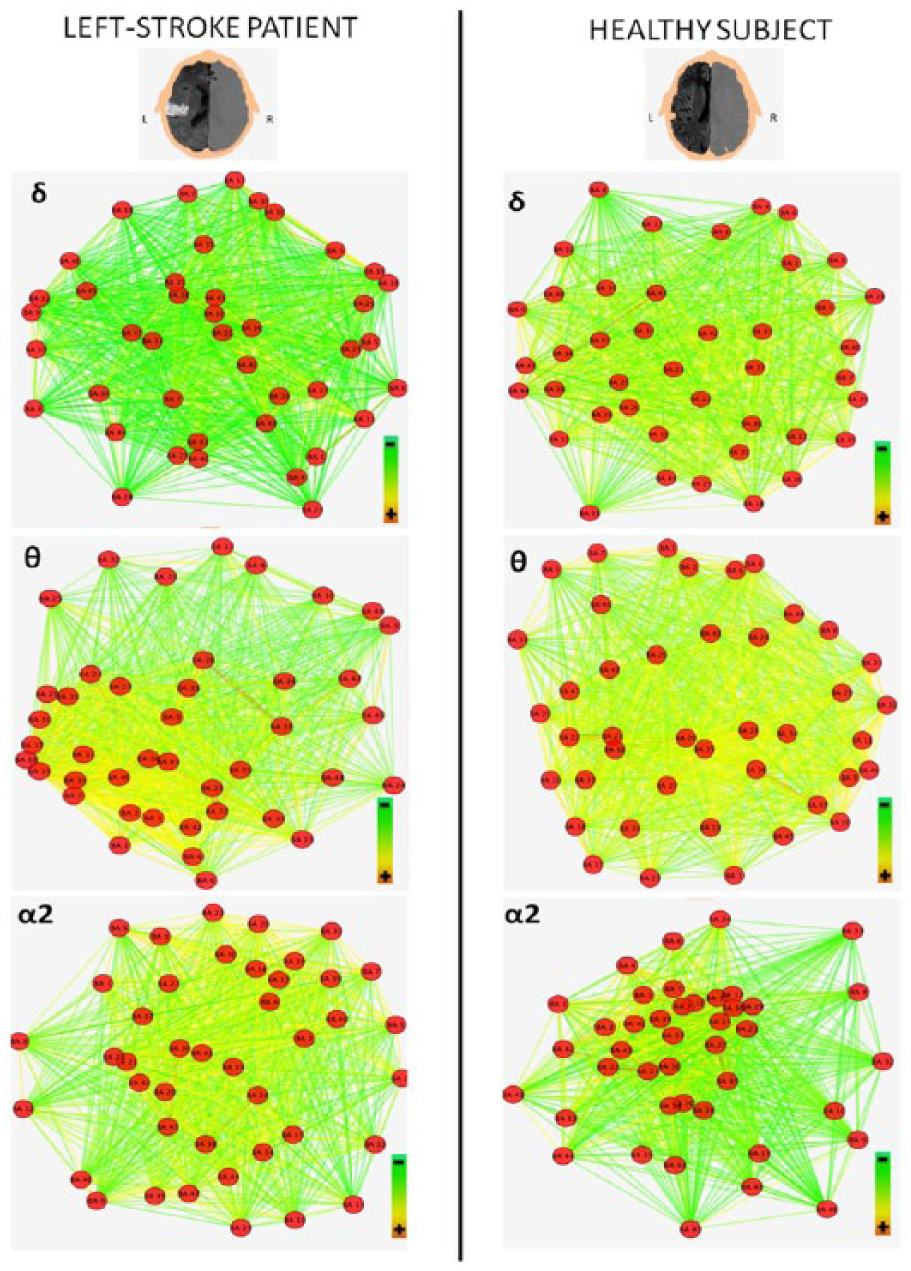
Cortical connectivity variations in left hemisphere, comparison between a left-stroke patient and a healthy control. The higher panels depict delta and theta networks of left hemisphere and show in the left-stroke patient a higher segregation (more nodes close to each other) and a lower integration (less yellow edges), if compared to the healthy one. Conversely, the lower panels (left hemisphere alpha 2 networks) show in the left-stroke patient lower segregation (less nodes close to each other) and higher integration (more yellow edges). MRI figures were inverted in order to show the patient’s head from above. Graph images were obtained using the edge-weighted spring-embedded layout algorithm of Cytoscape software (v3.2.1).
Cortical connectivity variations in right hemisphere, comparison between a left-stroke patient and a healthy control. The higher panels depict delta and theta networks of right hemisphere and show in the left-stroke patient a higher segregation (more nodes close to each other) and a lower integration (less yellow edges), if compared to the healthy one. Conversely, the lower panels (right hemisphere alpha 2 networks) show in the left-stroke patient lower segregation (less nodes close to each other) and higher integration (more yellow edges). MRI figures were inverted in order to show the patient’s head from above. Images were obtained using the edge-weighted spring-embedded layout algorithm of Cytoscape software (v3.2.1).
Discussion
In acute stroke, significant modifications of brain networking as probed via EEG recordings have been found. Changes of resting state network were mainly detected in low- and middle-frequency EEG bands, namely, delta, theta, and alpha 2 rhythms, while no network rearrangement was found in alpha 1, beta, and gamma bands. Moreover, similar findings in both hemispheres regardless of the side of the ischemic lesion were observed. In particular, we identified a bihemispheric decreased small-worldness in the delta band and a bilateral increased small-worldness in the alpha 2 band both in patients with right and left hemispheric stroke. Similarly to the rearrangement in the delta band, the theta band small-worldness bilaterally decreased but only in patients with left hemispheric stroke. It is notable that small-worldness rearrangement in stroke patients follows opposite directions in low (delta and theta) and middle frequency bands (alpha 2). It is noteworthy that the higher small-worldness in the alpha 2 band depends on the reduction of segregation (low clustering) and the increase of integration (expressed by an even lower path length) if compared with healthy subjects. Moreover, this relationship between segregation and integration, resulting in high small-worldness, is linked to the impairment of vigilance; patients with compromised vigilance have a higher small-worldness. To the best of our knowledge, no evidence from previous studies is available on modification of small-worldness in delta and theta bands in acute stroke patients. Several studies suggest that in Alzheimer’s disease delta and theta coherence between distant areas of the cortex is decreased 42 and that a lower functional connectivity is associated to a reduction of callosal fibers connecting the 2 hemispheres, 22 while coherence in the same bands is increased in schizophrenia as a possible result of impaired GABAergic inhibition and a consequent aberrant synchrony. 43 The lack of evidence in literature and the observational characteristics of our experimental setting make necessarily speculative any conclusion on pathophysiological meaning of our results. However, looking at rearrangement of clustering and path length, we may argue that acute stroke causes changes in the low frequencies resting state network, leading to an increased bilateral “local” connectivity, associated to a bilateral “global” intrahemispheric disconnection. We have to consider that bilateral modification of clustering and path length in the delta band is statistically significant only for left stroke patients. However, since the bilateral increment of clustering and path length in the delta band shows unequivocally the same trend in left and right hemispheric stroke patients and since small-worldness in the delta band is consistently reduced in both right and left stroke, we think that absence of statistically significant changes of delta clustering and path length in the right stroke sample (less numerous) is due to a type I error rather than due to a different influence of side of lesion on network rearrangement.
Cortically recorded delta EEG rhythm likely has 2 components, which, respectively, originate in thalamus44,45 and neocortex,46-48 and the functional and anatomical connection between these 2 structures is pivotal to maintain neuronal firing patterns across cortico-cortical pathways.49-51 Theta band main generators have been demonstrated in hippocampus,52-54 and neocortex, mainly in frontal regions.49-51,55-59 Moreover, theta rhythm coordinates hippocampal-frontal interactions 60 with a hippocampo-frontal directionality 61 and is involved in synchronization between different cortical areas during working memory tasks. 62 Delta and theta rhythms therefore are deeply related to subcortical-cortical and cortico-cortical interactions, and local and global changes in delta and theta connectivity may reflect a stroke-induced disruption of those circuitries. Further studies are necessary to support or refute this hypothesis and to elucidate how the tendency to clustering is related to thalamo-cortical, hippocampal-cortical, and/or to cortico-cortical connectivity. Alpha is the dominating rhythm of waking brain and reveals the integrity of synaptic networks of intrinsically rhythmic neurons in the neocortex and the functioning of the thalamo-cortical networks. 63 Therefore, we could argue that also changes in alpha band resting state cortical network are related to disruption of cortico-cortical and/or thalamo-cortical interactions as also confirmed by the finding of alpha 2 small-worldness changes mainly in patients with impaired level of consciousness (measured by the relative NIHSS subscore). Moreover, phase-locking/coherence in alpha rhythm represents a characteristic intrahemispheric resting-state coupling pattern, 64 and in subacute stroke patients, disruption of alpha band resting state coherence between a specific node and the rest of the brain is predictive of deficits in the function of the node and is independent of anatomical lesions in this area.24,64 Consistently with these observations, magnetoencephalography-based analyses of resting-state functional connectivity in subacute stroke patients showed that motor recovery at 3 months correlates with alpha synchrony at baseline in the ipsilesional somatosensory area, supplementary motor area, and cerebellum. 65 Contralesional areas show a negative correlation between alpha oscillation synchrony and performance.24,65 The reported evidence evaluates functional connectivity by coherence analysis but no description of small-worldness is available. Our results provide new insights on intrahemispheric local and global functioning remodeling of alpha resting state network, and the observed rearrangement of clustering and path length in the alpha 2 band suggests reduced bilateral “local” connectivity associated to an increased bilateral “global” intrahemispheric interaction. Taking in mind that reduced functional connectivity in the alpha band between specific nodes and the rest of the brain predicts more severe deficiency in the function of the node and24,64 worse functional outcome at follow-up, 65 we hypothesize that locally reduced and globally increased connectivity in alpha 2 rhythm might reflects a balance, in the acute phase, between functional impairment due to acute stroke and an attempt of compensation. Our data do not demonstrate a predictive value of small-worldness in terms of clinical evolution at 3 months, although all patients with impaired vigilance in the acute phase had a complete resolution of their consciousness impairment. In a next study, it would be interesting to investigate in parallel clinical picture and EEG small-worldness at follow-up. We have to point out that only changes of small-worldness in the alpha 2 band but not in the alpha 1 band were observed. We separately investigated alpha 1 and alpha 2 connectivity because they likely have different cortical generators (anterior regions for alpha 1 and occipital ones for alpha 2) and distinct reactivity patterns to motor and cognitive tasks.63,66 The reasons of small-worldness changes only in the alpha 2 band remain unclear.
Absence of resting-state network rearrangement in beta and gamma bands is consistent with previous data24,65 and must not be necessarily interpreted as absence of relevance of coherence in these bands. A possible explanation could be that coherence in faster rhythms may be more involved in active (either motor or cognitive) tasks.30,31,67
In acute poststroke, several mechanisms of impaired intracortical connectivity can occur: anatomical interruptions of brain circuitries and neurochemical and electrophysiological modifications. In this view, the modifications in connectivity observed on the contralesional hemisphere could be explained as the impairment of a physiological interhemispheric mutual control.23,68-70 Notably, in the acute stages small-worldness changes bilaterally regardless of the side of the hemispheric lesion. Whether and how this scenario is going to change in the subacute and chronic stages remains to be investigated.
We have to consider some technical aspects. First, we decided to use a standard electroencephalographic approach with 19 electrodes with a very patient-friendly montage procedure because our patients were in the very acute phase of stroke and we needed a routine method easily applicable also to severely affected patients. However, the low number of electrodes could determine a low-resolution reconstruction of sources because of an overlap of signals. 71 Although we do not pretend to precisely reproduce the underlying neuronal network by using 19 electrodes, we think that the adopted approach cannot significantly compromise the conclusion that small-worldness is modified in acute stroke, because the same methodology was applied in a control group of healthy subjects showing a different small-worldness. Moreover, the hypothesis that overlaps among sources results in volume conduction effect is not consistent with our results. First, volume conduction should be prevalent in the affected side and therefore it should determine a different functional connectivity in the 2 hemispheres. In this regard, we found similar changes of small-worldness bilaterally and consistently in right and left stroke. Moreover, the lagged coherence parameter is an adequate measure of electrophysiological connectivity, because it permits to obtain reliable esteems of phase synchronization, as it does not depend on the presence of active reference electrode, nor on volume conduction or low spatial resolution.37-39
Conclusions
Our results suggest that, after an acute stroke, the brain cortex reacts by modifying its small-worldness diffusely and in a frequency-dependent modality, the functional network being rearranged in delta and alpha 2 bands, less in theta and not in alpha 1, beta, and gamma rhythms. Changes of resting state cortical network are bilateral and seem independent of the side of the lesion.
Footnotes
Acknowledgements
We thank Nadia Giannantoni for technical support; Aldobrando Broccolini, Giovanni Frisullo, Roberta Morosetti, Fabio Pilato, and Paolo Profice for their clinical support; and Domenica Le Pera and Daniele Coraci for clinical follow-up data.
Authors’ Note
Dr Francesca Miraglia and Dr Chiara Iacovelli participated to this study in the framework of their PhD program at the Doctoral School in Neuroscience, Department of Neuroscience, Catholic University of Rome, Italy.
Declaration of Conflicting Interests
The authors declared no potential conflicts of interest with respect to the research, authorship, and/or publication of this article.
Funding
The authors disclosed receipt of the following financial support for the research, authorship, and/or publication of this article: The research was partially funded by Fondazione Don Carlo Gnocchi.