
Abstract
Background. Traumatic brain injury (TBI) has been associated with altered microstructural organization of white matter (WM) and reduced gray matter (GM). Although disrupted WM organization has been linked to poorer motor performance, the predictive value of GM atrophy for motor impairments in TBI remains unclear. Objective. Here, we investigated TBI-induced GM volumetric abnormalities and uniquely examined their relationship with bimanual motor impairments. Methods. 22 moderate to severe TBI patients (mean age = 25.9 years, standard deviation [SD] = 4.9 years; time since injury = 4.7 years, SD = 3.7 years) and 27 age- and gender-matched controls (mean age = 23.4 years; SD = 3.8 years) completed bimanual tasks and a structural magnetic resonance imaging scan. Cortical and subcortical GM volumes were extracted and compared between groups using FreeSurfer. The association between bimanual performance and GM volumetric measures was investigated using partial correlations. Results. Relative to controls, patients performed significantly poorer on the bimanual tasks and demonstrated significantly smaller total GM as well as overall and regional subcortical GM. However, the groups did not show significant differences in regional cortical GM volume. The majority of the results remained significant even after excluding TBI patients with focal lesions, suggesting that TBI-induced volume reductions were predominantly caused by diffuse injury. Importantly, atrophy of the thalamus, putamen, and pallidum correlated significantly with poorer bimanual performance within the TBI group. Conclusions. Our results reveal that GM atrophy is associated with motor impairments in TBI, providing new insights into the etiology of motor control impairments following brain trauma.
Keywords
Introduction
Traumatic brain injury (TBI) is a major cause of mortality and severe disability worldwide. In the United States, approximately 1.5 million cases of TBI occur each year, resulting in 50 000 deaths, 230 000 hospitalizations, and 80 000 to 90 000 survivors with long-lasting impairments. 1 The impairments in TBI range from neurobehavioral and cognitive 2 to a broad range of sensorimotor function impairments, including deficits in coordination, balance, walking, and arm/hand function,3 -6 each of which can profoundly affect an individual’s daily life activity.
There is emerging evidence that cognitive impairments, as a consequence of TBI, are related to the accompanying white matter (WM) and gray matter (GM) changes postinjury.7,8 Regarding the deficits in motor behavior following TBI, however, the underlying neural mechanisms are still poorly understood. Although recent evidence suggests that impaired microstructural organization of WM and disrupted structural brain networks are related to poorer motor performance in pediatric4,9 -11 and young adult 12 TBI patients, the predictive value of GM volume loss for motor impairments remains unclear.
Prior studies on GM volumetric alterations in TBI have revealed global13 -16 and region-specific atrophic changes postinjury,17 -22 particularly in the chronic stage 23 and even in the absence of focal lesions. 14 Whether such long-term TBI-induced GM volume reductions predict persistent motor impairments is explored in the present study. We investigated GM volumetric abnormalities in chronic TBI patients (>6 months postinjury) and examined their association with bimanual motor impairments. Bimanual coordination is considered a central motor skill in daily life and is of interest because it relies on a large subcortical-cortical network.24,25 Regarding WM within this bimanual network, previous studies in both healthy controls and TBI patients have demonstrated a major role of the corpus callosum in bimanual coordination performance.12,26 That is, TBI-induced structural alterations of callosal fibers are related to impaired bimanual functioning. 12 However, we are not aware of any studies reporting on the importance of TBI-induced GM changes within this subcortical-cortical network for bimanual functioning. Determining such structural GM changes following TBI that underlie motor impairments will further help in revealing the pathophysiology of motor deficits following brain injury.
In the present study, moderate to severe TBI patients underwent brain imaging approximately 4.7 years postinjury. Based on previous findings, we hypothesized that global and regional GM volumes (subcortically and cortically) would be smaller in TBI patients than in healthy controls. Most important, we expected that GM-volumetric abnormalities of the motor-related regions would be associated with impaired bimanual motor performance.
Methods
Participants
A total of 22 chronic TBI patients (9 male) 18.4 to 33.7 years old (mean = 25.9 years; standard deviation [SD] = 4.9 years) and 27 control participants (12 male) 18.6 to 33 years old (mean = 23.4 years; SD = 3.8 years) were included in the present study. All TBI patients had sustained moderate to severe head injury, as defined by the Mayo classification system for injury severity. This system classifies patients according to the length of posttraumatic amnesia, loss of consciousness duration, lowest Glasgow Coma Scale score in the first 24 hours, and magnetic resonance imaging (MRI) or computed tomography images, 27 assessed by a specialized clinical neuroradiologist. Contusions were typically located in the temporal and frontal cortices (see Figure 1), often resulting in focal lesions (present in 9 patients in the current sample). Age at the time of injury of TBI patients was on average 21.2 years (SD = 6.7 years; range = 8.2-33 years). The groups did not differ significantly with regard to age [t(47) = 1.99; P = .052] or gender [χ2 (1) = 0.06; P = .804]. All participants were right-handed as determined by the Oldfield Handedness Scale 28 (mean laterality: TBI, 88.3, SD = 17.6; controls, 88.6, SD = 16.8). MR imaging took place on average 4.7 years (SD = 3.7; range = 0.6-12.3 years) postinjury. Available information regarding the cognitive level of the present patient sample (ie, neuropsychological test outcomes included in their medical files) is listed in Supplementary Table S1.
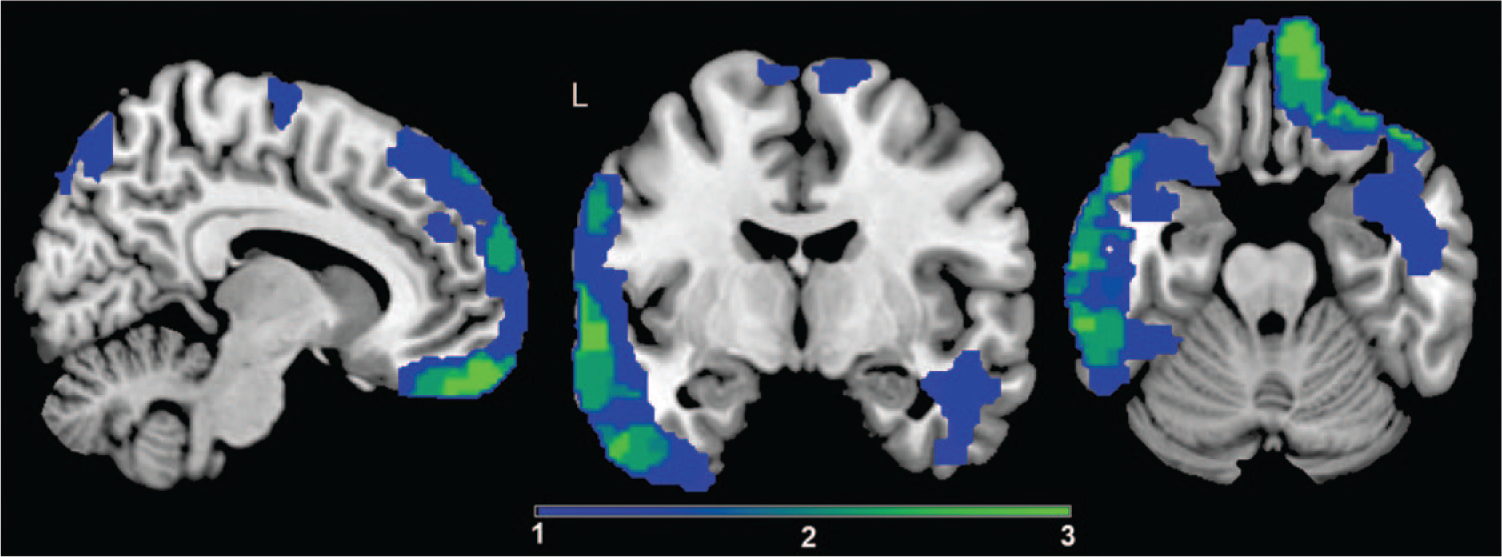
Overlay of the focal lesion areas: The color bar indicates the number of patients who had lesions at these locations. Dark blue indicates that a lesion was present in 1 of the 9 patients, and light green indicates that a lesion was present in 3 patients (=maximum number of overlap). The average lesion volume is 16.39 cm3 (SD = 11.38 cm3; range = 3.35-43.82 cm3). Lesion size (cm3) was calculated using the fslstats–V function on binarized lesion masks.
Exclusion criteria for both populations were the use of psychoactive medication, a history of drug abuse, psychiatric or neurological disorders other than TBI, significant multiple trauma, an abbreviated injury score >2 for the upper limbs indicating serious impaired arm function, 29 and contraindications for MR scanning. To assess the functionality of bimanual movements in our patient sample, we used the ABILHAND questionnaire, 30 which measures self-reported ability to perform complex hand activities in several daily situations. That is, patients were asked to indicate whether it was easy, difficult, or impossible to perform representative bimanual arm/hand activities (23 items; eg, opening a jar, peeling onions, pencil sharpening, opening a bag of chips, making a sandwich, etc). Patients reported that, on average, in 96.4% of the cases, the bimanual activity could be performed easily. These findings indicated that all patients could perform bimanual daily activities without problems. It is important to note that although the ABILHAND questionnaire measures an individual’s overall manual activities, it does not provide information regarding the accuracy or speed of these activities. Additionally, patients demonstrating spasticity or biomechanical limitations of the hands/arms that may have interfered with bimanual task performance were excluded. The study was approved by the local ethics committee, and the participants provided written informed consent according to the Declaration of Helsinki. Patient characteristics are displayed in Table 1.
Summary of Demographic and Clinical Characteristics of the TBI Sample.
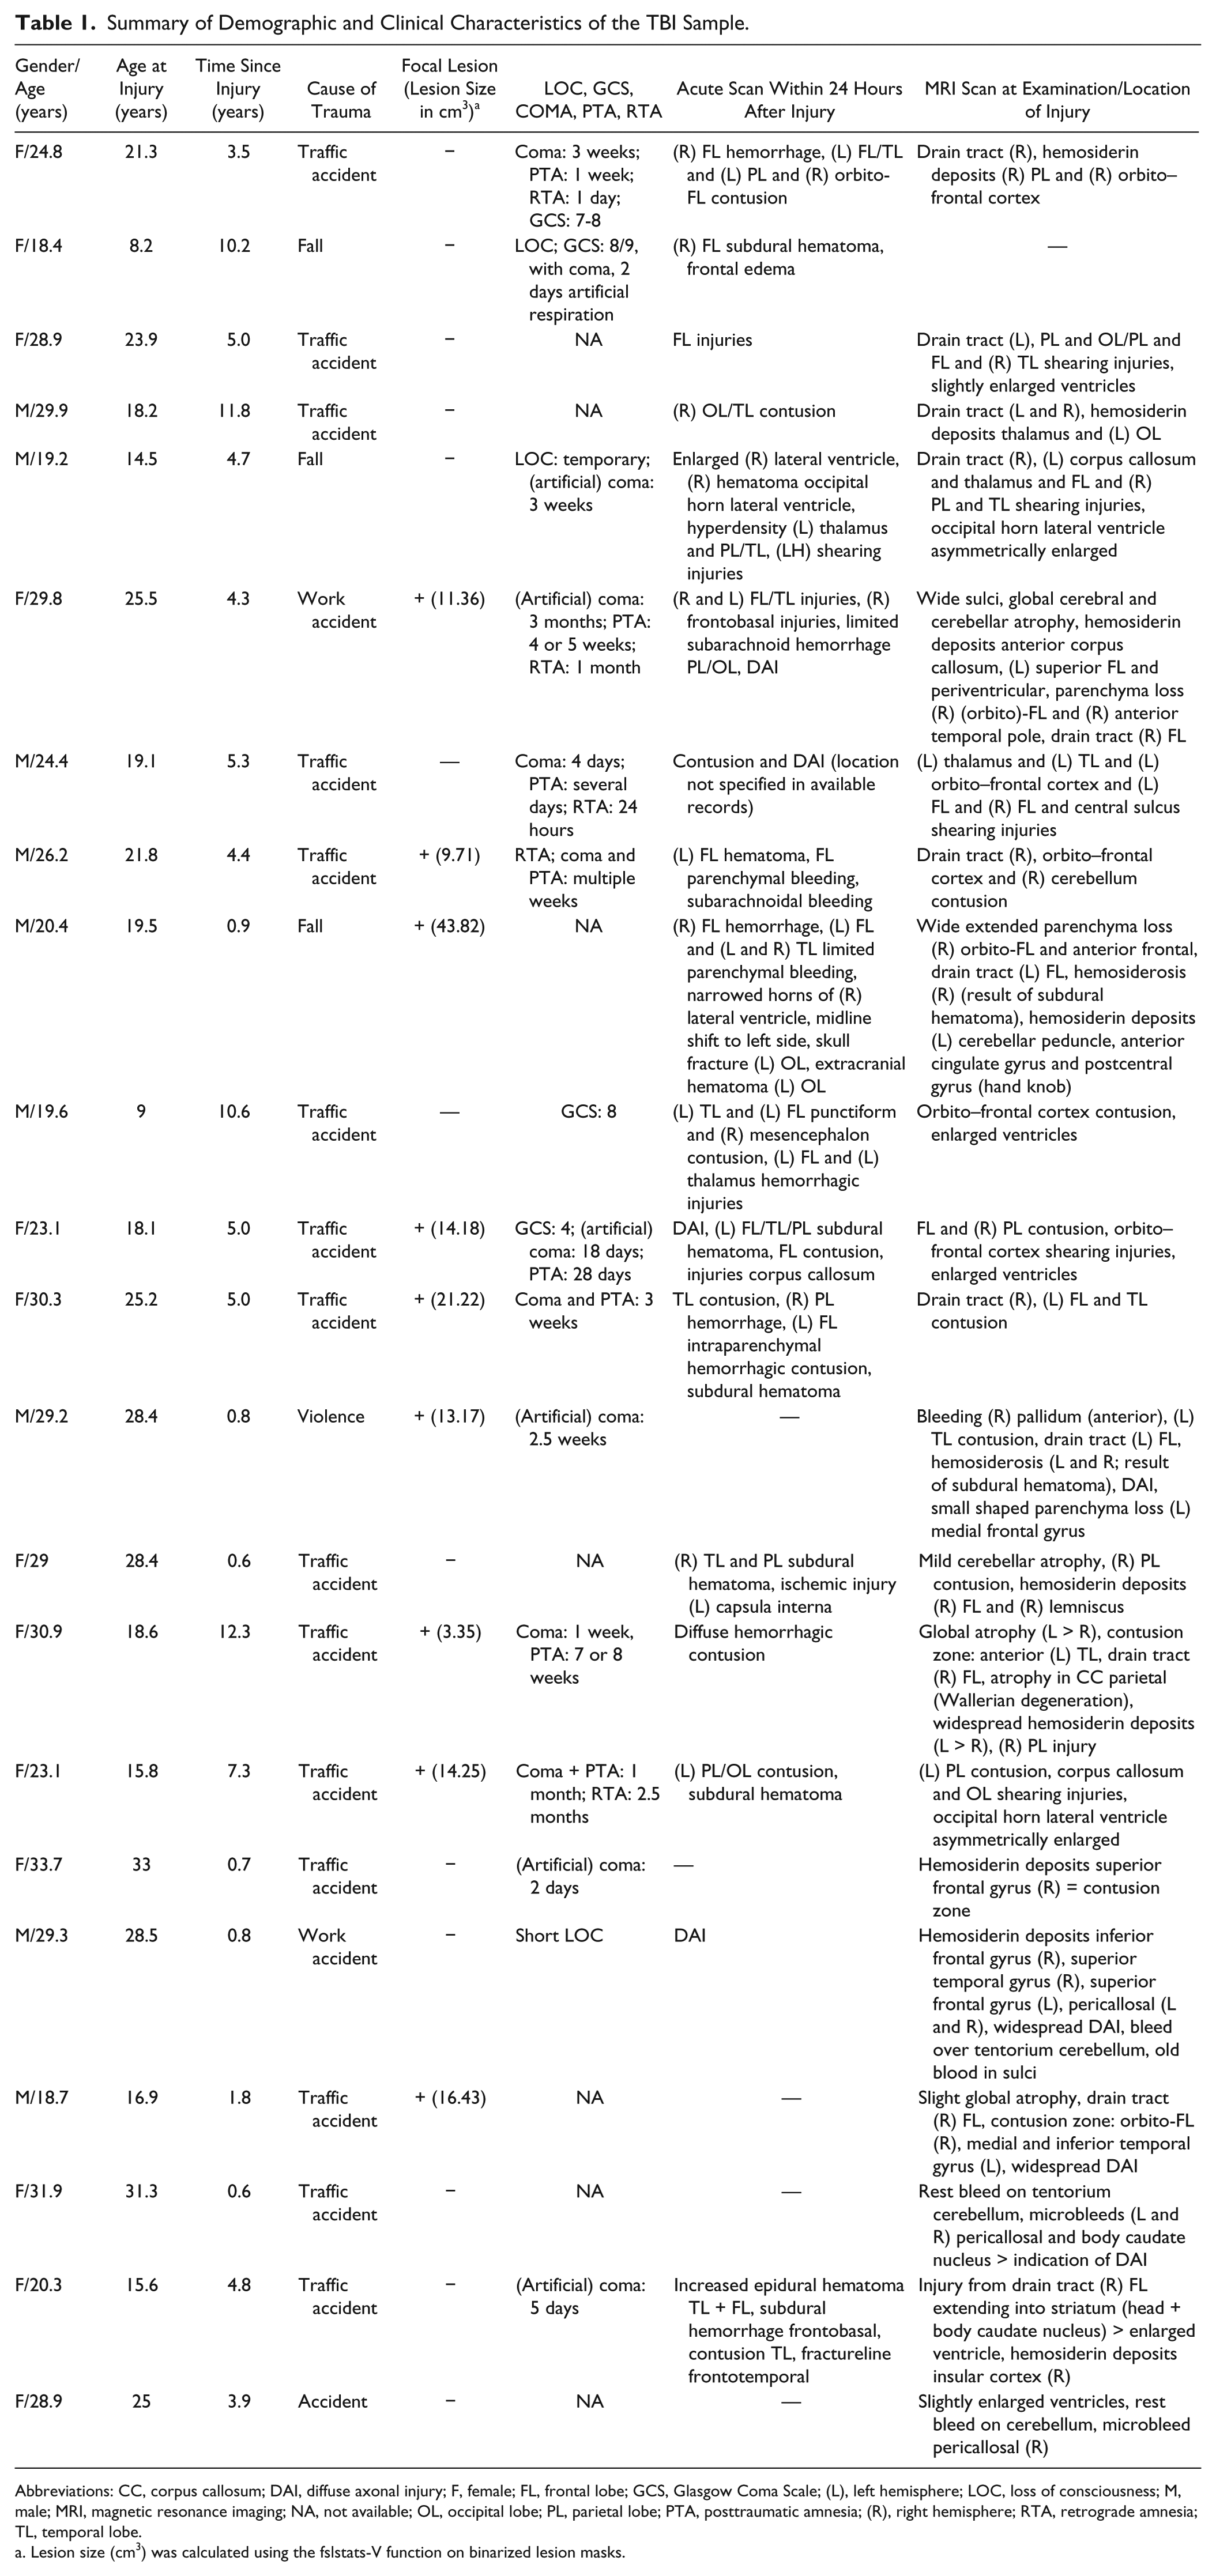
Abbreviations: CC, corpus callosum; DAI, diffuse axonal injury; F, female; FL, frontal lobe; GCS, Glasgow Coma Scale; (L), left hemisphere; LOC, loss of consciousness; M, male; MRI, magnetic resonance imaging; NA, not available; OL, occipital lobe; PL, parietal lobe; PTA, posttraumatic amnesia; (R), right hemisphere; RTA, retrograde amnesia; TL, temporal lobe.
Lesion size (cm3) was calculated using the fslstats-V function on binarized lesion masks.
Bimanual Tests
Bimanual skill was selected because this constitutes a prototype of a complex motor task, requiring interhemispheric and intrahemispheric as well as cortico-subcortical interactions. In the current study, bimanual functioning was tested by means of standardized tests, such as the Purdue Pegboard Test31,32 and the TEMPA (Test d’Evaluation de la performance des Membres supérieurs des Personnes Agées), 33 as well as by in-house developed bimanual finger tapping tasks (for a detailed description of the tests see supplemental material). First, the Purdue Pegboard Test was administered, in which patients were required to bimanually place as many metal pins as possible in 2 parallel rows of holes running vertically down the board, within 30 s. The mean number of pins inserted correctly across 3 trials was used to score performance; higher scores indicated better performance. Second, patients performed the TEMPA, a standardized test for upper-limb function. This test consists of unilateral and bilateral tasks representing routine daily activities of the upper extremities. Movement time (in seconds) across the bilateral tasks was used to score performance; lower scores indicated better performance. Both standardized tests were performed only by the TBI group. Third, our bimanual tapping task consisted of tapping 2 response keys on a keyboard with the left and right index fingers. Two tapping conditions were performed: (1) simultaneous finger tapping (SFT) in which participants had to tap simultaneously with their left and right index fingers and (2) alternating finger tapping (AFT) requiring strictly alternating left-right index finger tapping. Participants were instructed to tap as many times as possible within 10 s. Performance was scored by counting the number of correct taps; higher scores were indicative of better performance. All participants were allowed to briefly practice the tests that they were asked to perform (ie, controls: in-house developed tests; TBI patients: standardized and in-house developed tests) in order to ensure that they (particularly the TBI patients) understood the instructions and could perform the tests adequately. Investigators were not blinded to group assignment during the completion of the bimanual tests.
Imaging
MRI Acquisition
The bimanual tasks and MRI scanning were performed in 2 separate sessions, which were ideally not more than 2 weeks apart (a period for which there is a high level of session-to-session reliability of volume measures obtained with FreeSurfer). 34 On average, the time interval between bimanual testing and MRI scanning was 10.1 days (SD = 16.3 days) within the TBI group and 2.6 days (SD = 2.3 days) within the control group. MRI images were acquired on a Siemens 3T Magnetom Trio MRI scanner (Siemens, Erlangen, Germany) with a 12-channel matrix head coil. A 3D magnetization prepared gradient echo (MPRAGE) high-resolution T1-weighted structural image (TR/TE = 2300/2.98 ms; 1 × 1 × 1.1 mm3 voxels; FOV = 240 × 256, 160 sagittal slices) lasting 8 minutes was obtained.
MRI Processing
FreeSurfer (v5.1; http://surfer.nmr.mgh.harvard.edu) was used to extract cortical and subcortical GM volumes. The technical particulars of FreeSurfer have been described in detail elsewhere. 35 Briefly, image processing included the following: motion correction, skull stripping, Talairach transformation, segmentation of the subcortical WM and deep GM structures, intensity normalization, tessellation of the GM/WM boundary, surface deformation along intensity gradients for optimal placement of GM/WM and GM/cerebrospinal fluid borders, and cortical parcellation with submillimeter precision into units based on gyral and sulcal structure. Results for each participant, particularly those with focal brain lesions, were carefully visually inspected to ensure accuracy of the skull stripping, segmentation, and cortical surface reconstruction. In case of inaccuracies, manual editing was performed either by (1) adding control points to help FreeSurfer identify the WM voxels (2 cases); (2) adding back parts of the brain that were wrongly removed (3 cases); (3) removing the skull and dura in case they were considered as parts of the brain (6 cases; see https://surfer.nmr.mgh.harvard.edu/fswiki/FsTutorial/TroubleshootingData). In addition to the previously described patient group (n = 22), there were 2 male TBI patients who had extensive TBI-induced lesions, for whom FreeSurfer was unable to finish image processing, and therefore, their data were not included in this study.
During the parcellation procedure, each cortical region was assigned 1 of 68 labels. We focused only on the cortical regions that have previously been associated with executing a bimanual task.24,25,36 Translated to the list of structures in FreeSurfer, these cortical regions correspond to the following areas: precentral, postcentral, paracentral, superior frontal, caudal anterior cingulate, posterior cingulate, caudal middle frontal, pars opercularis, supramarginal, inferior parietal, superior parietal, and insula cortices.
In the segmentation procedure, each subcortical region was assigned 1 of 39 labels (including WM regions, excluding ventricles and global regions). 37 Because we were interested in GM structures, bilateral volumes of the following 5 subcortical regions were extracted and used in the statistical analyses: cerebellar cortex, thalamus, caudate, putamen, and pallidum. These 5 subcortical regions of interest (ROIs) were chosen, given their incontestable involvement in motor control. 25 Regions in which a focal lesion was present were excluded, because there was not enough tissue left to validly segment WM and GM. Furthermore, 6 global measures were calculated including the following: (1-3) left and right and total cortical volume, calculated by summing the volumes of left, right, and all the cortical regions, respectively; (4) subcortical GM volume, calculated by summing the volume of all the subcortical GM regions; and (5) total GM volume, calculated by summing the volumes of the cortex and subcortical GM. Furthermore, for each brain image, an estimate of (6) intracranial volume (ICV) was obtained from FreeSurfer, which was used to adjust for the brain size in the statistical analyses.
Statistical Analysis
Because the Purdue Pegboard test and the TEMPA were only administered to the TBI sample, their scores were compared with the normative values reported in previous literature32,38 using one-group comparison statistics. Independent-samples t tests were used to examine group differences on both bimanual finger-tapping tasks and to determine differences in bimanual performance between the patients with and without focal lesions. With respect to both the standardized and in-house developed tests, a threshold of P < 0.05 was used. For each cortical and subcortical structure a univariate analysis of covariance (ANCOVA) was performed with volumetric measures as dependent variables, group (TBI and controls) and gender as categorical factors, and age and ICV as continuous factors. Because of the presence of missing values resulting from focal lesions, particularly in the cortical regions, we chose not to perform the multivariate analysis of covariance because this model applies a list-wise deletion (n = 9). General linear model (GLM) analyses were also repeated after excluding a subgroup of patients with focal lesions (n = 9, see Table 1). To assess the relationship between GM volume and bimanual performance, partial correlations were performed per group, correcting for ICV, age, and gender. To investigate group differences in the relationship between bimanual performance (AFT and SFT) and subcortical/cortical volumetric measures (ie, 3-way interactions between group, bimanual performance, and volumetric measures), we performed a series of linear regression analyses. In these analyses we used bimanual performance as the dependent variable and age, gender, ICV, group, regional volume, and Group × Volume as independent variables and investigated whether Group × Volume was significant.
For the volumetric group comparisons as well as correlational and regression analyses a false discovery rate (FDR) correction was applied to correct for multiple comparisons. For all the analyses involving volumetric measures, regions in which a focal lesion was present were excluded, and these missing values were pairwise excluded (ie, cases were only excluded for the dependent variables for which they had missing data). Statistical analyses were performed using Statistica 12 (Statsoft, Tulsa, OK).
Results
Bimanual Motor Performance
Patients placed on average 11.17 (SD = 1.59) pins in the Purdue Pegboard within 30 s, which is significantly less [t(21) = −6.83; P = .000] than the average normative value reported by Tiffin and Asher 32 (mean = 13.48, averaged across the scores of college men and women and industrial men and women). Furthermore, patients needed on average 13.62 s (SD = 1.79 s) to complete the bilateral items of the TEMPA. This was significantly slower [t(21) = 15.50; P = .000] in comparison to the normative values reported by Nedelec et al 38 (mean = 7.69, averaged across the maximal speed of the following age categories: 20-24, 25-29, and 30-34, for men and women). On both finger-tapping tasks, TBI patients performed poorer than controls [AFT: t(47) = −4.09, P = .000, mean for controls = 99.4 (SD = 12.5), mean for TBI = 79.5 (SD = 21.2); SFT: t(47) = −3.92, P = .000, mean for controls = 106.8 (SD = 10.4), mean for TBI = 90.1, SD = 19.0]. Performance on the Purdue Pegboard Test [t(20) = −0.13; P = .895], TEMPA [t(20) = 1.42; P = .172], SFT task [t(20) = −0.12; P = .909], and the AFT task [t(20) = −0.06; P = .954] were not significantly different between patients with and without focal lesions. Therefore, correlations with volumetric measures were performed on the entire patient sample (n = 22).
Volumetric Group Differences
Global Measures
Relative to controls, volume reductions in TBI were observed in the left cortical volume (P = .014), total cortical volume (P = .024), total subcortical GM (P = .002), and total GM volume (P = .002); see Table 2. Furthermore, when patients with focal lesions were excluded from the analyses, results of the total GM volume and subcortical GM volume remained significant (Table 2).
Statistical Comparisons of Global and Regional Subcortical GM Volumes (mm3) Between Groups.
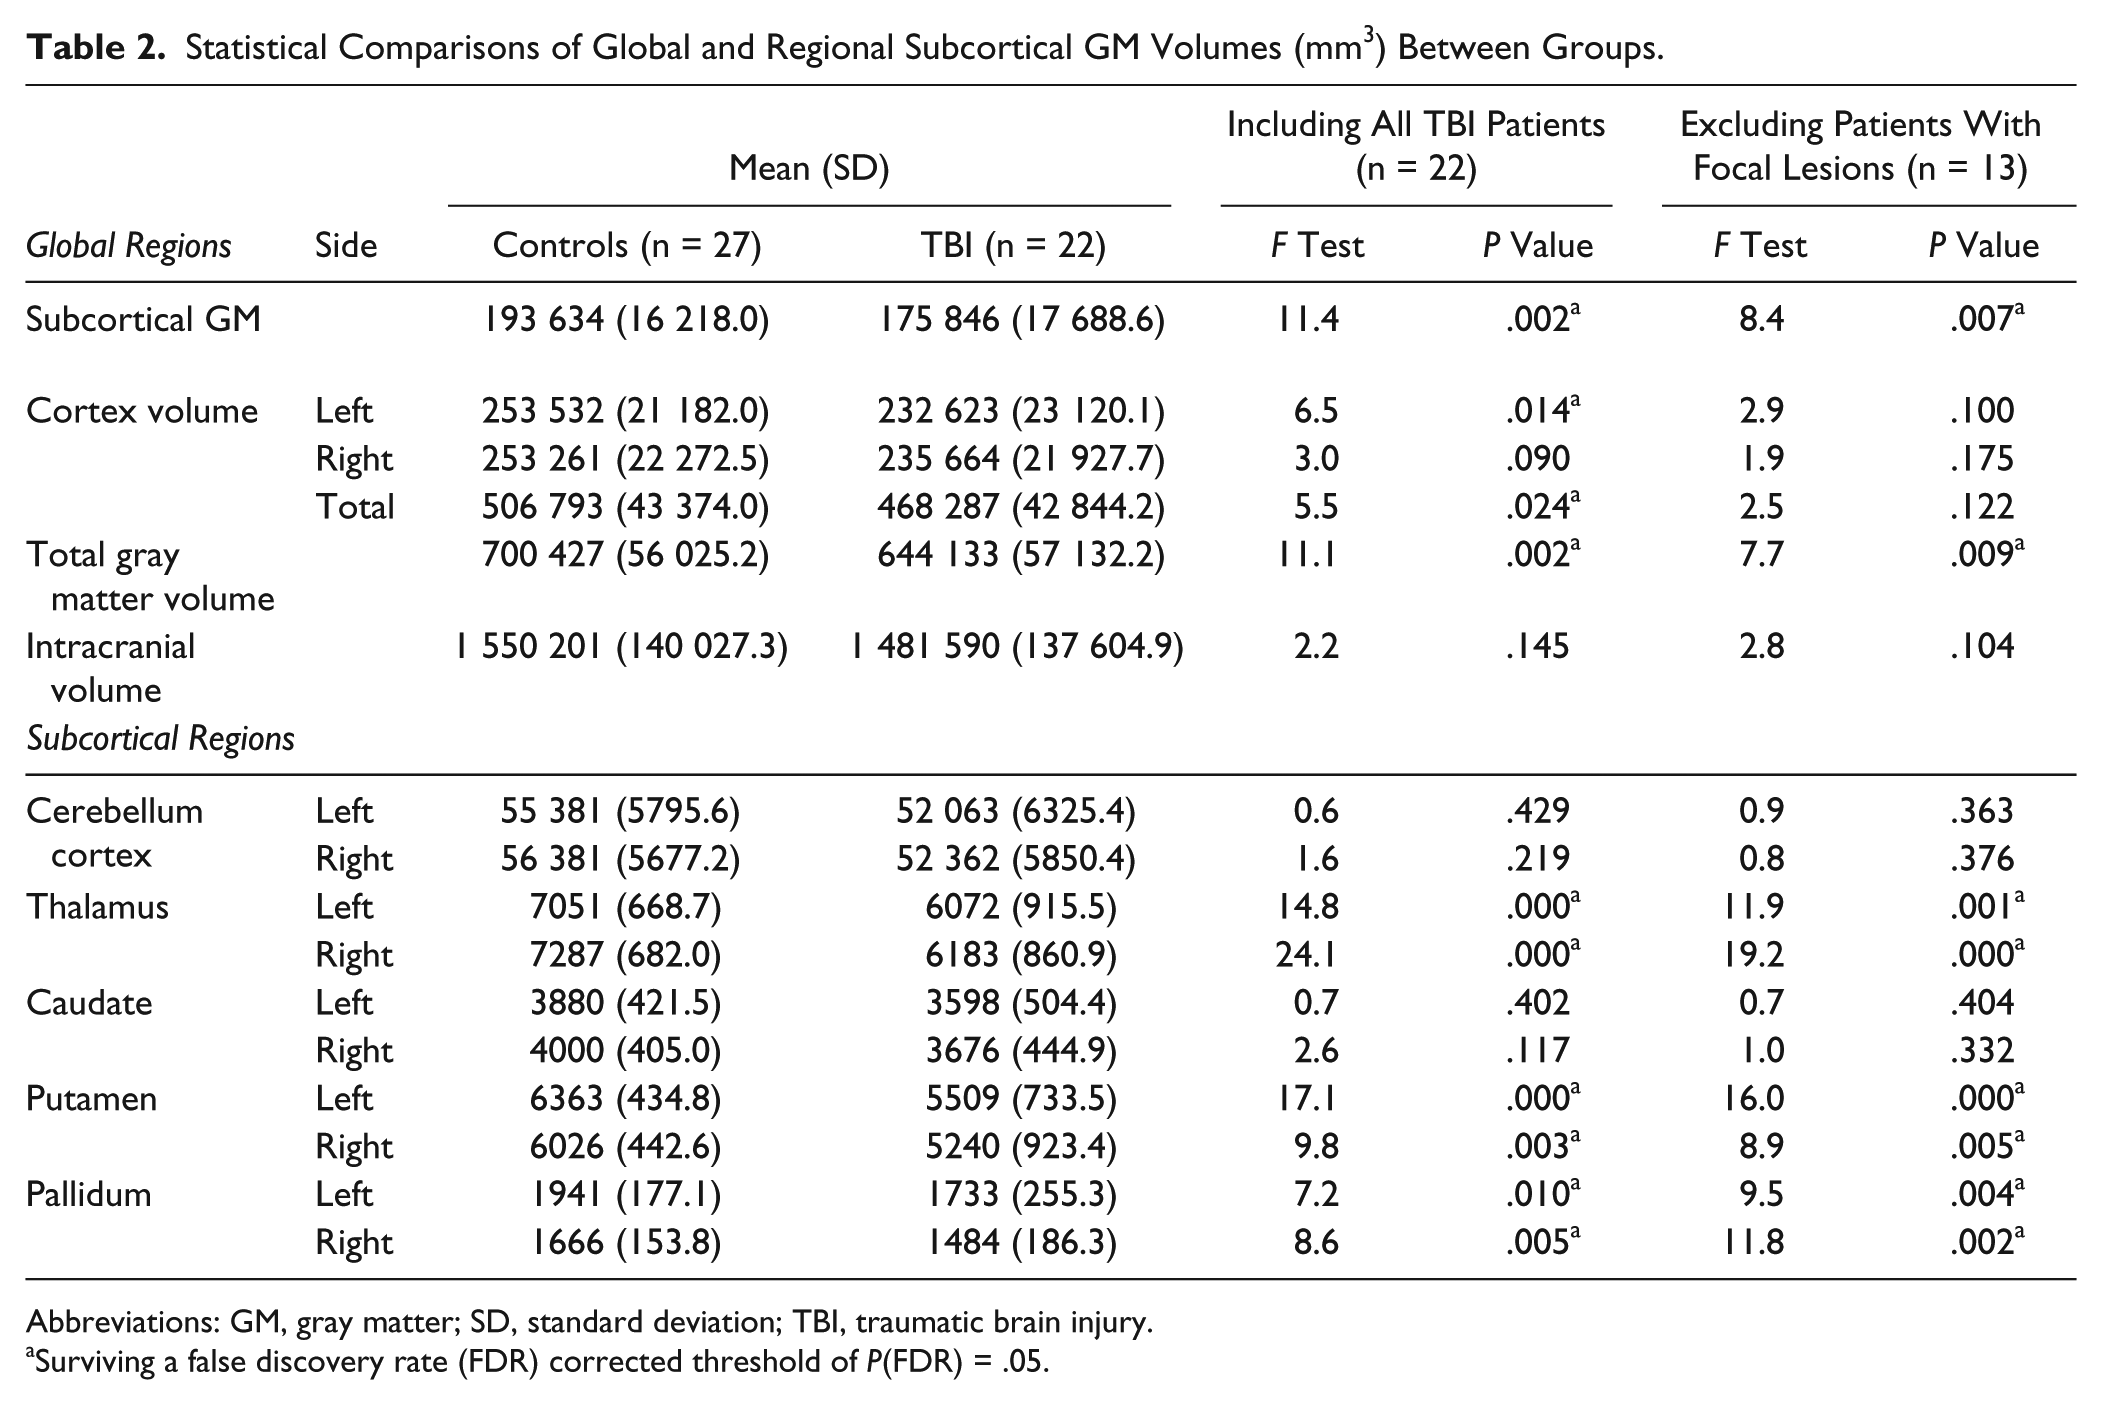
Abbreviations: GM, gray matter; SD, standard deviation; TBI, traumatic brain injury.
Surviving a false discovery rate (FDR) corrected threshold of P(FDR) = .05.
Subcortical Measures
Volumetric analyses revealed volume loss in TBI as compared with controls in the following subcortical regions (see Table 2): bilateral thalamus (left and right: P < .001), bilateral putamen (left: P < .001; right: P = .003), and bilateral pallidum (left: P = .010; right: P = .005). When patients with focal lesions were excluded from the analyses, all subcortical group differences remained significant (see Table 2).
Cortical Measures
Although left and total cortical volume were significantly smaller in the TBI group compared with controls, no significant group differences between TBI patients and controls were found with regard to the volumetric measure of the individual cortical ROIs. Outcomes of the univariate analyses are reported in Supplementary Table S2.
Relationship Between GM Volume and Bimanual Performance
Correlational analyses were performed on the volumetric measures of the cortical and subcortical ROIs. Within groups, no significant correlations (after FDR correction) were found between the cortical volumetric measures and bimanual performance. With respect to the motor-related subcortical areas, within the TBI group, lower performance on the Purdue Pegboard Test was significantly associated with a smaller volume of the right thalamus [r = 0.67; P = .002]. Moreover, a lower performance on the AFT task correlated significantly with smaller volumes of the left and right pallidum [left: r = 0.66, P = .002; right: r = 0.70, P = .001] and the left putamen [r = 0.61; P = .006]; see Figure 2 and Table 3. Within the control group, a higher score on the AFT task correlated significantly with a larger volume of the right pallidum [r = 0.57; P = .003]; see Table 3.
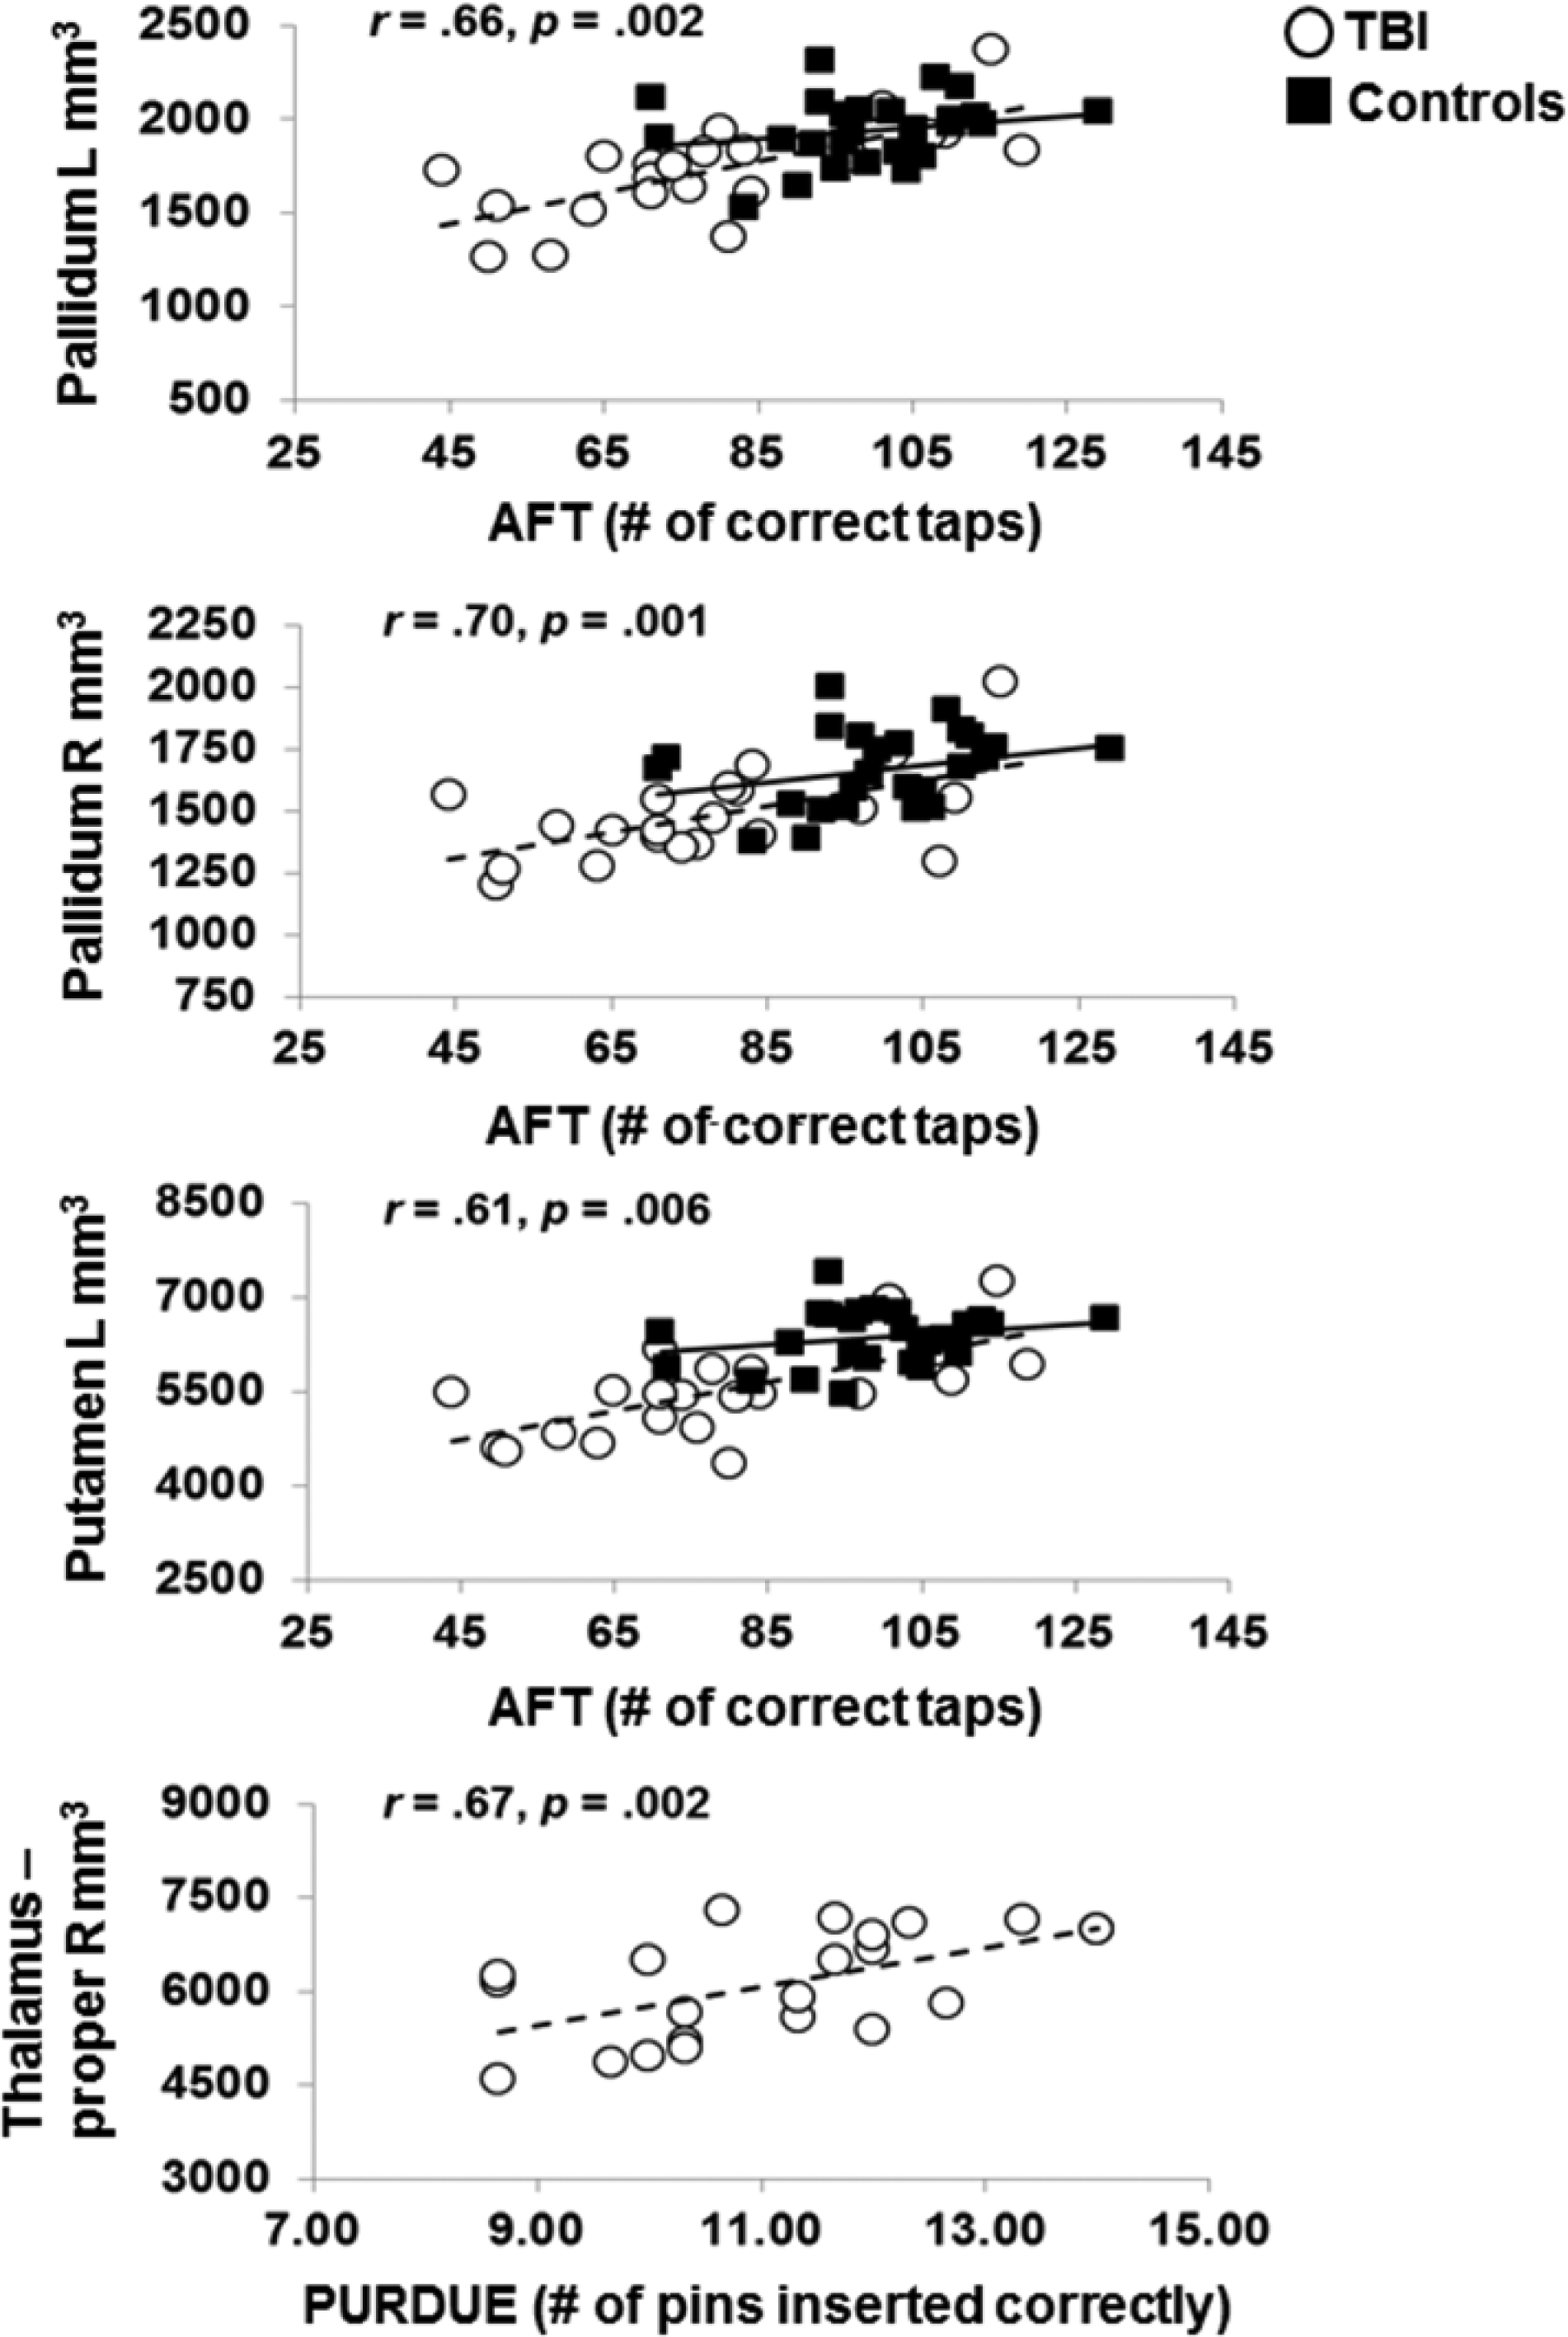
Association between bimanual motor performance (AFT and PURDUE) and GM volume of the pallidum, putamen, and thalamus in TBI patients (white circles with a dashed trendline) and healthy controls (black squares with a full trendline). Correlation coefficients represent the partial correlation statistics within the TBI group. Within the control group, significant correlations were only found for the R pallidum (AFT: r = 0.57; P = .003).
Correlation Analyses Between Subcortical/Cortical GM Volumes and Bimanual Performance Scores.
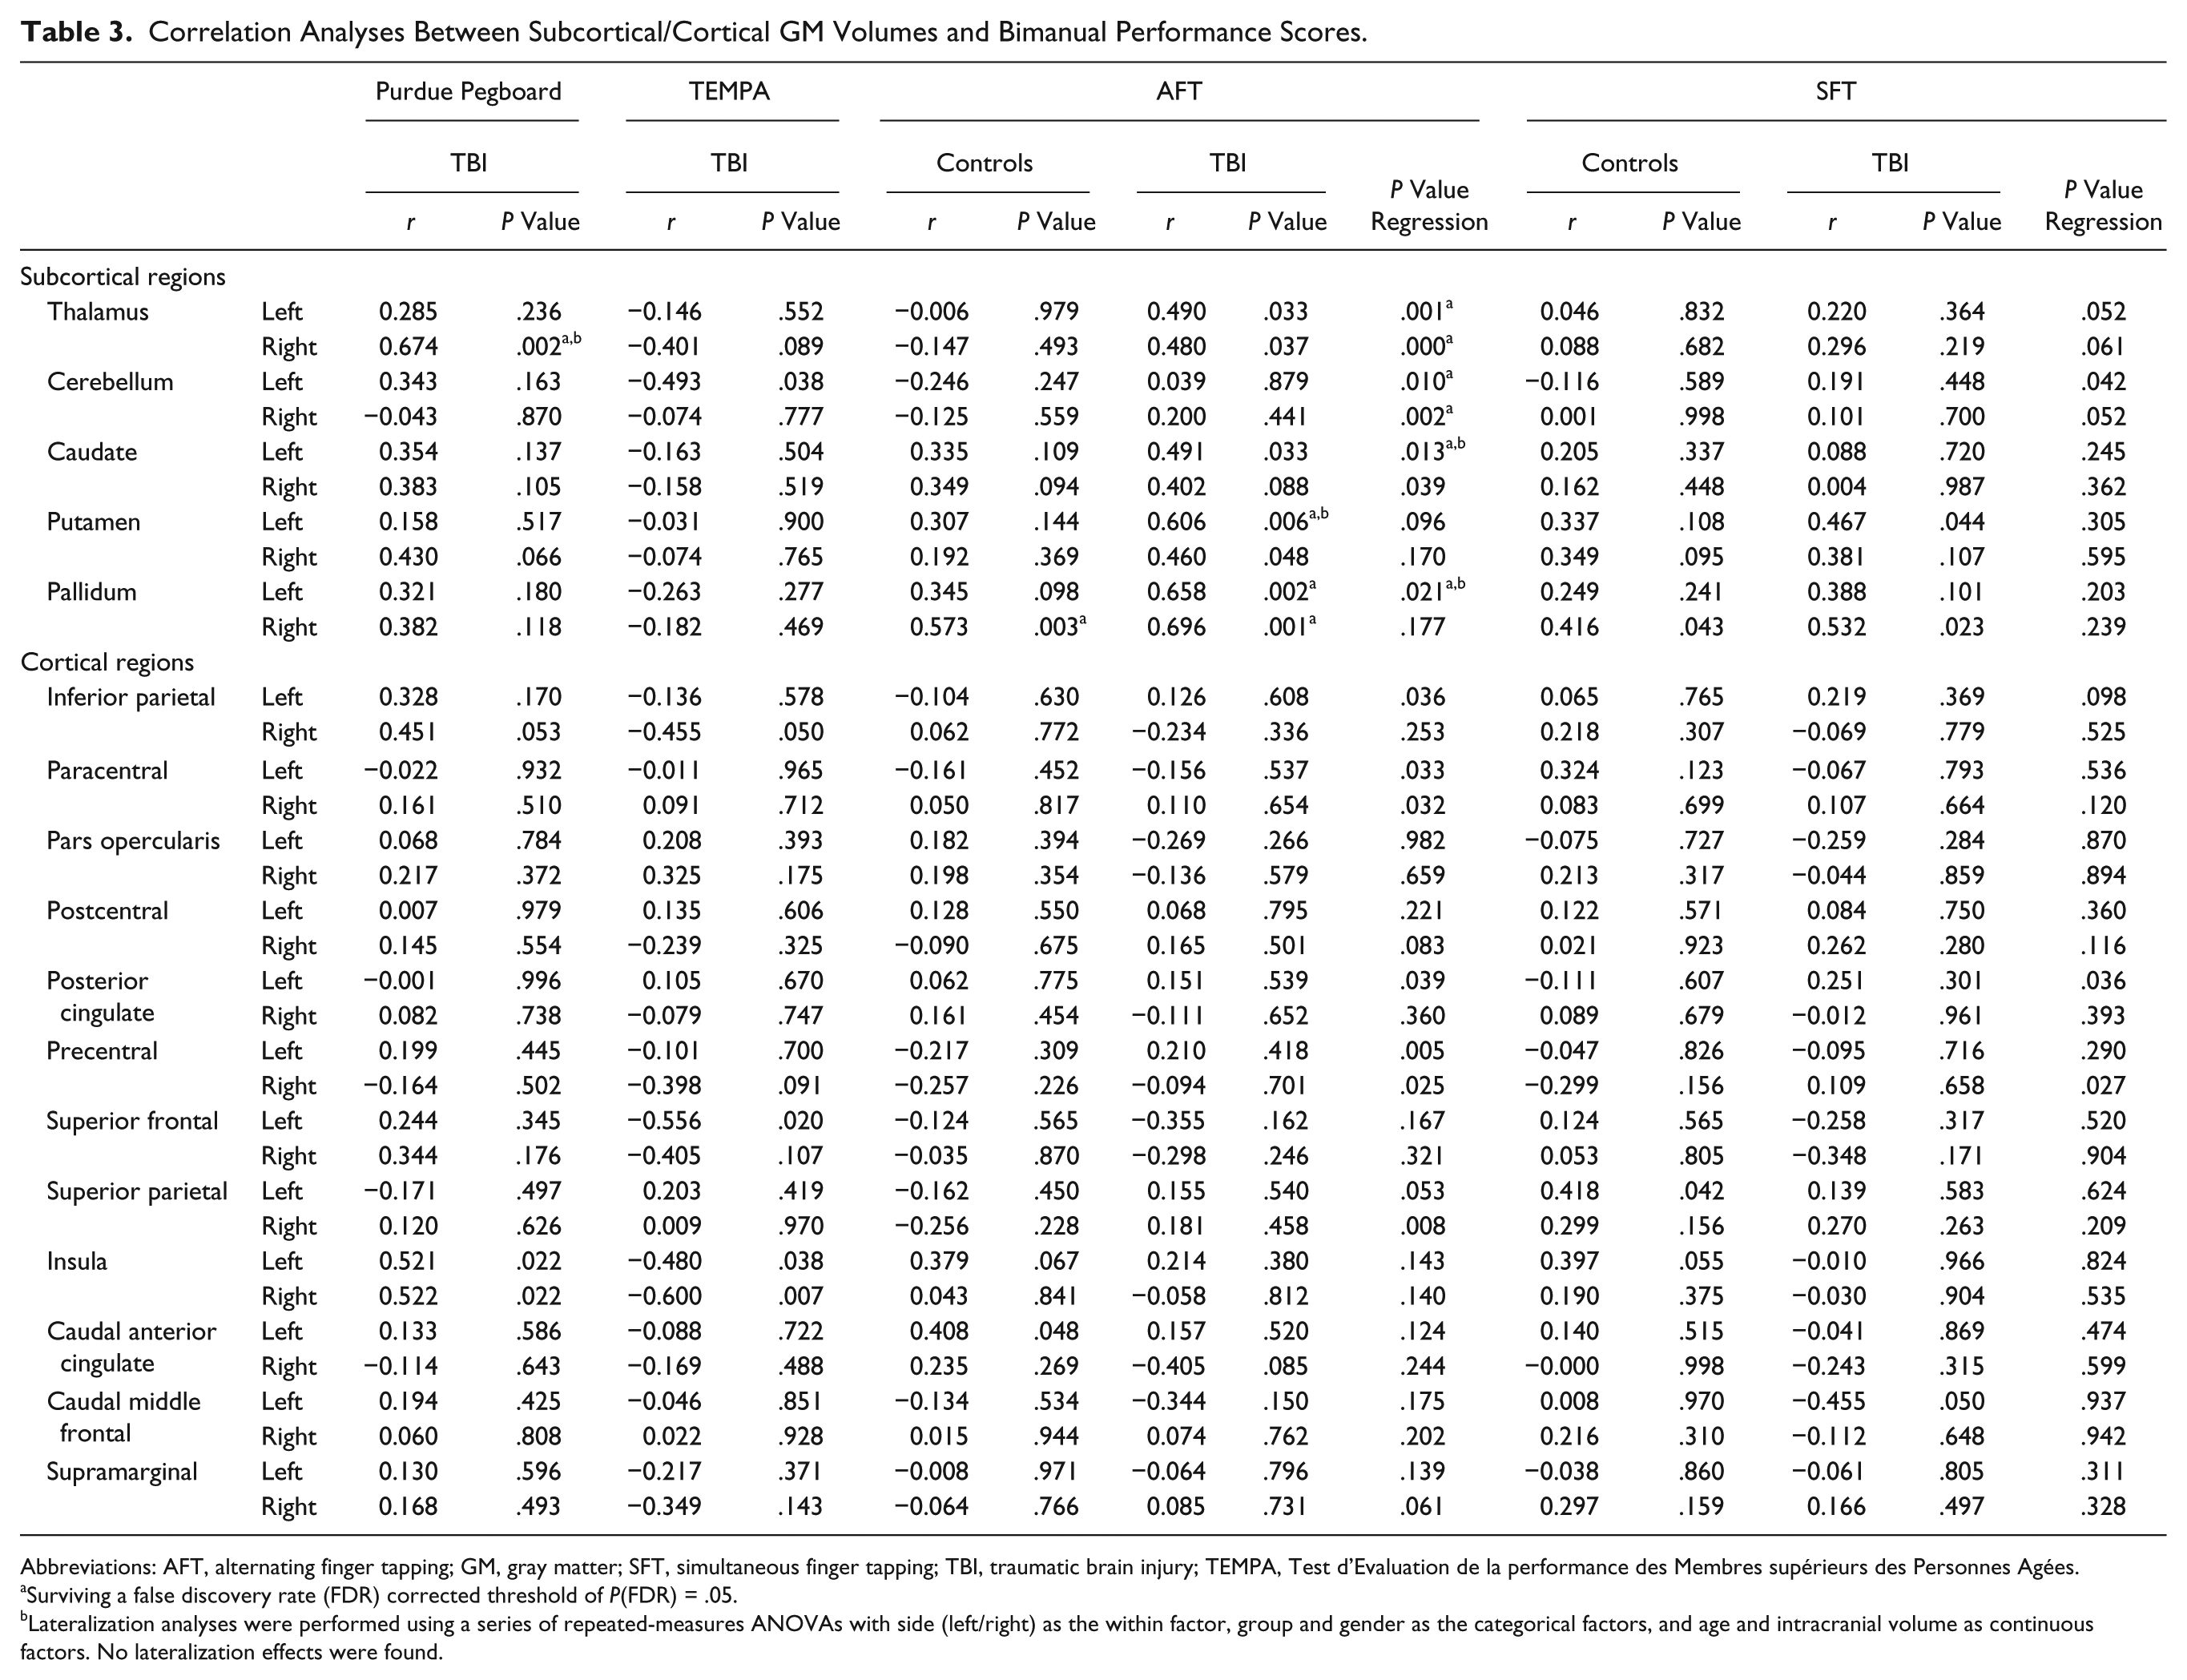
Abbreviations: AFT, alternating finger tapping; GM, gray matter; SFT, simultaneous finger tapping; TBI, traumatic brain injury; TEMPA, Test d’Evaluation de la performance des Membres supérieurs des Personnes Agées.
Surviving a false discovery rate (FDR) corrected threshold of P(FDR) = .05.
Lateralization analyses were performed using a series of repeated-measures ANOVAs with side (left/right) as the within factor, group and gender as the categorical factors, and age and intracranial volume as continuous factors. No lateralization effects were found.
Regression analyses revealed additional significant 3-way interactions: that is, the 2-way interaction between bimanual performance (AFT) and subcortical GM volume varied between groups (left thalamus: P = .001; right thalamus: P < .001, left cerebellum: P = .010; right cerebellum: P = .002; left caudate: P = .013; and left pallidum: P = .021); see Table 3. As depicted in Figure 3, the TBI patients demonstrated a positive association between AFT performance and subcortical volumes—that is, a lower number of taps correlated with a lower subcortical volume, whereas in the control group, no significant association was observed. No significant interactions were found for individual cortical regions or for the association between SFT performance and volumetric measures.
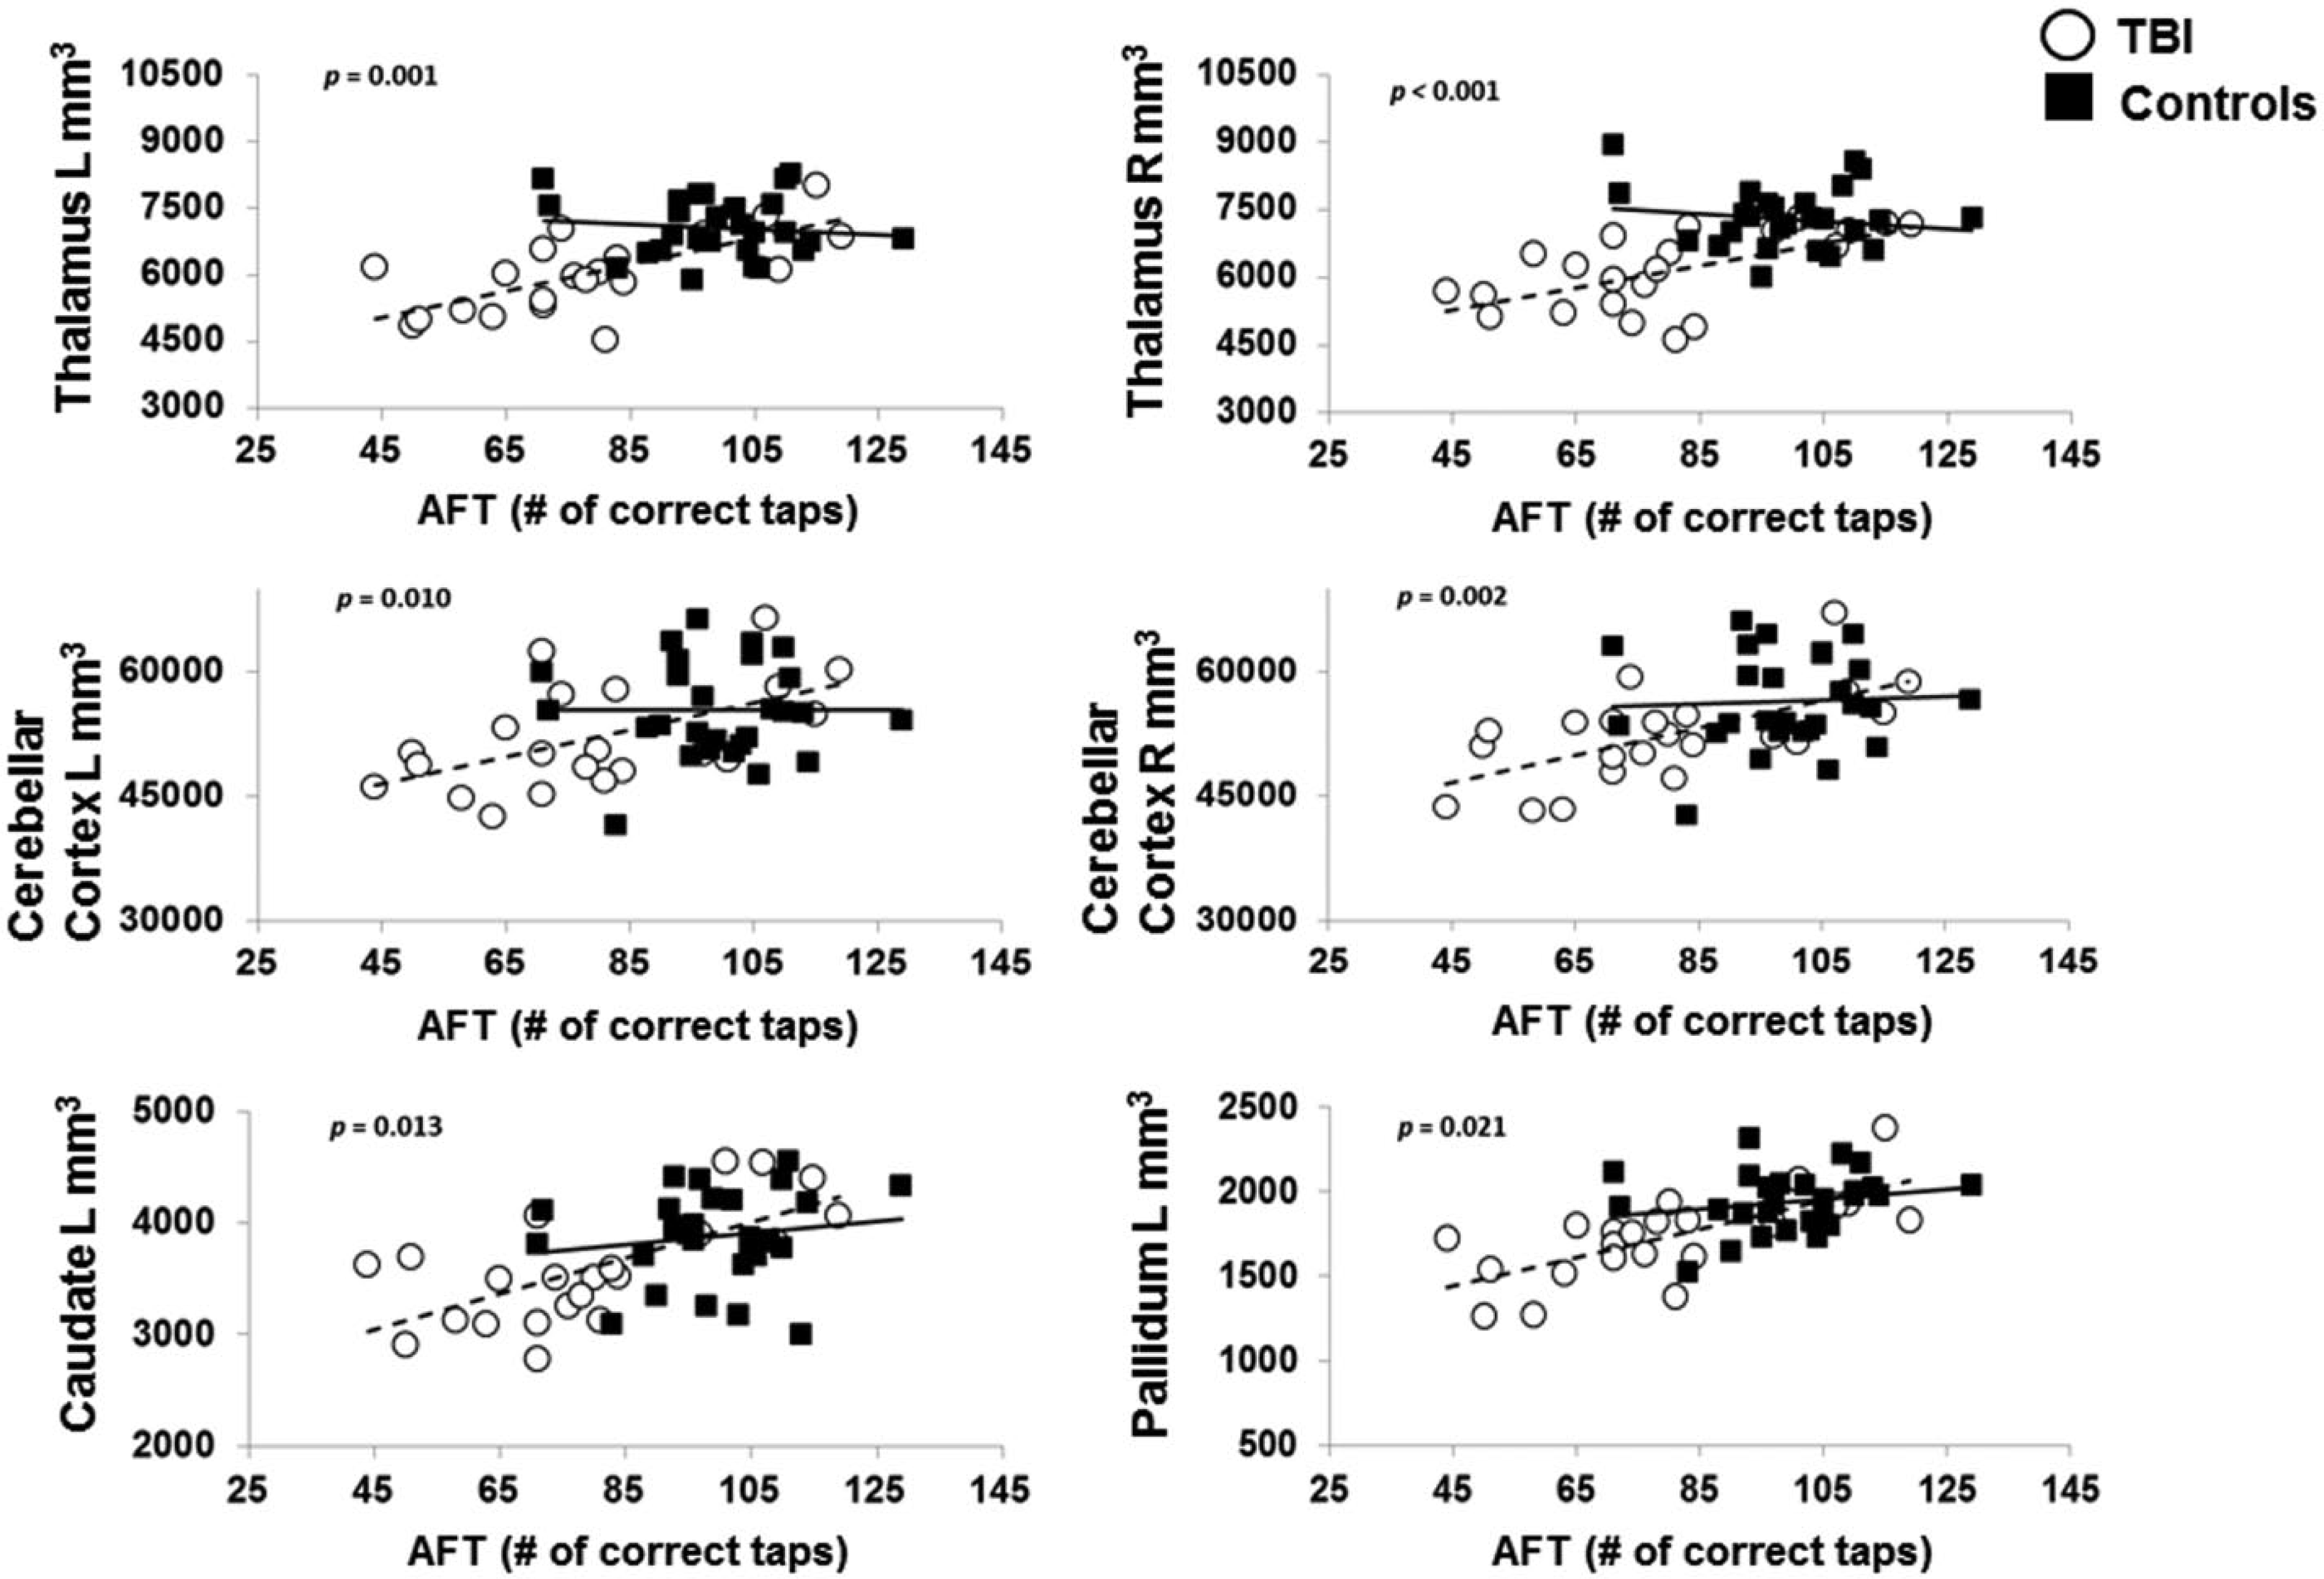
Significant interactions (ie, different slopes) between groups for the association between AFT (alternating finger-tapping) performance and gray matter volumetric measures of the pallidum, caudate, thalamus, and cerebellum. TBI patients are represented as white circles with a dashed trendline and healthy controls as black squares with a full trendline. The reported P values correspond to the regression outcomes.
Discussion
In this study, we first cross-sectionally compared volumetric measures of several cortical and subcortical brain regions between moderate to severe TBI patients and age- and gender-matched controls and subsequently investigated associations between bimanual motor performance, a prototype of a complex daily-life skill, and TBI-induced volumetric changes. We demonstrated that TBI patients performed significantly poorer on the bimanual tasks and showed significantly reduced subcortical GM volumes as compared with controls. It is also important to note that we observed, for the first time, that volumetric alterations in the motor-related subcortical GM structures in TBI patients were significantly associated with poorer bimanual motor performance.
Consistent with the existing adult-TBI literature reporting upper-limb motor impairments, 39 TBI patients in the present study showed significantly lower bimanual performance scores (ie, slower movement times) relative to controls. Moreover, with respect to the volumetric global and subcortical regional group differences, our results are largely in line with findings of previous studies.13,16,18 -20,22,23,40 Regarding the volumetric cortical regional group differences, however, we could not replicate previously reported cortical GM atrophy in several specific (small) cortical regions.13,17,18,20,21 Variations of findings across these studies are perhaps driven by the methodological differences in volumetric analysis and the diversity in clinical profiles of the patients. Altogether, the volumetric group differences observed in the present study fit well with those of Kim et al, 19 who reported atrophy in prominent subcortical nuclei in chronic TBI. This subcortical vulnerability could be a result of the fact that the thalamus and the midbrain undergo the most shearing stress at the time of the trauma. 41
Of main importance here, however, is the presence of significant brain-behavior correlations, implying significant associations between poorer bimanual motor performance and GM volume reductions in the right thalamus, left putamen, and bilateral pallidum within the TBI sample. The association between the right pallidum and the AFT score was similarly present within the healthy control group, which might indicate that the size of the pallidum contributes to the performance of this bimanual task. The behavioral correlations relating to the putamen and thalamus, however, were specific to the TBI group.
Furthermore, regarding the associations with AFT performance, we found significant interaction effects (ie, different slopes between groups) for several of the subcortical GM regions, which again indicates that the association between bimanual performance and volumetric measures is dependent on the presence (or absence) of TBI-induced GM atrophy. To the best of our knowledge, this is the first report to reveal such associations in TBI patients. Although the thalamus has commonly been indicated as a general relay center transferring signals coming from the cerebellum and basal ganglia to the cortical areas, 42 it is also specifically involved in the control of bimanual movements.36,43 -47 Moreover, a recent subcortical volumetric study reveals that age-related atrophy in the thalamus, particularly in subregions serving connections to the premotor, primary motor, and somatosensory areas, contributes to bimanual performance decline. 48 Similarly, the putamen and pallidum appear to be explicitly involved in bimanual task performance via their projections to the primary and secondary cortical motor areas.36,46,49 Additional clinical evidence implicating the role of the putamen and pallidum in bimanual movements emerges from research in Parkinson’s disease. In particular, Parkinson’s disease–induced basal ganglia dysfunction has been indicated as one of the possible factors contributing to bimanual coordination impairments in this patient group. 44
The following limitations are noteworthy. First, we excluded the cortical regions embedded within the focal lesions to ensure genuine findings, thereby reducing statistical power and lowering the probability of finding volumetric group differences in the affected cortices. Second, the relatively great variation in age at injury and time since injury could have influenced the findings. It has been reported that suffering a TBI during childhood (<18 years of age), may potentially interfere with the typical pattern of cortical development (ie, increased cortical thinning as well as failure to prune). 50 Therefore, to account for this confounding factor, we first performed post hoc analyses on a subgroup of patients, excluding those with a childhood injury (n = 6). We found comparable results regarding the subcortical and cortical structures. However, the sparse significant global group differences disappeared (see Supplementary Table S3). Next, with respect to time since injury, we merely included patients in a chronic stage postinjury (>6 months), a period in which the bulk of GM loss has already occurred. 51 Moreover, with respect to the significant correlations between cortical/subcortical volumetric measures and bimanual performance, we observed that these were neither driven by TBI patients with a relatively recent trauma or by TBI patients with a childhood injury (see Supplementary Figure S1), nor were there significant correlations between age at injury or time since injury and cortical/subcortical volumetric measures or bimanual performance. Nonetheless, future research should take these confounding factors into consideration when recruiting a TBI sample. Finally, FreeSurfer provided us with the global volume of each subcortical structure. It is possible that within a certain subcortical structure such as the cerebellum, subregional atrophy coexisted with subregional volume expansion, resulting in an overall preserved global volume measure. Therefore, future research using voxel based morphometry (VBM) or shape analysis methods is needed to further investigate localized GM abnormalities within the subcortical structures.
Conclusion
Our findings demonstrate that GM atrophy in specific subcortical motor-related structures is associated with motor impairments in TBI, more specifically with impaired bimanual task performance. The findings may provide new insights into the etiology of motor control impairments following brain trauma.
Footnotes
Acknowledgements
The authors thank Iseult Beets from the Movement Control and Neuroplasticity Research Group, KU Leuven, for her contribution to the imaging data collection.
Authors’ Note
JG and SC contributed equally to the manuscript.
Declaration of Conflicting Interests
The authors declared no potential conflicts of interest with respect to the research, authorship, and/or publication of this article.
Funding
The authors disclosed receipt of the following financial support for the research, authorship, and/or publication of this article: This work was supported by the Interuniversity Attraction Poles program of the Belgian federal government (P7/11). Additional support was provided by the Research Fund KU Leuven (OT/11/071) and FWO Vlaanderen (G.0721.12, G.A114.11). JG is funded by the KU Leuven Research Fund (PDMK/14/165).