
Abstract
Background. Cerebral vision disorders (CVDs) are frequent after brain damage and impair the patient’s outcome. Yet clinically and psychometrically validated procedures for the anamnesis of CVD are lacking. Objective. To evaluate the clinical validity and psychometric qualities of the Cerebral Vision Screening Questionnaire (CVSQ) for the anamnesis of CVD in individuals poststroke. Methods. Analysis of the patients’ subjective visual complaints in the 10-item CVSQ in relation to objective visual perimetry, tests of reading, visual scanning, visual acuity, spatial contrast sensitivity, light/dark adaptation, and visual depth judgments. Psychometric analyses of concurrent validity, specificity, sensitivity, positive/negative predictive value, and interrater reliability were also done. Results. Four hundred sixty-one patients with unilateral (39.5% left, 47.5% right) or bilateral stroke (13.0%) were included. Most patients were assessed in the chronic stage, on average 36.7 (range = 1-620) weeks poststroke. The majority of all patients (96.4%) recognized their visual symptoms within 1 week poststroke when asked for specifically. Mean concurrent validity of the CVSQ with objective tests was 0.64 (0.54-0.79, P < .05). The mean positive predictive value was 80.1%, mean negative predictive value 82.9%, mean specificity 81.7%, and mean sensitivity 79.8%. The mean interrater reliability was 0.76 for a 1-week interval between both assessments (all P < .05). Conclusion. The CVSQ is suitable for the anamnesis of CVD poststroke because of its brevity (10 minute), clinical validity, and good psychometric qualities. It, thus, improves neurovisual diagnosis and guides the clinician in the selection of necessary assessments and appropriate neurovisual therapies for the patient.
Introduction
Cerebral vision disorders (CVDs) are found in 30% to 40% of individuals poststroke 1 younger than 65 years and in 40% to 60% of patients 65 years and older. 2 CVDs impair the patient’s outcome 3 and, therefore, require a rapid and accurate diagnosis from the clinician. 4 Apart from homonymous visual field disorders 5 (VFDs) that are the most frequent visual deficits after stroke, 2 visual impairments poststroke may also include impairment of visual scanning,6,7 reading, 8 visual acuity, contrast sensitivity,9,10 color perception, 11 light and dark adaptation, 12 binocular fusion,13,14 stereopsis, 5 depth perception, 15 and visuospatial perception. 16 Furthermore, higher visual dysfunctions such as agnosia, optic ataxia, visuospatial neglect, and Bálint-Holmes syndrome 17 may also be observed in patients following a stroke. Subjectively, these disorders can affect visual scanning, reading, perception of obstacles, spatial relations in depth, and reaching for visually presented objects as well as the recognition of persons, objects, and spatial orientation in the environment. Objectively, homonymous VFDs are associated with an adverse functional outcome1,18 and impaired driving 19 and hinder vocational reintegration. 20 Furthermore, CVDs often prevent a valid investigation of other neuropsychological functions such as reading, memory, or attention because most tests rely on visual stimuli. 21 In sum, CVDs are highly relevant in neurorehabilitation because they have important consequences for functional activity and participation levels according to the International Classification of Functioning, Disability and Health (ICF; see World Health Organization 22 for further information). Thus, they should be diagnosed and treated as early as possible. 4 Therefore, a rapid, sensitive, clinically valid, and reliable assessment for the anamnesis of CVD would be useful to identify affected patients and help the clinician select appropriate diagnostic tests and effective neurovisual treatments. To the best of our knowledge, such standardized procedures for a rapid anamnesis of CVD are either lacking or have not been evaluated clinically and psychometrically. Therefore, our objectives in the present study were to evaluate the clinical validity and psychometric features of the Cerebral Vision Screening Questionnaire (CVSQ; see the appendix) in individuals poststroke. Practically, we correlated the subjective results in the 10-item questionnaire with objective neurovisual diagnostic findings in a large sample of individuals poststroke, with or without different types of CVDs. The diagnostic sensitivity, specificity, positive and negative predictive values of the CVSQ, and the concurrent validity and interrater reliability were analyzed in detail. Subjective visual complaints were correlated with objective diagnostic investigations (perimetry, visual search field, screening for neglect and Bálint-Holmes syndrome, reading, contrast sensitivity, light and dark adaptation, and visual distance estimation; see below) to explore the clinical validity and other psychometric features of the CVSQ in identifying objective neurovisual disorders in individuals suffering from stroke.
Finally, we sought to evaluate the impact of a reduced awareness of the patients of their own impairment (eg, as a result of visual neglect) 23 on the diagnostic sensitivity of the questionnaire.
Methods
Cerebral Vision Screening Questionnaire
As many patients with CVD do not mention visual dysfunctions spontaneously unless specifically questioned, 21 we constructed the CVSQ, a 10-item questionnaire to assess the most frequent visual complaints of individuals following stroke. The item selection was based on our clinical experience. No adaptation of pre-existing instruments was performed. The questions in the CVSQ (see the appendix) were orally asked by the clinician, and the patient was requested to answer the questions verbally. These answers were written down by the clinician and later analyzed (see section Statistical Analyses). Based on our extensive clinical experience with poststroke patients with CVD, we made the following hypotheses: reading deficits (item 2) are related to the performance in a reading test. Problems in visual exploration (item 3) were hypothesized to be associated with VFD, visual search performance, and performance in the Distance Judgment Task (DJT). Problems in depth estimation and object reaching (item 4) were assumed to be related to DJT performance. For dazzle and dark vision (item 5, item 6), we hypothesized correlations with altered subjective illumination. Blurred vision and changes in color perception were supposed to be linked with disturbed Cambridge Contrast Test performance. Additionally, we performed a regression analysis to evaluate the diagnostic sensitivity of the CVSQ for the detection of VFD because standard clinical confrontation methods show a low sensitivity. 24
Patients
For the present analysis, 461 patients were recruited from June 2006 to September 2014 from the Neuropsychological Outpatient Unit at the Saarland University in Saarbruecken, Germany (Table 1). Inclusion criteria were unilateral or bilateral stroke (infarction or hemorrhage). Exclusion criteria were neurological etiologies other than stroke, any psychiatric condition or diseases of the anterior visual pathways, gaze palsy, paresis of the eyes, and pupillary dysfunction (for details see Kerkhoff1,25,26). Presence or absence of cerebral visual symptoms were no selection criteria. Patients with aphasia were excluded from the sample on the basis of a standardized aphasia test (Der Aachener Aphasie Test) 27 because they could not understand the questions or respond orally. Patients with VFD typically have problems in horizontal reading, whereas reading of vertically presented words remains unimpaired (except in vertical VFD). In contrast, patients with verbal alexia are impaired in both horizontal and vertical reading. Therefore, verbal alexia was excluded on the basis of the patient’s performance in vertical reading of single words. 28 Not all 461 patients could give valid answers to some of the questions of the CVSQ because of nonvisual deficits (ie, item “climbing stairs” in patients with associated hemiparesis).
Clinical and Demographic Details (Mean, Percentage) of the Patient Sample (n = 461), for Different Subgroups of the Total Sample (n = 461). a
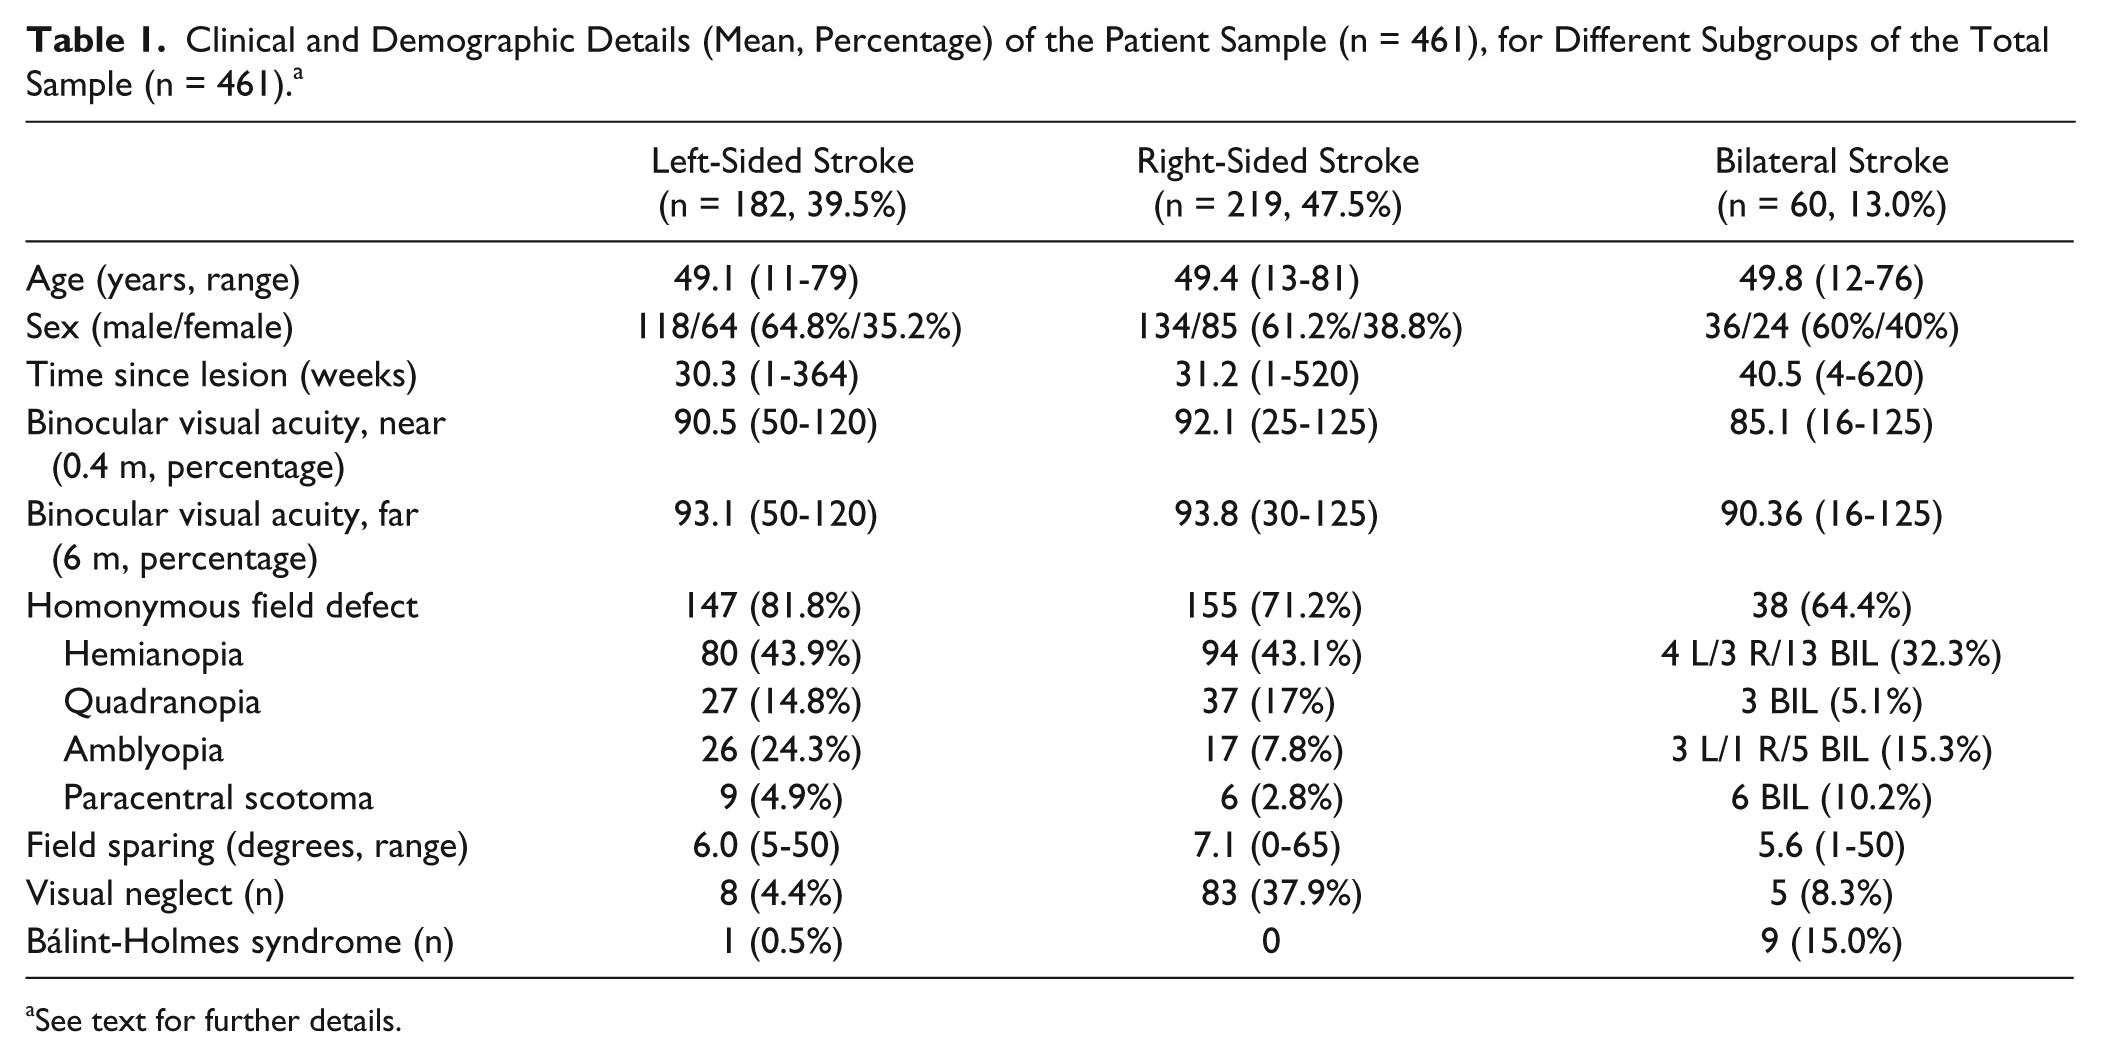
See text for further details.
All patients fulfilling the selection criteria participated in the study. For the present analysis, patients were consecutively recruited from June 2006 to September 2014. Informed consent was obtained from all patients in accordance with the declaration of Helsinki II.
Orthoptic and Ophthalmological Tests
In all patients, an orthoptic and ophthalmological status was obtained, including visual acuity for the near (0.4 m) and far viewing distance (6 m), convergent fusion, convergence and divergence movements, accommodation, stereopsis, ocular motility, and pupillary functions (see Schaadt et al 13 for a detailed description of these assessments). In case of reduced visual acuity, an objective refractometry was performed, and acuity was corrected with glasses prescribed by the ophthalmologist.
In the next section, we describe the clinical tests that were used for the assessment of the different neurovisual disorders (see Figure 1 for illustration).
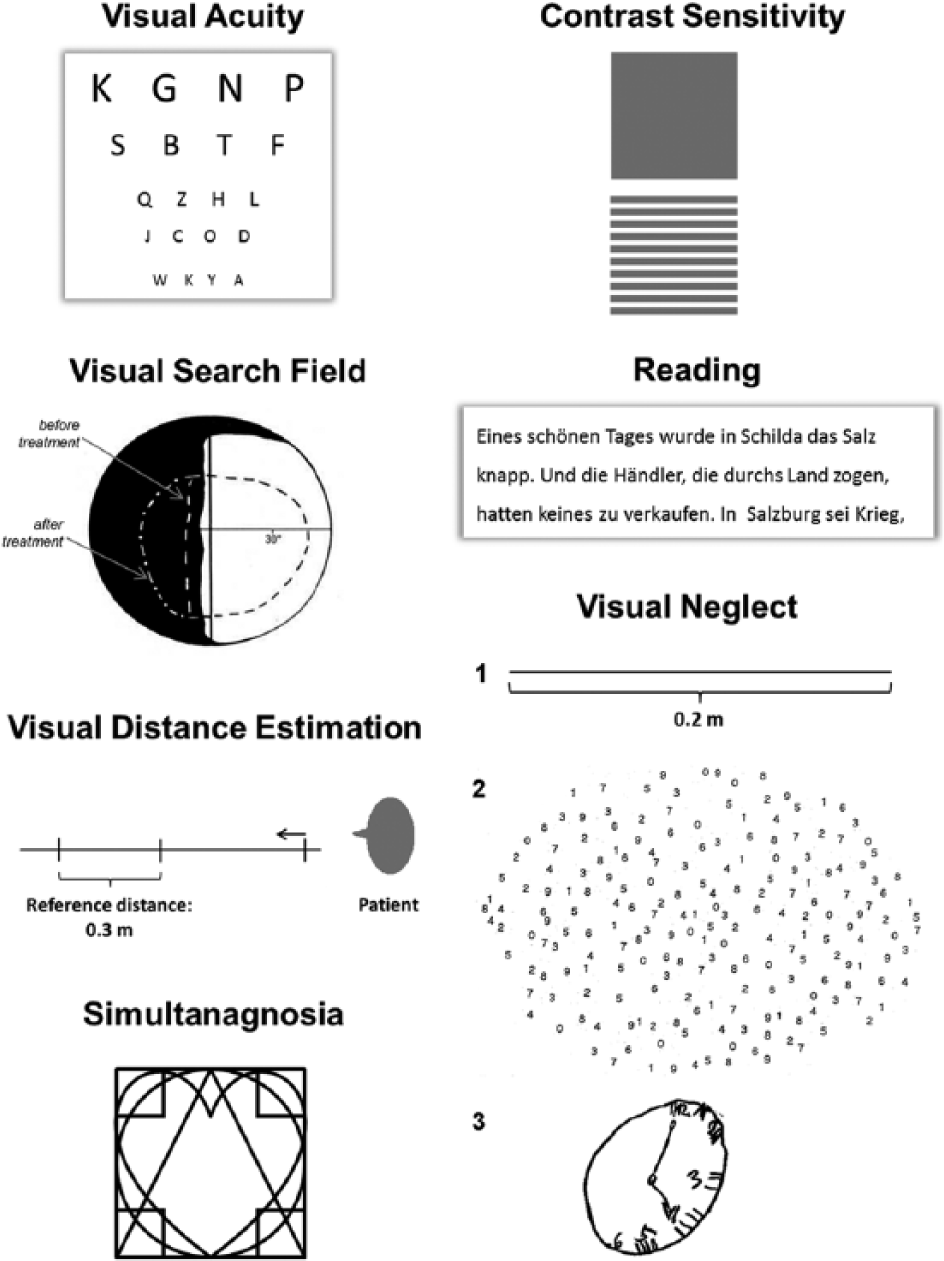
Illustration of the neurovisual assessments used in the present study (see Methods section for details).
Visual Perimetry and Visual Search Field
Binocular visual fields (90° eccentricity) and visual search fields were mapped with a Tuebingen bowl perimeter using dynamic visual perimetry (circular target; luminance: 102 cd/m2; size: 1.02°; details see Kerkhoff et al 29 ; results see Table 1). For assessment of the visual search field, the patient’s oculomotor capacities in the blind field were measured. 29 The circular white target was moved along every meridian (periphery to center; speed = 2°/s). We indicate the average of the search field of all 6 meridians lying in the blind hemifield or quadrant; the lower normal cutoff was 31° (derived from the value of 40.8° in control patients without VFD; 2.5 SDs). 25
Visual Neglect
Three conventional screening tests were used (see Figure 1): horizontal line bisection (a single 20 × 0.5 cm2 horizontal line, presented on a white sheet of paper, 29.7 × 21 cm2) 30 ; drawing of symmetrical visual objects from memory (daisy, clock, face, star) 31 ; cancellation of 20 numerals (10 left, 10 right) randomly distributed among 200 distracters on a 29.7 × 21 cm2 sized sheet of white paper. 32 Visual neglect was diagnosed when (1) the patient’s line bisection deviated >1° (=5 mm) to the ipsilesional side 33 ; (2) when >1 drawing showed contralesional omissions; or (3) when >1 number was omitted on the contralesional as compared with the ipsilesional side of the cancellation task. 32
Bálint-Holmes Syndrome
We assessed the 3 hallmarks of this syndrome 17 : spasmodic fixation was screened in the orthoptic investigation. Optic ataxia was tested by reaching for visual targets presented peripherally in both hemispaces while fixating a central visual target.4,34 Simultanagnosia was assessed by overlapping figures that had to be extracted by the patient (see Figure 1; normal cutoff: >6 geometric symbols). 35
Reading
A standardized, 180-word reading test 28 was presented on a vertically oriented, white sheet of paper (21 × 29.7 cm2, Arial black, point size 12, double line spacing, 40 cm viewing distance) on a desk in a daylight-lit room (400 Lux room illumination, see Figure 1). The patient wore his near correction if necessary and was instructed to read the text aloud as quickly and correctly as possible. Reading errors (cutoff: maximum 2) and reading time (cutoff: maximum 2 minutes) were recorded.
Spatial Contrast Sensitivity
Spatial contrast sensitivity was tested with the Cambridge Low Contrast Gratings 36 (see Figure 1 for an illustration). The measurements were performed monocularly and binocularly (6 m distance) by the patient, wearing the far-viewing correction if necessary. The binocular contrast sensitivity score was used for statistical analyses.
Light and Dark Adaptation
Photopic adaptation (adaptation from darkness to brightness) and scotopic adaptation (adaptation from brightness to darkness) were tested with a Tuebingen perimeter. 37 A fixation target (69 inches in diameter) was presented for 500 ms in the center of the perimeter between 4 red spots. Light difference thresholds were determined using the ascending method of limits. A loss of light adaptation, dark adaptation, or light and dark adaptation was diagnosed when the increase of sensitivity during light and dark adaptation was less than the cutoff values for normal individuals of the same age. 12 In addition, a subjective rating of illumination was performed while the participants viewed a white sheet of paper with black text. They were asked to indicate whether the illumination was “comfortable” for reading, “too bright for reading,” or “too dark for reading” while the clinician increased/decreased illumination intensity via a dimmer. The mean illumination (Lux) was computed from 6 measurements based on 3 ascending, respectively descending, illumination trials.
Visual Distance Estimation
Estimation of distances in depth was measured using a metal pole (see Figure 1). The patient sat at a distance of 0.5 m in front of a 1-m measuring pole, pointing away from the patient. On this measuring pole, a distance (0.3 m) between 2 marks was shown. The patient was to reproduce this distance by shifting a third mark in front of or behind this preset distance. Three trials were performed in front of (0.5 m distance) and behind (1 m distance) the preset distance. For statistical analysis, the median of these 3 trials was calculated. Depth perception was considered as impaired when the patient’s judgment in any of the 2 distances exceeded the normal cutoff score of ±25 mm deviation from the correct distance. 38
All orthoptic and ophthalmological tests were performed immediately after the CVSQ on the same day.
Statistical Analyses
Because the patient’s subjective response to most of the items in the CVSQ can be classified as a binary decision with respect to a certain symptom (“yes/no”), the result of this can be termed as positive (= visual symptom present) or negative (visual symptom absent) and related to objective test results (disorder present = yes; disorder absent = no). Accordingly, we calculated the following 4 parameters: sensitivity, specificity, and positive and negative predictive values to characterize the ability of the CVSQ to correctly identify those patients reporting versus not reporting a certain symptom in relation to objective diagnostic results. Sensitivity denotes the percentage of correctly identified patients with an objective neurovisual disorder among all patients with such an objective disorder. Specificity means the percentage of correctly identified patients without an objective neurovisual disorder among all patients without such an objective disorder. The positive prognostic value indicates the percentage of correctly identified positive results among all positive results. The negative predictive value indicates the percentage of correctly identified negative results among all negative results for this neurovisual disorder.
Psychometric Investigations
For examination of the interrater agreement, Φ coefficients (ie, correlation coefficients for categorical data) 39 were computed in a subsample of 76 patients by having 2 examiners assess the same patient twice (within 1 week). Those patients were a random selection of the total sample. In addition, we compared this subsample with the remaining sample with respect to clinical and demographic variables, showing that this subsample is representative of the whole sample.
To evaluate the concurrent clinical validity of the CVSQ, we computed Φ coefficients between the subjective statements and whether the patient was impaired in the specific objective tests according to the cutoff scores described in the section “Orthoptic and Ophthalmological Tests” above. Φ Coefficients were calculated for all patients in the sample and for a reduced group by excluding those individuals showing visual neglect or Bálint-Holmes syndrome. This was done because unawareness of disease is often associated with these 2 syndromes and might influence the psychometric results.
Clinical Findings in Relation to the CVSQ
To evaluate the results of relevant objective neurovisual assessments in individuals reporting versus not reporting a certain visual symptom in the CVSQ, ANCOVAs with the covariates contrast sensitivity (except question 7 and 8 as contrast sensitivity was the dependent variable there), and near and far visual acuity were run. The purpose of this analysis was to delineate potential causes for reported visual symptoms and to illustrate the clinical validity of the CVSQ to prompt suitable diagnostic tests.
Sensitivity, Specificity, and Positive and Negative Predictive Values
To analyze the predictive value of the CVSQ for the screening of VFD, which are frequent diagnostic issues in the neurological assessment of an individual with stroke, a logistic regression analysis was performed on the existence of VFD with the items 2 to 9 of the CVSQ (see the appendix) as predictors. Data from 399 persons were available for this analysis.
Results
Frequencies of Reported Visual Disorders
Table 2 reports absolute and relative frequencies of every reported visual disorder in the CVSQ as well as the time of first perception of these disorders by the patient. On average, 96.4% of the patients reporting visual symptoms noticed these immediately after the lesion or within 1 week postlesion (see Table 2).
Absolute and Relative Frequencies (Percentage of the Total Sample) of Reported Visual Disorders and Time of First Perception of Different Visual Disorders in the CVSQ.
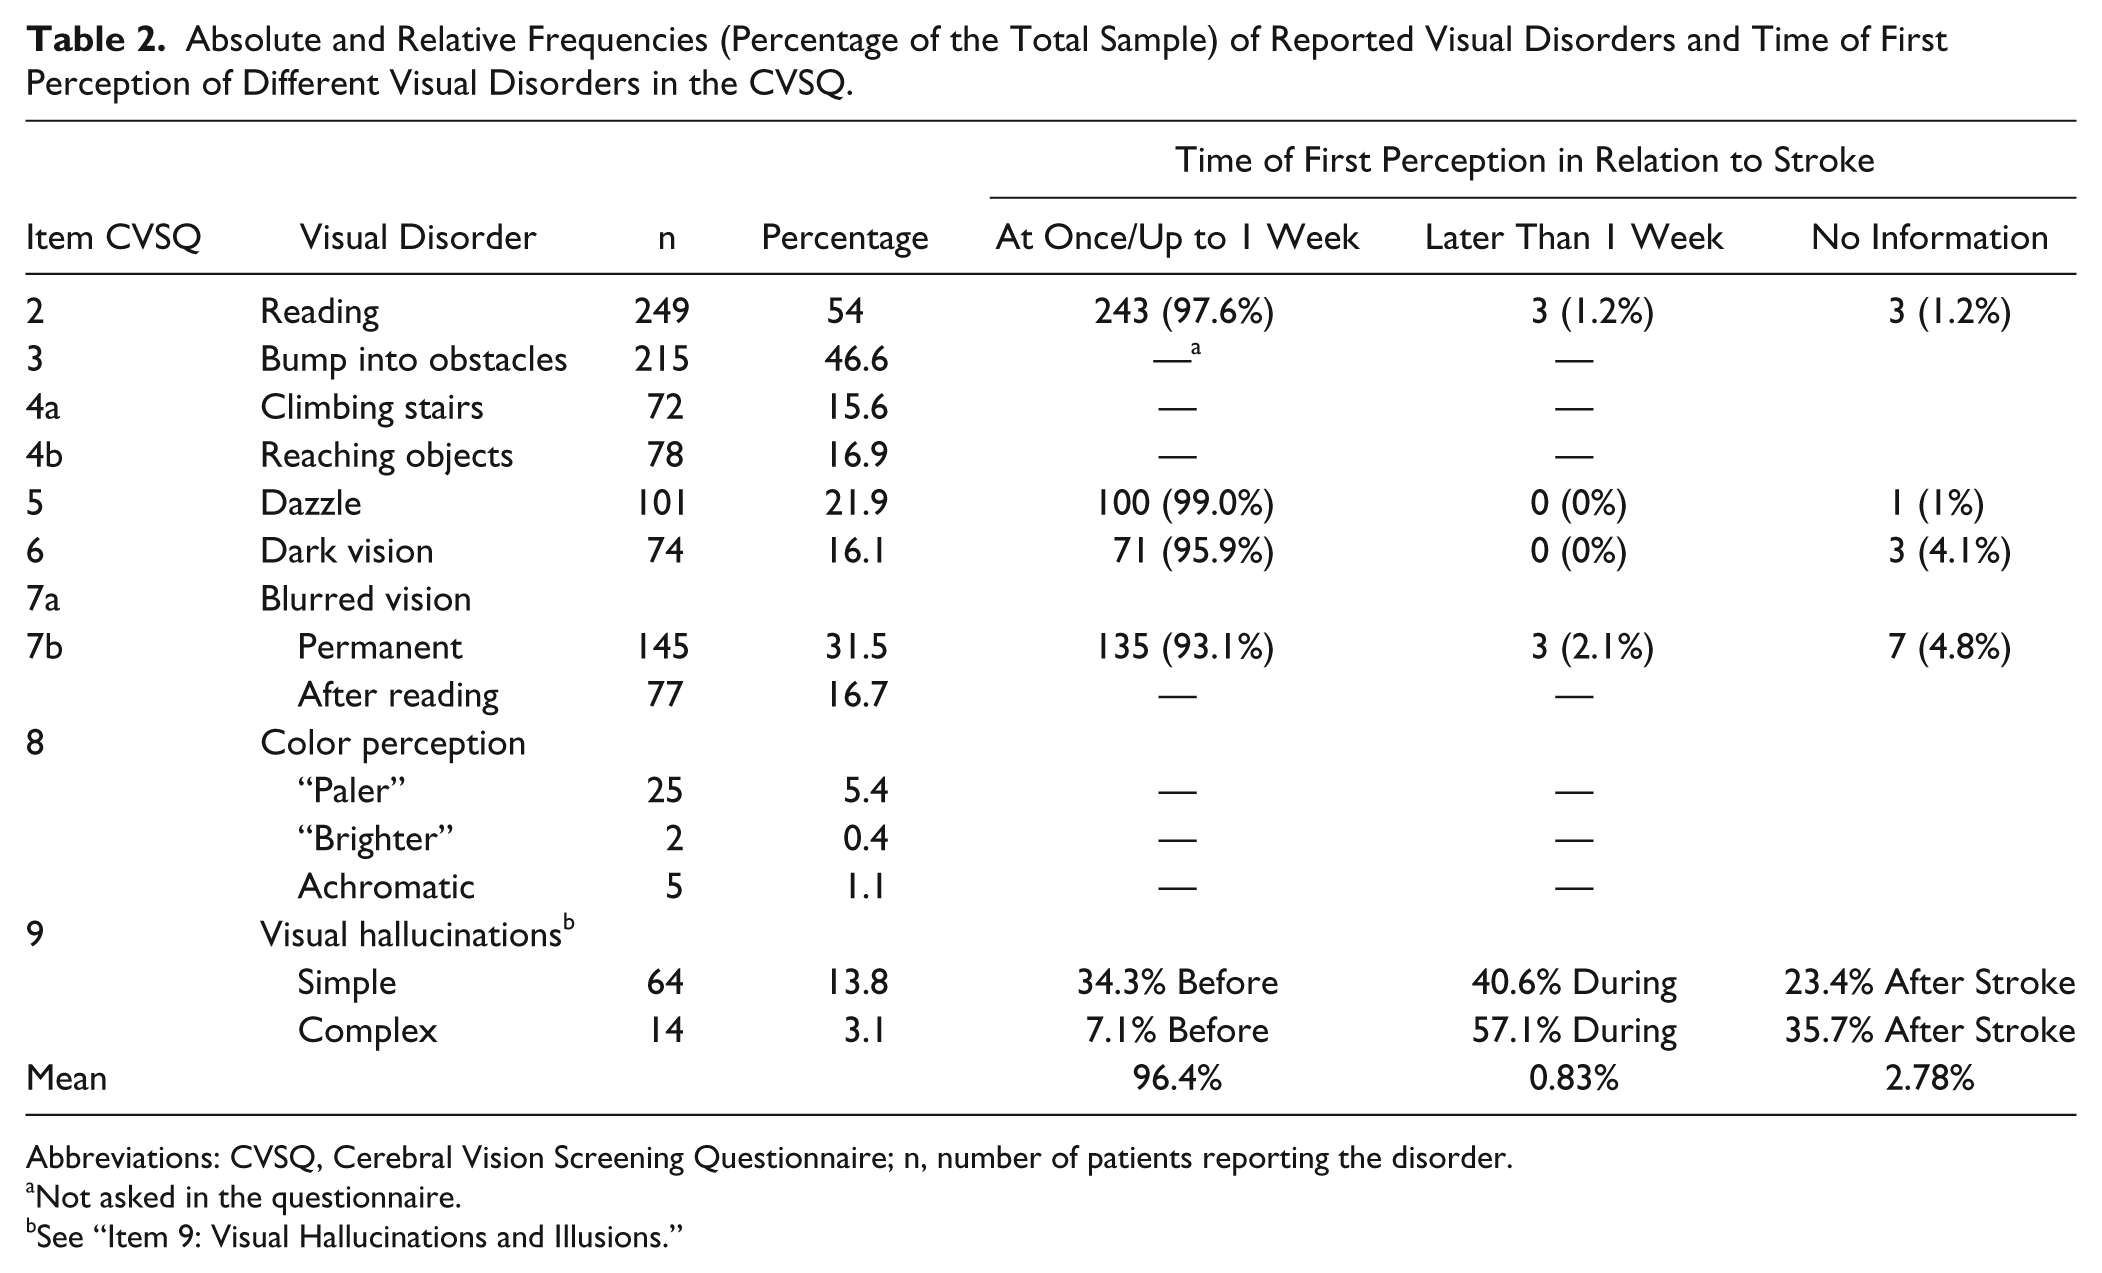
Abbreviations: CVSQ, Cerebral Vision Screening Questionnaire; n, number of patients reporting the disorder.
Not asked in the questionnaire.
See “Item 9: Visual Hallucinations and Illusions.”
Psychometric Investigations
The mean concurrent validity of the single items of the CVSQ for all patients was 0.64 for the total group and 0.66 for the reduced group. The mean interrater reliability was 0.76 (Table 3).
Concurrent Clinical Validity and Interrater Reliability of the CVSQ. a
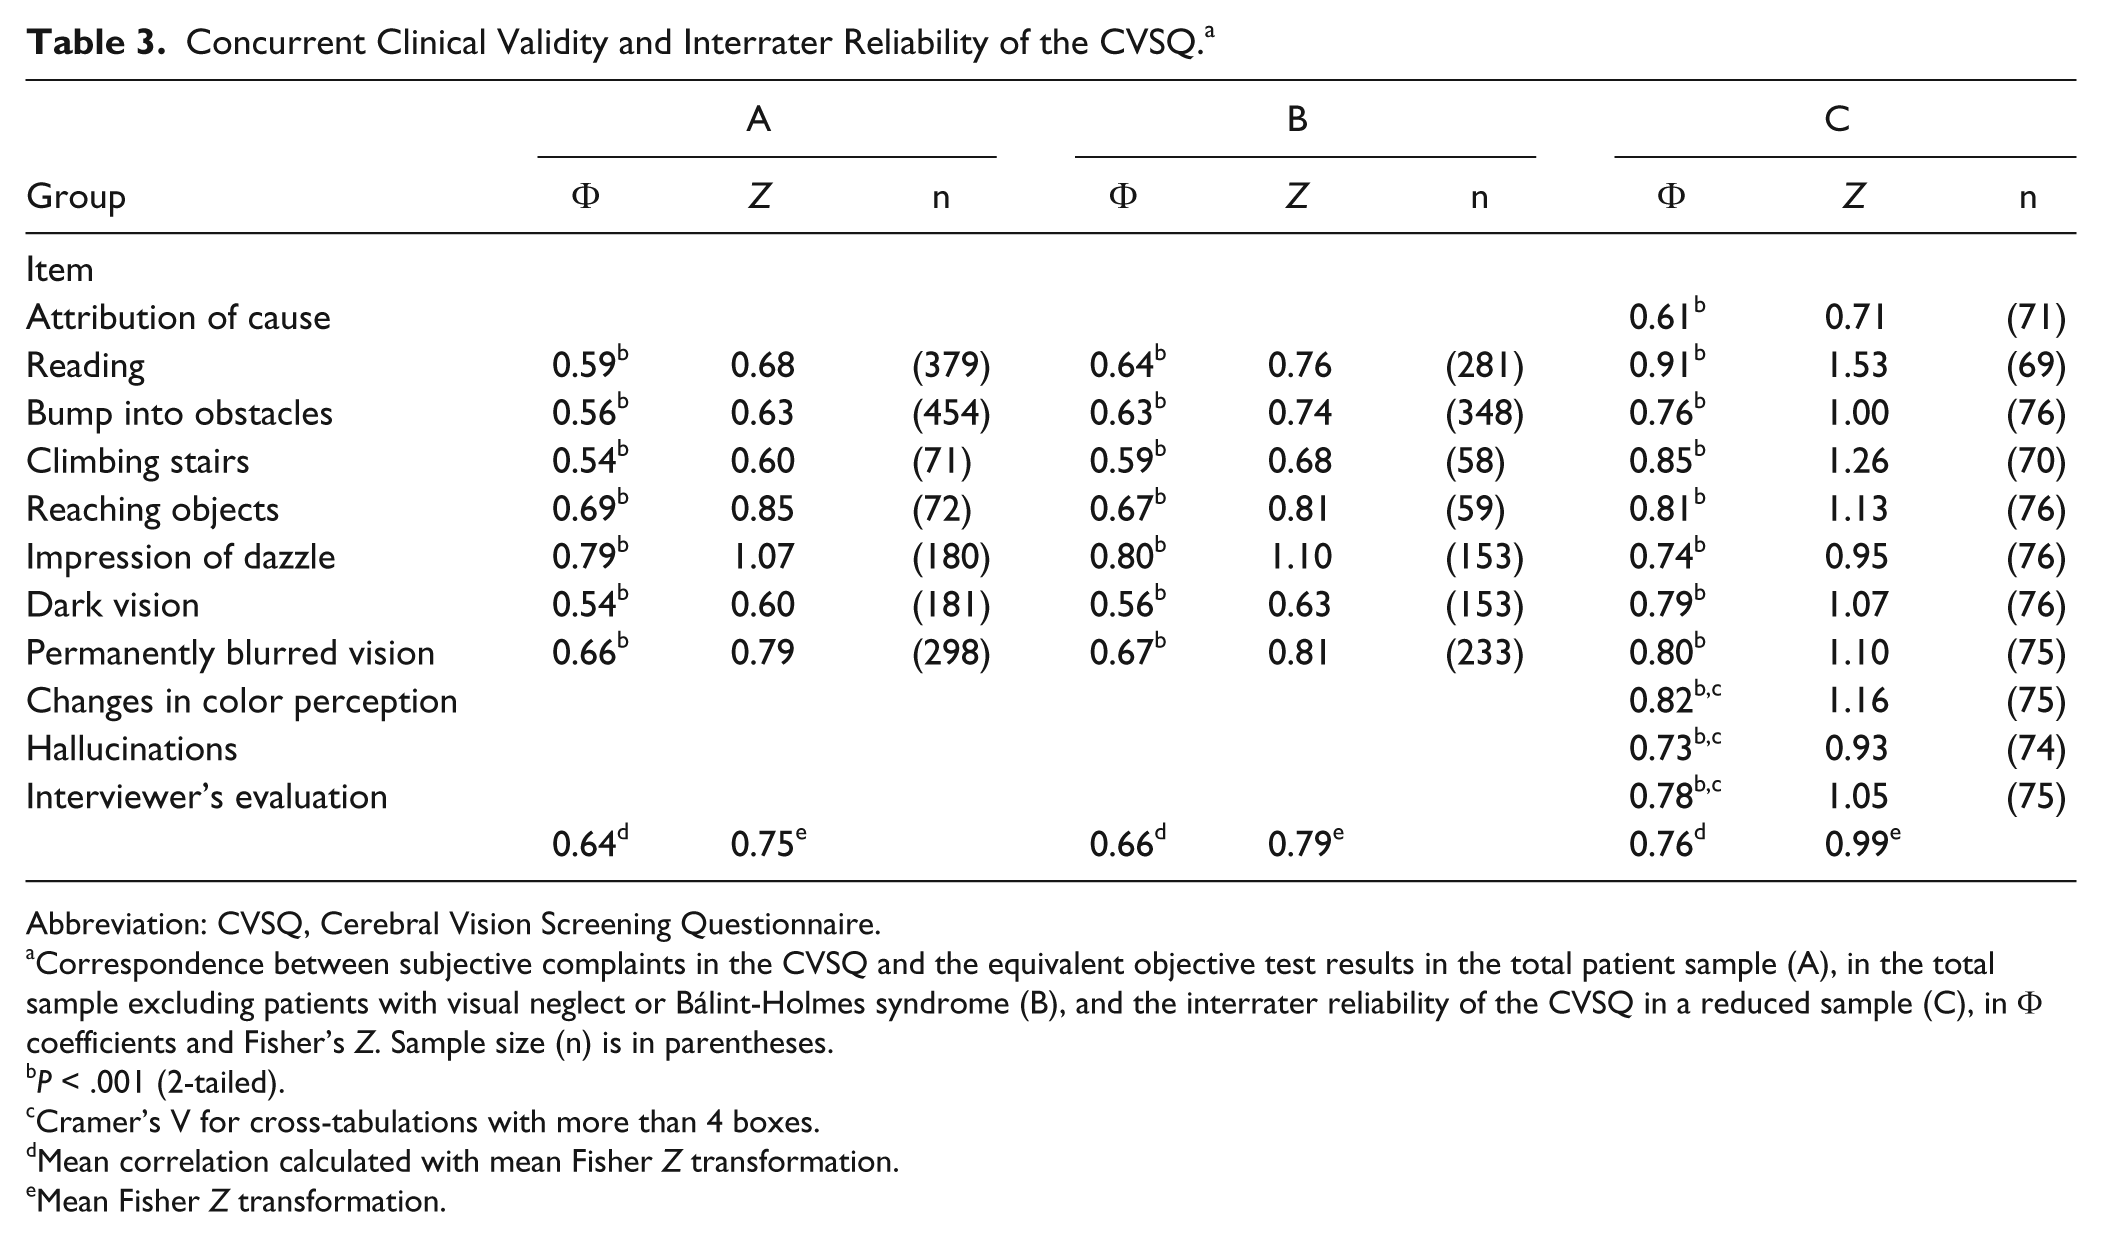
Abbreviation: CVSQ, Cerebral Vision Screening Questionnaire.
Correspondence between subjective complaints in the CVSQ and the equivalent objective test results in the total patient sample (A), in the total sample excluding patients with visual neglect or Bálint-Holmes syndrome (B), and the interrater reliability of the CVSQ in a reduced sample (C), in Φ coefficients and Fisher’s Z. Sample size (n) is in parentheses.
P < .001 (2-tailed).
Cramer’s V for cross-tabulations with more than 4 boxes.
Mean correlation calculated with mean Fisher Z transformation.
Mean Fisher Z transformation.
Clinical Findings in Relation to the CVSQ
Covariate analysis revealed that contrast sensitivity, and near and far visual acuity contributed only in 4 questions (2, 5, 7, and 8), with significant small to medium effects to the explained variance of the specific neurovisual assessment. In contrast, explained variance was medium to high for each significant CVSQ item.
Items 2 to 8
Significant differences were found for the objective tests in the groups of patients reporting versus not reporting a certain visual symptom (see Table 4). Reading problems (item 2) are related to objective disorders in text reading, bumping into obstacles (item 3) to a restricted oculomotor search capacity (visual search field) in the blind and/or neglected visual hemifield and to the size of visual field sparing, problems in depth perception (item 4a) to a high error range for far distances, reaching problems (item 4b) to deficits in depth estimation, dazzle (item 5) and dark vision (item 6) to altered illumination ratings, and blurred vision and changes in color perception (items 7b and 8) to reduced spatial contrast sensitivity. The ANCOVA showed a significant, though small, effect of reduced visual acuity on test performance only for the items reading, dazzle, blurred vision, and changes in color perception. For all other items, visual acuity did not explain differences in objective test performance in patients reporting versus not reporting a specific symptom in the CVSQ. Therefore, visual acuity is not a relevant covariate sufficiently explaining the performance differences in the objective tests.
Results of Relevant Objective Neurovisual Assessments in Individuals Reporting Versus Not Reporting a Certain Visual Symptom in Items 2 to 8 of the CVSQ (ANCOVAs). a
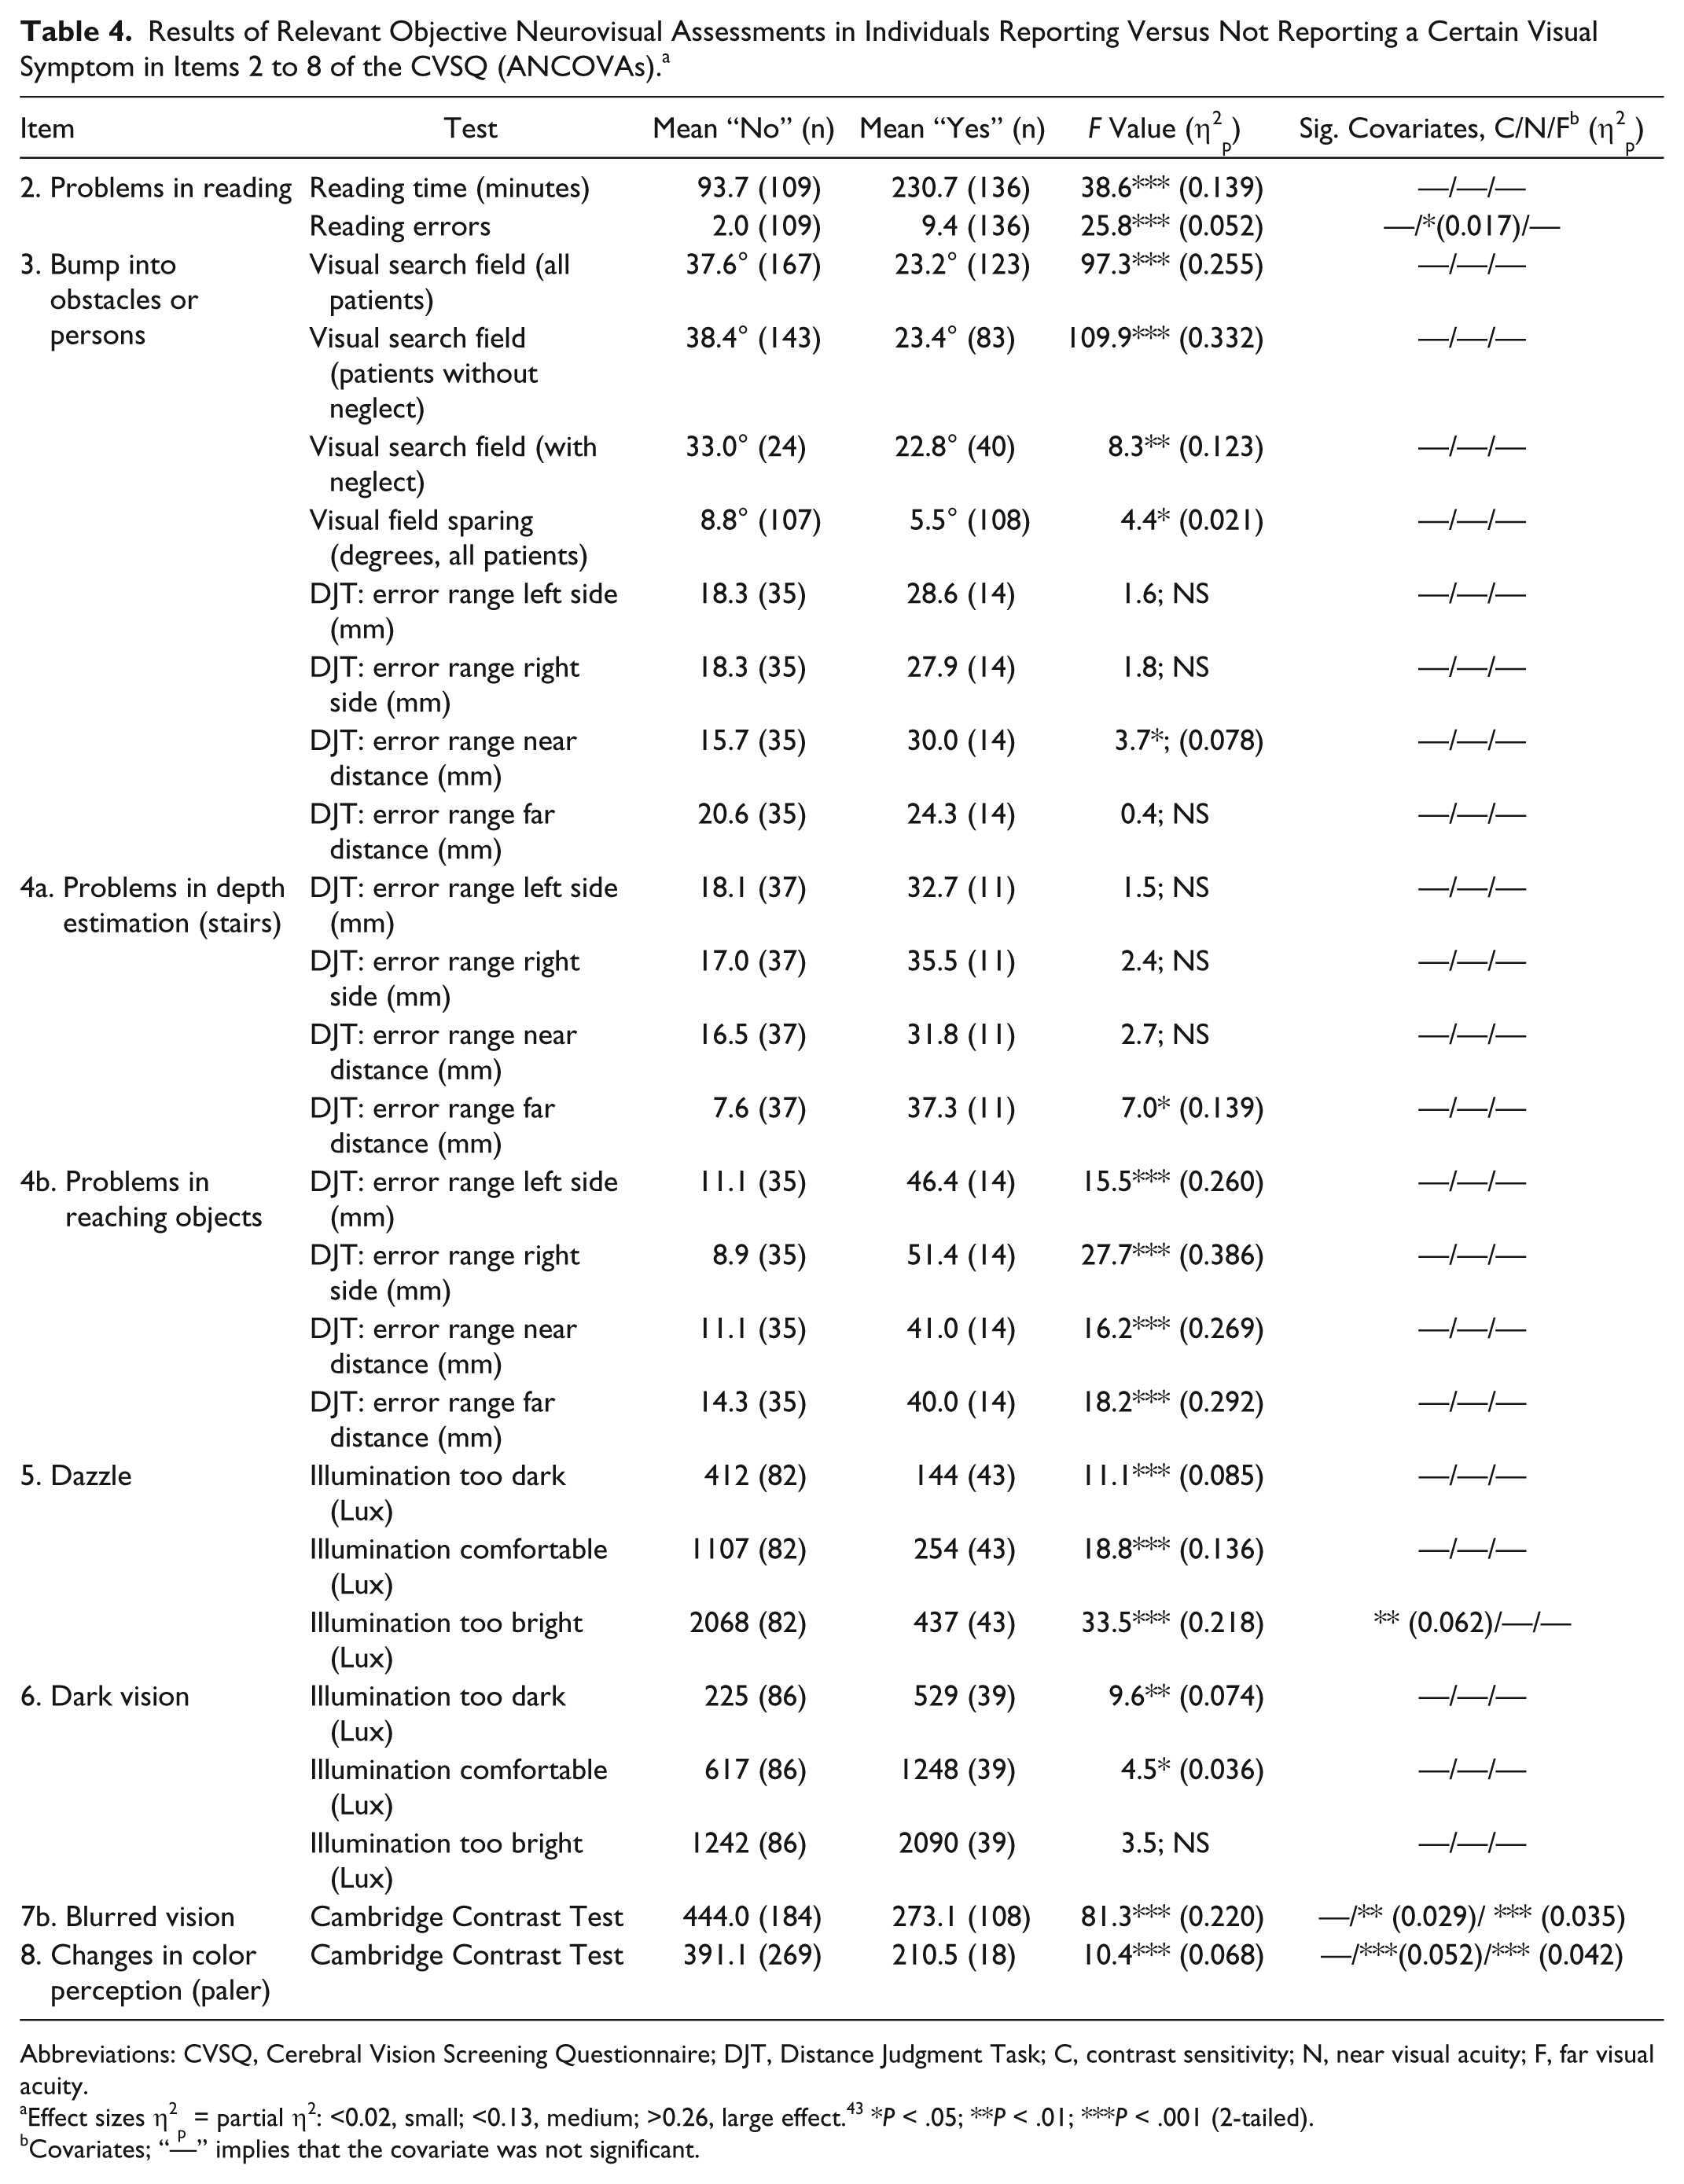
Abbreviations: CVSQ, Cerebral Vision Screening Questionnaire; DJT, Distance Judgment Task; C, contrast sensitivity; N, near visual acuity; F, far visual acuity.
Effect sizes η2p = partial η2: <0.02, small; <0.13, medium; >0.26, large effect. 43 *P < .05; **P < .01; ***P < .001 (2-tailed).
Covariates; “—” implies that the covariate was not significant.
Item 1: Attribution of the Existing Visual Disorder
Patients who gave no correct reason for their objectively determined visual disorder or who did not realize their visual disorder at all were classified as providing incorrect answers. The association between the patients’ attribution and the observation of the neuropsychologist during the investigation was highly significant (Φ = 0.610; P < .001). We found that lesion side had a significant influence on the patients’ (un)awareness. Fisher’s exact test for left- versus right-hemispheric lesion and correct versus incorrect attributions showed a highly significant influence of lesion side on the patients’ attribution of cause (P = .016, 2-tailed). Out of 48 patients with an incorrect attribution of their visual disorder, 37 had right-hemispheric (n = 31) or bilateral lesions (n = 6).
Item 9: Visual Hallucinations and Illusions
Visual hallucinations (or positive spontaneous visual phenomena) were classified as simple versus complex and colored versus noncolored according to previous studies. 17 40 . Simple visual hallucinations were reported more often than complex ones and noncolored more often than colored visual hallucinations. Moreover, simple visual hallucinations were more often perceived before or during lesion onset as compared with complex visual hallucinations, which were more often perceived during or after stroke (Table 2). Usually, the hallucinations only lasted for seconds or minutes. Only a few patients reported visual hallucinations that persisted for hours. The majority of simple visual hallucinations were reported for the contralesional visual hemifield, whereas most complex visual hallucinations were perceived in both visual hemifields.
Item 10: The Interviewer’s Evaluation of the Correctness of the Patient’s Statement
Patients giving answers that contradicted the clinical observation were classified as inaccurate. Patients who gave answers not referring to the question were classified as inexact in their answers. Also, 81.4% of the patients’ statements were classified as correct by the interviewers; 10.7% of the answers did not refer to the question, and 7.9% were incorrect. A significant correlation between lesion laterality and the correctness of the patients’ statements as judged by the examiner (accurate, inexact, and incorrect) was found (Φ = 0.21; P < .001). Patients with right-hemispheric stroke were significantly more often rated by the interviewers as giving inaccurate and incorrect answers. Binomial tests were calculated to compare the observed frequency of right-hemispheric lesions with the expected frequency according to the number of patients passing the test. With respect to the items “reading” and “bumping into obstacles and persons,” a significantly higher proportion of right-hemispheric lesioned patients was found in the subgroup of patients with incorrect statements. For the remaining items, no significant influence was found. Hence, right-hemisphere lesioned patients are more often not aware of their reading and visual scanning deficits than patients with left-hemispheric lesions. This result was also corroborated by the neglect screening: 51.4% (binomial test: P = .001; 1-tailed) of those patients were not aware of their objectively determined reading disorder, and 32.6% (binomial test: P = .094; 1-tailed) of those not reporting bumping into obstacles despite pathological scores in the visual search field showed visual neglect (20.8%, n = 96) or a Bálint-Holmes syndrome (2.2%, n = 10) in the screening tests.
Sensitivity, Specificity, and Positive and Negative Predictive Values
Table 5 shows the mean sensitivity, specificity, and positive and negative predictive values of the different CVSQ items. The mean sensitivity of the CVSQ was 79.8% (range = 59.8%-96.5%). The item “dark vision” showed the lowest sensitivity (59.8%). The mean specificity of the CVSQ was 81.7% (range = 59.3%-91.7%). The item “attribution of visual disorder” showed the lowest specificity (59.3%). The mean positive predictive value of the CVSQ was 80.1% (range = 68.2%-93.8%), and the mean negative predictive was 82.9% (range = 72.9%-93.5%). In summary, all these 4 parameters ranged around 80%.
Absolute Frequencies of Subjectively Reported Visual Complaints in the CVSQ in Relation to Objective Diagnostic Test Results, Given as Crosstabs; Diagnostic Specificity, Sensitivity, and Negative and Positive Predictive Values of the Different Items for a Given Objective Neurovisual Disorder.
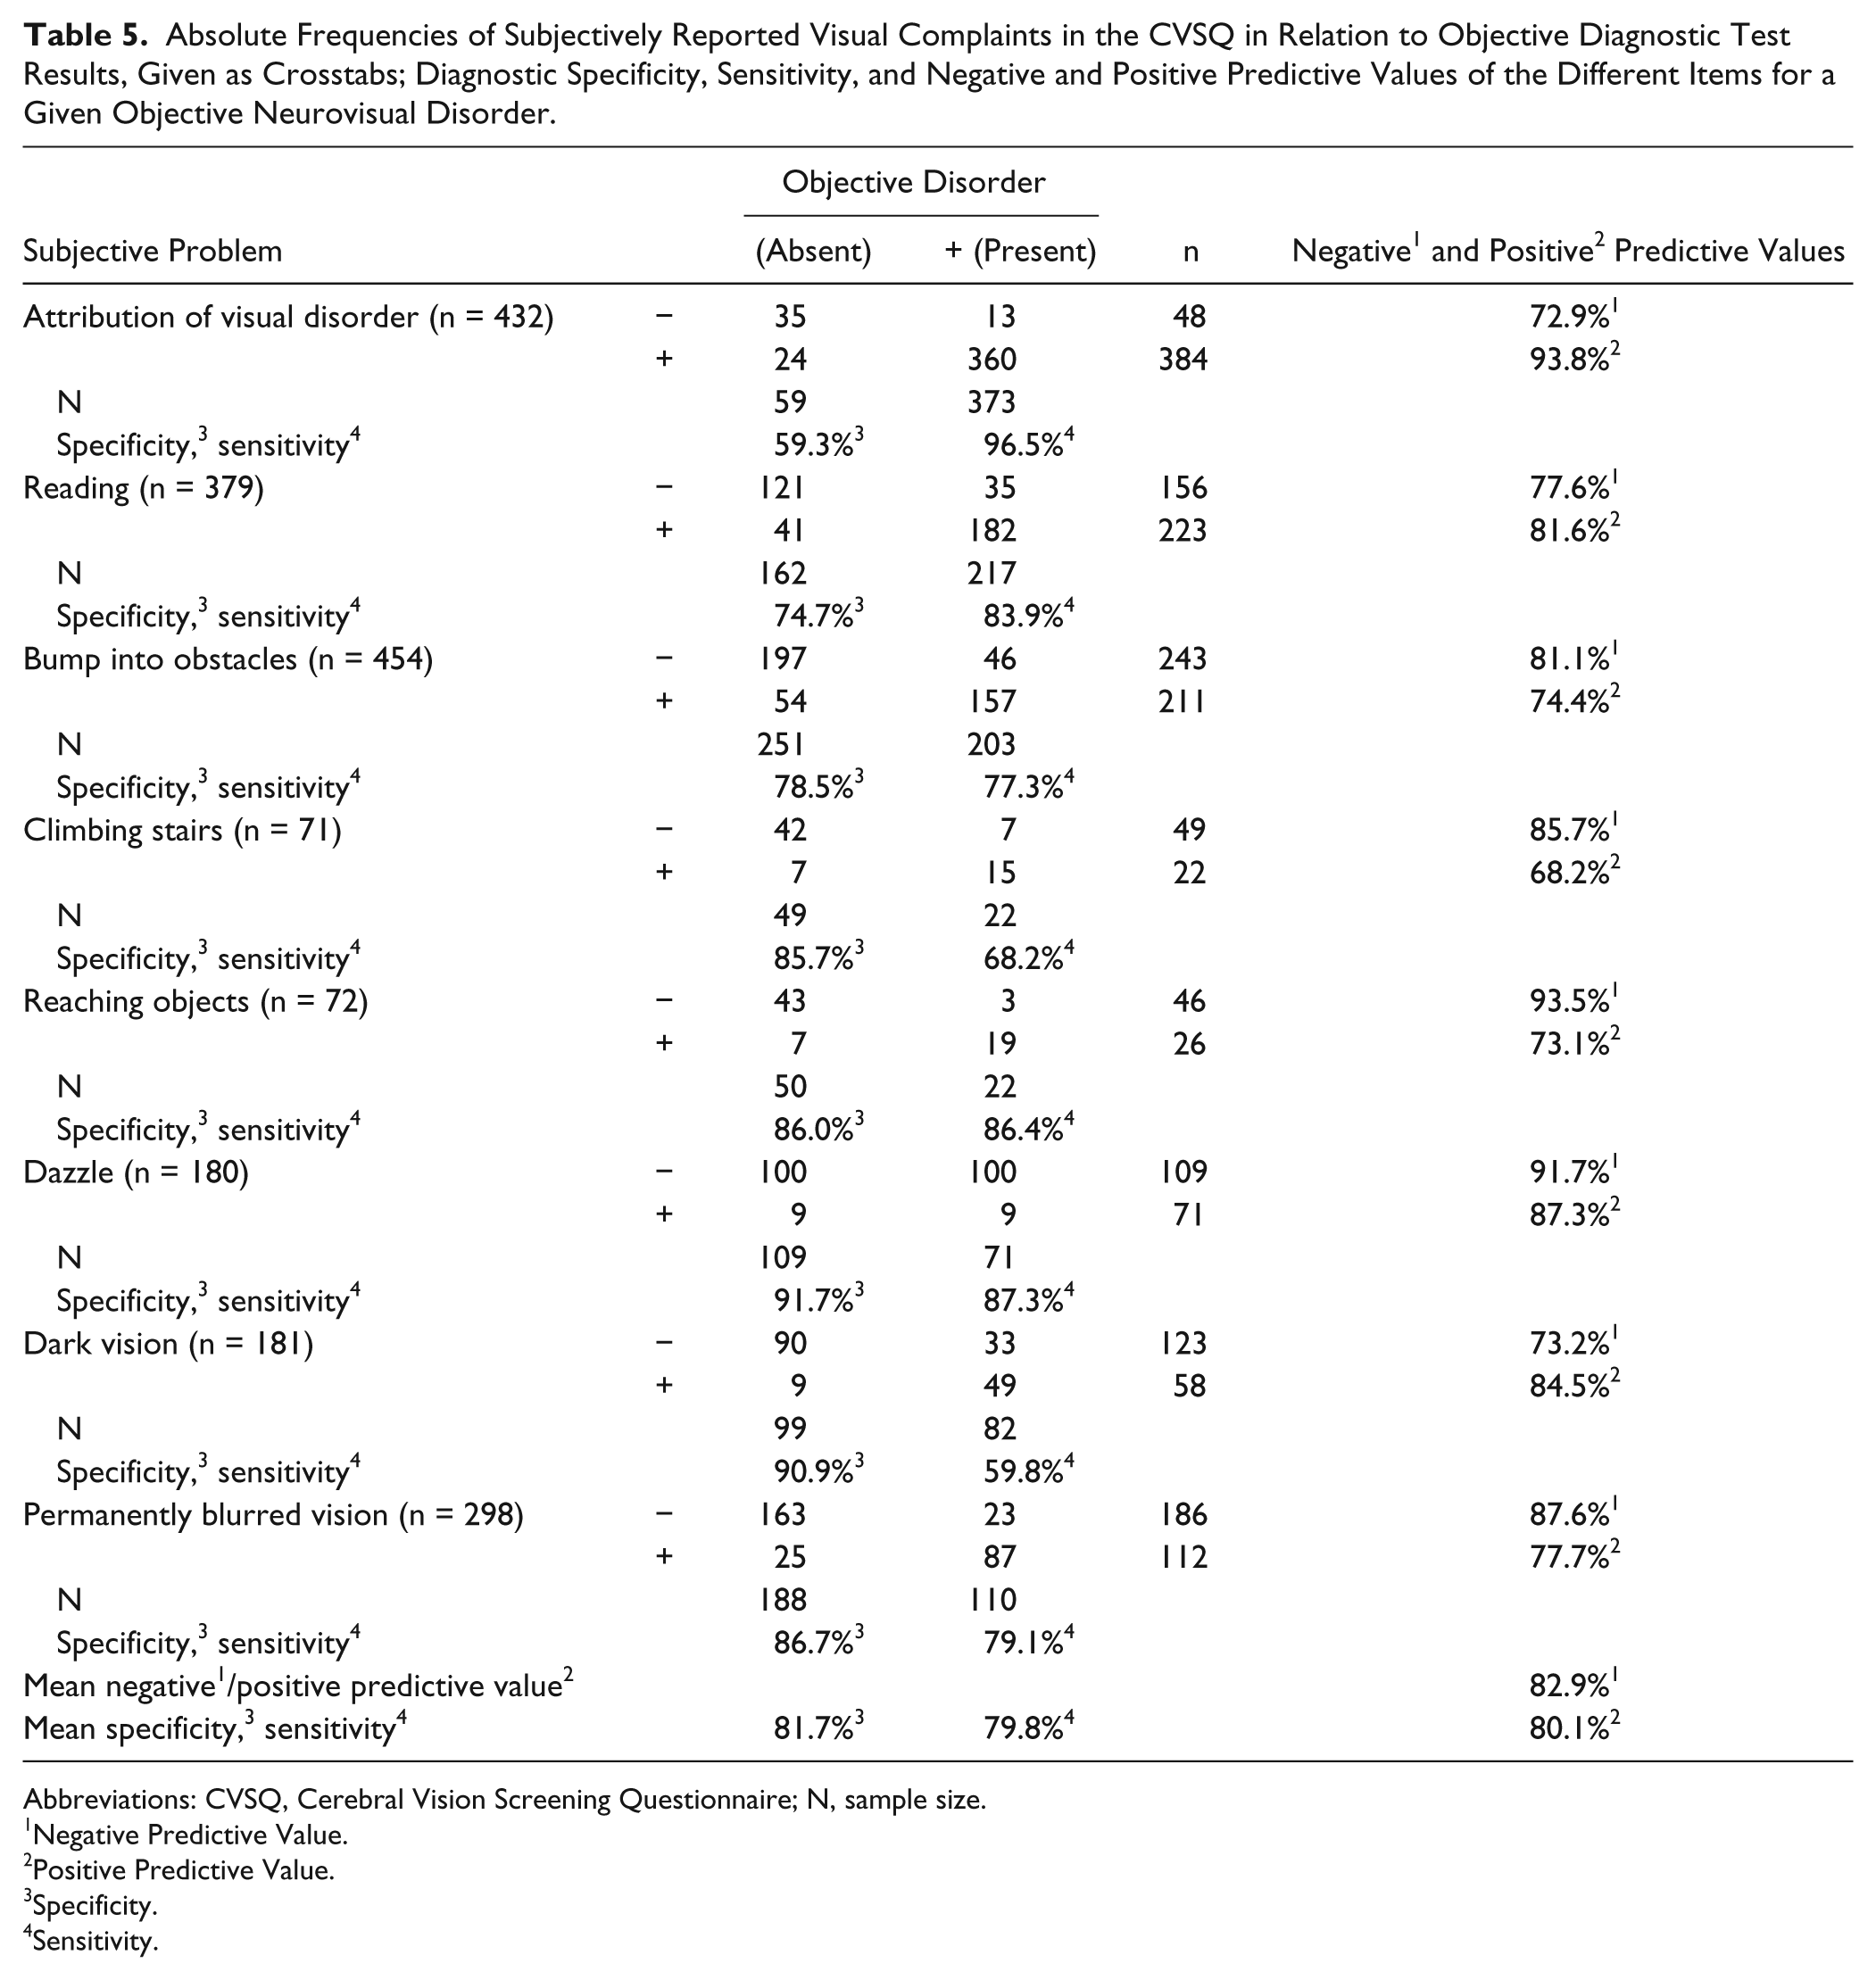
Abbreviations: CVSQ, Cerebral Vision Screening Questionnaire; N, sample size.
Negative Predictive Value.
Positive Predictive Value.
Specificity.
Sensitivity.
A logistic regression analysis was performed on the existence of VFD, with the items 2 to 9 as predictors. Using the enter method, it was found that only the items “problems in reading” (β = 2.21; P < .001) and “visual hallucinations and illusions” (β = 0.61; P = .041) were significant predictors for the existence of VFD—χ2(9) = 98.9, P < .001—classifying 83.4% of patients with and 58.7% without VFD correctly.
Discussion
Several findings are apparent from our study. (1) The items 2 to 7a of the CVSQ were significantly and highly correlated with objective diagnostic findings, thus approving its clinical validity. Moreover, the CVSQ shows a sufficiently good interrater reliability. Finally, the mean diagnostic “efficacy” of the CVSQ in terms of sensitivity/specificity was approximately 80% and ranged between 73% and 93% for the prediction of the presence/absence of a particular objective CVD. (2) Right-hemispheric or bilateral stroke and the presence of left-sided visual neglect or a Bálint-Holmes syndrome were significantly associated with an increased risk of patients reporting nonspecific or incorrect statements and, hence, having reduced awareness of their disorders. Moreover, visual neglect lowered the diagnostic sensitivity of the CVSQ only minimally. We will discuss these findings below.
Clinical and Psychometric Aspects of the CVSQ
The large majority of the assessed patients (96.4%) reported that they had noticed their neurovisual symptoms in less than 7 days after their stroke, when they were asked this in item 1 of the questionnaire. This indicates that individuals with objective CVD caused by subacute or chronic stroke demonstrate an excellent awareness of their visual impairment(s). Hence, most of them are able to provide valuable information to the clinician about their visual impairments and dysfunctions, when asked appropriately and in a structured way. The satisfying concurrent validity with objective tests underlines the fact that the information obtained from use of the CVSQ is clinically helpful. Moreover, the overall diagnostic “efficacy” of the questionnaire for neurovisual diagnosis was around 80%, which is remarkable for a quick, 10-minute anamnesis. In addition, the results of the logistic regression indicate that only 2 items of the CVSQ—that is, reading difficulties and visual hallucinations (items 2 and 9)—can already detect the presence of postchiasmatic VFD. This result is remarkable with respect to the comparable low sensitivity of confrontation visual field tests frequently used in clinical diagnostic settings. 24 Combining the CVSQ—or only the 2 items on reading problems and visual hallucinations—with the most sensitive method of confrontation field testing using colored sticks 24 might enhance the diagnostic sensitivity to detect a postchiasmatic field defect, but this needs to be clarified in future investigations. Finally, the CVSQ shows a sufficiently good interrater reliability (0.76), which implies that different clinicians yield largely the same results.
Reduced Awareness for Neurovisual Deficits
These findings hold true for individuals who did not show signs of visual neglect or Bálint-Holmes syndrome. Neglect is a frequent sequel following right-hemispheric lesions of either the middle cerebral artery 41 or a stroke of subcortical structures, such as the basal ganglia or the pulvinar of the thalamus. 42 Because neglect is often associated with unawareness of visual impairments, 23 it is not surprising that these patients in our sample reported no deficit or reported an incorrect cause other than their stroke for their visual symptoms. The same was true for patients showing signs of a Bálint-Holmes syndrome, who also gave an imprecise or incorrect reason for their visual impairments in the CVSQ. Nevertheless, it is remarkable that the inclusion of these 2 subgroups in the psychometric analyses revealed only a very modest decrease in validity for the different items (see Table 3). This is interesting because it shows that when these patients are asked specifically about certain visual impairments as a consequence of their stroke, they give astonishingly correct information that was only slightly less valid than those of patients without neglect or Bálint-Holmes syndrome. Nevertheless, the clinician using the CVSQ should be aware that especially in these 2 subgroups, the patients’ descriptions as well as their causal explanations for their visual impairments may be nonspecific or even incorrect.
Clinical Implications
The satisfying psychometric properties and high concurrent clinical validity raise the question of which diagnostic clinical implications might be prompted by the information yielded in the CVSQ. Figure 2 summarizes possible clinical “pathways” to facilitate the diagnostic process of identifying CVD based on the current findings.
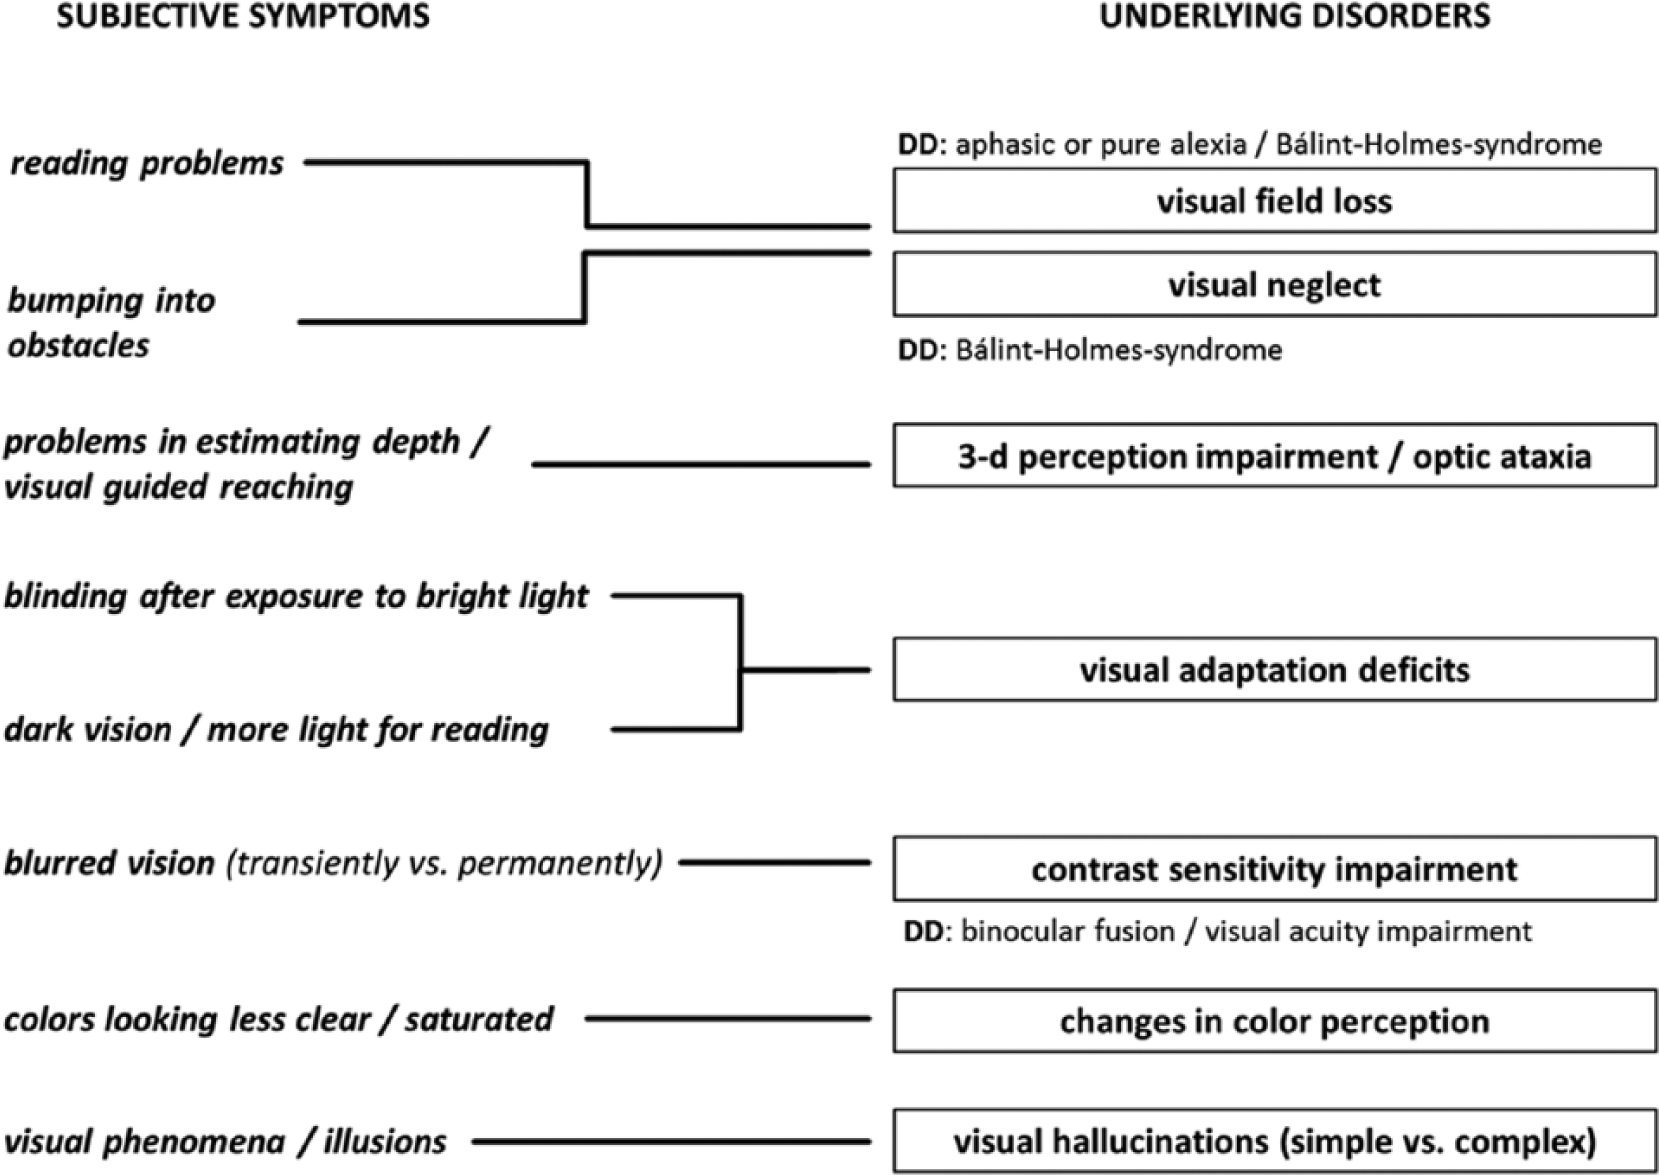
Clinical pathways illustrating the relations between the patient’s subjectively reported neurovisual symptoms and possible underlying disorders.
Conclusions
The CVSQ is suitable for the anamnesis of CVD in poststroke individuals without aphasia because of its brevity (10 minutes), clinical validity, and good psychometric qualities. It, thus, improves neurovisual diagnosis and guides the clinician in the selection of subsequent assessments and suitable neurovisual therapies for the patient.
Footnotes
Appendix
Acknowledgements
We are grateful to the whole team of the Neuropsychological Outpatient Unit at the Saarland University in Saarbruecken/Germany for their help in data collection.
Declaration of Conflicting Interests
The author(s) declared no potential conflicts of interest with respect to the research, authorship, and/or publication of this article.
Funding
The author(s) received no financial support for the research, authorship, and/or publication of this article.