
Abstract
Objective. To investigate the internal and external responsiveness and recovery profiles of the Graded Redefined Assessment of Strength, Sensibility, and Prehension (GRASSP) instrument in revealing changes in upper limb function within the first year following cervical spinal cord injury (SCI). Method. A European prospective, longitudinal, multicenter study assessing the GRASSP at 1, 3, 6, and 12 months after cervical SCI. Subtests of GRASSP were compared to the upper extremity motor (UEMS) and light touch scores (LT) according to the International Standards of Neurological Classification of Spinal Cord Injury (ISNCSCI), the Spinal Cord Independence Measure self-care subscore (SCIM-SS), as well as a clinician-rated outcome measure (CROM) of clinical relevance. Data were analyzed for GRASSP responsiveness and recovery rate over time. Results. Seventy-four participants entered the study. GRASSP subtests proved responsive (standardized response mean [SRM] ranged from 0.79 to 1.48 for strength, 0.50 to 1.03 for prehension, and 0.14 to 0.64 for sensation) between all examination time points. In comparison, UEMS and LT showed lower responsiveness (SRM UEMS ranged from 0.69 to 1.29 and SRM LT ranged from 0.30 to −0.13). All GRASSP subtests revealed significant, moderate-to-excellent correlations with UEMS, LT, and SCIM-SS at each time point, and changes in GRASSP subtests were in accordance with the CROM. GRASSP prehension and motor recovery was largest between 1 and 3 months. Conclusion. The GRASSP showed excellent responsiveness, detecting distinct changes in strength and prehension relating to the severity of cervical SCI. It detected clinically significant changes complimentary to the ISNCSCI and SCIM-SS assessments.
Keywords
Introduction
After cervical spinal cord injury (SCI), motor and sensory impairments cause limitations in upper limb function, which affect performance of activities of daily living (ADLs), independence, and, ultimately, restrict participation and quality of life. Previous studies have shown that individuals with tetraplegia consider improvements in upper limb function to be one of the most significant factors in improving quality of life.1,2 Longitudinal studies in acute SCI reveal that most recovery occurs within the first months after cervical SCI3,4 even though the degree of upper limb functional recovery is highly variable.5,6 Nevertheless, clinical recovery assumes rather complex dimensions that are not sufficiently appreciated by a single outcome measure (such as motor scores) but stem from multiple factors following acute tetraplegia. The International Classification of Functioning, Disability, and Health (ICF) 7 provides a comprehensive framework to improve the appreciation of clinical recovery.
Several upper limb outcome measures are available; however, only a few have been specifically developed for SCI8,9 and these have limited psychometric properties. 9 At present, the International Standards of Neurological Classification of Spinal Cord Injury 10 (ISNCSCI) is the current standard to assess neurological recovery, and the Spinal Cord Independence Measure 11 (SCIM) is the most widely used outcome measure to document change in ADLs in individuals with SCI. A tetraplegia-specific outcome measure, the Graded and Redefined Assessment of Strength, Sensibility, and Prehension (GRASSP) was developed 12 in an attempt to demonstrate how changes in impairment (ie, neurological deficit that falls into the ICF component “body structure and body function”) may change over time and contribute to complex upper limb tasks, which refer to the ICF component “activity and participation.” In individuals with chronic cervical SCI (ie, more than 6 months postinjury), all subtests within the GRASSP have shown high interrater and test–retest reliability (0.84-0.96 and 0.86-0.98, respectively) and favorable validity, 13 and it is highly predictive of upper limb function and self-care in acute cervical SCI. 14
Responsiveness of the GRASSP, so far not yet established, may be defined as its sensitivity in detecting changes in upper limb function over time, allowing for the evaluation of patterns of recovery in cervical SCI during rehabilitation and in the assessment of treatments for SCI. For further evaluation of the clinically relevant changes, it is important to also include the clinician’s perception of change in upper limb function and daily functioning. The latter aims to capture clinical judgments reflecting the degree of changes in the patients’ life beyond the changes as measured by a standardized clinical assessment tool. 15
This prospective study in acute cervical SCI up to 1 year postinjury thus aimed to investigate (1) the responsiveness of the GRASSP subtests, (2) the responsiveness of the GRASSP subtests compared and related to ISNCSCI and the spinal cord independence self-care subscore (SCIM-SS), (3) the clinical appreciation of changes in GRASSP and SCIM-SS by using a clinician-rated outcome measure (CROM), and (4) recovery profiles in GRASSP strength and prehension.
Methods
Study Design
The study was designed as a prospective longitudinal multicenter study.
Study Population
Participants were recruited from 5 European SCI centers specializing in the rehabilitation of individuals with SCI. Participants were recruited between January 2009 and June 2011. Inclusion criteria consisted of traumatic or nontraumatic tetraplegia, enrollment within 0 to 10 days postinjury, and assessment of the American Spinal Injury Association (ASIA) Impairment Scale (AIS grade of A, B, C, or D). 10 Individuals were included if their injury level was between C3 and T1 in the case of AIS A patients and C1 to T1 in those with incomplete injuries. Excluded were those individuals with any accompanying severe neurological (eg, traumatic brain injury) or medical disorders or those aged less than 16 years. Participants were recruited after providing written informed consent. The study was approved by the relevant local ethics committees.
Procedures
Assessors who had at least 1 year experience in working with individuals with SCI were trained to ensure high-quality examinations and to reduce interobserver variability. Occupational therapists performed the GRASSP and rated the questionnaires. For organizational reasons, it was unavoidable that, in some cases, the 2 assessments were performed by the same therapist. Physicians performed the ASIA testing and the SCIM III was completed by physical therapists, nurses, and occupational therapists. The GRASSP takes between 30 and 45 minutes to complete.
The assessments and clinical examination were performed during inpatient rehabilitation between 0 and 10 days, at 1 month (range 16-40 days), 3 months (range 70-98 days), 6 months (range 150-186 days) after cervical SCI and in outpatient clinics at 12 months (range 300-400 days) after cervical SCI. The clinician-reported outcome measure (CROM) was performed at 3, 6, and 12 months postinjury. The AIS classifications were calculated by a computer algorithm, 16 according to the definitions in the International Standards. 10
Outcome Measures
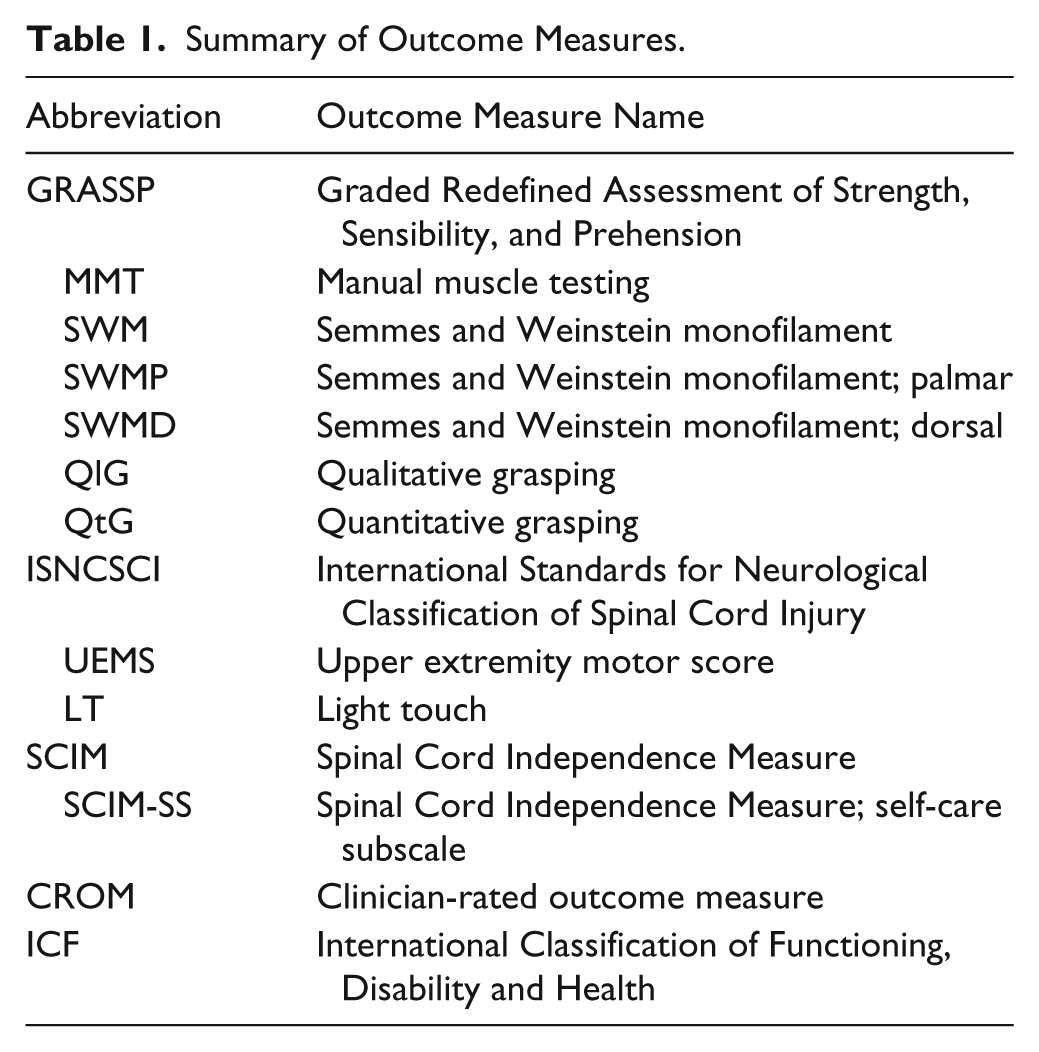
Table 1 explains the acronyms of outcome measures used in this study.
Summary of Outcome Measures.
The GRASSP is a 3-domain, upper limb clinical outcome measure for individuals with tetraplegia, contains 5 subtests and measures each upper limb separately. The subtests within GRASSP are the following:
Manual Muscle Testing 17 (MMT)
Ten muscles in the arm and hand were assessed on both sides. Each item (muscle) was scored between 0 and 5, whereby score 5 represented normal strength and score 0 total paralysis. The total score for both sides is the sum of all item scores with a maximum of 100.
Semmes and Weinstein Monofilament (SWM)
The touch threshold was assessed using the pocket version of SWM. 18 (North Coast Medical, Inc, Campbell, CA), with 4 probes (monofilaments) across 3 dorsal and 3 palmar locations for each hand as described in the instructions of the SWM mini-kit 18 and the GRASSP manual. The pressure applied and sensation elicited was represented by numeric values ranging from 0 (no response) to 4 (normal sensation). Three locations for the dorsal (SWMD) or palmar (SWMP) side are summed as subtest total score for both sides, ranging from 0 to 24 points.
Qualitative Grasping (QlG)
Three grasps were assessed according to the grasp acquisition outlined in the GRASSP manual and developed by the GRASSP International Research and Design Team. The grasps were scored between 0 (no voluntary control of wrist and digits when grasping) and 4 (normal voluntary control of wrist and digits when generating the grasp). The sum of the grasping quality subtest scores for both upper limbs ranges from 0 to 24 points.
Quantitative Grasping (QtG)
In a strictly standardized way, 6 prehension tasks, such as picking up a key from a table, were performed for each arm separately, as adapted from the Sollerman Hand Function Test. 19 Each task was scored on a 0 to 5 scale according to the grasp used. Details of scoring are available in the GRASSP manual. The total score was the sum of all task scores with a range of 0 to 60 for both sides.
The SCIM is a global measure of fundamental daily activities specific to individuals with SCI and focuses on gained independence. 11 The SCIM III has well-validated psychometric properties,20-22 and the SCIM-SS reflects upper limb performance. 23 In our study, the SCIM III-SS was therefore selected. The sum of the SCIM III-SS ranges between 0 and 20.
The CROM was developed by the GRASSP International Research and Design Team and consists of 4 questions regarding perceived physical change over time. The questions of the CROM were rated by occupational therapists, based on their perceived impressions of the change in performance of patients’ (1) strength, (2) sensation, (3) fine motor tasks (ability to perform tasks such as screwing the cap from a toothpaste tube), and (4) functional tasks (ability to perform tasks such as eating independently, holding a cup, and brushing one’s teeth) between 1 and 3 months, between 3 and 6 months, and between 6 and 12 months post–cervical SCI. The scale of the CROM has 7 categories ranging from 1 (much worse) to 7 (much better).
The neurological assessment was performed according to the ISNCSCI protocol. 10 The ISNCSCI was selected to classify the neurological level of injury (NLI) and the overall AIS grade. The ISNCSCI UEMS and the ISNCSCI LT (C6-C8) were used in this study. Five key muscle groups of the upper limb in both arms were assessed and scored between 0 (total paralysis) and 5 (normal strength). The sum value of this score ranges from 0 and 50 for both sides. Sensation (LT) in 3 dermatomes (C6-C8) were scored as follows: 0 (absent sensation), 1 (impaired sensation), and 2 (normal sensation). The sum value of this score ranges from 0 to 12 points for both sides.
Data Analyses
Descriptive statistics were used to determine the frequency, mean, standard deviation, and range of the study participants’ characteristics including AIS grade, lesion level, sex, and age. Parameters were visually checked for normal distribution by a QQ plot.
There are many approaches for assessing responsiveness but no general consensus has yet been reached on the best method to use.24,25 Internal responsiveness is defined as the ability of a measure to change over a particular, specified time period. 25 External responsiveness reflects the extent to which changes in a measure over a specified time relate to corresponding changes in referential measurement of health status. 25 Both internal and external responsiveness have been used in our comparisons.
Because differences in recovery and responsiveness depending on completeness of the lesion can be expected, we performed additional subgroup analyses (motor complete AIS: A-B; and motor incomplete AIS: C-D).
Internal Responsiveness
For internal responsiveness, a linear mixed model was used to assess change of the measure controlling for time. The level of significance was set at α < .05.
Paired t tests (Bonferroni adjusted) based on the linear mixed model were performed to localize significant differences between time intervals. The following time intervals were selected: 3, 6, and 12 months to 1 month; 6 and 12 to 3 months; and lastly 12 months to 6 months. 95% confidence intervals (CIs) of changes between time intervals were calculated.
The standardized response mean (SRM) is now widely used 26 to express effect size and was calculated for the 6 intervals mentioned above. SRM is the mean delta score between the aforementioned intervals divided by the standard deviation (SD) of the delta score.26-28 Values of 0.20 indicate low responsiveness, 0.50 medium responsiveness, and above 0.80 high responsiveness. 29
External Responsiveness
The external responsiveness of the GRASSP was quantified using correlation analysis and receiver operating characteristics (ROC) analysis. The level of significance was set at α < .05. UEMS, LT (C6-C8), and SCIM III-SS were used as reference measures of GRASSP, and CROM was used as an external standard for GRASSP.
Correlation analysis was performed between subtests of GRASSP and the reference measures using Spearman’s ρ correlation coefficient to determine the relationship between them. Correlations in the range of 0 to .25 were interpreted as none to poor, .26 to .50 as fair, .51 to .75 as moderate to good, and .76 to 1.0 as very good to excellent. 29 With respect to Aim 3, ROC analysis was performed to analyze the area under the curve (AUC) of MMT, SWM, QtG, and SCIM III-SS delta values, in order to discriminate between patients with and without improvement as rated by clinicians (CROM). Values of the AUC between 0.7 and 1.00 indicate acceptable to excellent discrimination. 30 For ROC analysis, we dichotomized the 4 CROM questions strength, sensation, fine motor tasks, and functional tasks to assign individuals into an improved or nonimproved group. Individuals were allocated to the improved group if the reported outcomes were “somewhat better,” “better,” or “much better.” All participants with the “same,” “somewhat worse,” “worse,” or “much worse” reported outcomes were allocated to the nonimproved group. Furthermore, we calculated mean delta scores for MMT, SWM, QtG, and SCIM III-SS between the assessment stages (1-3 months, 3-6 months, and 6-12 months).
Recovery Profile
The annualized rate of recovery was calculated by dividing the amount of recovery between 2 assessments by the time interval between the 2 assessments. This value was then multiplied by 365 to express the rate of recovery during a particular interval that would have been expected if it were to have continued over 1 year, as used by Waters et al.3,4
All data were analyzed using SPSS version 18.0 for Windows.
Results
Of the total 74 participants included, 69 had a traumatic SCI and 5 a nontraumatic SCI (2 ischemic in origin and 3 cases of spinal canal stenosis). Some GRASSP data were missing for 14 participants at the 6-month assessment and for 15 participants at the 12-month assessment (due to medical [n = 2] and logistical reasons [eg, discharge, n = 12]). Because of the lower number of participants between 0 and 10 days postinjury (n = 40), we excluded this baseline time point from our analyses. Data of all parameters were approximately normally distributed. There was no statistically significant difference between the sum scores of the right and left sides, and therefore, all analyses were made for the sum score of the right and left sides combined. Detailed cohort characteristics are presented in Table 2.
Demographic and Clinical Characteristics of Participants (N = 74).
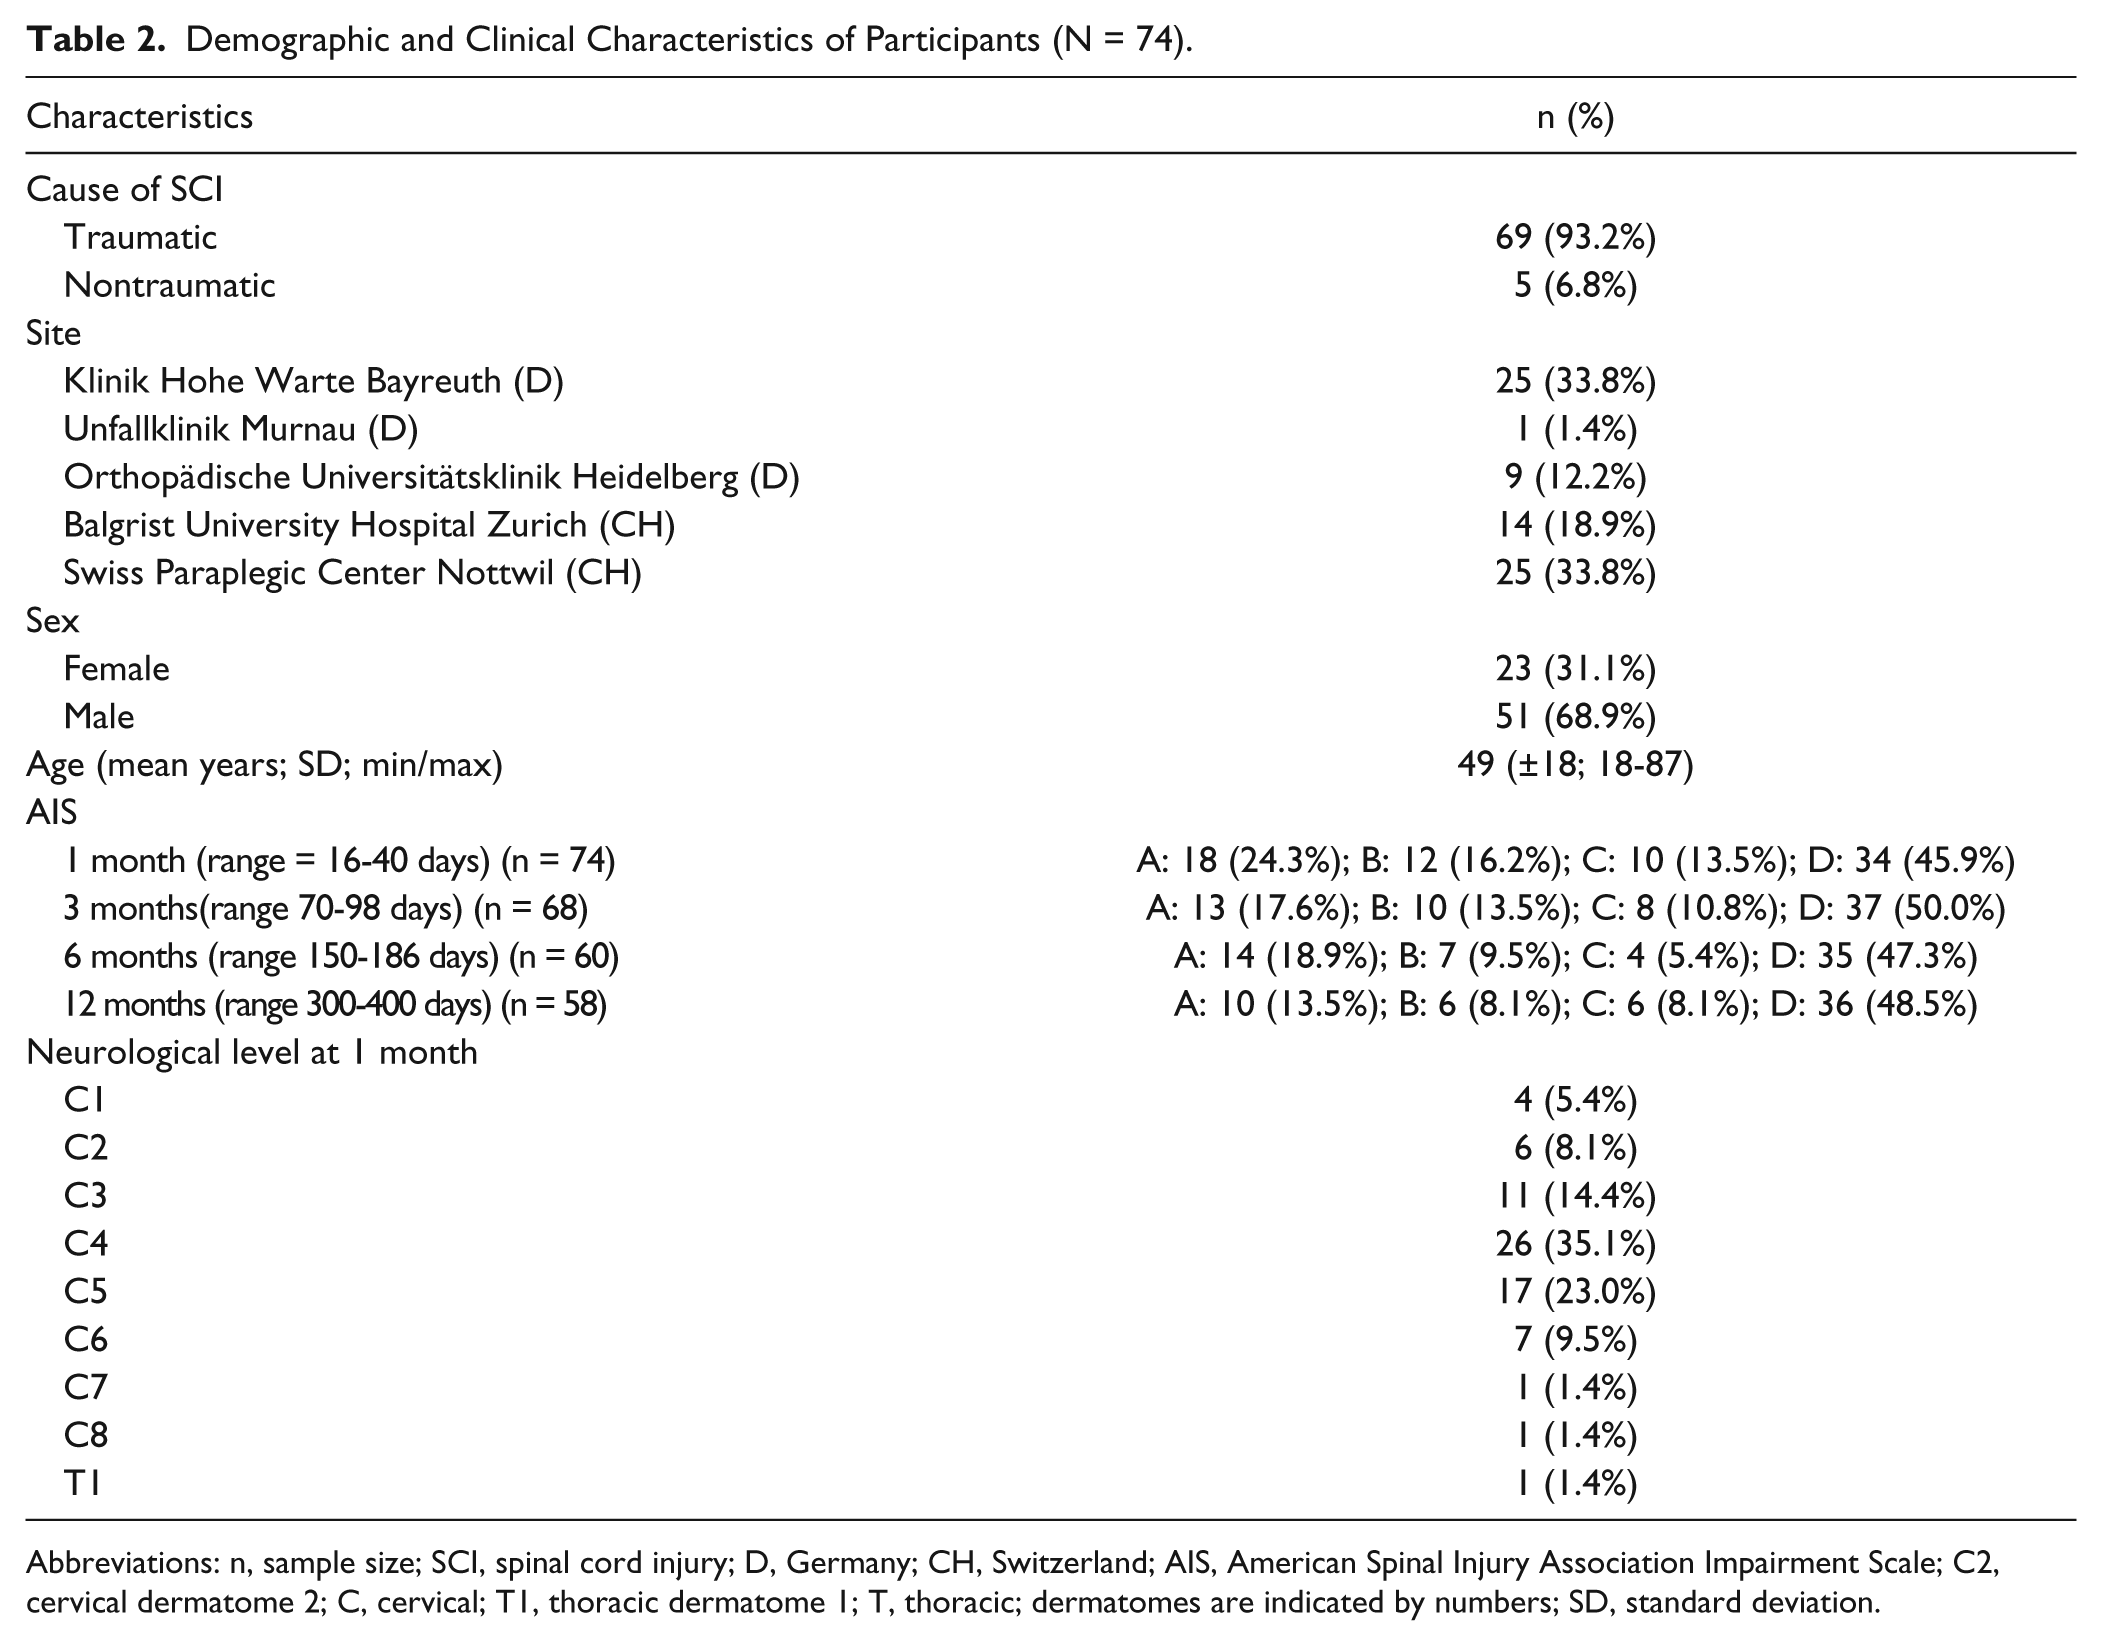
Abbreviations: n, sample size; SCI, spinal cord injury; D, Germany; CH, Switzerland; AIS, American Spinal Injury Association Impairment Scale; C2, cervical dermatome 2; C, cervical; T1, thoracic dermatome 1; T, thoracic; dermatomes are indicated by numbers; SD, standard deviation.
Internal Responsiveness GRASSP
Linear mixed model analysis showed that overall and in both subgroups, the GRASSP subtest mean scores MMT, SMW, SWMP, SWMD, QlG, and QtG differed significantly over time (P < .0001).
Pairwise comparison showed that MMT mean score significantly improved over all time intervals, both overall and for both subgroups with the exception of the AIS C-D group, in which no significant change between 6 and 12 months was seen. Overall and in both subgroups, SWM, SWMP, SWMD, QlG, and QtG mean scores significantly improved from 1 month to 12 months, but no significant difference was found between 3 and 6 months and between 6 and 12 months.
Overall and in both subgroups, the SRM for MMT was large between all intervals except for the entire group and AIS C-D group, where a moderate SRM between 6 and 12 months was found. For QlG, moderate-to-large responsiveness was found from 1 month to 12 months and between 3 and 6 months in the group as a whole and in the AIS C-D subgroup. A moderate-to-large responsiveness was observed for QtG overall and in both subgroups over all time intervals except for the AIS A-B group between 3 and 6 months. The SWM tests showed poorer internal responsiveness compared to the other GRASSP subtests results. Detailed results of the pairwise comparison and the SRM of all time intervals for GRASSP subtests and the different groups are presented in Table 3 (and supplementary material; Table 7).
Internal Responsiveness GRASSP Subtests. a
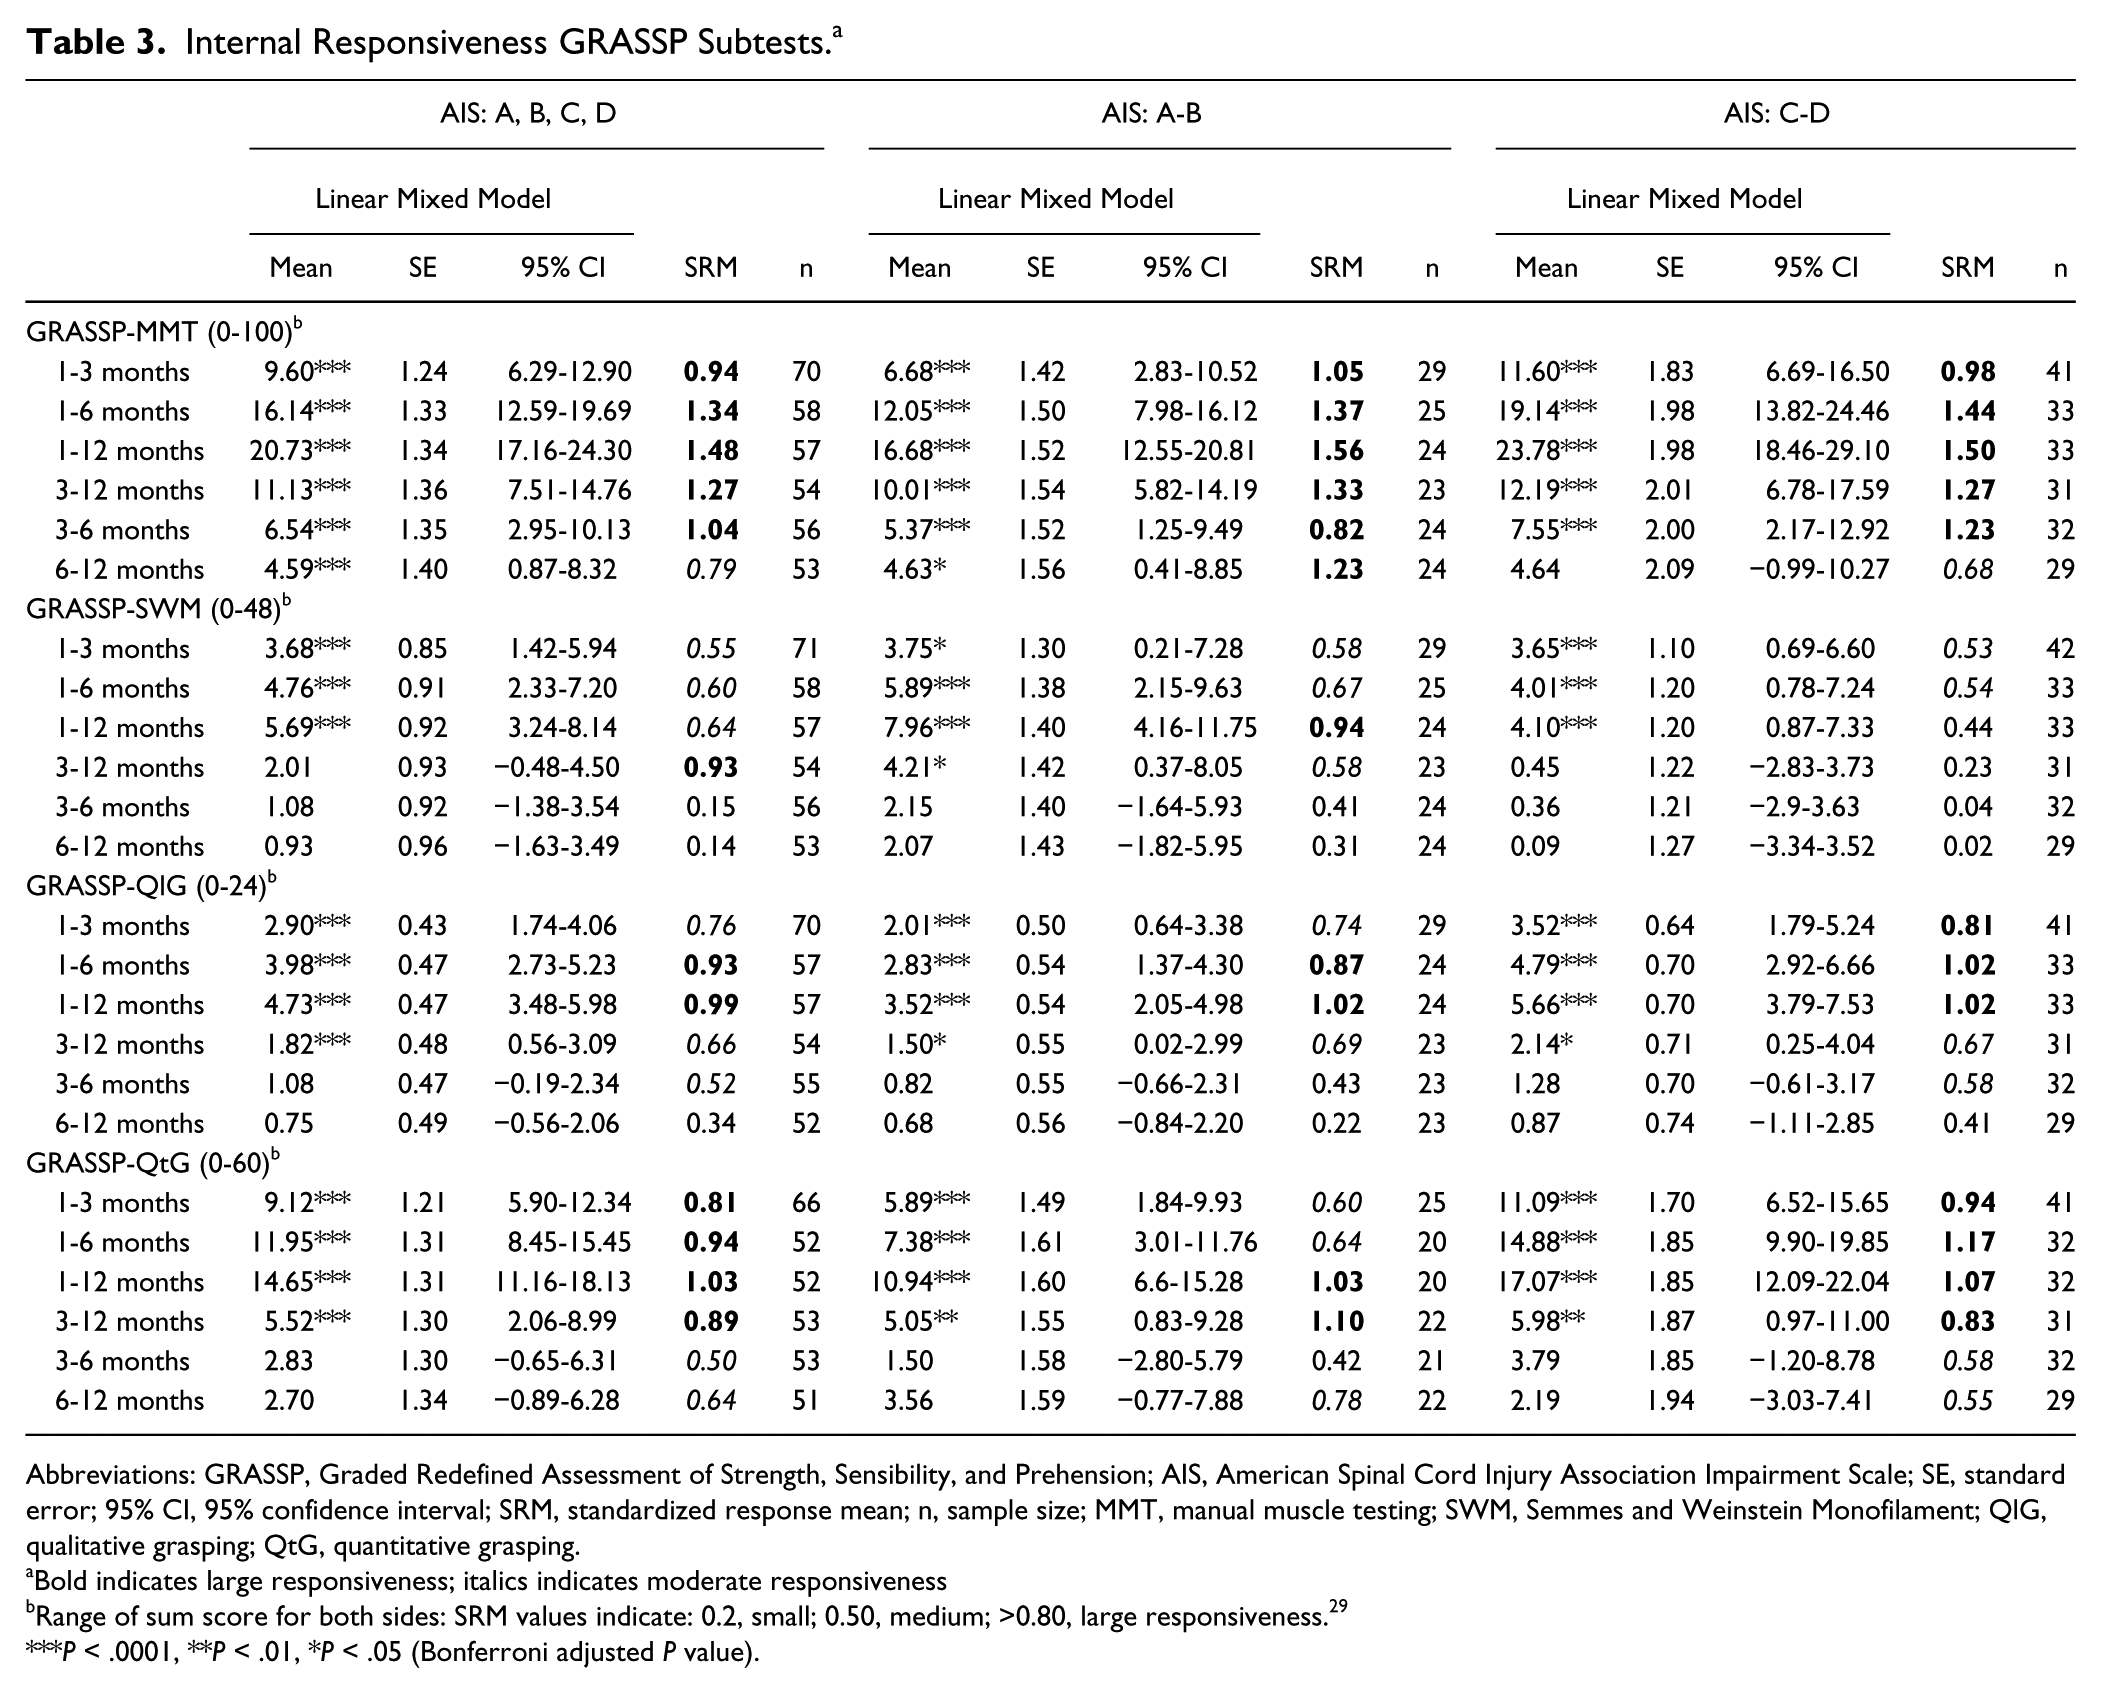
Abbreviations: GRASSP, Graded Redefined Assessment of Strength, Sensibility, and Prehension; AIS, American Spinal Cord Injury Association Impairment Scale; SE, standard error; 95% CI, 95% confidence interval; SRM, standardized response mean; n, sample size; MMT, manual muscle testing; SWM, Semmes and Weinstein Monofilament; QlG, qualitative grasping; QtG, quantitative grasping.
Bold indicates large responsiveness; italics indicates moderate responsiveness
Range of sum score for both sides: SRM values indicate: 0.2, small; 0.50, medium; >0.80, large responsiveness. 29
P < .0001, **P < .01, *P < .05 (Bonferroni adjusted P value).
Internal Responsiveness of GRASSP Compared to Internal Responsiveness of the Reference Measures
The results of the linear mixed model showed that the UEMS, LT (C6-C8), and SCIM-SS mean scores differed significantly over time (P < .0001).
As shown in Table 3 (and supplementary material; Table 7), the GRASSP subtests showed similar, significant differences over the same time intervals as the scores of the UEMS and SCIM-SS (Table 4) with the exception of LT (C6-C8), where no significant differences between time intervals was found, and UEMS, in which no significant difference between 6 and 12 months was observed.
Internal Responsiveness Reference Measures. a
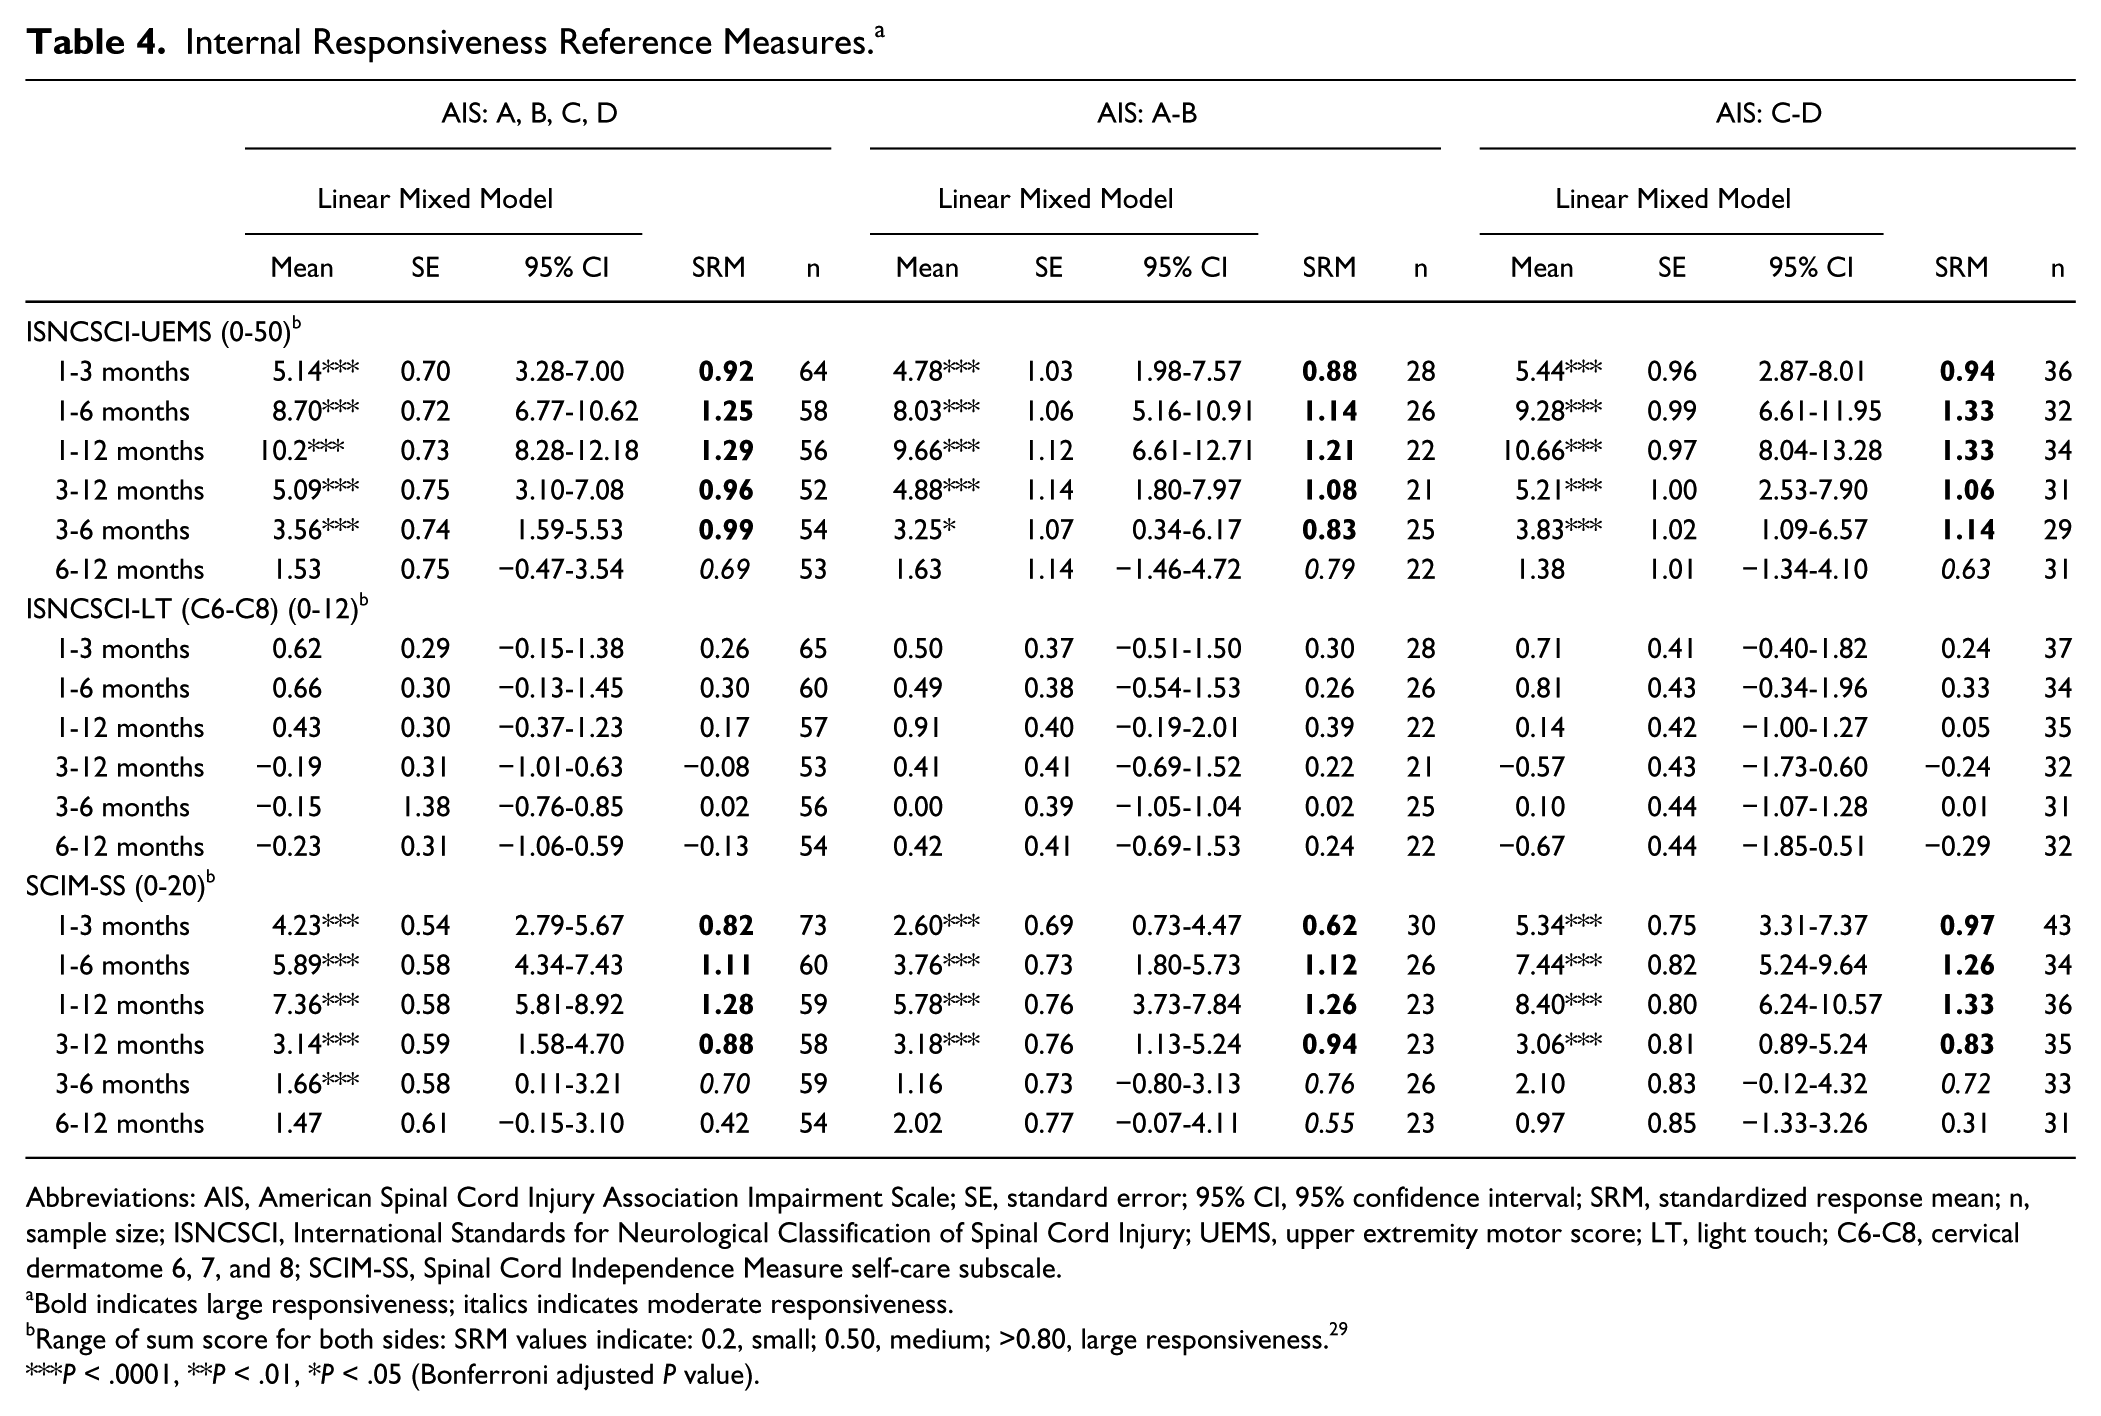
Abbreviations: AIS, American Spinal Cord Injury Association Impairment Scale; SE, standard error; 95% CI, 95% confidence interval; SRM, standardized response mean; n, sample size; ISNCSCI, International Standards for Neurological Classification of Spinal Cord Injury; UEMS, upper extremity motor score; LT, light touch; C6-C8, cervical dermatome 6, 7, and 8; SCIM-SS, Spinal Cord Independence Measure self-care subscale.
Bold indicates large responsiveness; italics indicates moderate responsiveness.
Range of sum score for both sides: SRM values indicate: 0.2, small; 0.50, medium; >0.80, large responsiveness. 29
P < .0001, **P < .01, *P < .05 (Bonferroni adjusted P value).
Both overall and for both subgroups, the SRM values of the GRASSP subtests (Table 3 and supplementary material; Table 7) were higher compared to the reference measures (Table 4 and Figure 1) with the exception of SCIM-SS. Detailed results of the pairwise comparison and the SRM of all time intervals for the reference measures and the different groups are available in Table 4.
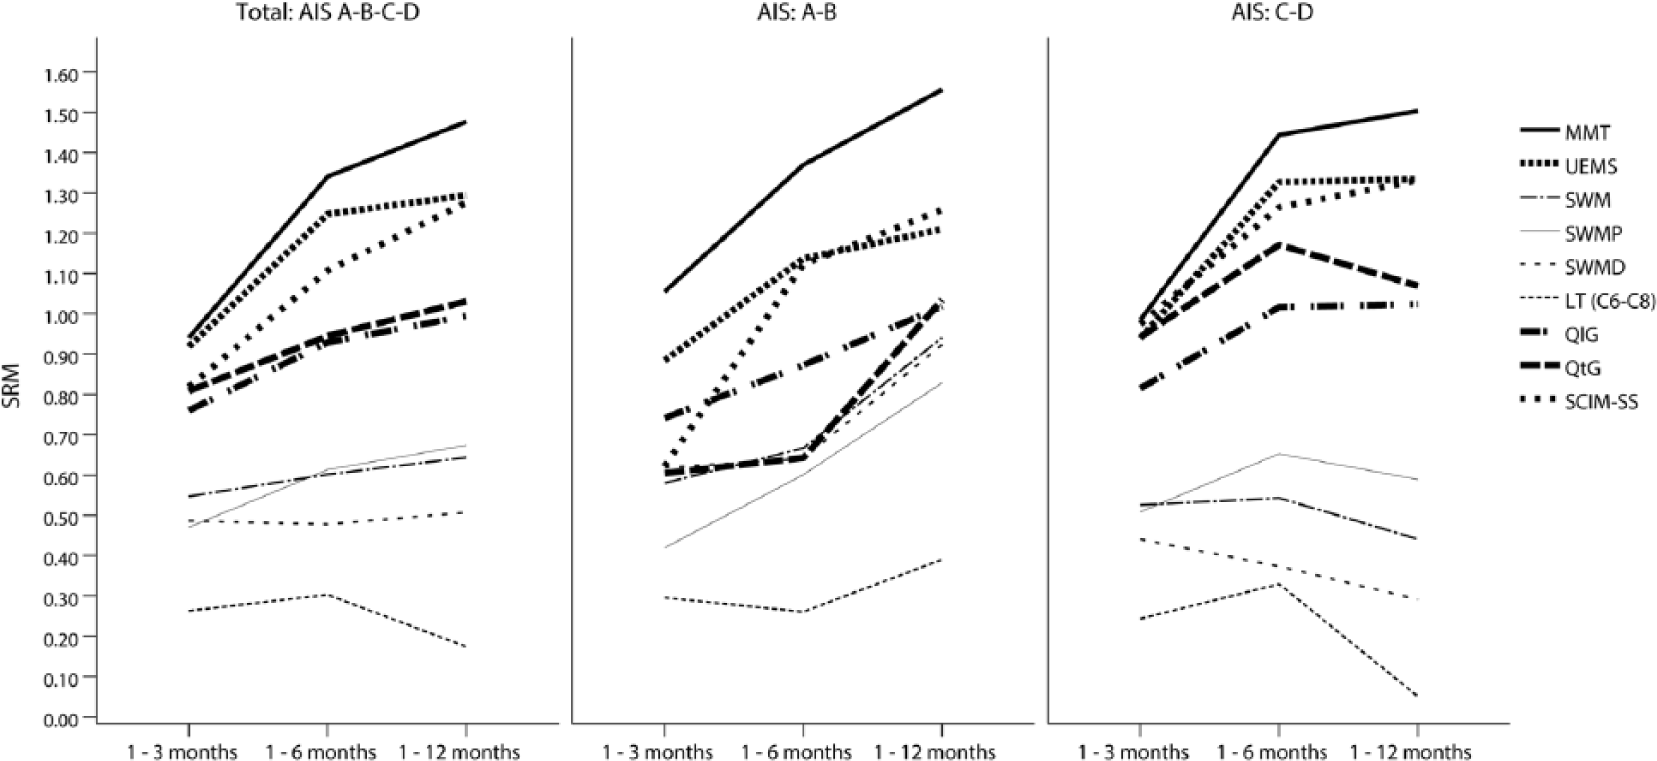
Standardized response mean GRASSP subtests and reference measures.
Figure 1 shows (as visual complement with Table 3 and Table 4) the SRM up to 12 months for the GRASSP subtests compared to the reference measures.
External Responsiveness
The Spearman correlations between GRASSP subtests MMT, SWM, and QtG with the reference measures at 1, 3, 6, and 12 months were moderate to high. Detailed results of the correlation analysis are presented in Table 5.
Spearman Correlations GRASSP Subtests and Reference Measures.
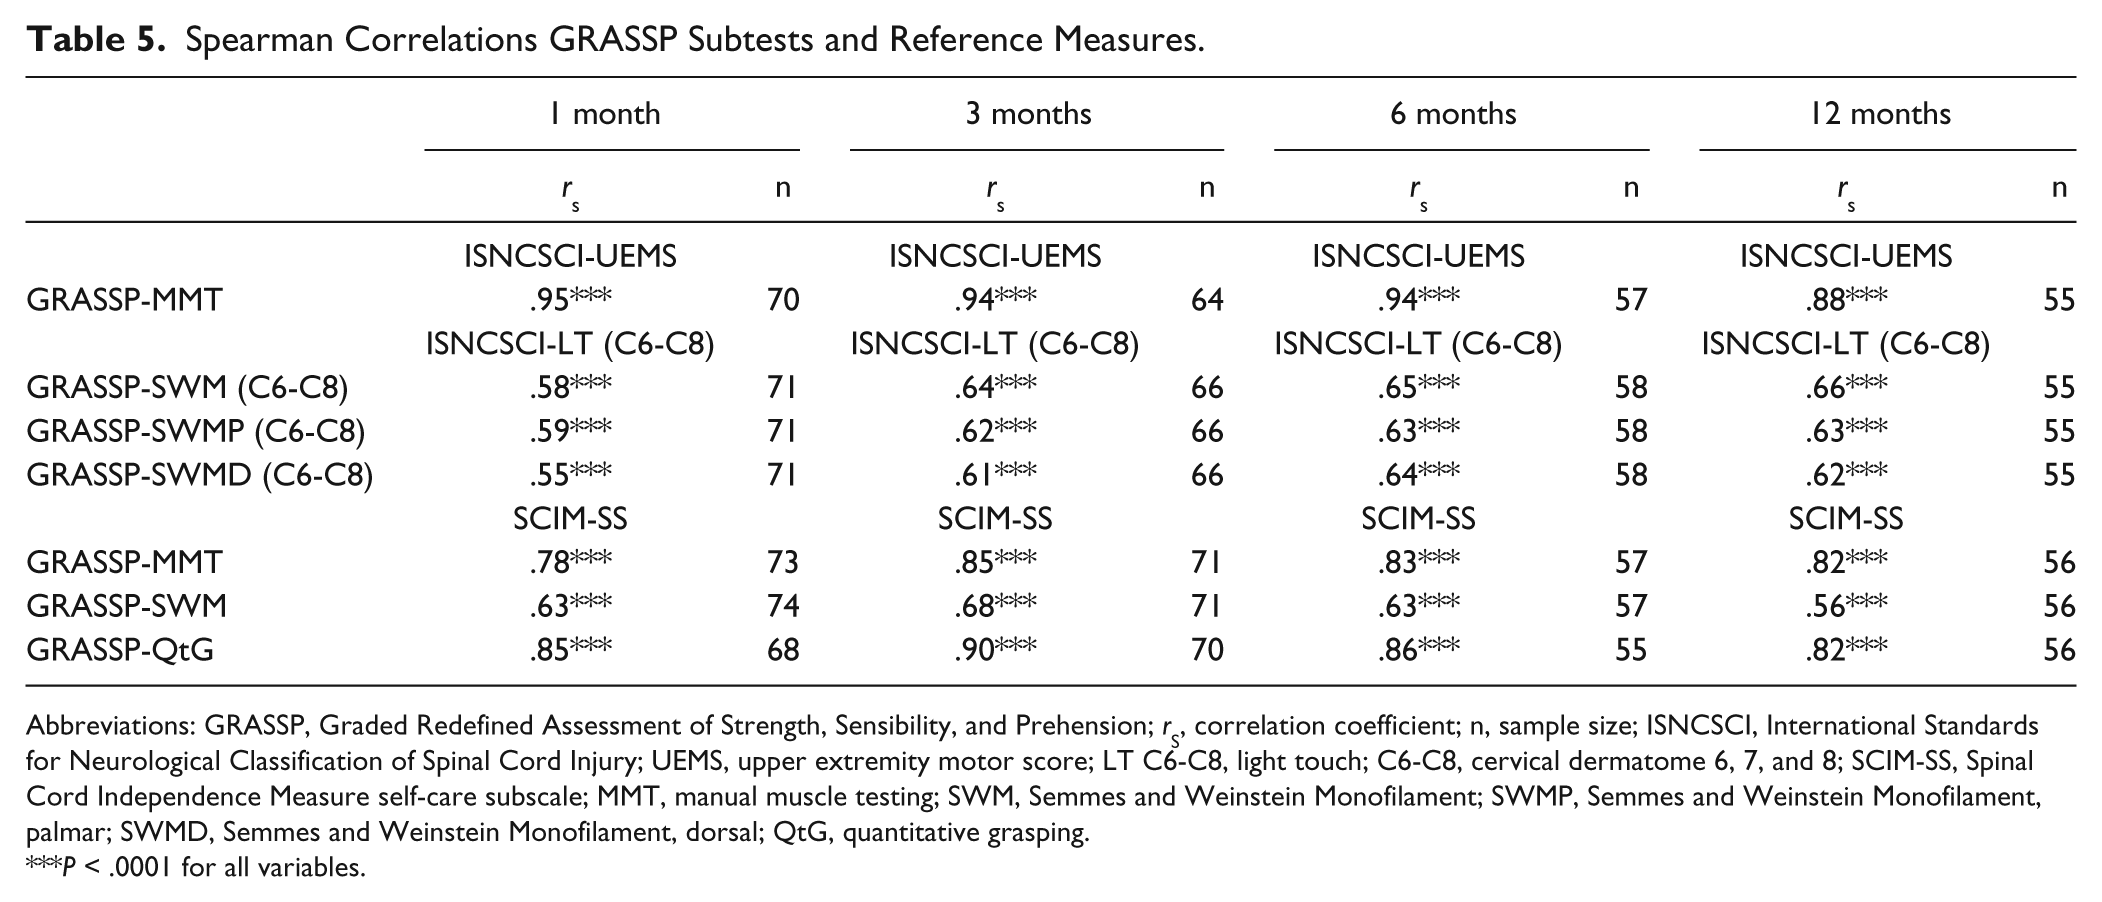
Abbreviations: GRASSP, Graded Redefined Assessment of Strength, Sensibility, and Prehension; rS, correlation coefficient; n, sample size; ISNCSCI, International Standards for Neurological Classification of Spinal Cord Injury; UEMS, upper extremity motor score; LT C6-C8, light touch; C6-C8, cervical dermatome 6, 7, and 8; SCIM-SS, Spinal Cord Independence Measure self-care subscale; MMT, manual muscle testing; SWM, Semmes and Weinstein Monofilament; SWMP, Semmes and Weinstein Monofilament, palmar; SWMD, Semmes and Weinstein Monofilament, dorsal; QtG, quantitative grasping.
P < .0001 for all variables.
ROC analyses showed that the AUC values for MMT, SWM, QtG, and SCIM-SS were acceptable to excellent (ranging from 0.68 to 0.87, P < .05 to P < .001) at 1, 3, 6, and 12 months postinjury. Detailed results for ROC analysis can be found in Table 6 and Figure 2.
Output of Receiver Operating Characteristics (ROC) Analysis.
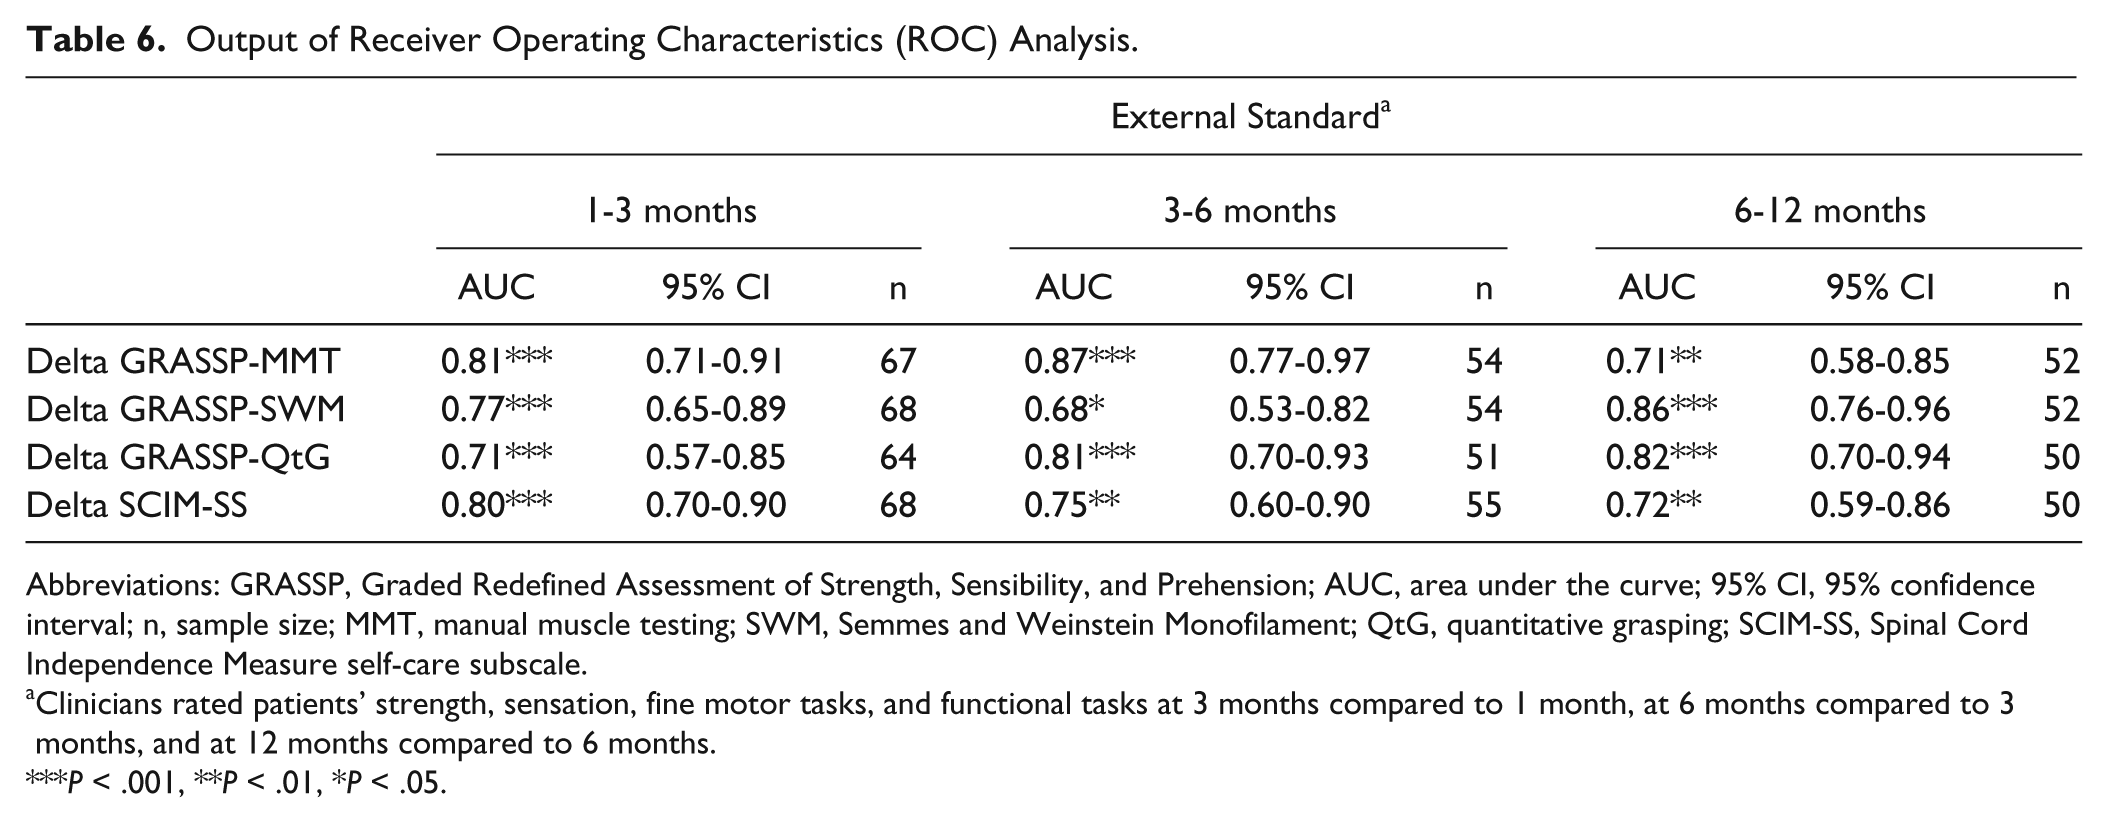
Abbreviations: GRASSP, Graded Redefined Assessment of Strength, Sensibility, and Prehension; AUC, area under the curve; 95% CI, 95% confidence interval; n, sample size; MMT, manual muscle testing; SWM, Semmes and Weinstein Monofilament; QtG, quantitative grasping; SCIM-SS, Spinal Cord Independence Measure self-care subscale.
Clinicians rated patients’ strength, sensation, fine motor tasks, and functional tasks at 3 months compared to 1 month, at 6 months compared to 3 months, and at 12 months compared to 6 months.
P < .001, **P < .01, *P < .05.
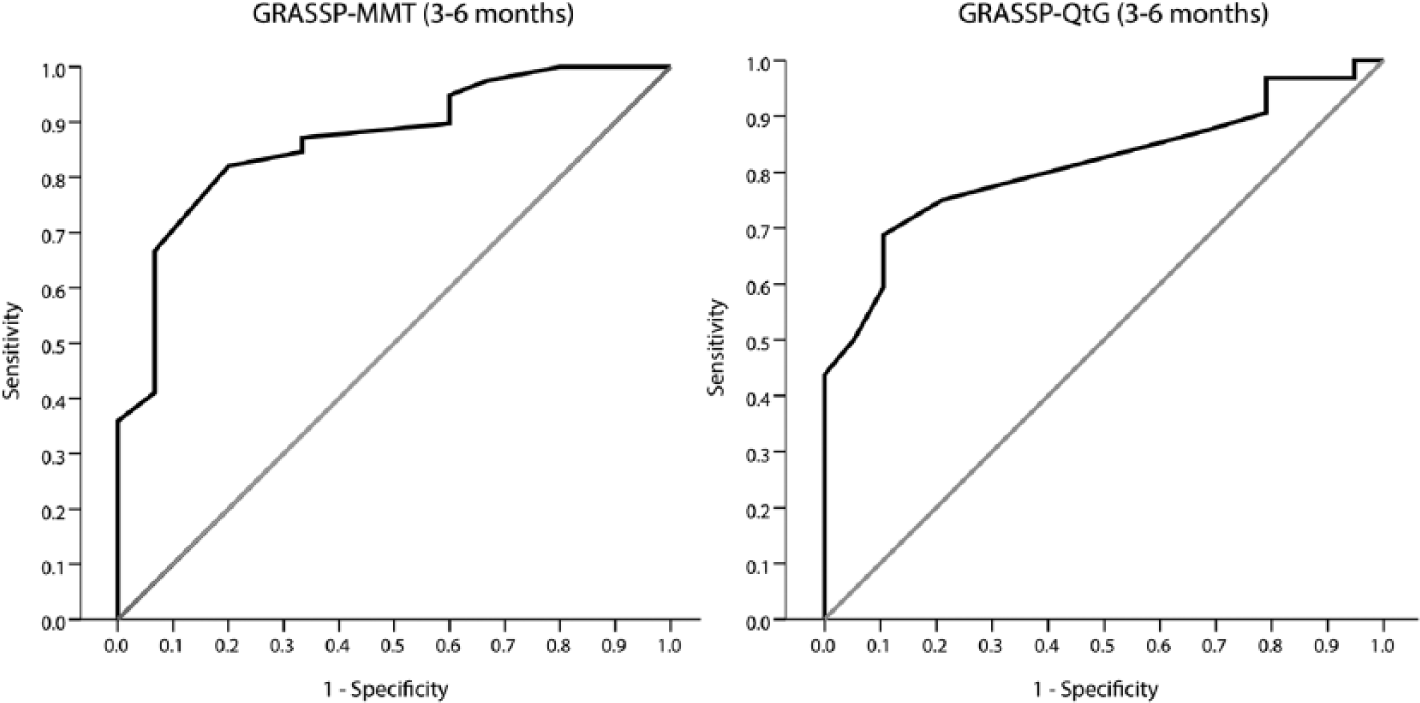
Receiver operating characteristics (ROC) curves.
Recovery Profile
The overall, annualized motor and prehension recovery rate showed a comparable course in the AIS A-B and AIS C-D subgroups (Figure 4) although in the AIS C-D subgroup individuals had higher scores at the beginning of rehabilitation (Figures 3 and 4). A very high motor and prehension recovery rate between 1 and 3 months after injury was achieved in both subgroups. After 3 months, this rate rapidly declined (QtG more steeply than MMT), and between 6 and 12 months the motor and prehension recovery rate was very low, although MMT and QtG continued to show improvement up to 12 months in both subgroups. For detailed results, see Figure 4.
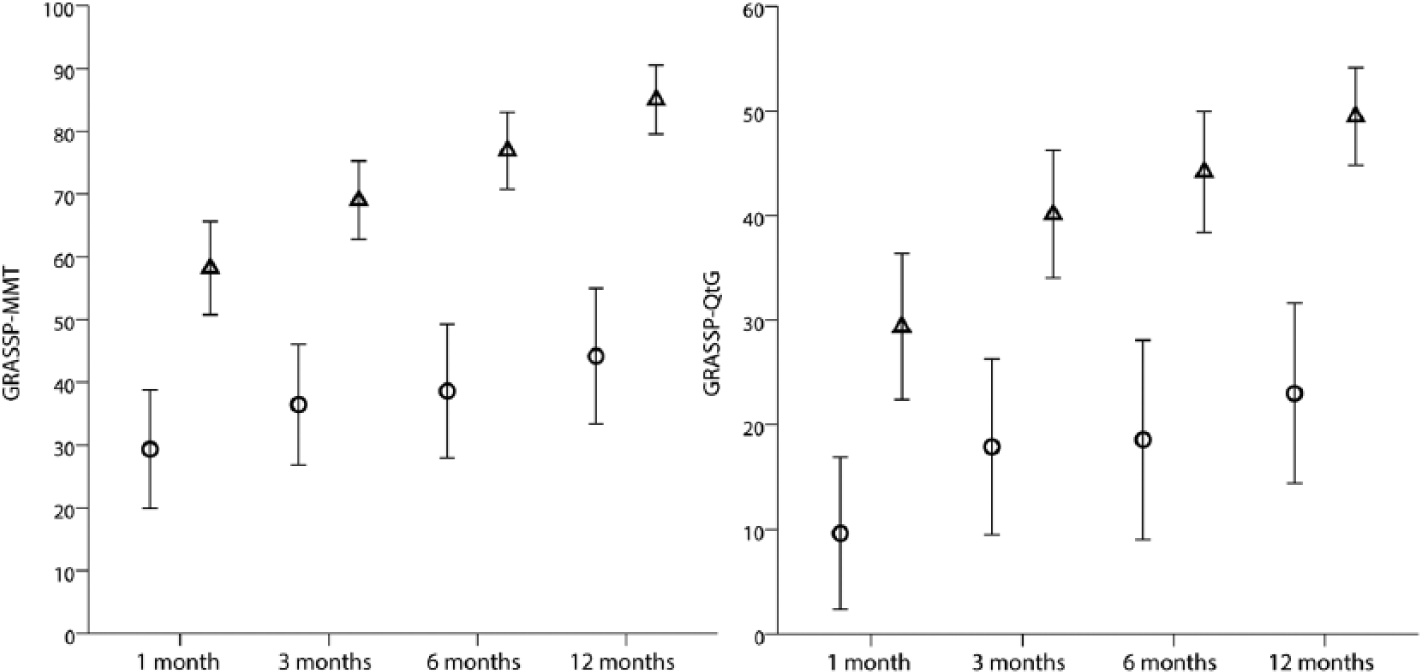
GRASSP-MMT and GRASSP-QtG recovery over time.
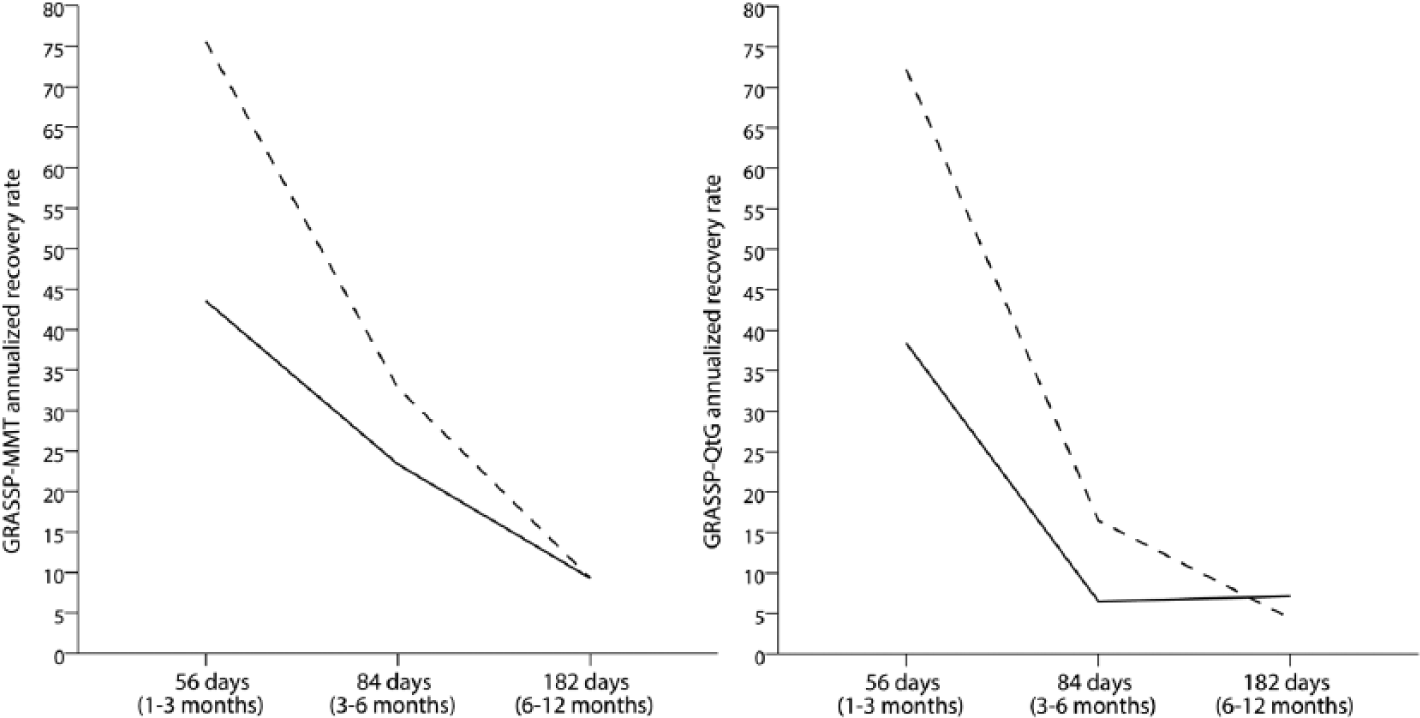
GRASSP-MMT and GRASSP-QtG annualized recovery rate.
Discussion
This study showed the excellent internal and external responsiveness of the GRASSP during the first year after cervical SCI and provided distinct motor and prehension recovery profiles. More important, the GRASSP is complementary to clinical assessment using ISNCSCI standards due to its higher responsiveness. Furthermore, improvements as indicated by the GRASSP were rated as clinically meaningful changes according the clinicians’ impressions of patients’ recoveries. These findings suggest that the GRASSP can provide meaningful information for clinical trials beyond the ISNCSCI standards.
Responsiveness
All GRASSP subtests showed good internal responsiveness over time.
MMT was the most responsive GRASSP subtest with even higher, significant changes seen in the AIS A-B group between 6 and 12 months than in the AIS C-D group. MMT was more responsive than UEMS throughout, likely due to the expanded combination of muscle groups. MMT, as defined in the GRASSP, incorporated additional distal (extensor digitorum, opponens pollicis, flexor pollicis longus, and first dorsal interosseus) and proximal (anterior deltoid) muscle groups in addition to the standard muscles (elbow flexors, wrist extensors, elbow extensors, finger flexors, and small finger abductors) assessed by the ISNCSCI protocol. These additional muscles provide important information regarding innervation and contributed to the higher responsiveness in this study in accordance with findings reported in a recent longitudinal study in acute cervical SCI 14 as well as in a cross-sectional study in chronic SCI. 13 Therefore, the assessment of additional arm and hand muscles as defined by the GRASSP provides a more sensitive appreciation of upper limb function and supports the application of the GRASSP as a more accurate assessment tool in cervical SCI than those used previously (ISNCSCI).
MMT in the AIS C-D group between 6 and 12 months postinjury might show a ceiling effect in detecting further small changes at this stage. For future studies, we recommend the additional assessment of strength using hand-held dynamometry in those individuals with less paretic muscles (minimum MMT score of 3) to avoid ceiling effects in individuals with high MMT scores at the beginning of rehabilitation. In general, QtG was equally sensitive as the SCIM-SS to changes in cervical SCI but was more responsive between 6 and 12 months. SCIM-SS provides a clinically meaningful categorization of functioning in ADLs with a focus on gained independence while the QtG stresses the capacity to perform standardized movement tasks. Although the QtG score is based on unilateral performance of tasks with no compensatory movements, it reflects similar changes to those detected by the SCIM-SS. The advantage of using GRASSP over other outcome measures such as the Van Lieshout test31,32 or Capabilities of Upper Extremity Test, 33 which tend to address overall arm and hand usage, is that it provides more detailed information on how functional improvements are achieved. Likewise, a functional measure such as the SCIM III is not designed to establish the neurological state of an individual when performing tasks or whether those tasks are performed bimanually or with compensatory movements. In contrast, the subtest scores of GRASSP are specifically designed to disentangle detailed motor and sensory functions contributing to the outcome of upper limb function. The detailed assessment reveals how changes in function are related to neurological improvements following spinal cord injury, something that cannot be elucidated by the SCIM III. In addition, the GRASSP subtests also include standardized prehension tests that are related to changes in neurological outcomes. These combined assessments permit the determination of whether changes in function are based on improvement through compensatory movements or on improvement of neurological function. Accordingly, QtG provides a detailed scoring of standardized tasks focusing on the form of the grasp and therefore is able to explain how changes up to 1 year postinjury are achieved.
Sensory changes were rather limited as assessed by the SWM. However, SWM was significant and more sensitive to small gains between 1 and 3 months, something not found with LT (C6-C8). The present results suggest that SWM is sensitive to minor impairments, which are less detectable by LT testing; findings also confirmed in cross-sectional studies by Kalsi-Ryan et al 13 and Velstra et al. 34 These authors observed greater sensitivity of the SWM in individuals with acute and chronic SCI compared with the values reported when using LT.
Likely due to the broader scaling of the SWM (by applying different sensory modalities) as well as the additional palmar test locations, more changes in sensation were detected with SWM than with LT.
All GRASSP subtests revealed significant, moderate-to-excellent correlations with the established reference measures at each time point (external responsiveness). These findings support previously published data that showed significant and moderate-to-strong correlations of MMT, SWM, QtG, or cervical motor levels with self-care in longitudinal as well as cross-sectional studies in acute and chronic cervical SCI.5,6,13,14,23,35 The large SRMs, particularly for MMT and QtG, reflect great clinical significance,25,36,37 which was supported by the clinicians’ ratings (external standard), used as an indicator for clinically meaningful change. The results showed large AUC, indicating that changes in GRASSP subtests and SCIM-SS were rated as clinically meaningful in accordance with the external standard (external responsiveness).25,28,38,39
Recovery Profiles
It was expected that strength (MMT) and prehension (QtG) would mostly improve within the first 3 months of injury where improvements in general functional skills and motor recovery are most prominent compared to later stages of rehabilitation.3-5,40-45 In contrast, the present study revealed significant improvements in strength between at time points up to 12 months postinjury in the entire group and A-B subgroup and up to 6 months postinjury in the C-D subgroup.
The prehension (QtG) and motor (MMT) recovery rates are comparable with the annualized recovery rate reported elsewhere.3,4,44,45 This rate decreased with time after cervical SCI. Between 1 and 3 months postinjury, individuals with AIS C-D showed a motor and prehension recovery rate almost twice as high as that in individuals in the AIS A-B subgroup. From 3 months to 1 year after injury, the motor and prehension recovery rate declined rapidly, although motor changes were larger compared to prehension changes and reached a rate similar in both subgroups at 6 and 12 months. Strength and prehension still showed improvement up to 12 months in both subgroups, which is a new finding.
Implications for Rehabilitation and Clinical Trials
This study provides data to assist clinicians and researchers on the value of the GRASSP in acute tetraplegia. We found that the responsiveness of GRASSP is excellent, and it is applicable as a primary outcome measure in rehabilitation. Specifically, MMT and QtG seem to be most valuable for clinical trials as they are strongly responsive to change over the course of recovery and identify clinically meaningful changes complementary to ISNCSCI and SCIM. Measures with greater responsiveness indices provide greater study power, thereby allowing a study to be completed with fewer individuals. 46
The observed GRASSP subtest changes were also in accordance with the clinicians’ impressions of patient changes, which is a novel finding. Therefore, CROM may be useful in clinical trials to incorporate a clinical judgment that references past experiences to benchmark the progress of a patient. 47 Experienced clinicians, such as those involved in this study, have a good understanding of neurological impairment and functional performance. However, novel questionnaires like the CROM have to be interpreted with caution as they may be influenced by other factors (eg, clinical judgment, past experience, beliefs regarding treatment effectiveness, etc). Systematic bias in our results cannot be entirely excluded as some assessments of GRASSP and CROM in individual patients were performed by the same therapist. Depending on the study design and research question, it is of course advisable that independent clinicians perform the GRASSP and CROM, thereby minimizing examiner bias.
Limitations
The effect of different baseline levels of lesion was not assessed in this investigation, but consideration of the amount of change for such patients should be investigated with a higher sample size in future studies.
Conclusion
The GRASSP is a responsive and clinically meaningful tool for the evaluation of upper limb outcomes in cervical SCI and can be recommended for follow-up assessments. The combined assessment of neurological (body structure and body function) and functional outcomes, for example, prehension (activity and participation), focused on segmental cervical spinal cord functions that are closely related to other standard assessment tools (ISNCSCI and SCIM) supports the use of GRASSP in the assessment of rehabilitation as well as in interventional clinical trials that seek to detect both subtle and clinically meaningful changes.
Footnotes
Acknowledgements
We thank the International GRASSP Research and Design Team: Armin Curt, Susan Duff, Michael Fehlings, Sukhvinder Kalsi-Ryan, Claudia Rudhe, and Mary C. Verrier. We are grateful to the individuals with SCI who participated in this study and the occupational therapists at the participating centers: Spinal Cord Injury Center, Hohe Warte, Bayreuth, Germany; Orthopädische Universitätsklinik, Heidelberg, Germany; Unfallklinik Murnau, Germany; Balgrist University Hospital, Zurich, Switzerland; and the Swiss Paraplegic Center, Nottwil, Switzerland. Furthermore, we thank Dr Aurelio Tobón (Nottwil) for performing the clinical neurological examinations, Mr Tim Killeen (Balgrist) for critically reviewing the article and his invaluable assistance with English language editing, and Dr Doris Maier (Murnau) and Dr Rüdiger Rupp (Heidelberg) for their collaboration on this project.
Declaration of Conflicting Interests
The author(s) declared no potential conflicts of interest with respect to the research, authorship, and/or publication of this article.
Funding
The author(s) disclosed receipt of the following financial support for the research, authorship, and/or publication of this article: The study was supported by the Swiss Paraplegic Center, Nottwil, Switzerland, and funded by the NeuroRehab Clinical Research Priority Program at the University of Zurich, Switzerland.