
Abstract
Background. After stroke, visuospatial and kinesthetic (sense of limb motion) deficits are common, occurring in approximately 30% and 60% of individuals, respectively. Although both types of deficits affect aspects of spatial processing necessary for daily function, few studies have investigated the relationship between these 2 deficits after stroke. Objective. We aimed to characterize the relationship between visuospatial and kinesthetic deficits after stroke using the Behavioral Inattention Test (BIT) and a robotic measure of kinesthetic function. Methods. Visuospatial attention (using the BIT) and kinesthesia (using robotics) were measured in 158 individuals an average of 18 days after stroke. In the kinesthetic matching task, the robot moved the participant’s stroke-affected arm at a preset direction, speed, and magnitude. Participants mirror-matched the robotic movement with the less/unaffected arm as soon as they felt movement in their stroke affected arm. Results. We found that participants with visuospatial inattention (neglect) had impaired kinesthesia 100% of the time, whereas only 59% of participants without neglect were impaired. For those without neglect, we observed that a higher percentage of participants with lower but passing BIT scores displayed impaired kinesthetic behavior (78%) compared with those participants who scored perfect or nearly perfect on the BIT (49%). Conclusions. The presence of visuospatial neglect after stroke is highly predictive of the presence of kinesthetic deficits. However, the presence of kinesthetic deficits does not necessarily always indicate the presence of visuospatial neglect. Our findings highlight the importance of assessment and treatment of kinesthetic deficits after stroke, especially in patients with visuospatial neglect.
Introduction
Visuospatial neglect is a common attentional disorder that may result from stroke. The reported incidence of visuospatial neglect following stroke varies widely, from 8% 1 to as high as 80%. 2 Individuals with visuospatial neglect commonly fail to attend to objects, locations, or even their own limbs in the contralesional side of space. 3 Visuospatial neglect after stroke increases potential for injury,4,5 impairs performance of activities of daily living, 6 and may decrease quality of life. 7
Visuospatial deficits often present along with motor7-10 or somatosensory deficits, 8 such as proprioception. Proprioception has been defined as sense of limb position (position sense) and motion (kinesthesia). 11 Current work done by our group12,13 and that of others14,15 has found that position sense and kinesthetic deficits are common after stroke, occurring in 50% or greater of stroke survivors. Impairments in proprioception have also been found to interfere with rehabilitation 16 and can lead to injury after stroke. 17 It is likely that the spatial inattention seen in visuospatial neglect also extends to proprioceptive processing, which provides spatial awareness of the limbs in order to execute movement. Only a few studies have attempted to systematically evaluate the relationship between neglect and proprioception18-20 despite their seemingly shared neuroanatomy in areas of the parietal cortex.21,22 It would seem likely that lesions affecting areas known to process spatial aspects of visual attention likely also disrupt spatial aspects of proprioception.
Clinically, it is common to see deficits in visuospatial and proprioceptive function to co-occur. However, current stroke rehabilitation treatments for neglect (eg, scanning therapy 23 and prism glasses 24 ) focus mainly on the visuospatial aspects of the disorder and fail to directly treat proprioceptive deficits. Robertson et al 25 have suggested that proprioceptive feedback may improve neglect through augmentation of the perceptual discrepancies between visual and proprioceptive information. Developing a better understanding of the relationship between visuospatial and proprioceptive deficits may provide insight into how commonly these deficits co-occur and the potential for rehabilitation strategies beyond traditional, largely visual-based approaches. The addition of somatosensory strategies and treatments to rehabilitation of visuospatial neglect may in turn improve overall recovery from stroke.
In the present study, we investigated the relationship between visuospatial neglect and kinesthetic deficits after stroke and hypothesized that after stroke, visuospatial neglect is highly related to kinesthetic deficits. By determining the frequency with which visuospatial deficits and kinesthetic deficits co-occur, we may be able to better inform treatment after stroke and potentially improve poststroke rehabilitative care of both kinesthetic and visuospatial deficits.
Methods
Participants
Participants with stroke (n = 158) were recruited from the acute stroke unit and stroke rehabilitation units of Foothills Hospital and the Dr Vernon Fanning Centre, Calgary, Canada. Participants with stroke were included if they had first-onset, clinically diagnosed, unilateral stroke. The majority of stroke patients were run within the first 1 to 2 weeks poststroke (Table 1, median = 10 days; range = 1-112 days). In all, 59 participants had left-hemisphere lesions, 98 participants had right-hemisphere lesions, and 1 participant had a high cervical right posterior spinal artery stroke. For the remainder of the article, we refer to participants by the side of their body (not brain) most affected by the stroke. Controls (n = 84) were recruited from the community. Participants were excluded if they had significant active medical issues (eg, angina or respiratory distress), musculoskeletal injuries affecting the shoulder or upper limb, neurological conditions other than stroke, or could not follow task instructions. This study was approved by the University of Calgary Ethics Board. Some data in this study have previously appeared in another article that focused on the development of the robotic kinesthesia measurement technique and that excluded participants with visuospatial neglect. 13 Specifically, data from 74 controls and 110 stroke patients without neglect overlap with data presented in the current study.
Participant Demographics.
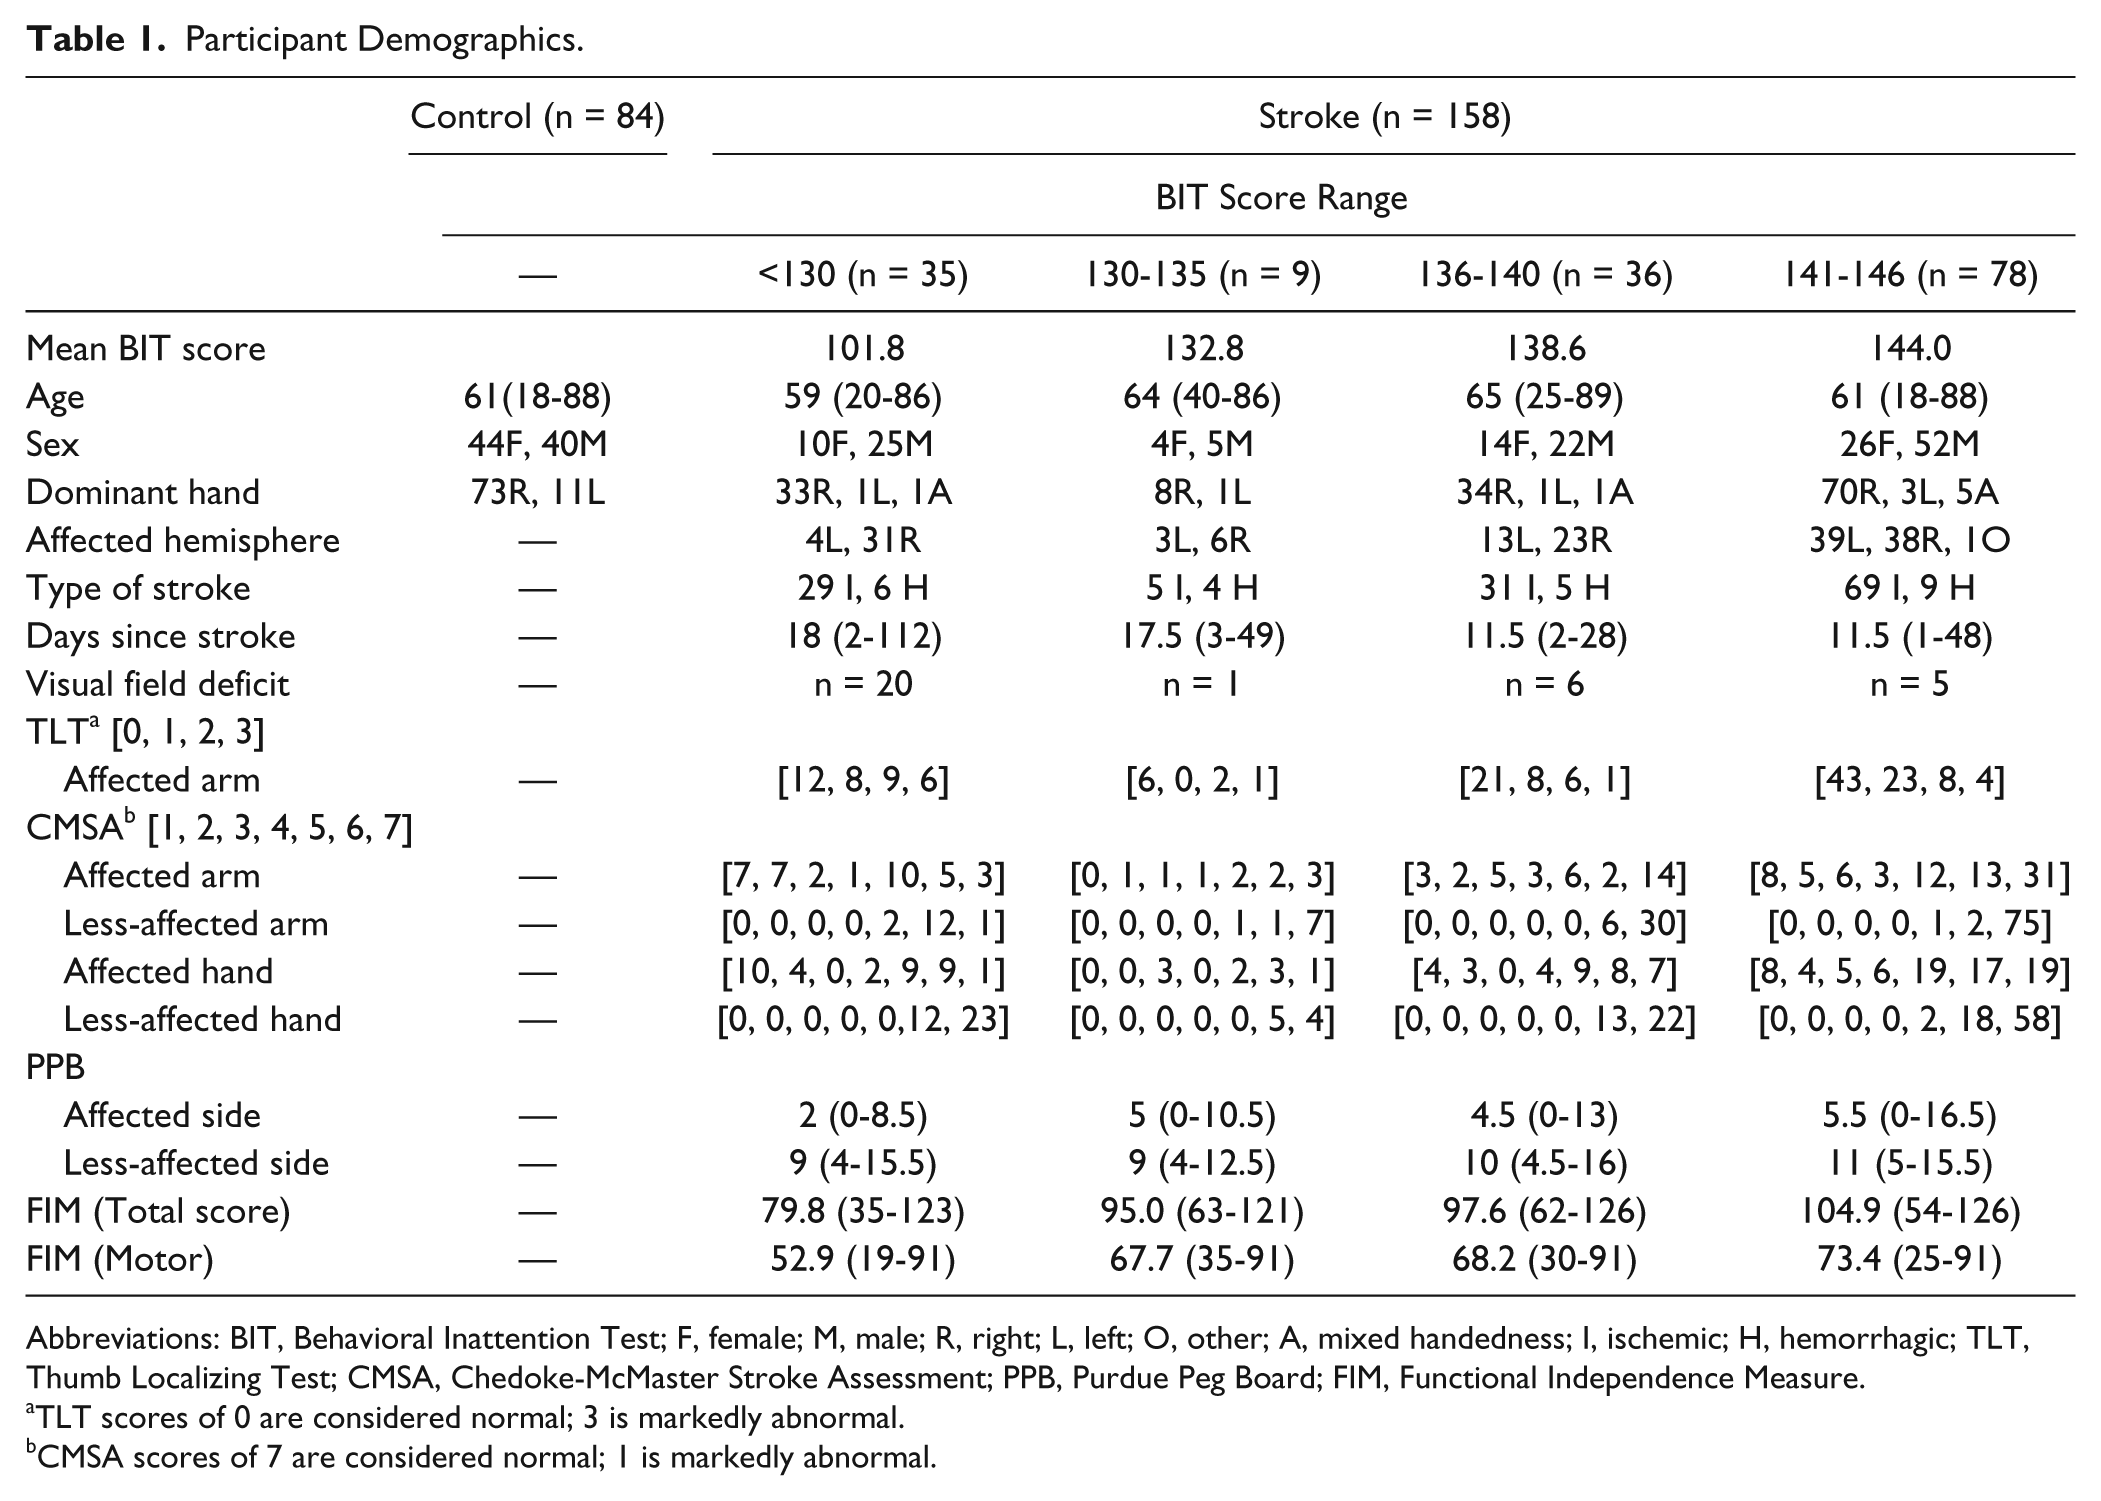
Abbreviations: BIT, Behavioral Inattention Test; F, female; M, male; R, right; L, left; O, other; A, mixed handedness; I, ischemic; H, hemorrhagic; TLT, Thumb Localizing Test; CMSA, Chedoke-McMaster Stroke Assessment; PPB, Purdue Peg Board; FIM, Functional Independence Measure.
TLT scores of 0 are considered normal; 3 is markedly abnormal.
CMSA scores of 7 are considered normal; 1 is markedly abnormal.
Identification of Neglect and Clinical Assessments
Visuospatial neglect was identified using the conventional subtests of the Behavioral Inattention Test (BIT), 26 administered by either the study therapist or physician. The BIT quantifies neglect through a variety of pen and paper tests (e.g., line bisection, 27 letter and shape cancellation tasks,28,29 and figure copying 30 ) aimed at detecting deficits in spatial attention. The BIT has been shown to be a robust predictor of visuospatial neglect 31 and is a predictor of functionality after stroke. 32 It has an established concrete cutoff for detection of visuospatial neglect (BIT < 130). 26 It is likely, however, that poststroke visuospatial deficits do not strictly obey this concrete cutoff but instead follow a continuum. 33
For the purposes of analysis in the present article, we arbitrarily subclassified participants into 4 groups according to the BIT score to examine the relationship between participants who nearly failed the BIT compared with participants who scored perfect or nearly perfect on the BIT: (1) Neglect—participants who scored <130, that is, a failing score (BIT < 130); (2) S1—stroke participants who scored between 130-135, that is, a passing score with several errors; (3) S2—stroke participants who scored between 136 and 140, that is, a passing score with some errors; and (4) S3—stroke participants who scored between 141 and 146, that is, a passing score with few or no errors. A number of secondary clinical measures were also obtained. The Chedoke-McMaster Stroke Assessment (CMSA)–Arm and Hand Impairment Inventory was performed, which measures motor impairment in the hand and upper limb 34 ; the Purdue Peg Board (PPB) was completed, which measures hand dexterity 35 ; and the Thumb Localizing Test (TLT) was done to measure position sense. The latter requires participants to identify the position of their opposite thumb, held at eye level or higher with eyes closed 36 and is scored on a scale from 0 to 3 (0 = intact position sense, 3 = highly impaired position sense). The Functional Independence Measure (FIM) 37 was also used to measure functional abilities (Table 1). All participants with stroke were tested on all clinical measures, with the exception of 1 participant with a missing CMSA score.
Quantifying Kinesthesia
Kinesthesia was quantified using the KINARM robotic exoskeleton (Figure S1, BKIN Technologies, Kingston, ON, Canada). The KINARM device has been previously described for quantifying proprioception in individuals with stroke.12,13,38,39 Participants sat in a wheelchair base with both arms supported against gravity by the exoskeleton. The exoskeleton is articulated at the shoulders and elbows, allowing for movements in the horizontal plane. Participants viewed visual feedback through a display that presented targets in the horizontal plane aligned with the limb’s workspace.
Participants performed a kinesthetic matching task, which has been previously described. 13 With vision of their arms occluded, participants were instructed that the robot would move one arm (passive arm), and as soon as they felt the robot begin to move the passive arm, they were to mirror-match the speed, direction, and magnitude of the perceived movement with their other arm (active arm). To begin the task, a red circle (2 cm in diameter) appeared at 1 of 3 predetermined locations in the work space. The participant was asked to move a white dot (representing the tip of the index finger of the participant’s active arm) into the red circle. The robot then moved the passive arm to bring both arms to a mirrored start position. All visual cues were then removed, which initiated the trial. At a random delay (1250-1750 ms), the robot moved the passive arm in a preset direction and with a preset speed (0.28 m/s) and magnitude (20 cm). Participants were to then mirror-match the perceived movement as soon as they felt the robot begin to move. Participants completed 6 movements in 6 possible pseudorandomized directions (resembling an inverted equilateral triangle) for a total of 36 trials. For stroke participants, the robot moved the stroke-affected arm, and participants matched with their less/unaffected arm. All but 2 control participants were tested on both arms, for a total of 166 control samples.
All x, y spatial data of the active arm were reflected across the work space midline to make comparisons to the robot-generated passive movement. The following metrics have been found to characterize both the spatial and temporal aspects of kinesthesia. 13 Peak speed was calculated as the maximum speed reached by the active arm. Onset for the passive movement was defined as the time when the robotic movement reached 10% of maximum speed. Movement onset for the active movement was defined as the time when the active hand speed reached 10% of its maximum speed. End of movement was defined as the time when hand speed fell below 10% of the maximum speed.
Response latency (RL): This is the elapsed time between onset of the robot-generated movement and onset of the active movement, measured in milliseconds.
Peak speed ratio (PSR): It is the ratio of peak speed between the active and passive arms. Ratios <1 indicate that the active arm moved slower than the passive arm.
Initial direction error (IDE): This is the angular deviation between the participant-generated active movement and the robot-generated passive movement, from movement onset to peak speed of movement.
Path length ratio (PLR): This is the ratio of the length of the active movement to the length of the passive movement. Path lengths were measured from movement onset to end of movement. Ratios <1 indicated short path length values for the active arm as compared with the passive arm.
For each of these metrics, mean and standard deviation were taken across all completed trials (36 total), for a total of 8 parameters.
Statistical Analyses
Using the control group, 95% confidence intervals (CIs) were calculated for 8 parameters and designated the normative control range (1-sided metrics—RL, IDE, and all variability parameters; 2-sided metrics—PSR and PLR). Stroke patients were significantly different from controls if they fell outside this 95% control range (P < .05). These metrics and statistical methodologies have been previously described. 13
Overall performance on the kinesthetic matching task was calculated based on control performance across all 8 parameters. For each parameter and each participant, we determined if control participants fell outside of the 95% CI. The number of times controls fell outside the control range was tallied across all 8 parameters to determine the 95% CI (P < .05) for controls across parameters. This control range (0 to 2 parameters) could then be used to determine whether a participant with stroke failed the task or not (i.e., failure on 3 or more parameters).
We computed conditional probabilities to test the relationship between performance on the BIT and performance on the kinesthetic task. Furthermore, a Fisher’s test was used to determine the significance and directionality of this relationship. Kolmogorov-Smirnov tests were used to test for age and sex differences between control and stroke populations. Pearson correlations were calculated for individual kinesthetic parameters and all clinical scores and are given in Table 2. Bonferroni corrections adjusted for multiple comparisons where appropriate. One-way ANOVAs were performed to test for differences between the groups Neglect, S1, S2, and S3 for all clinical scores. For ANOVAs, Tukey post hoc comparisons were completed at P < .05 significance level (Tables S1 and S2).
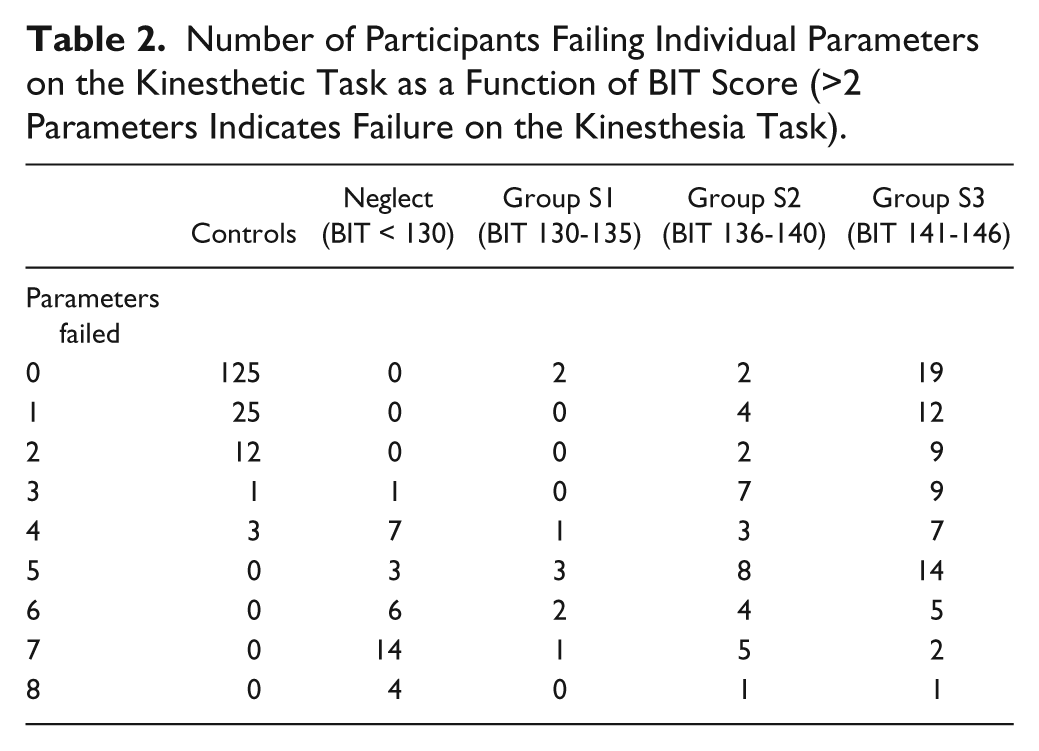
Number of Participants Failing Individual Parameters on the Kinesthetic Task as a Function of BIT Score (>2 Parameters Indicates Failure on the Kinesthesia Task).
Results
We collected data from 158 stroke participants and 84 controls. Participant demographics and clinical assessment scores are presented in Table 1. Of the 158 participants with stroke tested, 35 were identified as having visuospatial neglect (BIT < 130). We observed no age (P > .05) or sex (P > .05) differences between the control and stroke participant groups. Overall, more participants with stroke had right-hemisphere strokes (left-side affected; 62%, n = 98). Nearly all participants with visuospatial neglect had right-hemisphere strokes (left-side affected; 89%, n = 31). In all, 32 participants with stroke had visual field deficits (20%), with 20 being in the subset of participants who failed the BIT. Of those participants, 23 had hemianopsia, 6 had quadrantanopsia, and 3 had smaller scotomas. Whereas FIM scores for stroke patients ranged from severe (35) to mild (126), median FIM scores were in the mild range (101, Table 1) at the time of assessment. 37
BIT Performance
Figure 1 demonstrates performance on the Figure and Shape Copying subtask of the BIT for a participant with stroke without visuospatial neglect (S3, BIT = 146, Figure 1A) and with visuospatial neglect (Neglect, BIT = 114, Figure 1B). In both the Flower Copying (Figure 1, top) and Star Copying (Figure 1, bottom) subtasks, we can qualitatively identify the participant with visuospatial neglect (Figure 1B) because of the absence of details on the left side of the drawing. For those participants who passed the BIT (score > 129), we found that 9 participants scored in the 130 to 135 range (S1), 36 scored in the 136 to 140 range (S2), and 78 scored in the 140 to 146 range (S3). On all clinical measures (CMSA, FIM, PPB, and TLT), the Neglect and S3 groups were significantly different, whereas the Neglect and S2 groups were significantly different for all clinical measures except for the CMSA arm and hand (Table S1)—CMSA arm: F(3, 153) = 3.89; CMSA hand: F(3, 153) = 3.04; FIM: F(3, 154) = 8.53; PPB: F(3, 153) = 5.83; TLT: F(3, 154) = 4.24; ANOVA P < .05, Tukey P < .05. No statistical differences were found for clinical scores between the Neglect and S1 participant groups.
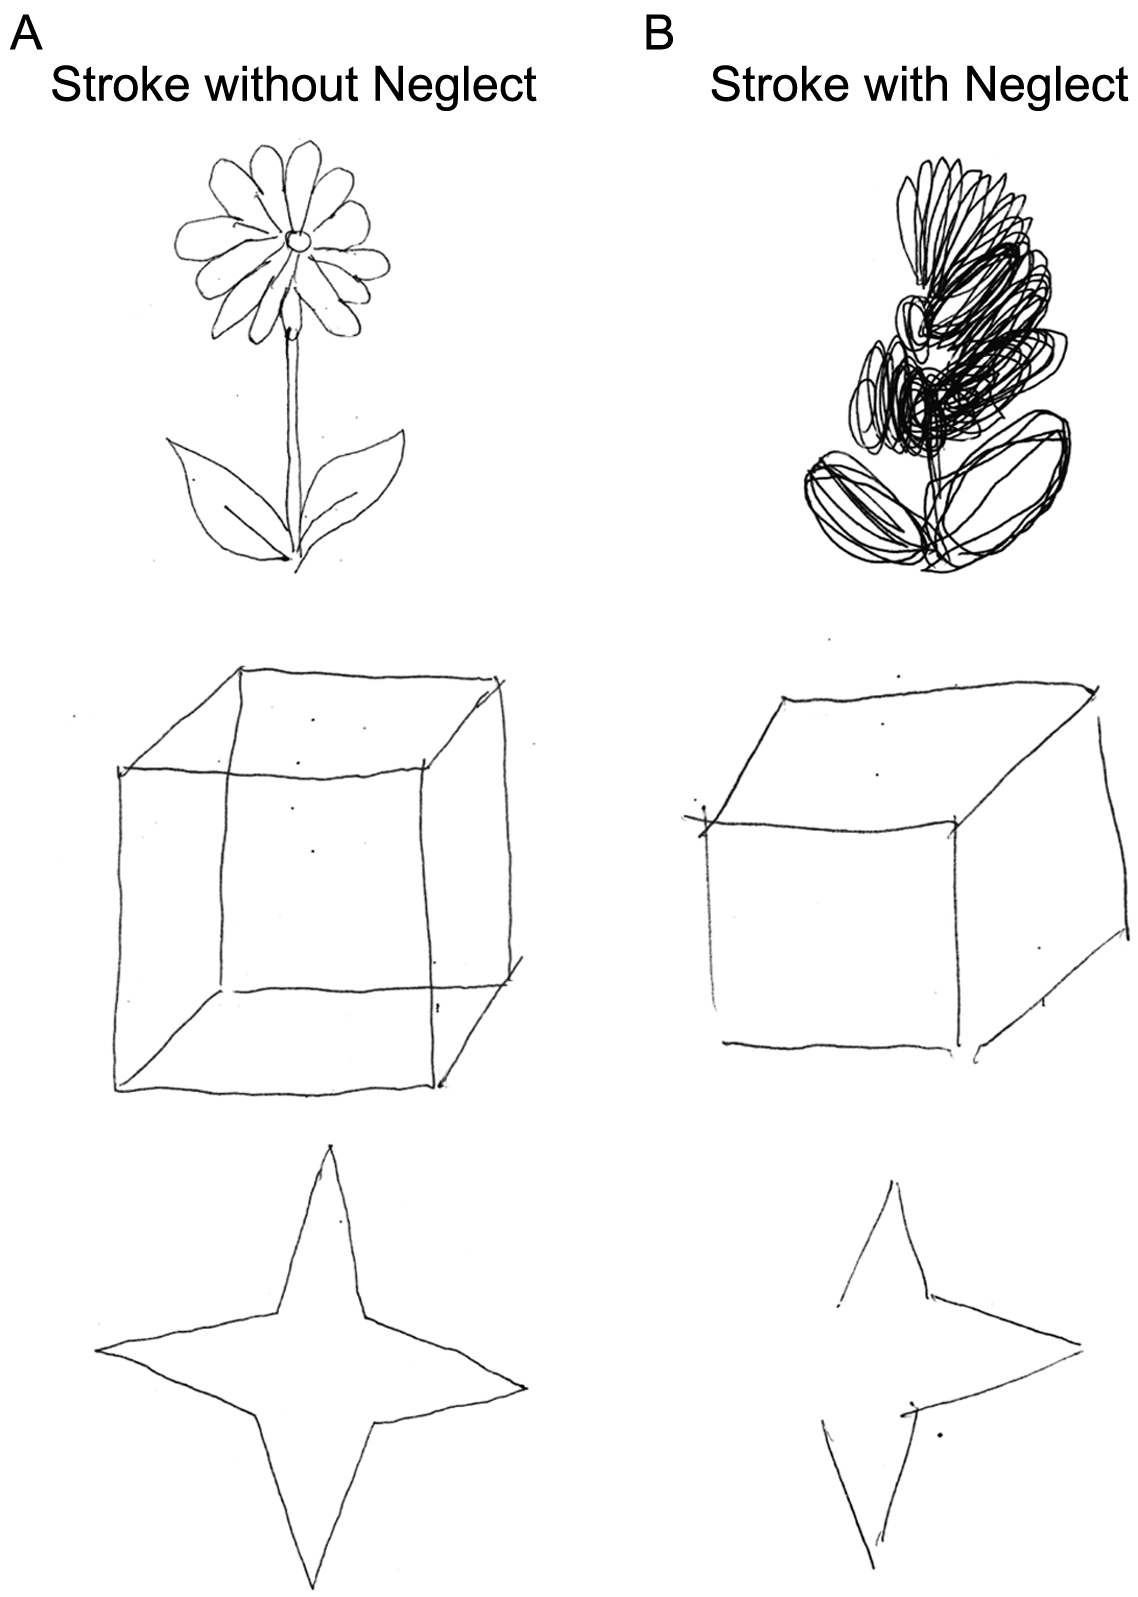
Exemplar results from the figure and shape copying subtasks of the Behavioral Inattention Test (BIT) for participants without (A) and with neglect (B).
Overall Kinesthetic Performance
We found that 95% of controls failed 2 or fewer parameters on the kinesthesia task. We, thus, created a failure threshold for participants with stroke of 3 or more parameters. It was found that 67% (n = 106) of all participants with stroke failed 3 or more parameters on the kinesthesia task (95% CI, P < .05). Furthermore, participants with lower BIT scores failed the kinesthesia task more often than those with higher BIT scores, with the Neglect group consistently performing worse on nearly all (7 out of 8) kinesthetic parameters compared with the S3 group (Table S2). Strikingly, 100% of the 35 participants in the Neglect group failed the kinesthesia task (>2 parameters). We computed the conditional probability of failure on both the BIT and kinesthesia task and found the probability to be 1, whereas participants who passed the BIT had a probability of failure on the kinesthesia task of 0.6. Additionally, we found that the relationship between failure on the BIT and the kinesthesia task was highly significant (Fisher’s test, P < .001). We observed no qualitative differences in the number of parameters failed for participants with left (n = 31) and right visuospatial neglect (n = 4). Participants in the S1 group performed slightly better than those in the Neglect group, with 78% (n = 7) failing. Participants in the S2 group performed similarly to the S1 group with 78% (n = 28) of participants failing, and participants in the S3 group performed the best, with only 49% (n = 38) of participants failing the kinesthesia task (Table 2).
Temporal Parameters (RL and PSR)
Exemplar Performance
Hand speed data for exemplar participants for a single movement direction are displayed in Figures 2A to 2C. Compared with the exemplar control (Figure 2A), an exemplar participant with stroke without neglect (Group S3, BIT = 141, Figure 2B) displayed similar response timing (RL) and peak speed matching (PSR; S3 participant: RL = 485.7 ms; PSR = 1.03). In contrast, a participant with visuospatial neglect (group Neglect, BIT = 61, Figure 2C) performed poorly on temporal measures; had longer, more variable response latencies; and moved 50% further in an attempt to match movement length (neglect participant: RL = 848.6, RLv = 700.5; PSR = 1.50, PSRv = 0.77).
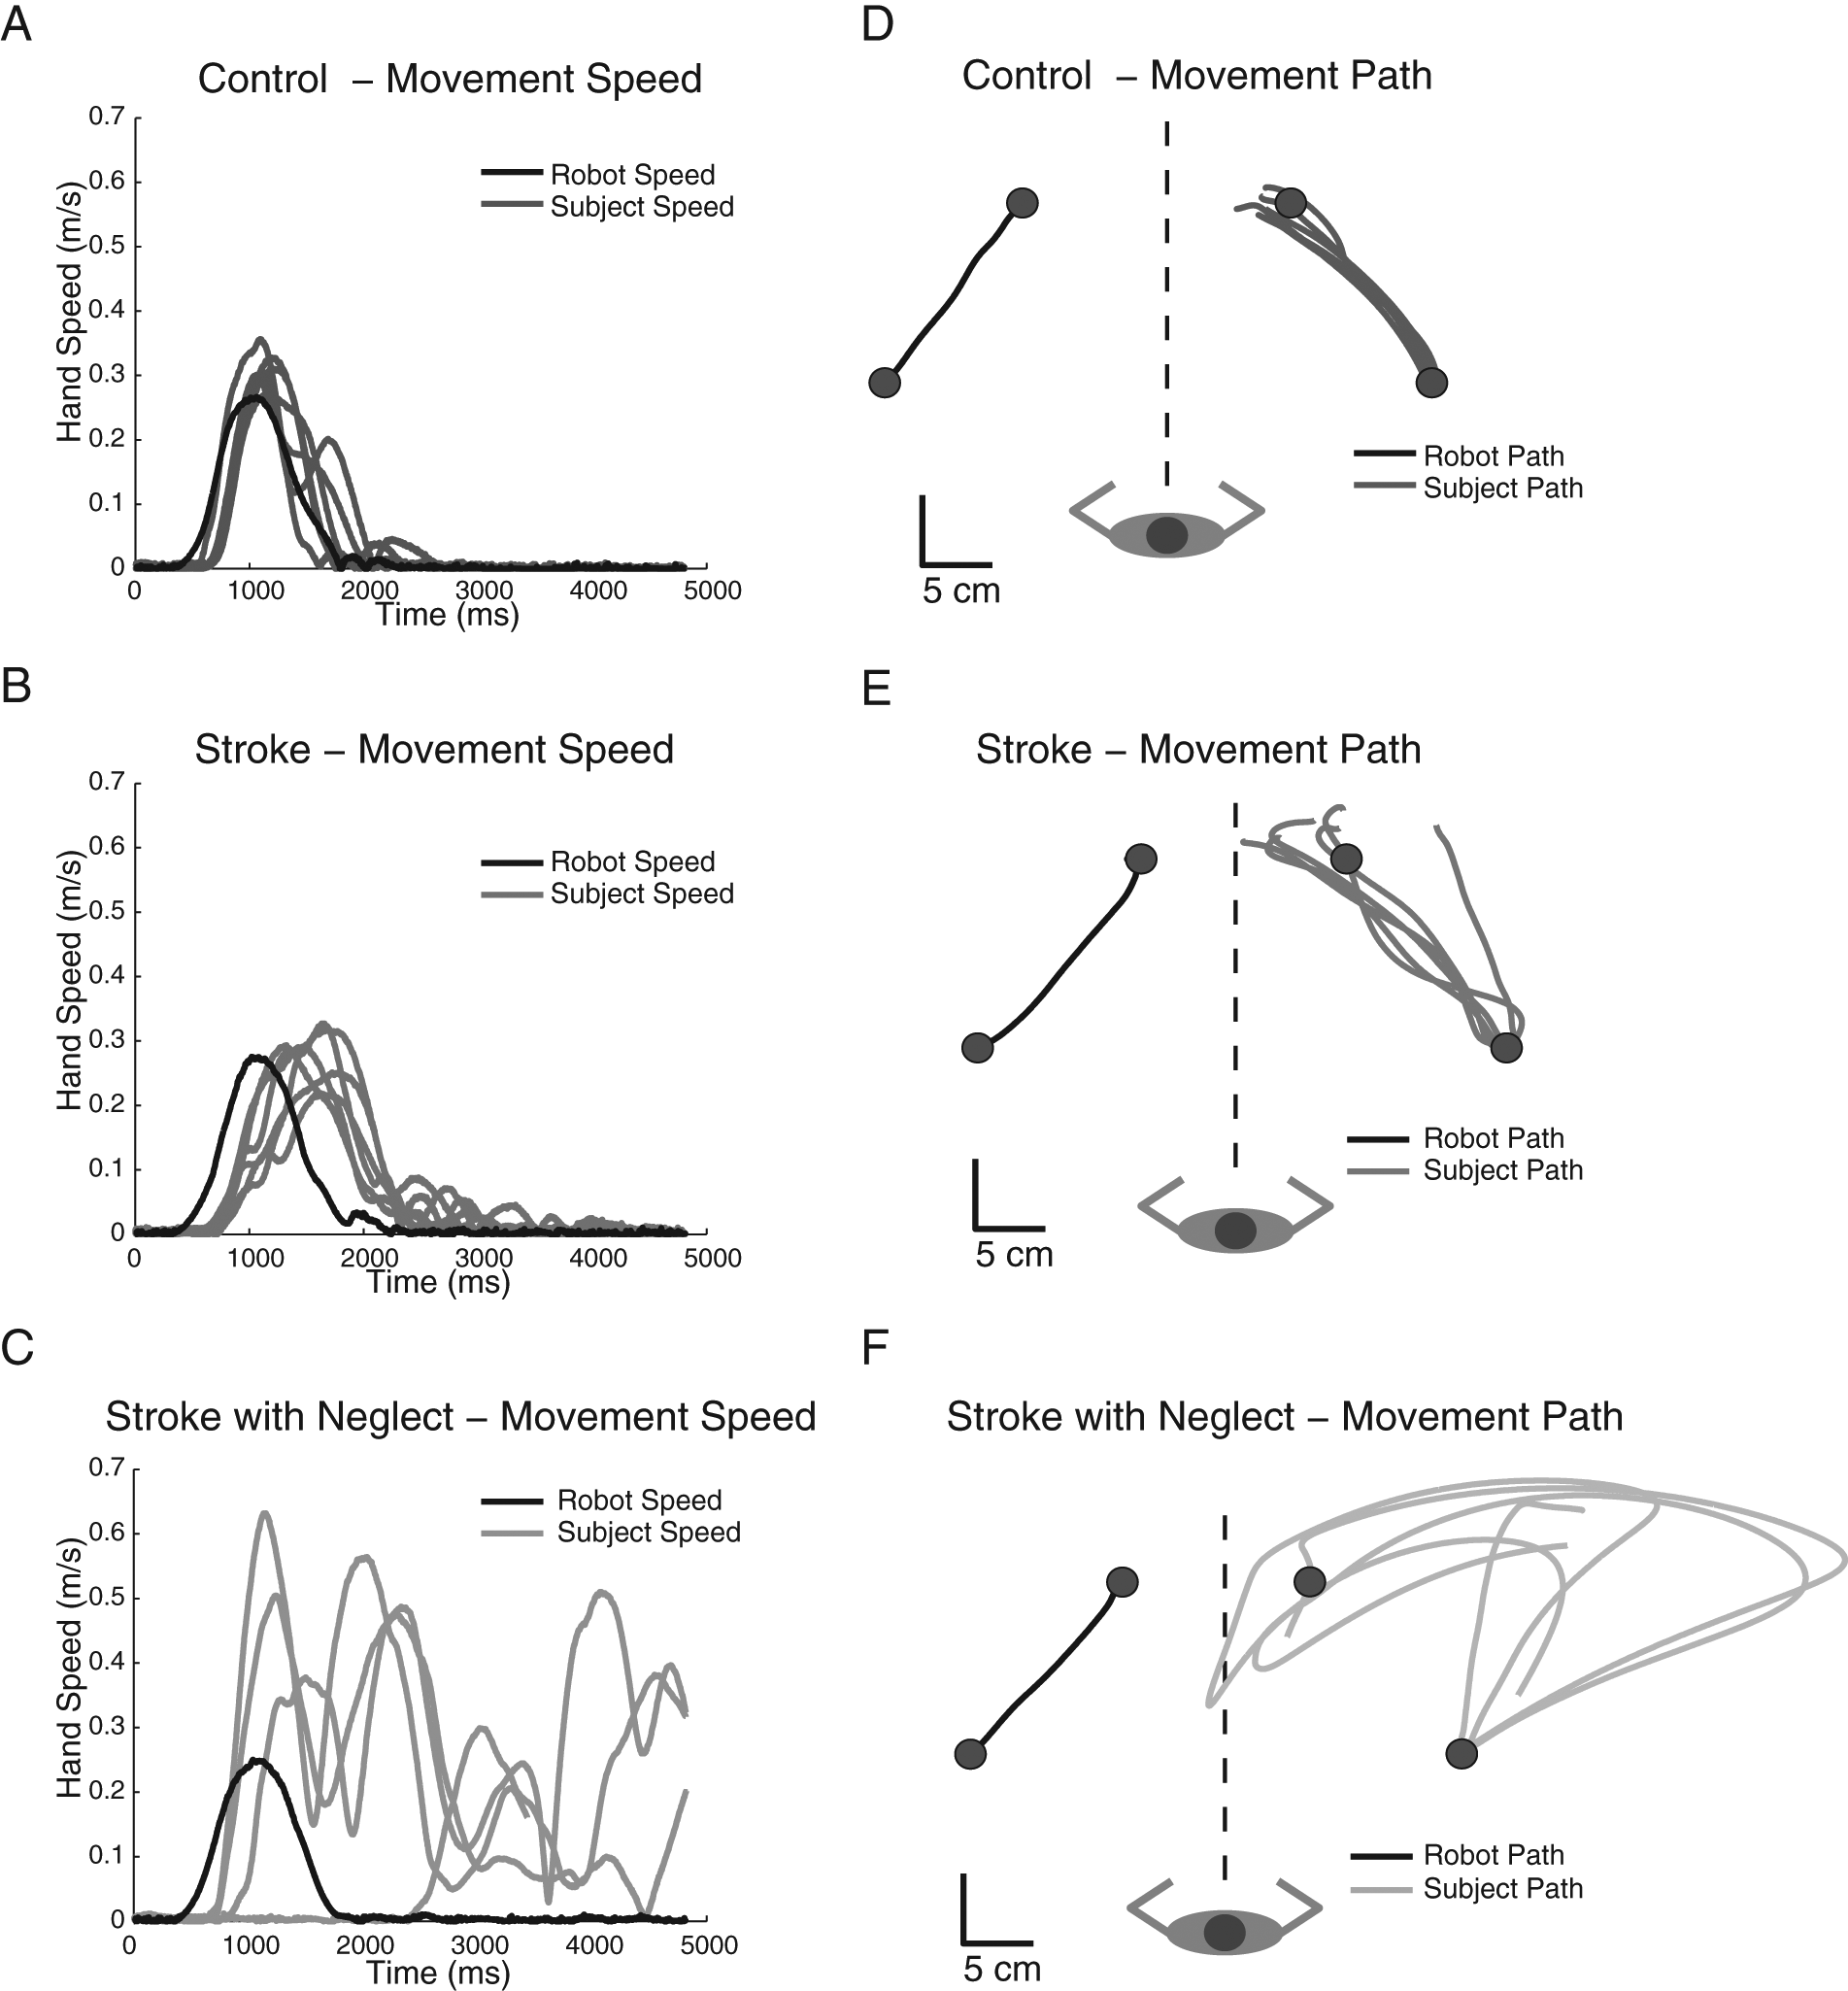
Exemplar hand speed (A-C) and movement paths (D-F) for 6 individual trials of the kinesthetic matching task for a control participant (A and D), a participant with stroke without visuospatial neglect (B and E), and a participant with stroke with visuospatial neglect (C and F).
Group Performance
At the group level, the majority of the S3 group was able to quickly respond to the passive movement of the robot, with only 26% of participants falling outside the control range on RL (Figure 3A). Additionally, participants in the S3 group were consistently able to match the speed of the robot with only 30% of participants falling outside the control range on PSR (Figure 3B). In contrast, 66% of participants in the Neglect group fell outside of the control range for RL (Figure 3A), and 54% of participants fell outside the control range for PSR (Figure 3B). Additionally, a larger percentage of participants in the Neglect group fell outside the control range for variability of RL and variability of speed matching compared with participants in the S3 group (RLv: Neglect = 77%, S3 = 26%; PSRv: Neglect = 60%, S3 = 36%). For RL and PSR, those participants in the S1 and S2 groups performed better than the Neglect group but more poorly than the S3 group (S1: RL = 22%, PSR = 44%; S2: RL = 50%, PSR = 36%). This pattern of performance for the S1 and S2 groups was also maintained for temporal variability measures (S1: RLv = 44%, PSRv = 44%; S2: RLv = 56%, PSRv = 42%).
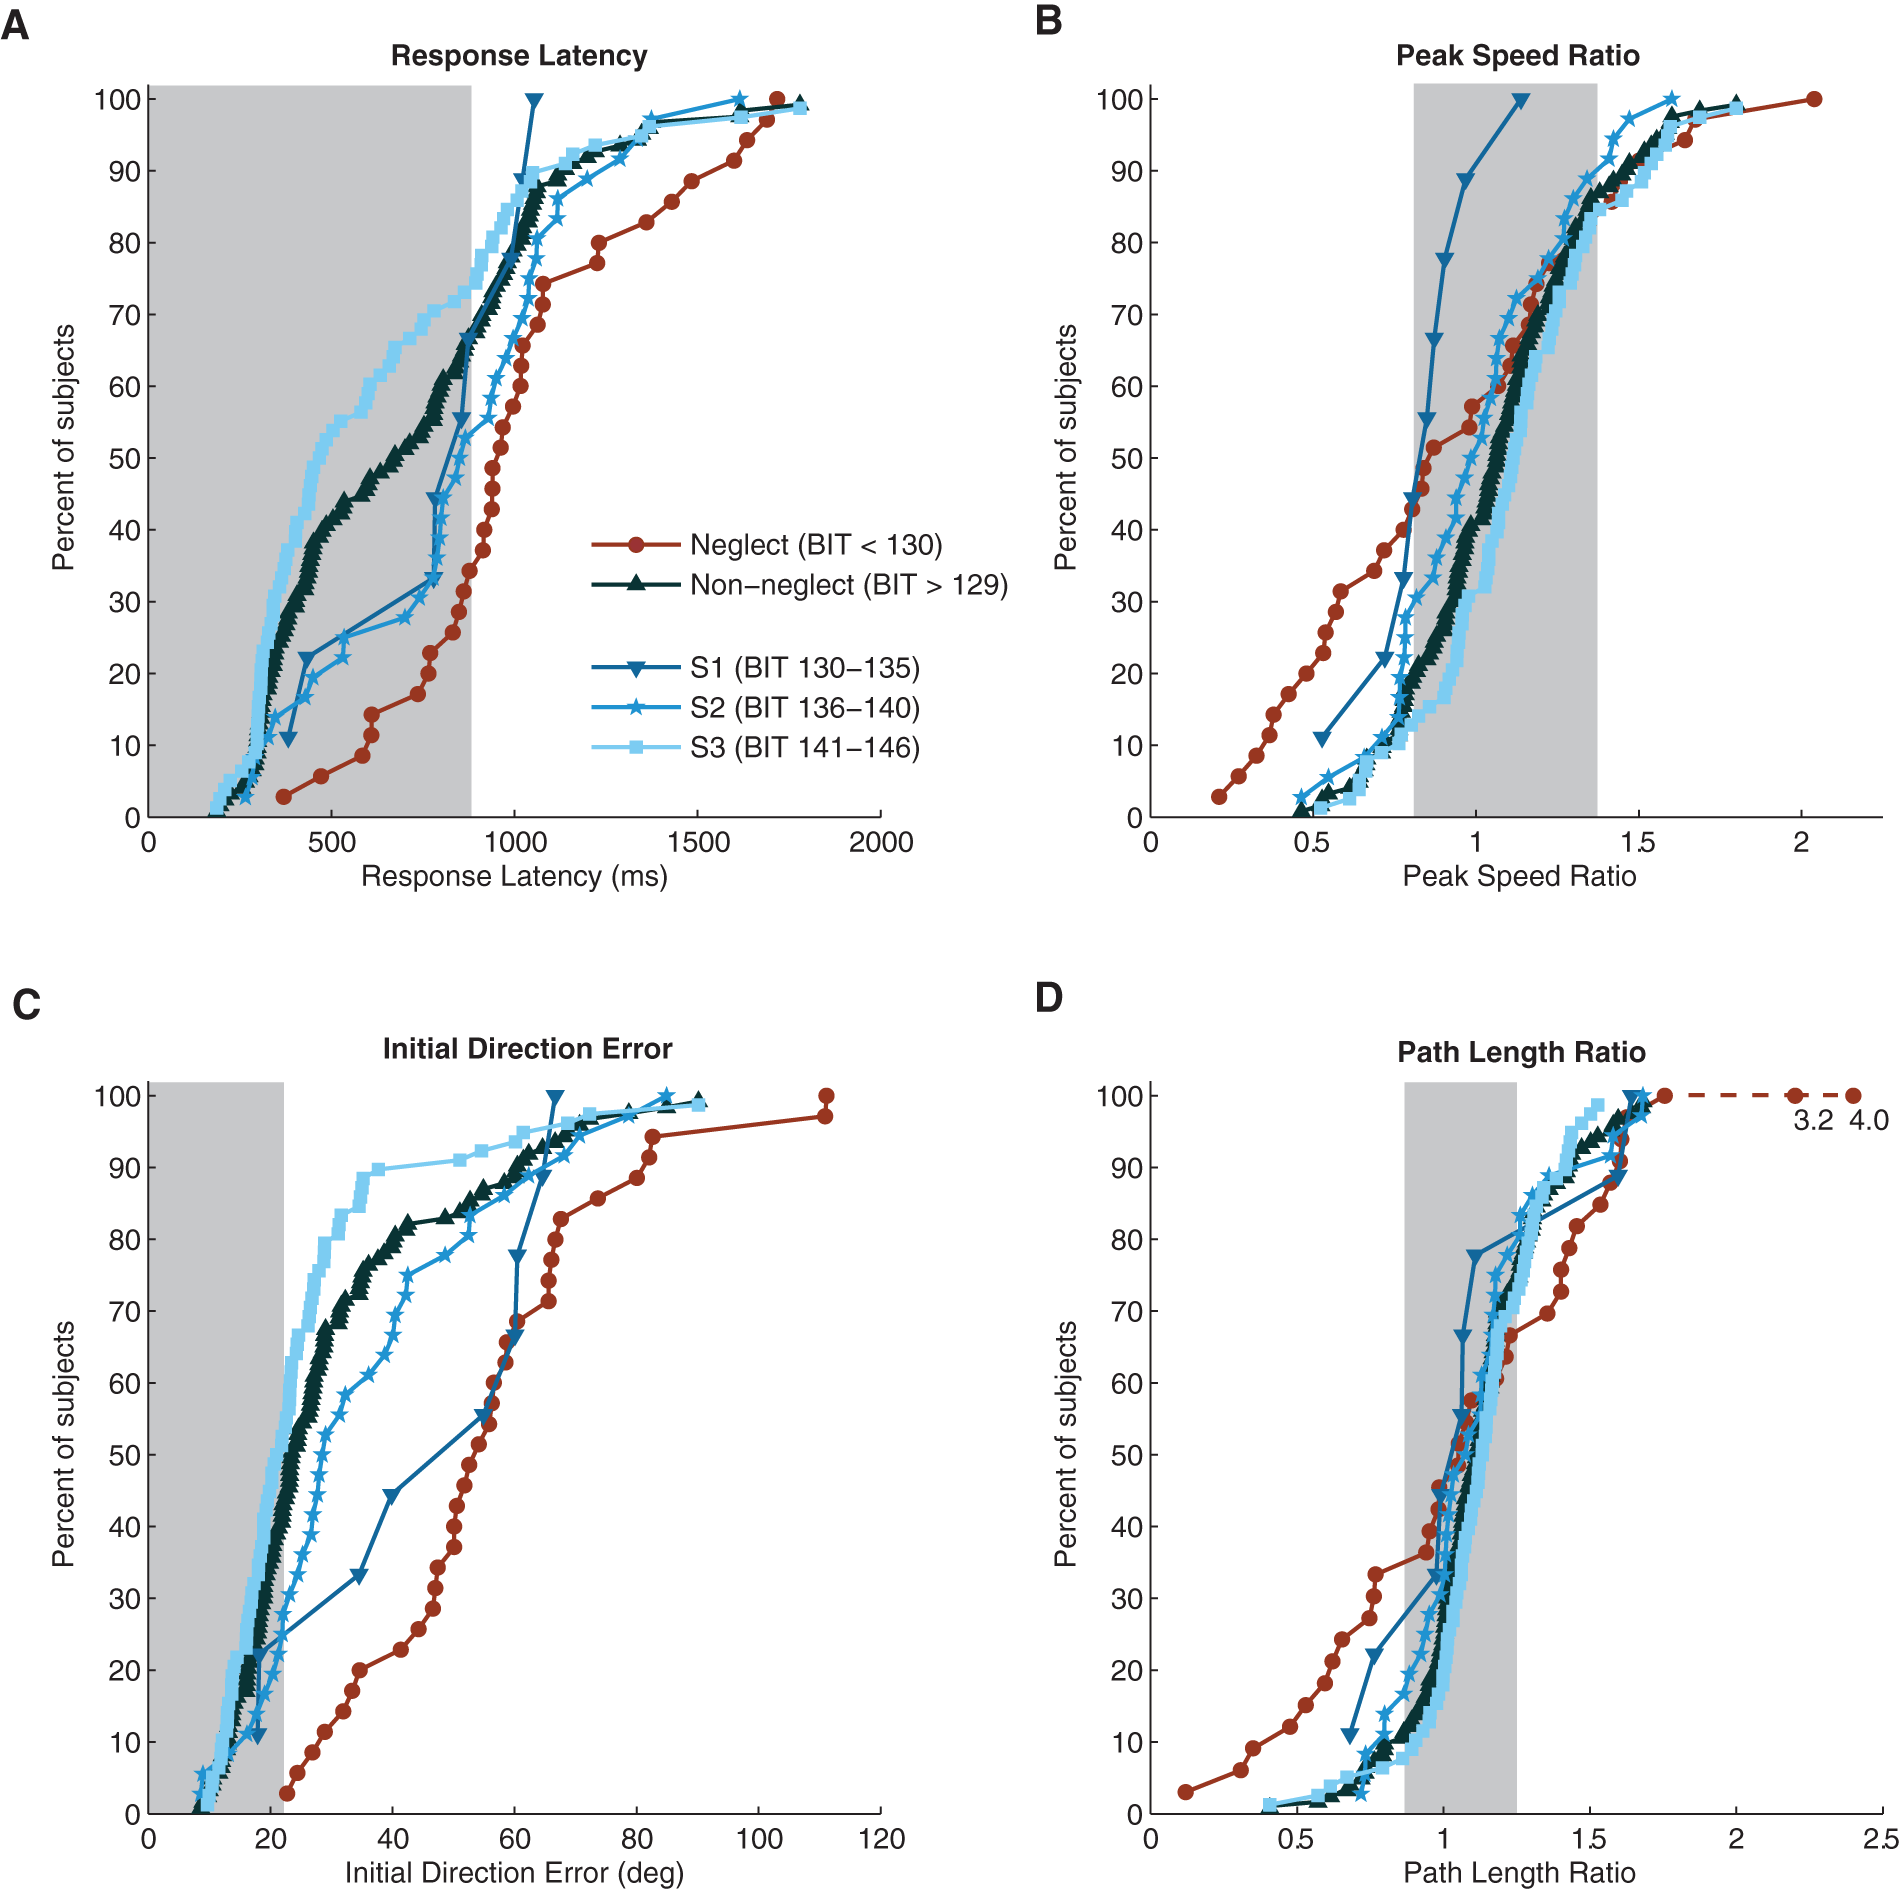
Cumulative sum histograms displaying control range (grey box indicates 95% CI in all panels, RL < 882 ms, PSR = 0.81-1.38, IDE < 22.2 deg, PLR = 0.87-1.25) and group behavior for subjects with stroke for RL (A), PSR (B), IDE (C) and PLR (D). Values lying outside of the 95% control range indicate p < 0.05. Subjects with visuospatial neglect (BIT < 130 (Neglect)) are shown in red. Subjects without visuospatial neglect are shown in blue (BIT > 129, S1, S2, S3).
Spatial Parameters (IDE and PSR)
Exemplar Performance
Hand path data for exemplar participants is displayed in Figure 2 (D-F). Compared with the exemplar control (Figure 2D), the exemplar stroke participant without neglect (Group S3, BIT = 141, Figure 2E) displayed a similar magnitude of directional error and slight overshoot of the target (S3 participant: IDE = 17.0°, PLR = 1.28). Additionally, the S3 participant demonstrated low variability matching both the direction and magnitude of movement (S3: IDEv = 21.3°, PLRv = 0.30). In contrast, an exemplar participant with visuospatial neglect displayed large directional errors (group Neglect, BIT = 61 [Figure 2F] IDE = 60.5°) and exceptional difficulty in matching robot movement path length (Neglect, PLR = 4.02). Not only did the Neglect participant makes large errors of movement direction and magnitude, but they were also highly variable (Neglect, IDEv = 51.6°, PLRv = 2.90).
Group Performance
At the group level, the majority of participants in the S3 group were able to accurately match direction and length of the robot movement, with 50% of S3 participants falling outside the control range for IDE (Figure 3C) and 36% of S3 participants falling outside the control range for PLR (Figure 3D). In contrast, participants with neglect (Neglect) performed poorly, made large directional errors, and were unable to match the length of the robot, with 100% (n = 35) of participants failing IDE and 69% failing PLR. Additionally, for measures of IDE and PLR, a larger percentage of participants in the Neglect group showed greater variability compared with participants in the S3 group (Neglect: IDEv = 94%, PLRv = 86%; S3: IDEv = 30%, PLRv = 32%). For IDE and PSR, those participants in the S1 (BIT = 130-135) and S2 (BIT = 136-140) groups performed better than the Neglect group but more poorly than the S3 group (S1: IDE = 78%, PLR = 56%; S2: IDE = 67%, PLR = 39%). This pattern of performance for the S1 and S2 groups was also maintained for spatial variability measures (S1: IDEv = 67%, PLRv = 67%; S2: IDEv = 53%, PLRv = 69%).
Relationship Between Kinesthesia, BIT, and Clinical Scores
We found that the Neglect group was significantly different from the S3 group on all clinical measures and the S2 group on the majority of clinical measures (Table S1). Overall, we observed high correlations for clinical scores with most kinesthetic parameters (Table 3). For overall group behavior, the FIM, BIT, and TLT were highly correlated to nearly all kinesthetic measures, with IDE and IDE variability showing the highest correlations (IDE, −0.546; IDEv, −0.535; P < .0056). Additionally, across the 4 participant groups, we observed the lowest FIM scores and the highest TLT scores for participants in the Neglect group and the highest FIM scores and the lowest TLT scores for participants without neglect (Table S1). For kinesthetic measures, we observed the highest rate of parameter failure in participants with neglect and the lowest rates of parameter failure in participants in the S3 group (Table S2).
Relationship Between Clinical Scores and Kinesthesia. a
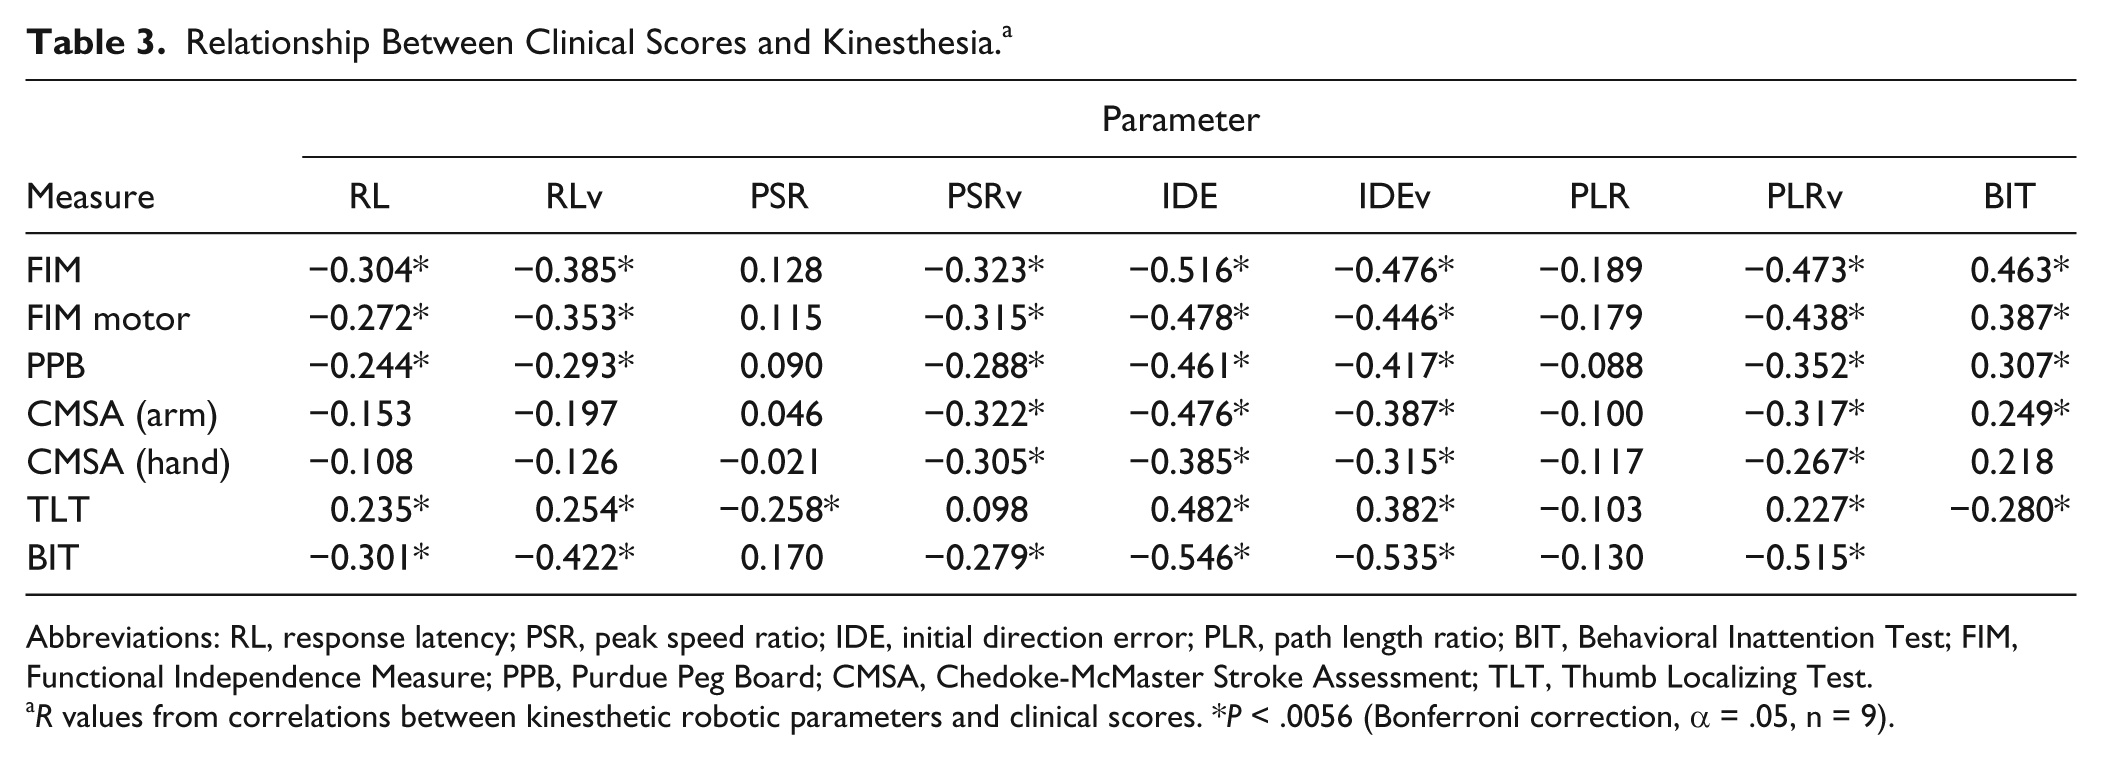
Abbreviations: RL, response latency; PSR, peak speed ratio; IDE, initial direction error; PLR, path length ratio; BIT, Behavioral Inattention Test; FIM, Functional Independence Measure; PPB, Purdue Peg Board; CMSA, Chedoke-McMaster Stroke Assessment; TLT, Thumb Localizing Test.
R values from correlations between kinesthetic robotic parameters and clinical scores. *P < .0056 (Bonferroni correction, α = .05, n = 9).
Discussion
We found the presence of visuospatial neglect highly indicative of impaired kinesthesia as measured in the robotic assessment. In this study, 35 participants had visuospatial neglect as measured by the BIT, and all these participants had significantly impaired kinesthesia. In general, participants with lower BIT scores had a higher probability of failing the kinesthesia task compared with those participants with higher BIT scores. Specifically, for those who failed the BIT (Neglect group), 100% of participants failed the kinesthesia task, but for those participants with BIT scores of 141 to 146 (S3), only 45% failed. This is supported by data presented in Table 3, which presents high correlations between participant performance on the BIT and our kinesthetic measures. These results indicate that kinesthetic impairments and visuospatial neglect commonly co-occur. However, our results also indicate that it is possible for patients to present with kinesthetic impairments in the absence of visuospatial neglect, as previously reported. 13
Relationship Between Kinesthesia and Visuospatial Neglect
Few studies have examined the relationship between proprioceptive deficits after stroke and visuospatial neglect. Of those studies, impairments in position sense have been reported to be worse in participants with visuospatial neglect.18-20 Additionally, this particular combination of deficits after stroke has been suggested to lead to longer recovery times and poorer functional outcome. 40
Previously, we have found that kinesthesia is impaired in approximately 60% of participants without visuospatial neglect after stroke. 13 In this study, we found that kinesthesia was severely impaired in all participants with visuospatial neglect and impaired in far fewer participants who scored well on the BIT. This is evidenced by the fact that for those participants with scores close to the BIT cutoff of 130 (groups S1 and S2), we see a larger percentage of kinesthetic impairments (78% and 81% impaired, respectively) when compared with those participants who scored higher.
The present study highlights a complex interaction between visuospatial neglect and kinesthesia, where we observe an increasing incidence of kinesthetic impairment that increases as participants perform worse on the BIT (Supplementary Tables 1 and 2; Figure 3). The highly coincidental deficits we see in participants with visuospatial neglect suggest that spatial aspects of both vision and proprioception are damaged, suggesting a shared/common underlying neuroanatomy. A direction for future research would be to examine this relationship using neuroimaging techniques to accurately define the areas affected.
Classically, visuospatial neglect has been described as a lack of awareness of visual stimuli in the contralesional space, whereas sensory neglect has been described as a lack of awareness of somatosensory stimuli (touch, pain, and sensation) on the contralesional side of the body. 41 Clinically, visuospatial and sensory neglect can be difficult to disentangle, and the mischaracterization of sensory neglect is common. 42 Current theories suggest that neglect may be modality specific, with different sensory modalities demonstrating dissociable effects of neglect.43,44 Our results challenge these theories and demonstrate that visuospatial and kinesthetic deficits are highly coincidental, pointing to the idea that neglect may be a multisensory disorder. 7
It is likely that there is a common area of damage responsible for visuospatial and sensory neglect. Recent neurophysiological work has suggested a common site for processing aspects of both sensory modalities in the posterior parietal cortex (PPC). 22 The PPC is thought to be essential for sensorimotor integration and remapping, and damage to the PPC has been thought to be central to the behavioral effects seen in visuospatial neglect. 21 Additionally, symptoms of visuospatial neglect have been mimicked through the use of TMS in the PPC. 45 The integration of proprioceptive processing for goal-directed reaching behavior has also been found in the PPC. 46 Because of the multimodal nature of the PPC and its involvement in the integration of visual and proprioceptive signals, 22 it is not surprising that we see visuospatial and kinesthetic processing conjointly impaired. Given the preponderance of participants with right parietal lesions in our Neglect stroke participant group (54%), this also raises the possibility of right-hemispheric dominance for the perception of information about proprioceptive space, consistent with a prior imaging study in healthy individuals. 47
Another potential area where lesions might result in both visuospatial neglect and kinesthetic impairment is within the frontal lobe. Lesions of the frontal lobes have also been implicated in visuospatial neglect, leading to directional hypokinesia of reaching movements 48 or slowed motor responses to the contralesional space. Directional hypokinesia may occur with both the contralesional and ipsilesional limb. 49 However, the task in the present study requires the active use of the ipsilesional limb engaged in ipsilesional space, where to the best of our knowledge, hypokinetic deficits do not occur. It is clear that further studies using neuroimaging are needed to better understand the relationship between the processing of spatial information in vision and proprioception in individuals with visuospatial neglect following stroke.
Implications for Treatment
In stroke rehabilitation, there are a number of clinical techniques that can be used to treat visuospatial neglect. Most of these techniques focus on restoring the visuospatial aspects affected by neglect and use approaches such as visual scanning, 23 half-glasses, 50 and prism glasses. 24 Whereas these techniques have reasonable evidence for their success as therapeutic methodology for correcting visuospatial issues after stroke, their impact on somatosensory deficits is largely unknown. However, a few researchers have examined potential treatments to improve sensory neglect. It has been shown that optokinetic stimulation and galvanic vestibular stimulation can reduce the inattentive symptoms of neglect in terms of position sense.18,20 Proprioceptive-based transcutaneous electrical stimulation has been shown to be sufficient to reduce the severity of neglect, even under severe somatosensory loss. 51 The authors of this study suggested that generation of continual kinesthetic feedback through proprioception stimulation mechanisms may also potentially reduce symptoms of neglect. It is interesting to note that galvanic vestibular stimulation has been shown to be effective in both visuospatial 52 and sensory neglect. 20 This type of treatment may potentially provide the best combined outcome for visuospatial and proprioceptive deficits after stroke.
The results of the present study raise 2 important issues with regard to treatments of visuospatial neglect. First, future treatments and studies should consider adding some measure of proprioceptive function to better determine the impact of both the visuospatial system and the proprioceptive system. Second, well-controlled, larger-scale clinical trials are needed to evaluate the impact of treatments such as optokinetic stimulation, galvanic stimulation, and transcutaneous electrical stimulation on the somatosensory aspects of neglect. These novel approaches to somatosensory treatment represent potential treatment approaches that are not routinely used in clinical practice and may help better optimize poststroke recovery.
Summary
We found that the presence of visuospatial neglect was highly associated with kinesthetic impairment following stroke. Furthermore, kinesthetic deficits were not necessarily associated with visuospatial neglect. This study serves to quantify a common clinical experience that poststroke, patients with visuospatial neglect often have concomitant somatosensory deficits. Finally, the study highlights the need for further studies and opportunities in the treatment of propriospatial deficits in individuals with hemispatial neglect following stroke.
Footnotes
Acknowledgements
We acknowledge the assistance of Janice Yajure, Megan Metzler, Helen Bretzke, Kim Moore, and Justin Peterson.
Authors’ Note
JAS and JCW contributed equally to this work.
Declaration of Conflicting Interests
The authors declared the following potential conflicts of interest with respect to the research, authorship, and/or publication of this article: Stephen H. Scott is the inventor of the KINARM robot and chief-scientific officer of BKIN technologies, the company that manufactures the device.
Funding
The authors disclosed receipt of the following financial support for the research, authorship, and/or publication of this article: JCW was supported by a Canadian Stroke Network Summer Studentship. This research was supported by a CIHR operating grant (MOP 106662), a Heart and Stroke of Alberta, Nunavut and Northwest Territories Grant-in-aid, and an Ontario Fund Research grant (ORF-RE 04-47).
References
Supplementary Material
Please find the following supplemental material available below.
For Open Access articles published under a Creative Commons License, all supplemental material carries the same license as the article it is associated with.
For non-Open Access articles published, all supplemental material carries a non-exclusive license, and permission requests for re-use of supplemental material or any part of supplemental material shall be sent directly to the copyright owner as specified in the copyright notice associated with the article.