
Abstract
Background. Intrathecal baclofen (ITB) bolus injection effectively decreases spinal excitability but the impact on lower limb muscle activation during gait has not been thoroughly investigated. Objective. Examine activation of medial gastrocnemius (MG) and tibialis anterior (TA) muscles during gait before and after ITB bolus injection in patients with resting hypertonia after acquired brain injury. Methods. Lower extremity Ashworth score, temporospatial gait parameters, characteristics of the linear relationship between electromyogram (EMG) and lengthening velocity (LV) in MG during stance, and the duration and magnitude of TA-MG coactivation were assessed before and at 2, 4, and 6 hours after a 50-µg ITB injection via lumbar puncture in 8 hemorrhagic stroke and 11 traumatic brain injury subjects. Results. Temporospatial gait parameters did not significantly differ across the evaluation points (P ≥ .170). However, Ashworth score (P < .001), frequency and gain of significant positive EMG-LV slope (P ≤ .020), and duration of TA-MG coactivation (P ≤ .013) significantly decreased in the more-affected leg after ITB bolus. EMG changes were not significantly different between patients who did (n = 10) and did not (n = 9) increase gait speed after the injection. The timing of the largest decrease in Ashworth score and the largest decrease in EMG parameters coincided in 36% of cases, on average. Conclusions. ITB bolus injection alters the activation of MG and TA during gait. However, the changes in muscle activation are not closely related to the changes in gait speed or resting muscle hypertonia. The analysis of ankle muscle activation during gait better characterizes the response to ITB bolus injection than gait kinematics.
Introduction
Intrathecal baclofen (ITB) delivered continuously with an implanted programmable pump-catheter system is an effective treatment for moderate-to-severe hypertonia in patients with an acquired brain injury.1-7 Prior to implantation, potential candidates are screened to assess clinical response to ITB administration. 8 Many studies reported a significant decrease in Ashworth score after ITB bolus injection in patients with hypertonia of spinal and cerebral origin.9-13 As an adjunct to clinical evaluation, neurophysiologic and biomechanical methods have also been used to document response to ITB bolus injection.12-16
Computerized gait analysis allows an objective assessment of changes in gait after ITB bolus administration. Remy-Neris et al 13 reported a significant increase in maximal gait speed in 7 subjects with spastic hemiplegia, but not in the preferred speed or lower extremity joint range of motion. Conversely, Horn et al 10 found a significant increase in the preferred gait speed after ITB bolus injection in 16 of 28 subjects with moderate-to-severe hypertonia due to acquired brain injury. In the same sample, however, ITB bolus injection produced variable changes in joint range of motion during gait, with significant improvements in the ankles only. 17
The effect of ITB bolus injection on pattern of muscle activation during gait has not been investigated despite several available methods. Changes in activation of medial gastrocnemius (MG) muscle during stance phase of gait has been evaluated by the slope of linear regression fitted between the electromyogram (EMG) and lengthening velocity (LV) of the muscle (EMG-LV slope).18,19 A positive EMG-LV slope, which indicates an increase in EMG with increasing LV during stance (irrespective of the goodness of linear fit), has been interpreted as the evidence of hyperactive stretch reflexes in plantar flexors after stroke.19-21 We extended this approach to account for the strength of EMG-LV relationship by calculating the frequency and gain (steepness) of significant positive slope (slope >0 and goodness of fit P ≤ .05). 22 Both parameters were found significantly increased after acquired brain injury compared with healthy controls.
Changes in a coactivation between antagonistic muscles are also of interest because the coactivation is increased in the paretic leg after stroke.23-25 We also found increased duration and magnitude of coactivation between tibialis anterior (TA) and MG muscles on the more-affected compared with the less-affected side during the initial and late double support in 22 patients with moderate-to-severe lower limb hypertonia after acquired brain injury. 26 These observations pose a question whether ITB bolus injection has an effect on muscle activation during gait in patients with moderate-to-severe hypertonia after acquired brain injury.
Since baclofen reduces the release of excitatory neurotransmitters, ITB bolus is expected to decrease excitability in the lumbosacral locomotor network, which may affect muscle activation during gait. Changes during the stance phase are of particular interest considering a demand on muscles to provide stability and propulsion. Thus, the objective of this study was to assess whether ITB bolus injection alters the EMG-LV and coactivation parameters during gait in patients with moderate-to-severe lower limb muscle hypertonia due to an acquired brain injury. We first hypothesized that both frequency and gain of significant positive EMG-LV slope 22 during stance will decrease mainly on the more-affected side between 2 and 6 hours after ITB bolus injection. Our second hypothesis was that the duration and magnitude of TA-MG coactivation20,24,26 during both swing and stance will also decrease between 2 and 6 hours after ITB bolus injection. Since gait speed is a clinically relevant outcome 27 we explored in secondary analyses whether the changes from baseline differed between subjects who did and did not increase gait speed after ITB injection as well as whether the timing of the largest changes in slope and coactivation parameters coincided with the largest changes in Ashworth score.
Methods
Subjects
This case series included 11 subjects after traumatic brain injury (age 28 ± 11 years; 48 ± 40 months post-onset) and 8 subjects with hemorrhagic stroke (6 intracerebral, 2 subarachnoid; age 43 ± 8 years; 50 ± 43 months post-onset). They were recruited from the pool that underwent a clinical screening protocol for possible ITB pump implantation. All subjects had persisting motor impairments and muscle hypertonia despite prior administration of oral antispasticity agents, botulinum toxin chemodenervation injections, or both. Thus, continuous ITB administration was considered a potential treatment option with the goal of improving overall motor function, including gait.
Additional criteria for inclusion in this study were (1) no fixed contracture in the lower limb joints, (2) ability to walk safely and independently for at least 10 m and faster than 10 cm/s with or without assistive devices, and (3) no ankle clonus during gait. Slower walkers were excluded because they often exhibit inconsistent muscle activation and irregular gait patterns. Wearing a short, nonrigid polypropylene ankle-foot orthosis to prevent foot drop during gait was permitted (3 traumatic brain injury, 6 stroke) providing it allowed passive dorsiflexion during stance phase, as verified by measuring the ankle range of motion. Four traumatic brain injury and 6 stroke subjects used a cane (Table 1). Each subject signed the informed consent approved by our institutional review board for human research.
Subject characteristics.
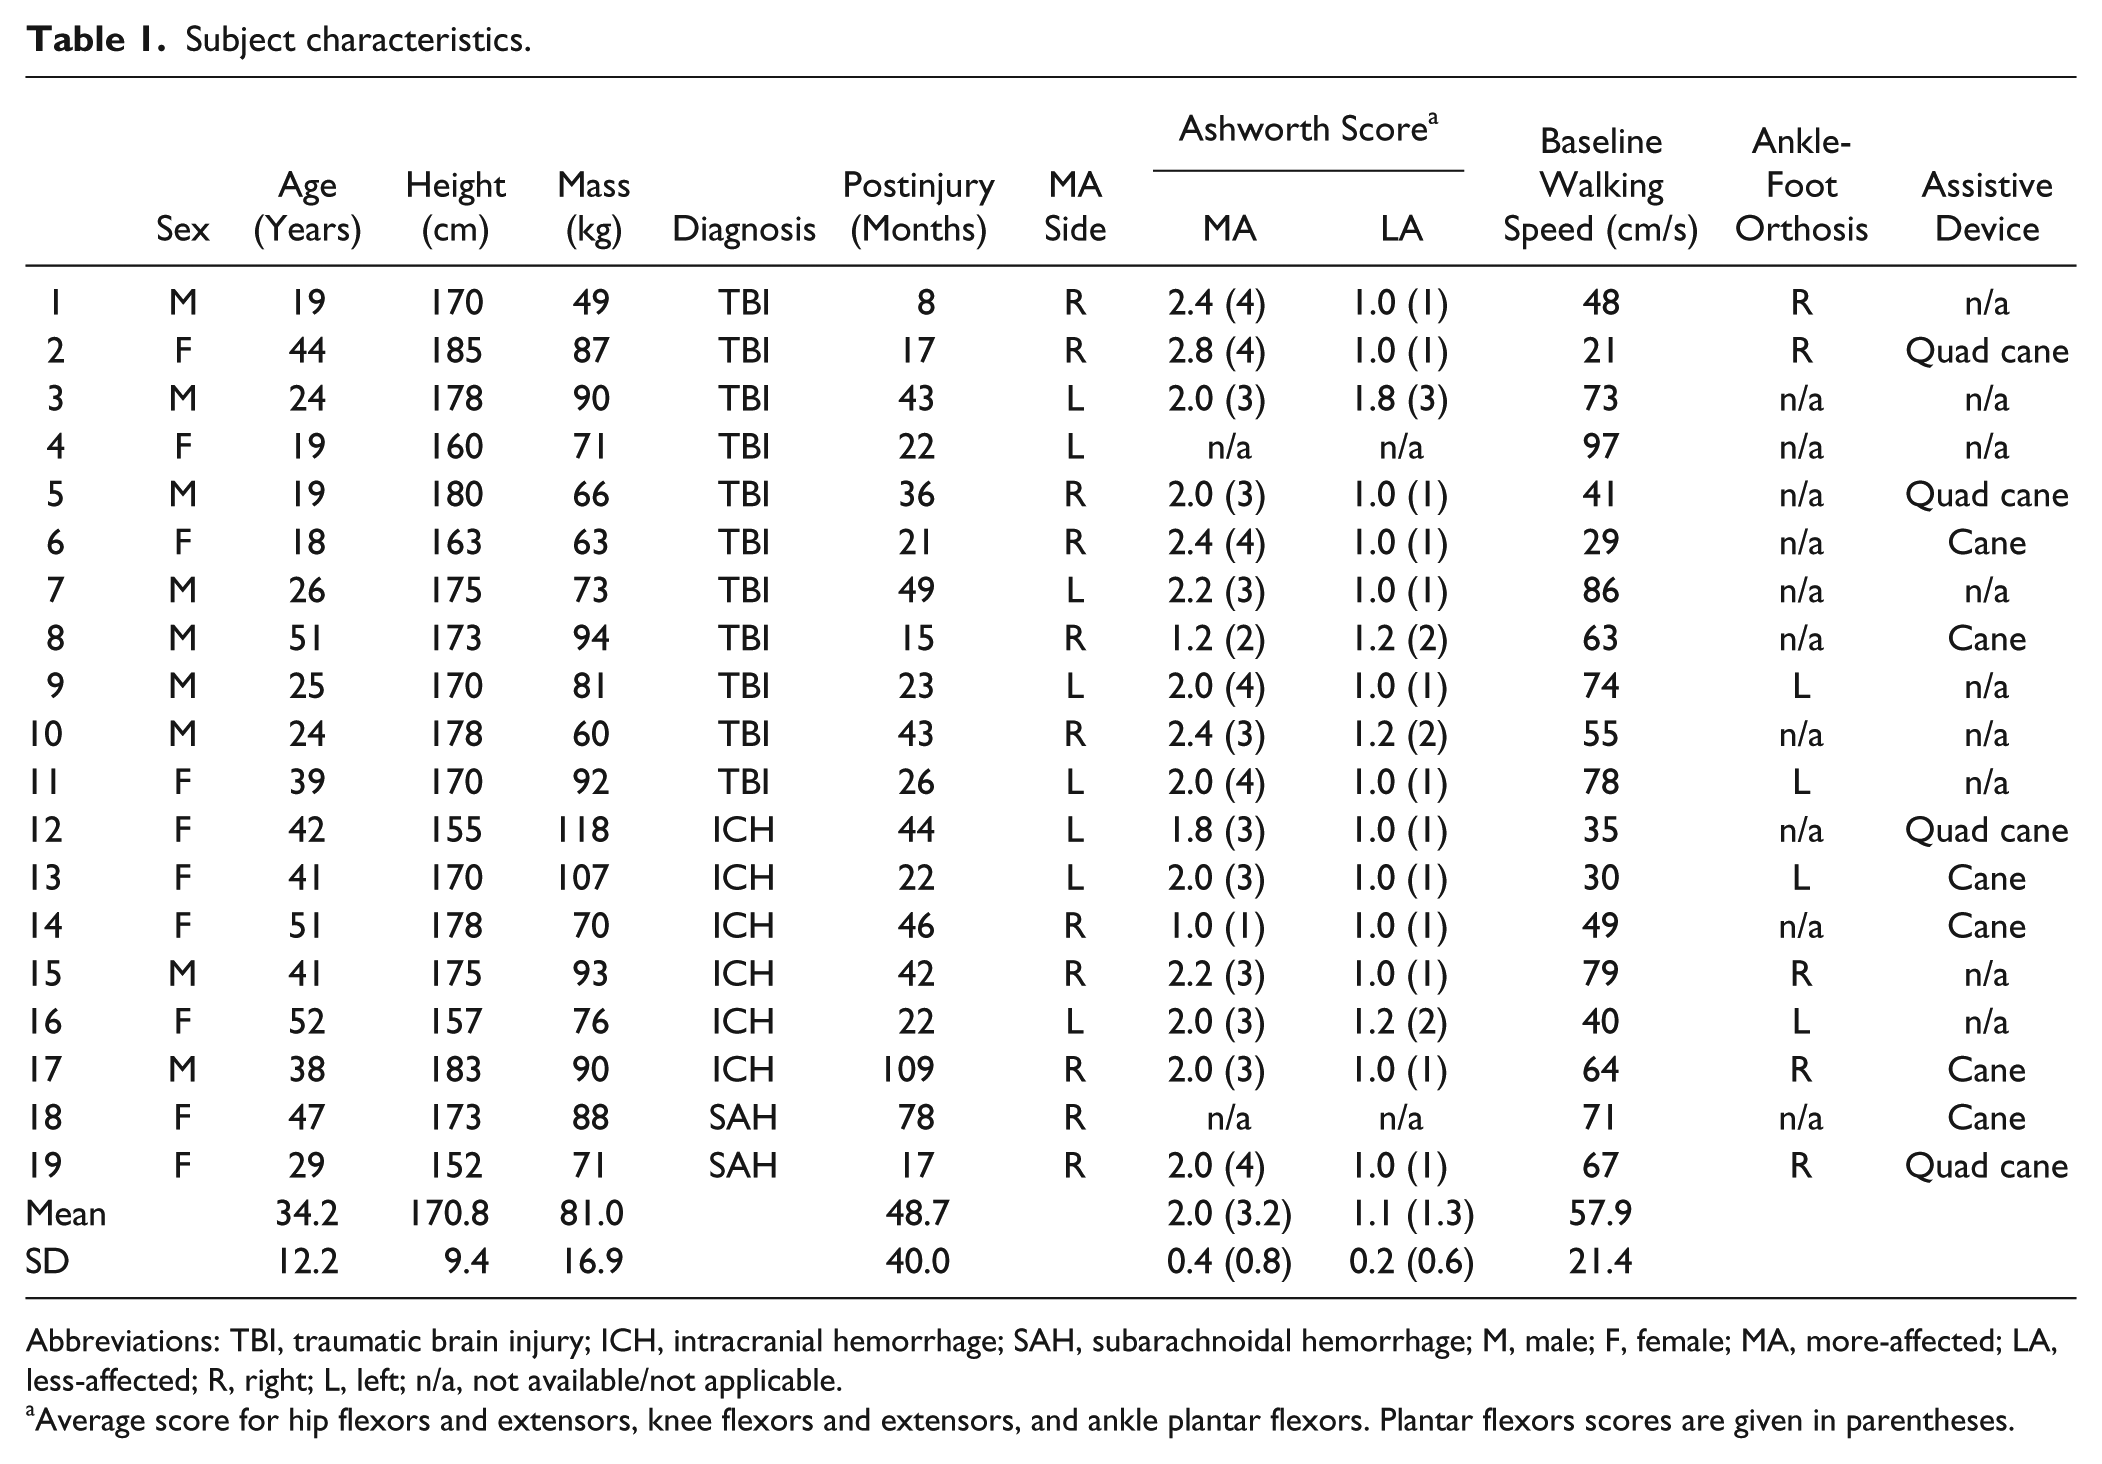
Abbreviations: TBI, traumatic brain injury; ICH, intracranial hemorrhage; SAH, subarachnoidal hemorrhage; M, male; F, female; MA, more-affected; LA, less-affected; R, right; L, left; n/a, not available/not applicable.
Average score for hip flexors and extensors, knee flexors and extensors, and ankle plantar flexors. Plantar flexors scores are given in parentheses.
Experimental Setup and Instrumentation
Gait data were collected using 8 digital cameras operated at 60 Hz (Motion Analysis Corporation, Santa Rosa, CA), 5 force plates sampled at 1200 Hz (Type 4060, Bertec Corp, Columbus, OH), and the Helen Hayes marker system. 28 If necessary, markers were placed on the ankle-foot orthosis aligned with the ankle joint instead of malleoli. Four pairs of surface EMG preamp electrodes (model MA411, gain 20, 2 cm center-to-center distance, input impedance >1010 ohm, common-mode rejection ratio >100 dB, Motion Lab Systems, Inc, Baton Rouge, LA) were attached to MG and TA muscles, bilaterally. 29 EMG signals were further amplified by an EMG system (model MA300, input impedance 31 kΩ, common-mode rejection ratio >50 dB, Motion Lab Systems, Inc) before 12-bit analog-to-digital conversion at 1200 Hz. The gain of EMG electrodes was kept constant across evaluation sessions for each subject.
Experimental Protocol
Patients were evaluated the day before (baseline) and at 2, 4, and 6 hours after a 50-µg ITB bolus injection via lumbar puncture. Muscle hypertonia was assessed with the modified Ashworth scale 30 in hip flexors and extensors, knee flexors and extensors, and ankle plantar flexors, bilaterally. The same physical therapist examined a subject across all evaluation points. Incomplete Ashworth scores in 1 traumatic brain injury and 1 stroke patients were excluded from analysis.
To assess gait, patients walked at a self-selected normal speed 8 to 10 times along a 7-m walkway with preferred footwear and customary assistive devices, if any. The EMG electrodes were kept in place between tests after the injection. Gait data at 6 hours after ITB bolus were not collected in 5 subjects because of fatigue but the Ashworth score was assessed.
Data Reduction
Kinematic data were processed with OrthoTrak Gait Analysis software (Motion Analysis Corp). When available, the software uses ground reaction forces (threshold 30 N) to determine initial foot contact and toe-off events. In the absence of ground reaction force, the software relies on foot marker kinematics. 31 Footfall instants were used to define different phases of a gait cycle demarcated by 2 consecutive initial contacts of the same foot. The derived knee and ankle joint angles were low-pass filtered using a bidirectional Butterworth filter (second order, cutoff frequency 10 Hz). After correcting the baseline shift, raw EMG signals were filtered (recursive digital Matlab Elliptic filter, band pass 10 to 500 Hz, The MathWorks, Inc, Natick, MA), full-wave rectified, and smoothed with a low-pass bidirectional second order Butterworth filter (cutoff frequency 20 Hz). The average Ashworth score was used to identify the more- and less-affected legs. When the difference was less than 0.4 points, the leg with a longer stance time was considered the less-affected. 32
Electromyogram–Lengthening Velocity Slope
Electromyogram–lengthening velocity relationship in MG during stance was determined for each gait cycle using previously described procedures.19,22 Briefly, the muscle-tendon length of MG during gait was computed using the knee and ankle joint angles and expressed relative to the shank length (LS). 33 The lengthening velocity of MG (LV, LS/s) was computed as the first derivatives of MG length. The EMG was normalized to its peak value during stance (%max). For each gait cycle, the EMG and LV were time-normalized to 100% gait cycle (Figure 1, first row). The EMG and LV data points corresponding to the stance phase of each gait cycle were fitted with a linear regression line (Figure 1, second row). Both positive and negative slopes were found in most subjects across multiple gait cycles. The goodness of fit (P value) of each positive EMG-LV slope was determined. Only the significant positive slopes (P ≤ .05) were included in further analysis since they indicate a close coupling between the EMG and LV. 22 The gain (steepness) of each significant positive EMG-LV slope was calculated. The overall frequency and the average gain of significant positive EMG-LV slopes were computed across all gait cycles for each limb of each subject. A gain of zero was assigned to a limb when no significant positive slope was found. Negative slopes were not considered because they do not conform to the original concept put forth by Crenna 18 and have no plausible physiologic explanation in the context of this study.
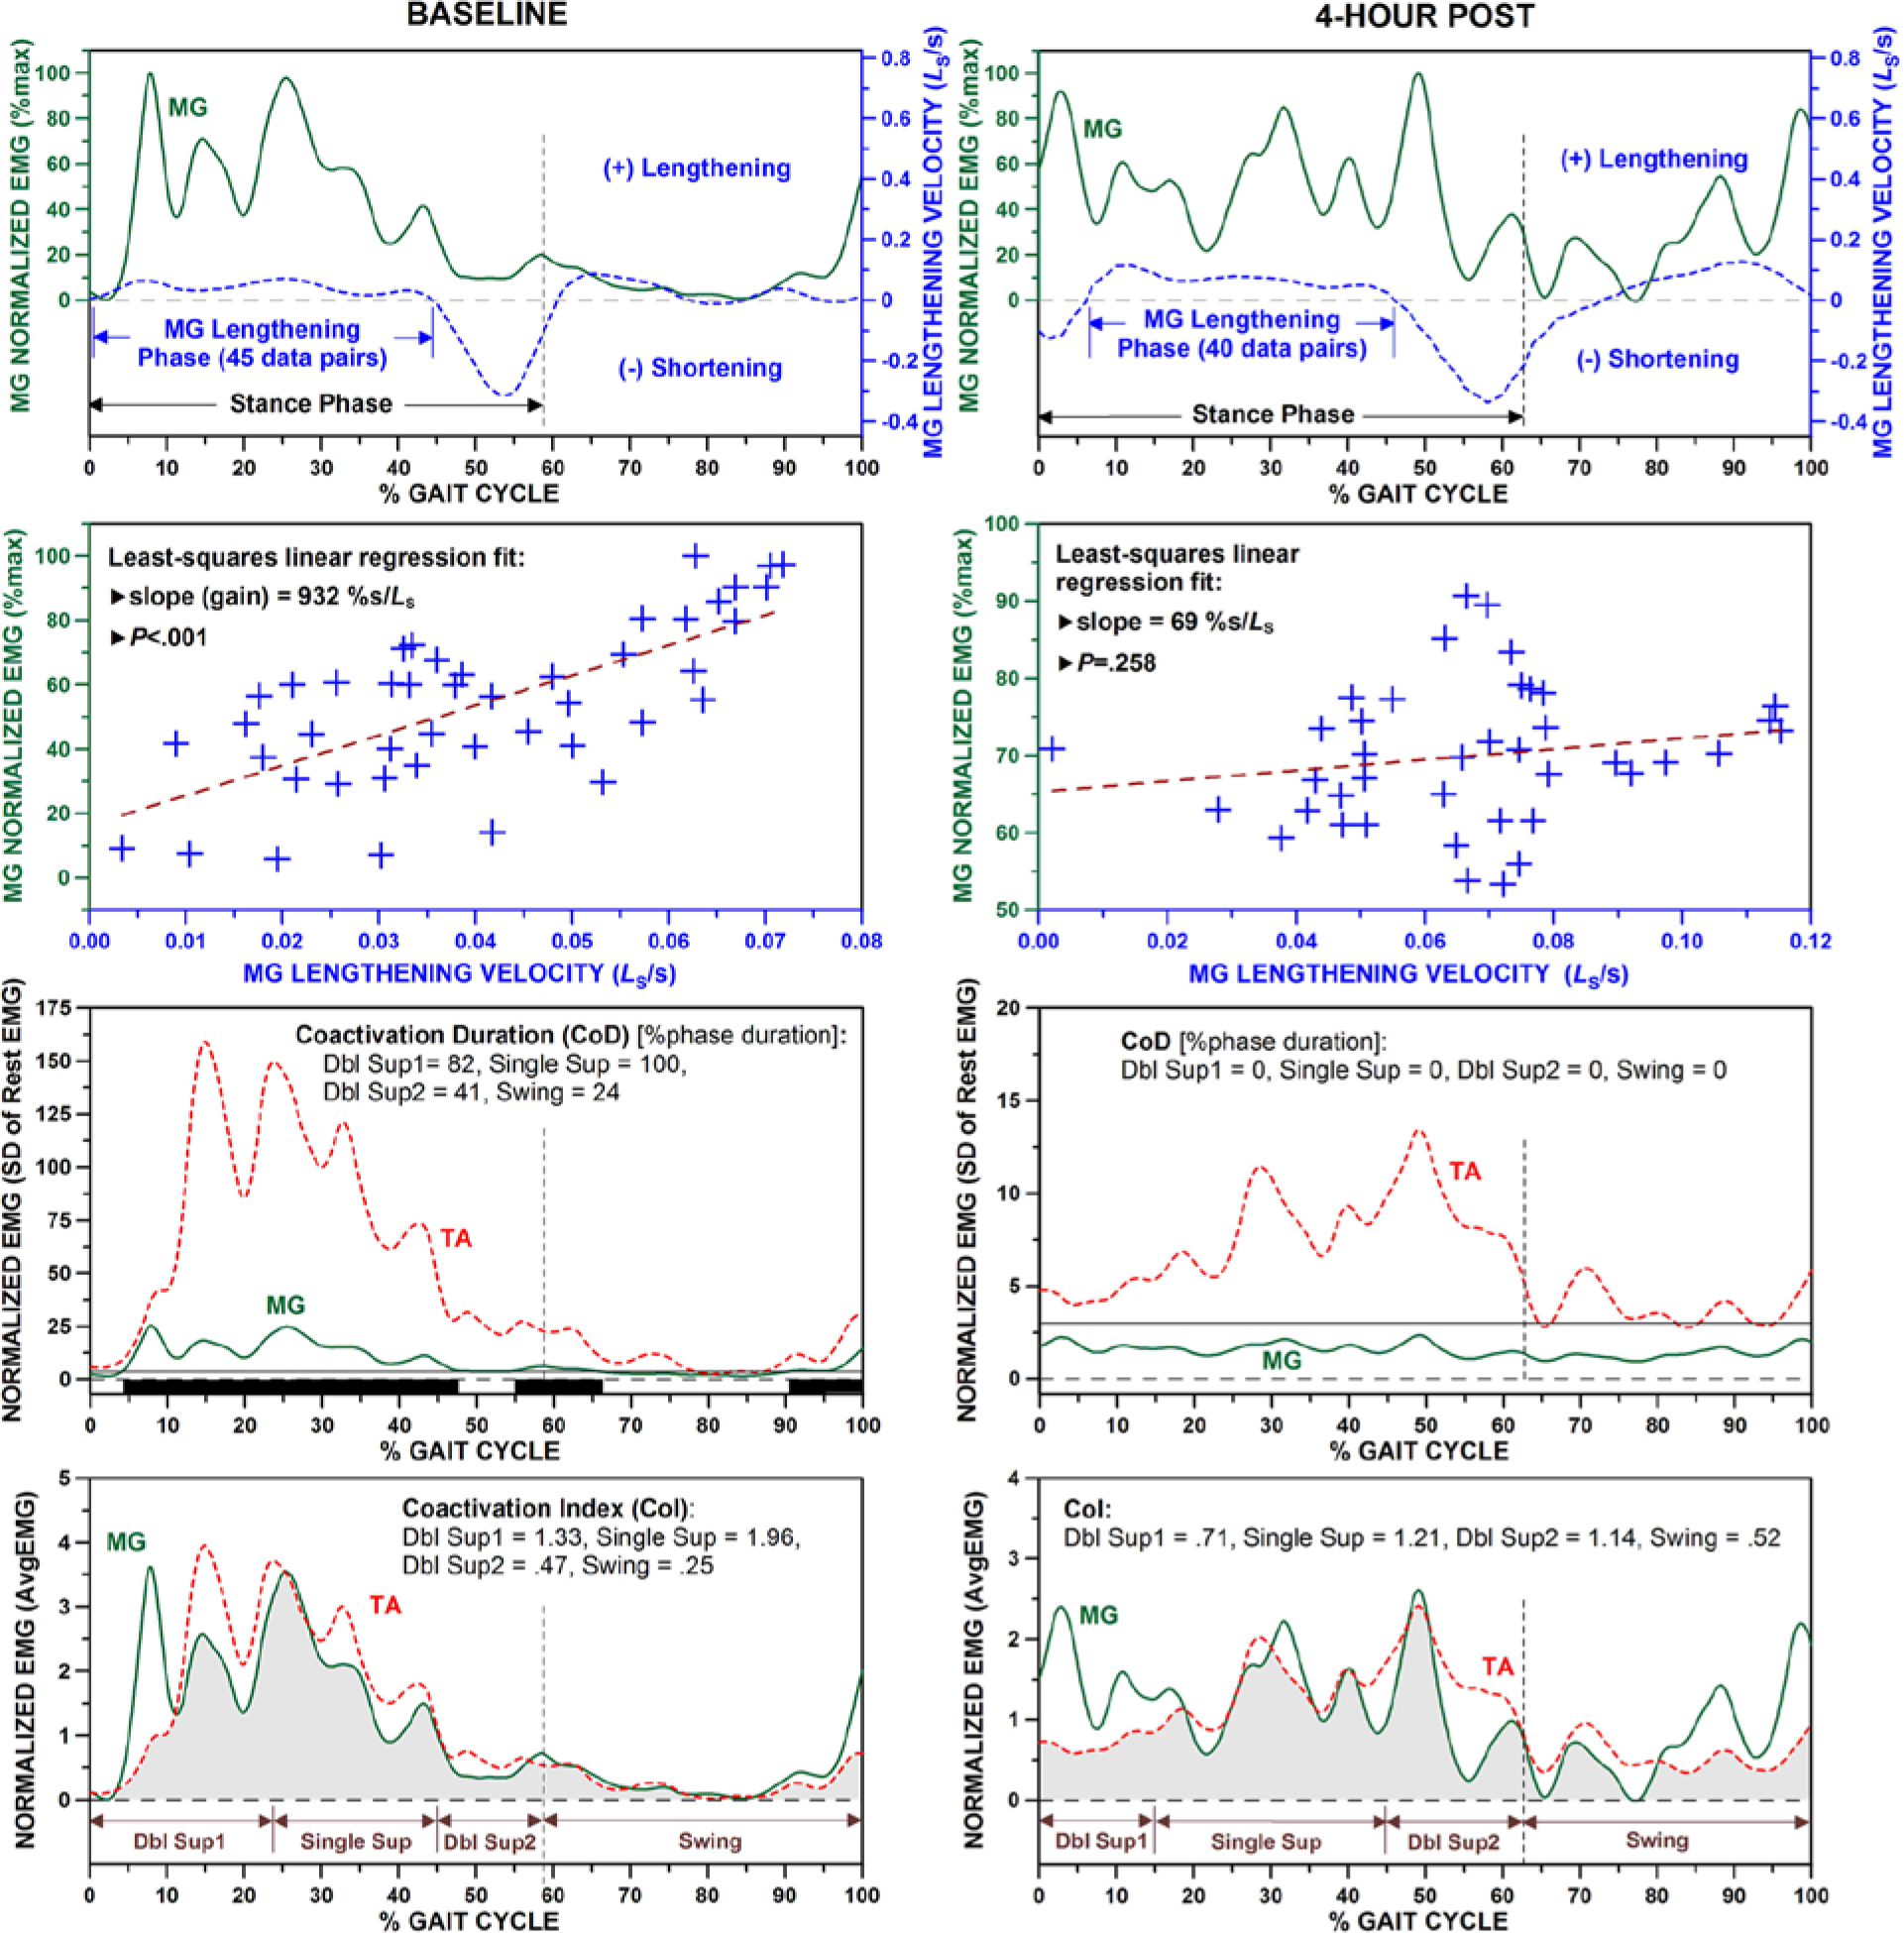
Computation of EMG-LV slope in MG muscle and goodness of fit (top 2 rows), and computation of CoD (third row) and CoI (last row) between TA and MG muscles during a gait cycle before (left) and 4 hours after (right) ITB bolus injection. In the CoD plots, the solid horizontal lines indicate the thresholds (3 times the SD of rest EMG) and the black bars at the bottom depict sections of coactivation (data from the more-affected leg of a traumatic brain injury patient; note non-significant EMG-LV slope, no CoD, and smaller CoI on the right).
Coactivation Parameters
A muscle was considered active during gait when the EMG exceeded 3 standard deviations of the raw resting EMG for a minimum of 50 ms. The duration of coactivation (CoD) between MG and TA was calculated as the time when both MG and TA muscles were active and expressed as a percent of the phase duration (Figure 1, third row).26,34 The magnitude of TA-MG coactivation was quantified using the coactivation index (CoI). The raw EMG was baseline-corrected and rectified. The average resting EMG was calculated and subtracted from the smoothed EMG during each gait cycle for MG and TA, respectively. The EMG of each muscle was then normalized to the average amplitude over the entire gait cycle (AvgEMG). This approach was shown to reduce intersubject variability in gait analysis, which increases the sensitivity of surface EMG as a diagnostic tool. 35 The CoI was calculated by dividing the area of overlap by the duration (Figure 1, last row).26,36-37 CoI and CoD were determined for the initial double support, single support, late double support, and swing of each gait cycle and then averaged across all gait cycles for each subject.
Statistical Analysis
Because the effect of ankle-foot orthosis on lower limb muscle activity after acquired brain injury is inconclusive, 38 we used a series of Mann–Whitney U tests (α = .05) to compare baseline characteristics of subjects who walked with (n = 9) and without (n = 10) an ankle-foot orthosis. In the more-affected leg of those who wore the ankle-foot orthosis, we found a smaller ankle range of motion during swing (P = .013) and lower peak LV during stance (P = .043), but no significant differences between the 2 groups in the ankle range of motion during stance (P = .221) or in any temporospatial (P ≥ .497), EMG-LV (P ≥ .065), and coactivation (P ≥ .278) parameters. Also, there were no significant differences in the overall gait performance and EMG parameters between these 2 groups.
Apart from age (P = .009), the stroke and traumatic brain injury groups were not different in height, body mass, time post-onset, and baseline Ashworth score (Mann-Whitney U test, P ≥ .109). Likewise, none of the temporospatial, ankle range of motion, peak LV, and EMG parameters of both limbs differed between stroke and traumatic brain injury subjects at baseline (P ≥ .129). Thus, all patients were pooled for the main analysis.
The last observation carried forward method39,40 was used to fill in the EMG-LV and coactivation data missing in 5 subjects for the 6h evaluation point (ie, the respective 4-hour data point was carried forward). This approach was deemed appropriate given that we previously found no difference in temporospatial and kinematic parameters between 4 and 6 hours after the bolus injection in largely the same sample.10,17 Also, the main findings were not substantially different when only a subset with no missing values (n = 14) was analyzed.
Each outcome measure was submitted to a 1-way repeated-measures analysis of variance (with Greenhouse-Geisser correction) to test for significant differences across evaluation points (α = .05). When the main effect was significant, 3 planned paired t tests were performed to determine which postinjection evaluation points were significantly different from the baseline. To account for multiple paired comparisons, the significance was set at α = .05/3 = .0167.
To assess whether changes in muscle activation differed across the speed outcomes after ITB bolus injection, an analysis of variance was first performed for each subject to test for the main effect of time on gait speed (at baseline and at 2, 4, and 6 hours post). This was done to classify patients into 3 groups that reflect clinically relevant gait outcomes (speed increase, decrease, and no change). 10 When the main effect was significant (P ≤ .05), the direction of the greatest difference from baseline was identified (positive or negative) and the patient was assigned to the speed increase or decrease group. If the main effect was not significant (P > .05), the patient was placed in the no change group. The timing of peak change in speed was noted for each subject and the difference between that time point and baseline was computed for each EMG parameter on the more-affected side. Mann-Whitney U test was used to test if the changes post-ITB were significantly different (α = .05) between the group that increased the speed (n = 10) and the group that did not increase the speed (no change or decrease, n = 9). Finally, the agreement between the timing of the largest change in each EMG parameter and the timing of the largest change in the average Ashworth score was determined across the group.
Results
Gait speed (P = .170), stride length (P = .316), and cadence (P = .437) did not significantly differ across the evaluation points. The ankle range of motion during stance was significantly different across the evaluation points in the more-affected leg only (P = .027) with a significant increase from baseline to 6 hours post (P = .009). The ankle range of motion during swing (P ≥ .134) and stance duration (P ≥ .671) were not significantly different between the more- and less-affected legs (Table 2).
Gait Characteristics and Ashworth Score (AS) Pre- and Post-ITB Injection. a
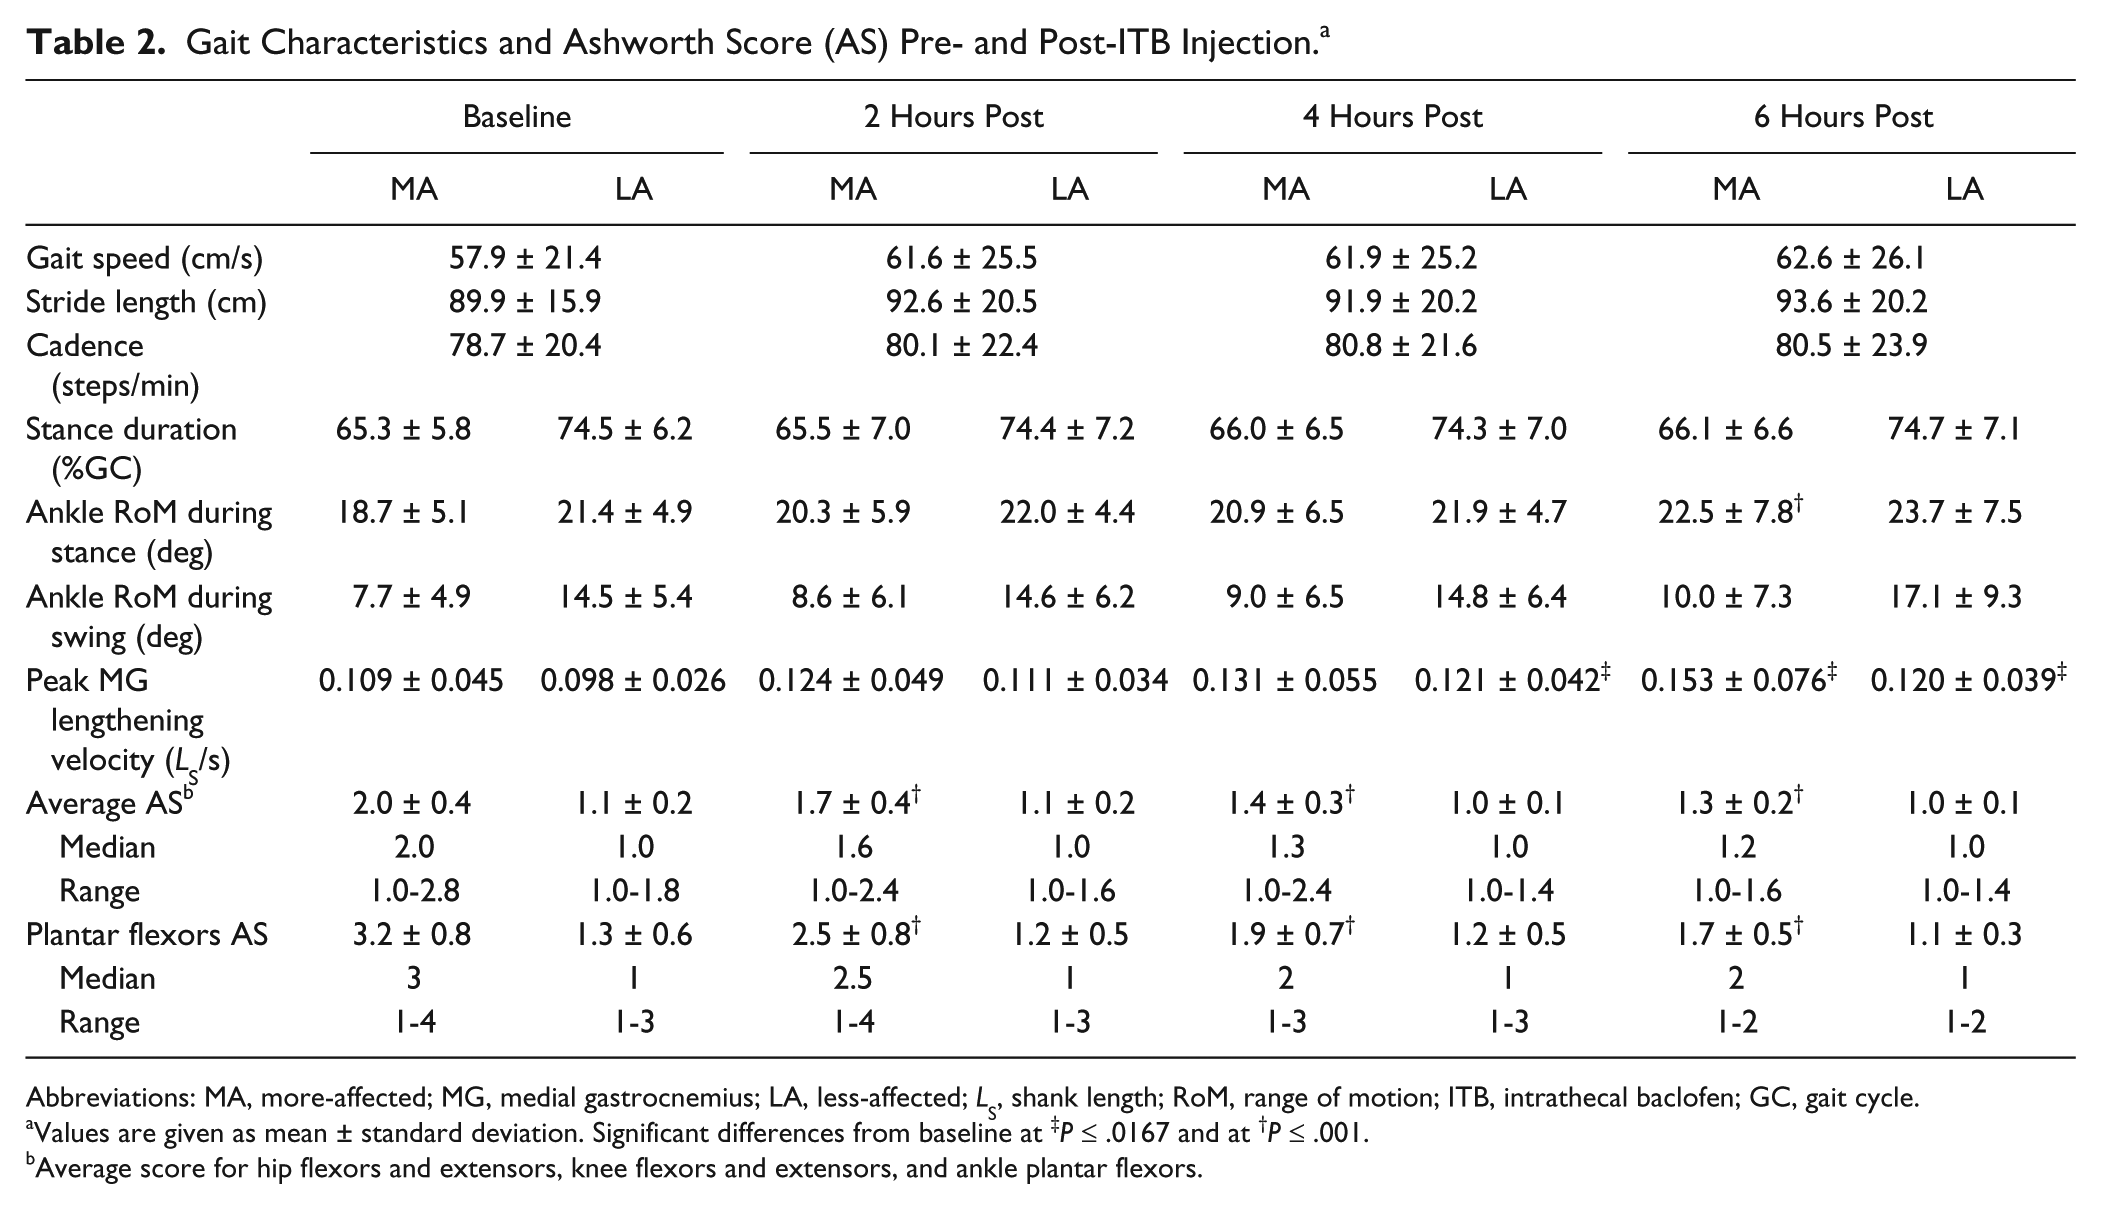
Abbreviations: MA, more-affected; MG, medial gastrocnemius; LA, less-affected; LS, shank length; RoM, range of motion; ITB, intrathecal baclofen; GC, gait cycle.
Values are given as mean ± standard deviation. Significant differences from baseline at ‡P ≤ .0167 and at †P ≤ .001.
Average score for hip flexors and extensors, knee flexors and extensors, and ankle plantar flexors.
Peak MG lengthening velocity was significantly different over time in both legs (P ≤ .012), with significant increases from baseline at 4 hours post in the less-affected leg (P = .005) and at 6 hours post in both legs (P ≤ .010). Both average Ashworth scores and plantar flexor Ashworth scores were significantly different over time in the more-affected leg only (P < .001). This decrease was consistent across the 3 postinjection points (P < .001, Table 2).
A significant main effect of time was found in the more-affected leg for both the frequency (P = .020) and average gain (P = .007) of significant positive EMG-LV slope (Figure 2). Compared with baseline, both parameters were significantly lower at 2 hours post (P ≤ .011) but did not reach the significance at 4 and 6 hours post (P ≤ .040). Slope parameters in the less-affected leg did not change over time (P ≥ .129).
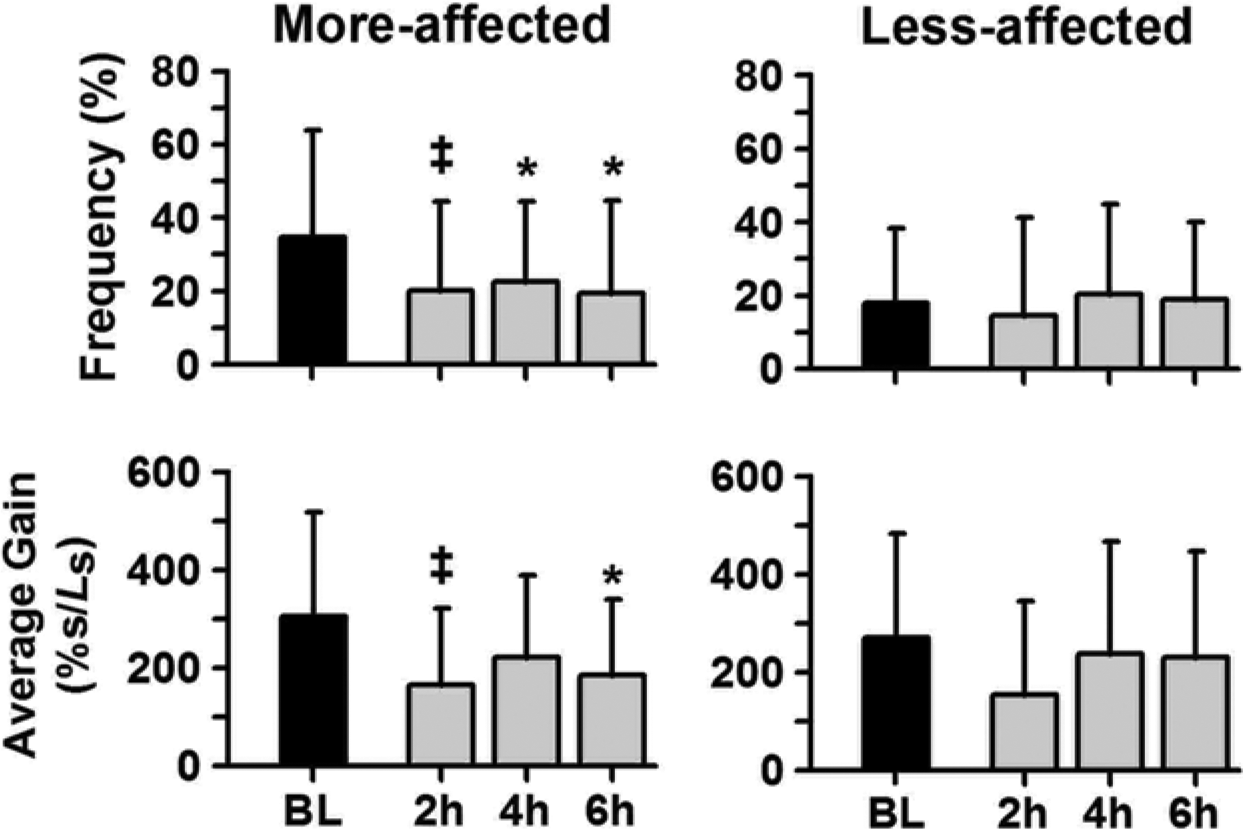
Frequencies and average gains of significant positive electromyogram–lengthening velocity (EMG-LV) slopes in medial gastrocnemius (MG) during stance for the more-affected and less-affected limbs at baseline (BL) and 2, 4, and 6 hours postinjection. The differences from baseline as indicated (*.0167 < P ≤ .05 and ‡P ≤ .0167; error bars are standard deviations).
The CoD significantly changed over time in the more-affected leg during all phases of gait (P ≤ .013, Figure 3). The decrease in CoD was significant at all postinjection points during the entire stance (P ≤ .003) and only at 4 hours post during swing (P = .007; P ≤ .039 at 2 and 6 hours post). In the less-affected leg, CoD significantly changed over time only during the single support (P = .003), which was significantly different from baseline at 4 hours post (P = .002; P = .035 at 6 hours post, Figure 3). CoI did not significantly change over time in either leg (P ≥ .107).
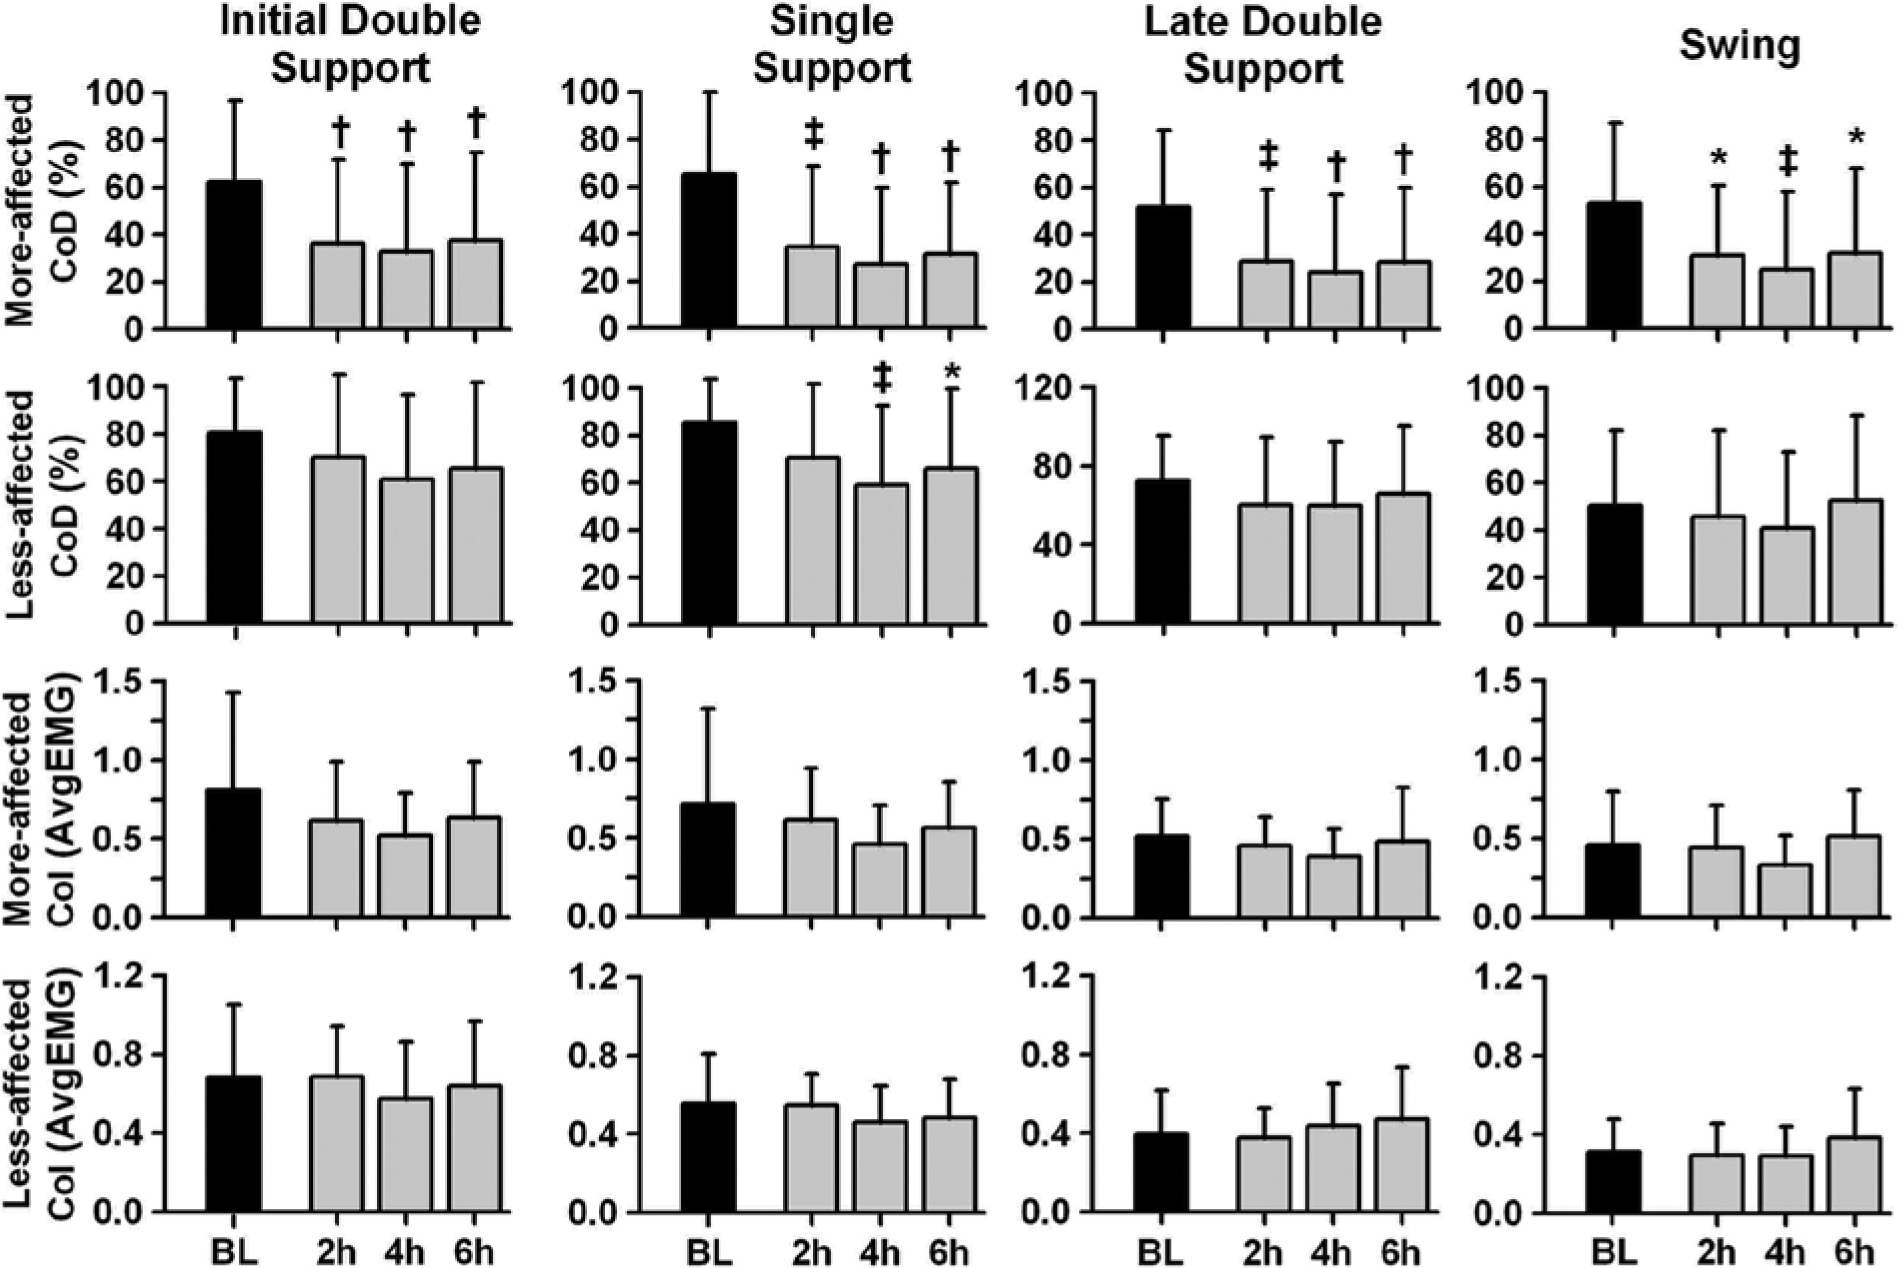
Coactivation duration (CoD; top 2 rows) and coactivation index (CoI; bottom 2 rows) between tibialis anterior (TA) and medial gastrocnemius (MG) muscles during different phases of the gait cycle for the more-affected and less-affected legs at baseline (BL) and 2, 4, and 6 hours postinjection. The differences from baseline as indicated (*.0167 < P ≤ .05, ‡.001 < P ≤ .0167, and †P ≤ .001; error bars are standard deviations).
Gait speed significantly increased in 10 patients (14.9 ± 8.5 cm/s, on average), did not significantly change in 3 patients (0.5 ± 3.4 cm/s), and significantly decreased in 6 patients (−10.3 ± 4.8 cm/s). The changes in EMG parameters from baseline to the time of peak change in speed were not different for any phase of gait between the group that increased speed and the group that did not increase speed (P ≥ .211). The timing of the largest change in EMG parameters coincided with the largest decrease in the average Ashworth score in the more-affected limb in 36% of cases, on average (mainly at 4 hours postinjection, Table 3).
Agreement Between the Time of Peak Changes in Ashworth Score a and Peak Changes in Slope and Coactivation Parameters for the More-Affected Limb.
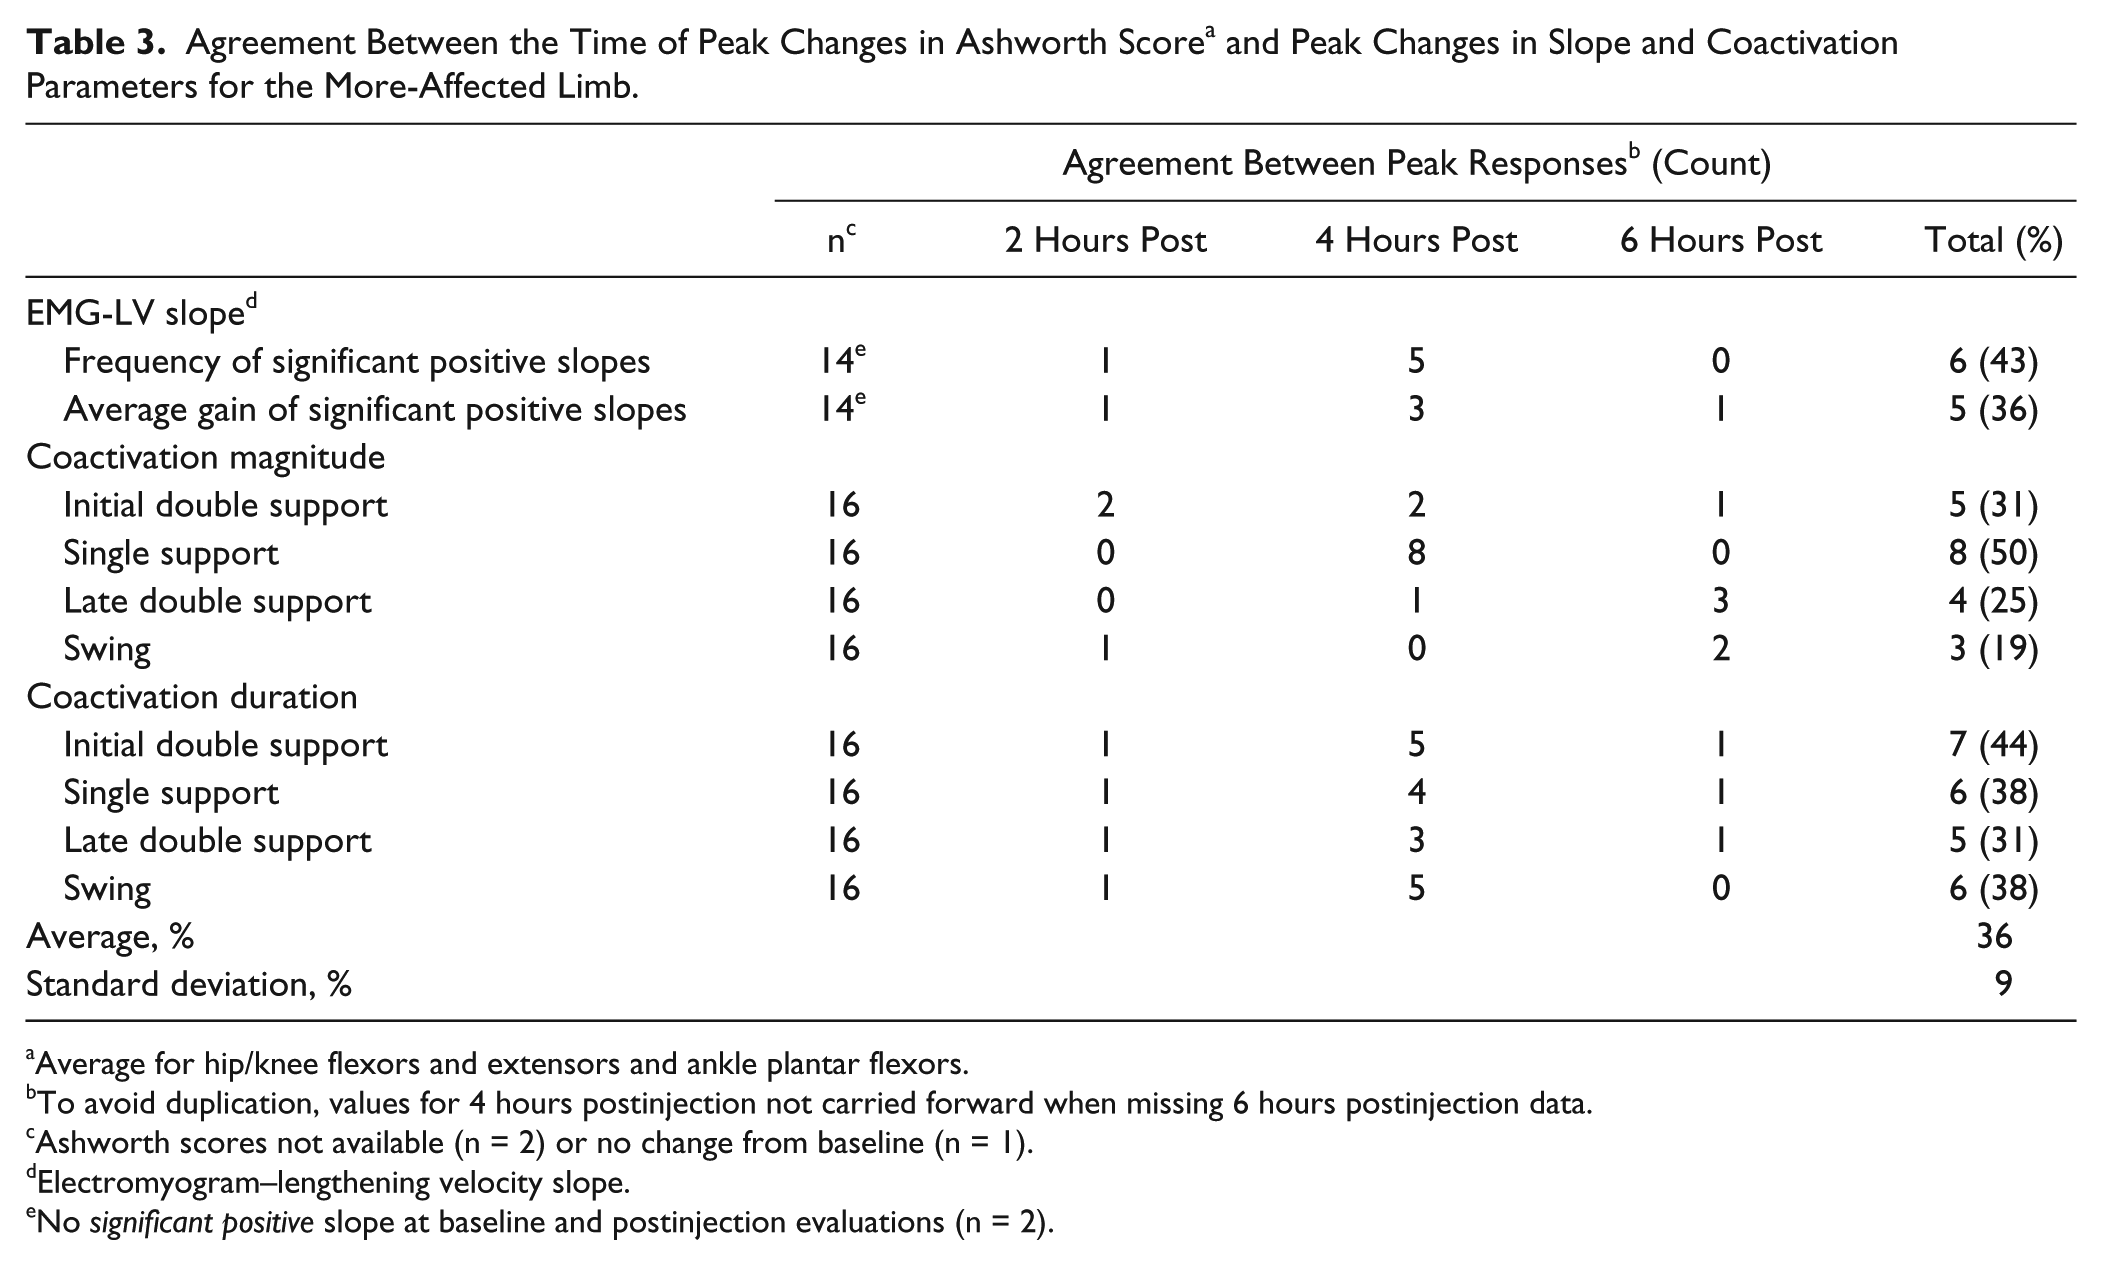
Average for hip/knee flexors and extensors and ankle plantar flexors.
To avoid duplication, values for 4 hours postinjection not carried forward when missing 6 hours postinjection data.
Ashworth scores not available (n = 2) or no change from baseline (n = 1).
Electromyogram–lengthening velocity slope.
No significant positive slope at baseline and postinjection evaluations (n = 2).
Discussion
To our best knowledge, this is the first study to serially evaluate changes in muscle activation during gait after ITB bolus injection in subjects with moderate-to-severe resting hypertonia. The main results indicate a decrease in the frequency and gain of significant positive EMG-LV slope in MG muscle during stance and a shorter TA-MG coactivation during the entire gait cycle, primarily in the more-affected leg and lasting at least 6 hours after ITB injection. The altered muscle activation, however, did not affect the overall gait performance.
Electromyogram–Lengthening Velocity Relationship
Our first hypothesis was confirmed because both the frequency and gain of significant positive EMG-LV slope decreased in the more-affected MG muscle after ITB bolus injection (significant main effects of time). Compared with baseline, this decrease was significant at 2 hours postinjection (Figure 2). The nonsignificant decreases at 4 and 6 hours postinjection can be attributed to the more stringent significance level adopted for baseline to post-ITB comparisons (P < .0167) and the lack of statistical power given relatively small sample size. The frequency of significant positive EMG-LV slope indicates the prevalence of a tight coupling between the increase in EMG and the increase in velocity of MG lengthening during stance. Decreased spinal excitability after the ITB injection is expected to affect both afferent and descending input and reduce activation and synchronization of motor units. This is likely to result in smaller and more variable surface EMG amplitude and, therefore, overall fewer steps where the increase in MG activation is proportional to the increase in its lengthening velocity during stance. The concomitant decrease in the gain of EMG-LV relationship is also consistent with decreased spinal excitability as a result of ITB administration. 41
Based on the previous interpretation of EMG-LV relationship,19-21 our results may be viewed as the evidence of less hyperactive stretch reflex during passive lengthening of the ankle plantar flexors in stance phase of gait. However, it is uncertain whether EMG-LV parameters are closely related to the hyperactive stretch reflex because their predominant reflex origin was originally 18 and most recently contested.22,42 Also, the lengthening of MG during stance may not be entirely passive because the eccentric contraction of MG may help stiffen a joint and provide stability. 43 On the other side, we found an increase in peak MG lengthening velocity after ITB bolus (Table 2) and it remains to be determined whether the faster lengthening is indicative of a reduced stretch reflex excitability in the plantarflexors. The consistent decrease in EMG-LV slope parameters indicates that ITB bolus injection effectively suppressed activation of MG during its lengthening, which likely contributed to increased ankle range of motion in the more-affected leg during the stance phase of gait.
Tibialis Anterior–Medial Gastrocnemius Coactivation
The hypothesis about the changes in ankle muscle coactivation during stance after ITB bolus injection was partially confirmed because we found a significant decrease in the duration but not the magnitude of TA-MG coactivation. The CoD was shorter throughout the entire gait cycle in the more-affected leg but only during the single stance in the less-affected leg. Shorter CoD reflects lesser overlap between the TA and MG muscles during gait, which can be ascribed to the overall suppression of EMG after ITB injection. For the more-affected limb, the decrease in CoD after the injection may also be responsible for the increase in ankle range of motion during stance as well as an increase in peak MG lengthening velocity (Table 2). Because prolonged CoD in the less-affected limb is considered compensatory adaptation to the contralateral impairement, 26 a decrease in CoD during the single support in the less-affected limb suggests improved neural control of the more-affected limb after ITB bolus injection.
No significant change in the magnitude of coactivation may be because of the way the CoI is computed. Because muscle activation is normalized to the average EMG over the entire gait cycle, 37 the CoI represents a relative magnitude of the EMG overlap. Taken together, therefore, no change in CoI and shorter CoD indicate that ITB bolus proportionally reduced ankle muscle activity without affecting the pattern of coactivation between TA and MG during stance phase of gait in people with moderate-to-severe resting hypertonia. Similar findings of no change in CoI and shortening of CoD were reported for the quadriceps-hamstring coactivation during gait in stroke patients who underwent chemodenervation for a stiff-knee gait. 44 Future studies should examine quadriceps-hamstring coactivation to differentiate the effects of ITB administration between the proximal and distal muscles involved in locomotion.
Clinical Implications
A sudden and temporary decrease in muscle activation after ITB bolus injection is expected to alter gait coordination and variably affect speed and kinematic parameters.10,17 Decreased muscle activation may weaken the antigravity pattern commonly used during ambulation by patients with lower limb hypertonia after an acquired brain injury. This may explain the decrease in gait speed in 6 patients in this study and the less favorable gait changes after ITB injection documented objectively10,17 and subjectively. 45 Conversely, reduced activation in overactive muscles may lead to faster walking after ITB injection, as observed in the 10 cases here. However, the interaction between muscle activation and gait speed was not ascertained in this study because none of the EMG parameters differed between the subjects who increased the speed and those who slowed down or walked at the same speed after the ITB bolus. This discrepancy reinforces the point that physiologic changes resulting from antispasticity treatment do not necessarily translate into improved motor function. However, several factors should be considered with respect to clinical implications of our findings. Besides a recently proposed more rostral site of baclofen action, 46 the lumbosacral locomotor network likely experienced a rapid, profound, but transient change in excitability as a result of ITB bolus injection. The requirement to constantly adapt to ensuing changes likely led to variable motor performance in our subjects with disordered motor control. Variable performance is particularly expected for complex motor behaviors such as gait, which requires a high level of integration and coordination of voluntary and involuntary mechanisms controlling balance, forward progression, and reciprocal leg movements. Second, the same dose administered to all subjects was sufficient to result in physiologic changes, but, with respect to gait, it might have been appropriate for some subjects but either too high or too low for others at different times over the 6-hour study period. For these reasons, our results should not be generalized to the efficacy of a continuous ITB infusion on gait after the pump implantation, which warrants further studies.
The Ashworth score results reported here and the Hoffmann-reflex suppression 16 confirmed the physiologic effects of ITB injection and provided validity for the EMG findings. The proportion of patients who decreased the frequency of significant positive EMG-LV slope or shortened CoD in the more-affected limb ranged from about 60% to 90% across the 3 postinjection points. This suggests that transient changes in muscle activation are more frequent than kinematic changes after ITB bolus injection. However, the temporal agreement between the largest change in the slope/coactivation parameters and the largest decrease in the average Ashworth score was low (36% on average). This reinforces previous observations10,17 that the changes in gait after ITB bolus injection do not closely follow the changes in resting muscle hypertonia. Thus, physiologic and clinical outcomes should be monitored together to better appreciate the overall response to ITB injection.
Study Limitations
There is a potential for selection bias that was mitigated by consecutively enrolling all eligible patients. Although the use of walking aids might have altered muscle activation, they were allowed for safety and to avoid unnatural walking and compensatory strategies that may confound the results. The ankle-foot orthosis was allowed to prevent a foot drag although it may affect passive dorsiflexion during the stance phase of gait. However, significant increases in peak MG lengthening velocity and ankle range of motion in the paretic leg after ITB injection argue against the major impact of ankle-foot orthosis on EMG-LV parameters. The effects of ITB bolus on gait kinetics and activation of proximal muscles were not examined and warrant further studies. The results have to be interpreted within the limits of the methodology for calculating the EMG-LV slope and coactivation parameters given the computational assumptions and mathematical modeling involved. Finally, although our sample size of 19 subjects warrants caution when generalizing the findings, this is the largest case series to date that examined changes in muscle activation during gait in the context of ITB bolus screening trial.
Conclusions
Intrathecal baclofen bolus injection reduces the activation of ankle muscles during gait without affecting the pattern of coactivation or the overall gait performance. The effect is consistent with a decrease in excitability of the spinal locomotor network. EMG changes better characterize the response to ITB bolus injection than gait kinematics in ambulatory patients with moderate-to-severe lower limb hypertonia after acquired brain injury. Therefore, the analysis of ankle muscle activation is recommended to more comprehensively assess the outcome of ITB injection on gait during a screening bolus trial. Future studies should explore the effects of ITB bolus on lower limb coordination during walking and functional mobility tasks.47,48
Footnotes
Acknowledgements
We are grateful to Mark Hemleben and Terry Horn for their assistance with this study.
Declaration of Conflicting Interests
The author(s) declared no potential conflicts of interest with respect to the research, authorship, and/or publication of this article.
Funding
The author(s) disclosed receipt of the following financial support for the research, authorship, and/or publication of this article: This work was supported in part by the National Institute on Disability and Rehabilitation Research, US Department of Education (grants H133A020514 and H133A980035); the Medtronic, Inc (Minneapolis, MN); and the Wilson Research Foundation (Jackson, MS).