
Abstract
Background. There is no easy and reliable method to measure spasticity, although it is a common and important symptom after a brain injury. Objective. The aim of this study was to develop and validate a new method to measure spasticity that can be easily used in clinical practice. Methods. A biomechanical model was created to estimate the components of the force resisting passive hand extension, namely (a) inertia (IC), (b) elasticity (EC), (c) viscosity (VC), and (d) neural components (NC). The model was validated in chronic stroke patients with varying degree of hand spasticity. Electromyography (EMG) was recorded to measure the muscle activity induced by the passive stretch. Results. The model was validated in 3 ways: (a) NC was reduced after an ischemic nerve block, (b) NC correlated with the integrated EMG across subjects and in the same subject during the ischemic nerve block, and (c) NC was velocity dependent. In addition, the total resisting force and NC correlated with the modified Ashworth score. According to the model, the neural and nonneural components varied between patients. In most of the patients, but not in all, the NC dominated. Conclusions. The results suggest that the model allows valid measurement of spasticity in the upper extremity of chronic stroke patients and that it can be used to separate the neural component induced by the stretch reflex from resistance caused by altered muscle properties.
Introduction
Spasticity is considered an important symptom by clinicians, and it is routinely assessed to describe the neurological condition of the patient. 1 Although there is no proper definition of spasticity that is recognized by both clinicians and researchers, 1 the most commonly used definition by Lance 2 restricts spasticity to the “velocity dependent increase in the tonic stretch reflex with exaggerated tendon reflexes.” However, there is also a nonneural resistance caused by inertia, elasticity, and viscosity of the body part that is moved, and several studies have shown that muscle properties are altered after a cerebral lesion. 3-5 Spasticity is usually measured by an examiner moving a joint and simultaneously estimating the resistance according to an ordinal scale, such as the Tardieu or the Ashworth scales. 6 However, the validity and reliability of these methods has been questioned in many studies. 7-10 Another disadvantage is that the Ashworth scale only measures the total force and does not allow separation of the neural and nonneural components. In spite of the criticism, these clinical scales are still in practice since they are inexpensive and easy to use, and because more sophisticated biomechanical methods are too complicated to be used in the clinical setting. 11
Previous approaches to separate out the neural component include using (a) the velocity-dependent resisting force, which is composed of the neural activation (stretch reflex) and the viscous resistance in the tissues being stretched 12-15 ; (b) sophisticated biomechanical models 7,16 ; (c) electromyography (EMG) 17-19 ; and (d) ischemic nerve block. 20 However, these approaches are difficult to apply in the clinic 11 and do not discriminate between neural and mechanical (elasticity and viscosity) components. Therefore, the purpose of this study was to develop and validate a new model, easy to apply clinically, that allows estimation of the relative contribution of the neural and the non-neural components of spasticity.
Materials and Methods
The Biomechanical Model
Our model is based on previous work by Koo and Mak, 21 in which the resisting force produced during passive wrist extension can be regarded as a summation of passive elasticity, viscosity, and inertial forces, and by active muscle force, according to the following equation

where F m is the total measured passive force, F p is the passive elastic force, F v is the viscous force, F r is the reflex forces, F in is the inertia forces of both the limb and the moving parts of the measuring device, and θ denotes a specific angle.
A main feature of this model is that it separates active force produced by muscle contractions induced by stretch reflexes elicited by the muscle stretch 2,17-19 from the passive mechanical components. This is important since according to the definition of spasticity by Lance, 2 the velocity-dependent muscle resistance is a fundamental factor in the increased muscle tone. In Figure 1, the variation of total force over time during the stretch is shown in conjunction with the passive and active components. In our model, 3 force points were used to estimate the passive (inertia, viscosity, elasticity) and active (neural) components. Two specific force points were defined during fast passive stretch (71°/s, 142°/s, and 236°/s): P1, the initial peak during the stretch and P2, the late peak during the stretch. A third force point (P3) was defined at fully stretched position after slow passive stretch (5°/s; see examples in Figure 1).
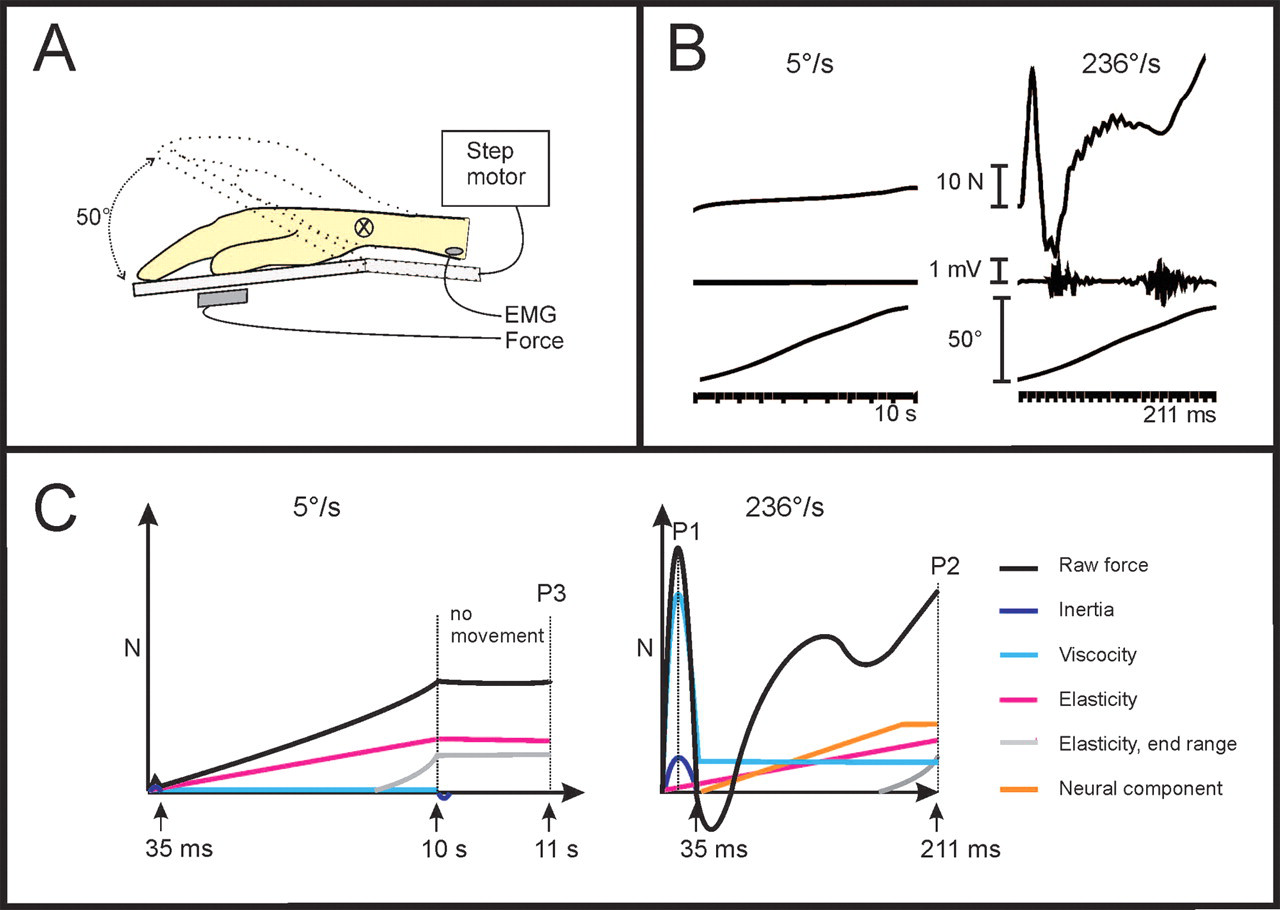
A, Hand, fingers, and forearm were fastened to the platform of a custom built device that passively extended the wrist joint (50°) at controlled velocities (step motor). A force sensor was attached to the device under the hand in order to measure the total resisting force opposing the passive wrist movement. Surface electromyography (EMG) electrodes were placed above the belly of the flexor carpi radialis muscle (FCR). B, Original trajectories of the total resisting force, EMG recordings, and the position of the hand are displayed during slow (5°/s) and fast (236°/s) extension of the wrist. Note that only the fast movement resulted in muscle activity. C, A schematic illustration of the major components that contributed to the total passive resisting force trajectory. Black line illustrates the total force at 5°/s and 236°/s. During the slow movement (5°/s), the elasticity (purple) and the end range stiffness (gray) constitute the major contribution to the total force (P3), except a minimal acceleration peak in the beginning of the movement. At faster speeds (236°/s), the first force peak (P1) occurring at about 15 ms after movement onset is composed of inertia (IC; dark blue) and viscosity (VC; light blue) forces. The later force peak at the stop of the movement (P2) consists of viscosity (VC), elasticity and end range stiffness (EC), and the neural component (NC; yellow) from the stretch reflex (mV, millivolts; N, newtons; ms, millisecond).
Inertia component (IC)
Inertia is the force resisting the acceleration of the hand and depends on the mass of the hand and movable platform (Figure 1C) and the acceleration according to

where IC is the inertia; m is the mass of hand and platform, and a is the acceleration. Acceleration profiles were consistent and increased with target velocity (9.5, 11.8, and 21 m/s2 at 71°/s, 142°/s, and 236°/s, respectively).
The mass of the hand was estimated to be 0.6% of the total body weight. 22
Elasticity component (EC)
Elasticity is a length-dependent resisting force that increases the more the muscles and tendons are stretched (Figure 1C). 23 There is also an exponential increase when the muscle is stretched close to its end range. In the model, the length-dependent elasticity is recorded 1 second after the end of the slow stretching movement (5°/s; P3 in Figure 1C). It includes both the linear elasticity and the nonlinear end range stiffness.
Viscosity component (VC)
The viscosity is the force produced by the viscous resistance, for example, sliding muscle fibers. 24 The viscosity depends on the velocity of the muscle stretch 23 and is highest during the initial acceleration and continues at a lower level during the remaining muscle stretch. 23,24 In our model, the early viscosity component was defined as the resisting force that remained after the inertia component had been subtracted from the initial peak of the total resisting force at P1 (Figure 1):

Whereas the early viscosity could be calculated from the force trajectory, the later viscosity had to be approximated. In a previous report, Halaki et al 25 described that there is a rather stable relationship between the early and late viscosities, in which the late viscosity is about 20% of the early viscosity. We verified this estimation in 9 control subjects who had no visible EMG response, suggesting that they had no or very little muscle activity induced by the stretch. In these subjects, the mean relationship between the late viscosity and the early viscosity calculated at P1 (see above) was 25% at 71°/s, 22% at 142°/s, and 17% at 236°/s. We therefore determined that our model should approximate the late viscosity at P2, to be 20% of the early viscosity at P1:

Neural component (NC)
The muscle stretch can activate a spinal stretch reflex with a latency of about 40 ms, followed by later stretch evoked responses adding to the first muscle contraction. 17 In the model, the NC was estimated at P2 (maximal extension at the end of the passive movement) by subtracting the elasticity and viscosity components from the total force:

Experimental Setup and Protocol
Passive extension of the wrist at controlled velocities was performed using a custom-built apparatus incorporating a computer-controlled step motor (Nanotec Electronic GmbH & Co KG, Landsham, Germany; Figure 1A). Subjects were instructed to be relaxed throughout the testing session, which consisted of passive extension of the wrist at 4 velocities ordered in 2 sequences to minimize order effects (a) 5°/s, 236°/s, 71°/s, 142°/s and (b) 142°/s, 71°/s, 236°/s, 5°/s. Testing at multiple velocities allowed us to test which components were velocity dependent. The starting position of the hand was approximately at 20° flexion, and end position was approximately 30° extension. Movements at a certain velocity were carried out in sets of 5 with 10-second intervals between subsequent movements and an 18-second pause between each set of different velocities. Force and position were sampled at 400 Hz, digitalized at 12-bit resolution and stored in SC/ZOOM (Department of Physiology, Umeå University, Sweden) for later analysis. Force traces were averaged across 3 trials at each velocity (71°/s, 142°/s, and 236°/s) to give P1 and P2 values. The P3 force was similarly achieved by averaging 3 trials at 5°/s.
Subjects
A total of 31 chronic stroke patients with right-sided hemiparesis were recruited (Table 1). Exclusion criteria were (a) previous neurological disorder, (b) inability to communicate and understand information of the study, (c) less than 40° passive extension of the right wrist (to avoid fast stretches near the end of the movement range), and (d) present pharmacological treatment of spasticity. A total of 13 healthy subjects of comparable age without any history of neurological disorder participated as controls. All subjects gave written informed consent, according to the Declaration of Helsinki. The study was approved by the Regional Ethics Committee, Karolinska Institutet, Stockholm, Sweden.
Clinical Description of Patients
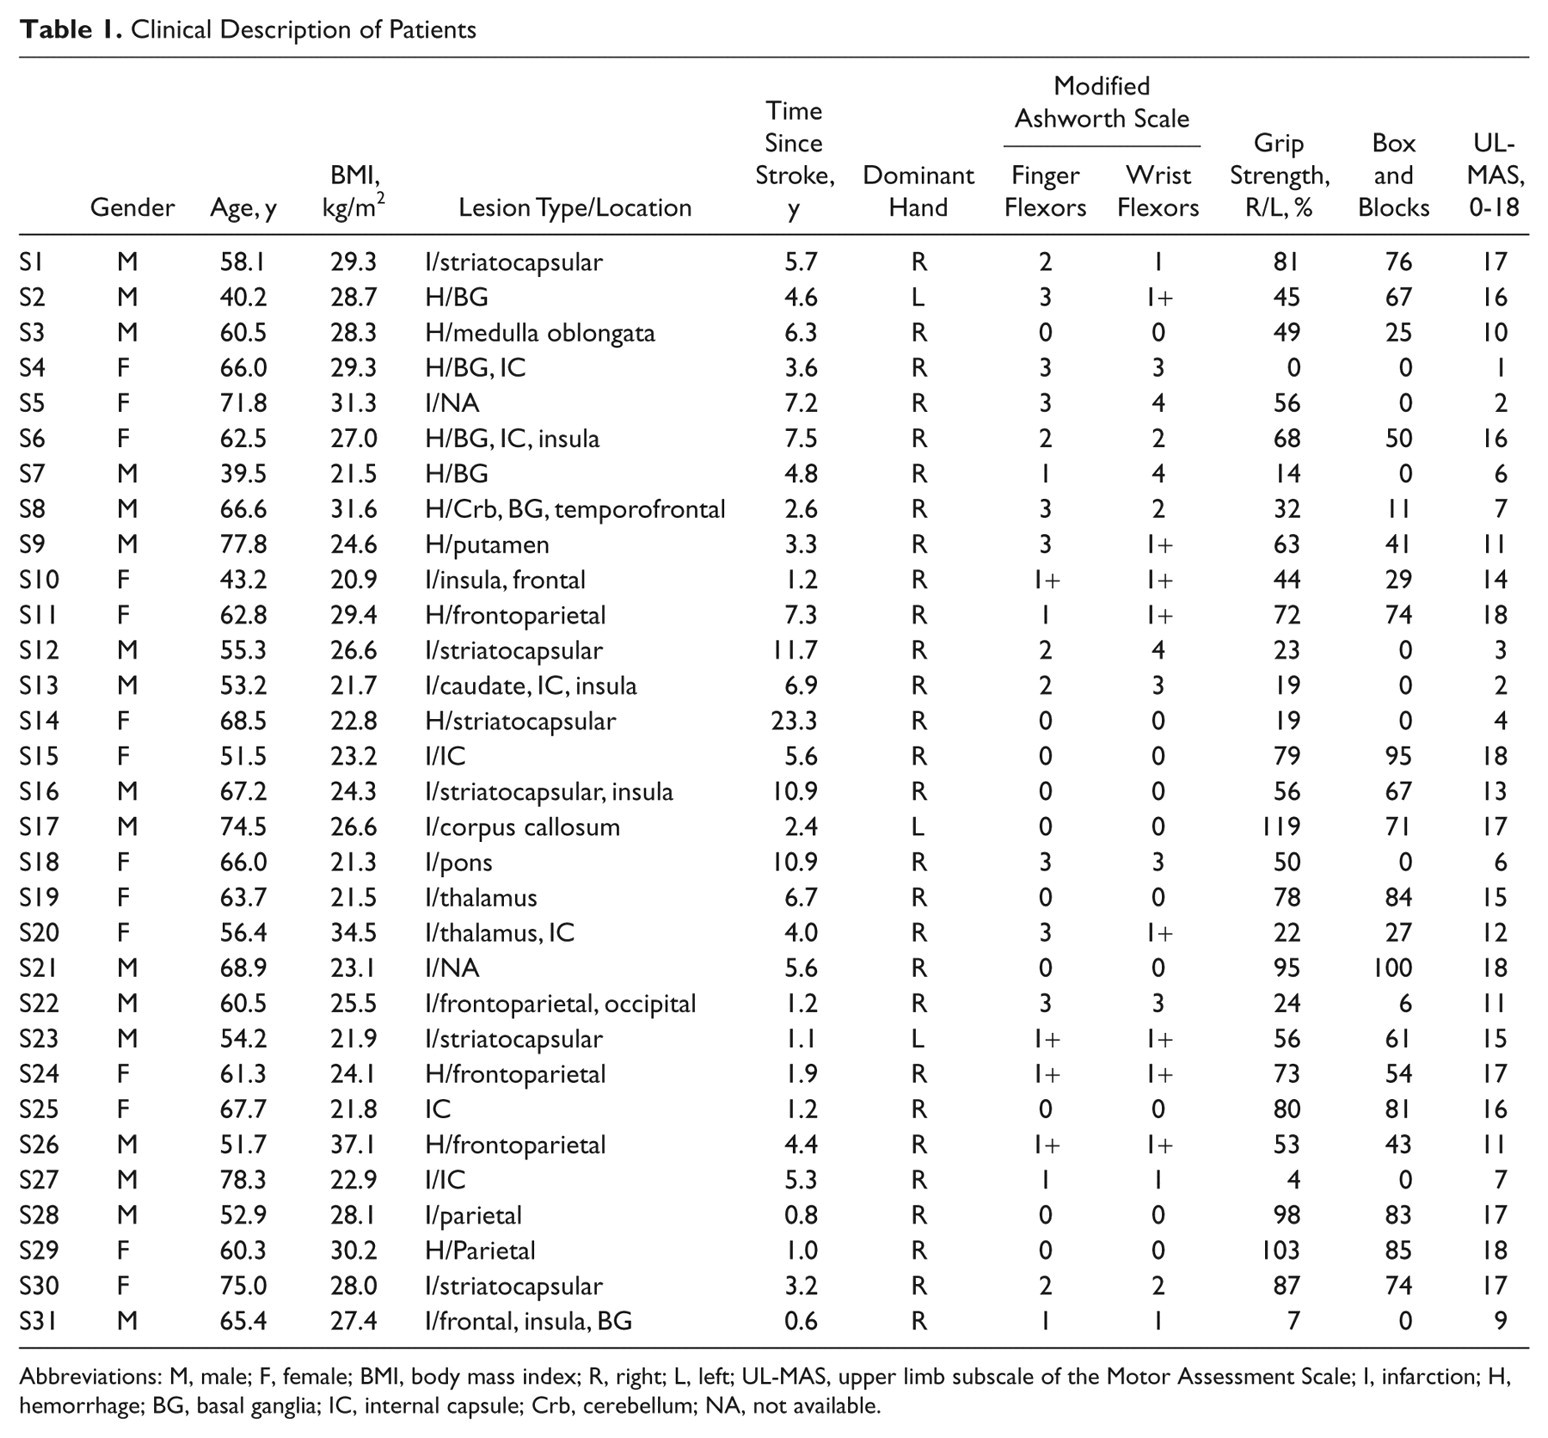
Abbreviations: M, male; F, female; BMI, body mass index; R, right; L, left; UL-MAS, upper limb subscale of the Motor Assessment Scale; I, infarction; H, hemorrhage; BG, basal ganglia; IC, internal capsule; Crb, cerebellum; NA, not available.
Clinical Assessment
Clinical assessment of upper limb function included (a) upper limb subscale of the Motor Assessment Scale (UL-MAS), (b) rating of muscle tone in finger and wrist flexors according to the Modified Ashworth Scale, 6 (c) assessment of dull/sharp distinction and light touch according to the Fugl-Meyer Motor Assessment, (d) box and blocks test of manual dexterity, and (e) grip strength using the Grippit dynamometer (AB Detektor, Goteborg, Sweden).
Ischemic nerve block
An ischemic nerve block test 26 was performed on a subgroup of the stroke subjects (n = 7) with high resisting total force and strong EMG responses. A blood pressure cuff was placed around the subject’s upper arm and inflated to a pressure exceeding the systolic blood pressure with 30 mm Hg during 25 minutes. The resisting force and EMG were measured during passive muscle stretch before inflation (T0), every 5 minutes after the inflation started (T5-T25), and finally at 5 and 10 minutes after the pressure in the cuff was released (T30-T35). The efficacy of the nerve block was clinically assessed after each measurement (T0 − T35) by means of a light touch test according to the Fugl-Meyer scale and the ability to discriminate between sharp and dull.
Electromyography
Bipolar circular Ag-AgCl surface EMG electrodes with an interelectrode distance of 15 mm and an inbuilt amplification (MYO 115, Liberty Technology, Hopkinton, Massachusetts) were placed on the muscle belly aligned with the muscle fibers of the flexor carpi radialis (FCR). Rectified EMG was integrated during the whole passive movement from onset until fully extended wrist at P2, and the area under the curve was quantified (mVs).
Data Analysis and Statistics
Because of anatomical variability (eg, different hand size), the starting angle (measured by a goniometer) varied slightly between subjects even though the platform was in a standardized starting position. This angle difference was compensated for in each subject by calculating the vertical component of the measured gravitational force during the slow 5°/s movement. After placement of the hand on the platform the force sensor measured slightly different forces across subjects (median controls 3.5 N and patients 4.3 N). This difference of baseline force was not significant (P = .62). To reduce the influence of different baseline values, the baseline force was subtracted from P1, P2, and P3.
Force recordings included an angle-dependent variation of the gravitational force exerted to the hand (ie, largest in the horizontal plane at zero degrees). To compensate for this angle-dependent gravitational variation, the total force trace was corrected according to the following formula:
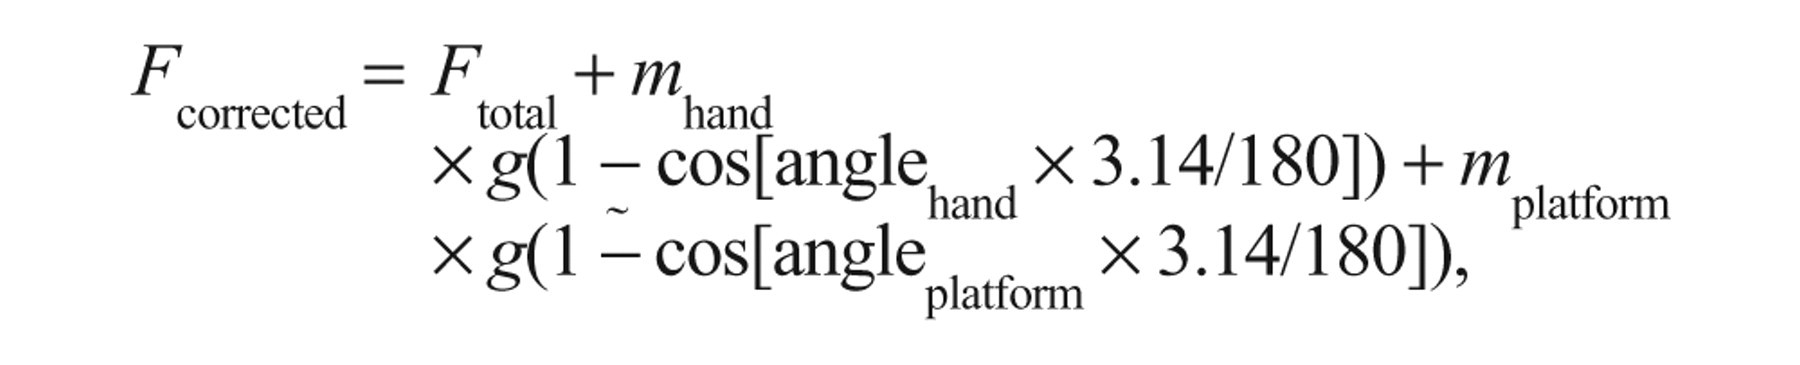
where g = 9.81 m/s2. The zero angle of the platform (angleplatform = 0) was defined as the angle of maximum F total without hand. The zero angle of the hand (anglehand = 0) was defined as the horizontal plane.
Nonparametric statistical tests were used throughout the study since some data had skewed distribution (median and interquartile range). Friedman analysis of variance (ANOVA) was used to assess velocity-dependent differences. For post hoc analysis and for within-group analysis, Wilcoxon matched pairs test was used. For between-group analyses, Mann–Whitney U test was used. Spearman rank correlation test was used for correlations. Statistical tests were considered significant if P < .05.
Measurement Error
We predicted measurement errors due to (a) variations in hand placement on the moving platform and (b) insufficient assumptions of the model. We estimated the measurement error due to hand position by placing a weight of 500 g (similar to that of the hand) at 0.5 cm intervals from the center of the force sensor (0 cm) in both directions, that is, 0 to ±1.5 cm. In relation to the 0 position, the NC varied depending on the position from +0.5 N at the position 1.5 cm closer to the axis of rotation to −2.5 N at a position 1.5 cm further away from the axis of rotation. A similar position-dependent variation was also found in both EC and VC with an amplitude of ±0.5 N. We also measured the consistency of the mechanical set-up by running 50 repetitive trials of the 500-g weight at the zero position. The NC showed a variation between +1 N and −1 N.
Results
Validation of the Biomechanical Model
Reduction of the neural component during ischemic nerve block
The first and most important way to validate the model was to investigate whether the neural component could be reduced by an ischemic nerve block. At T25 (ie, after 25 minutes of ischemic nerve block), 5 of the 7 patients had complete absence of both light touch sensation and capacity to discriminate between sharp and dull sensation, which indicated that the conduction of nerve signals in large afferents had been blocked. In Figure 2, the elasticity (EC), viscosity (VC), and neural (NC) components are shown at baseline (T0) and T25 in the 5 patients with clinical signs of ischemic nerve block. The 2 patients with incomplete nerve block were excluded from group analysis of nerve block results. All 5 patients showed a large reduction in NC. At group level (n = 5), there was a significant reduction in NC at T25 compared with T0 (P < .05) but no consistent change in EC or VC (P > .20; Figure 2).
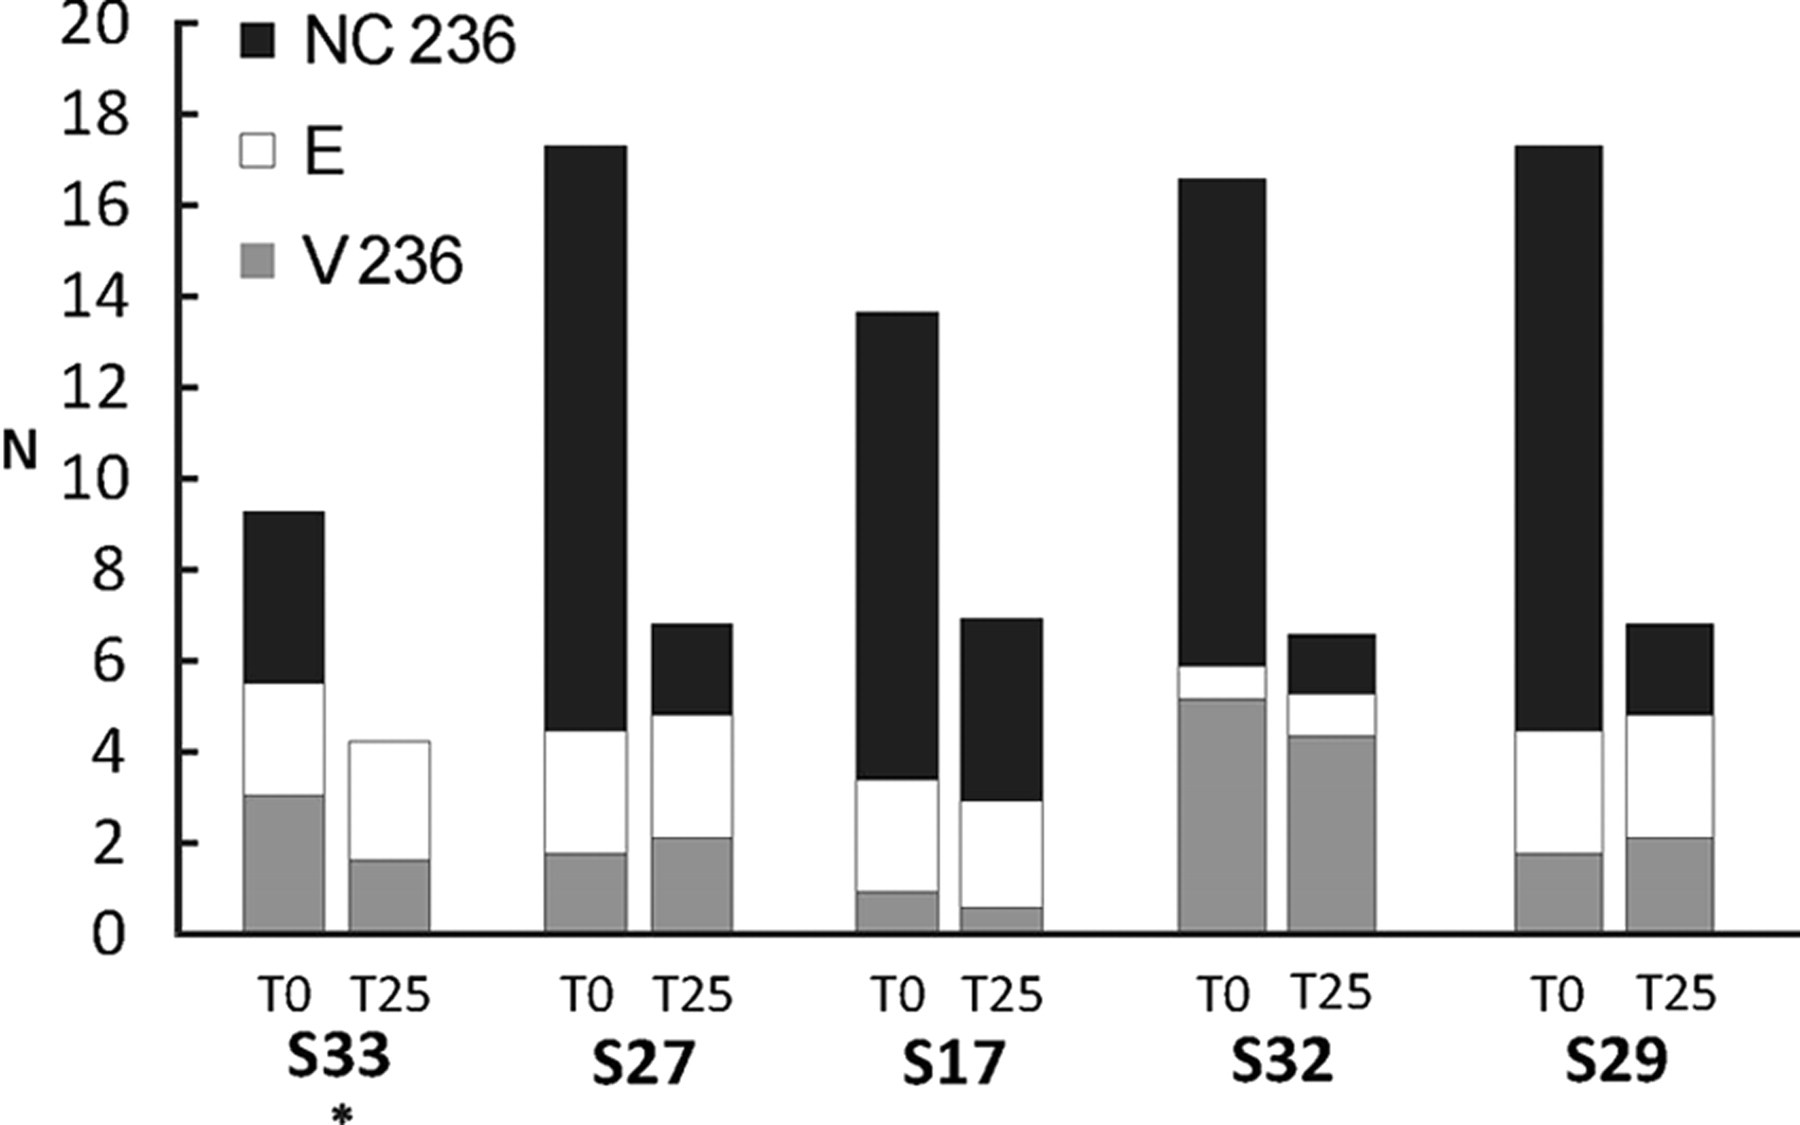
Composition of the resisting force during passive muscle stretch at 236°/s in 5 stroke patients with complete clinical ischemic nerve block 25 minutes after onset (T25). T0 indicates baseline level before the blood cuff pressure was increased. NC, EC, and VC represent the neural, elasticity, and viscosity components, respectively, of the total force at the end of movement. N, newton. (The asterisk in subject S27 indicates zero or negative values in NC; see measuring errors in the Materials and Methods section).
Correlation between the neural component and the integrated EMG of the FCR muscle
The second way to validate the model was to correlate the variation of the NC with the variation of the muscle activity across subjects. The integrated EMG correlated positively with NC across the 3 velocities (r = .62, P < .001 at 71°/s; r = .58, P < .001 at 142°/s; r = .64, P < .001 at 236°/s; Figure 3).
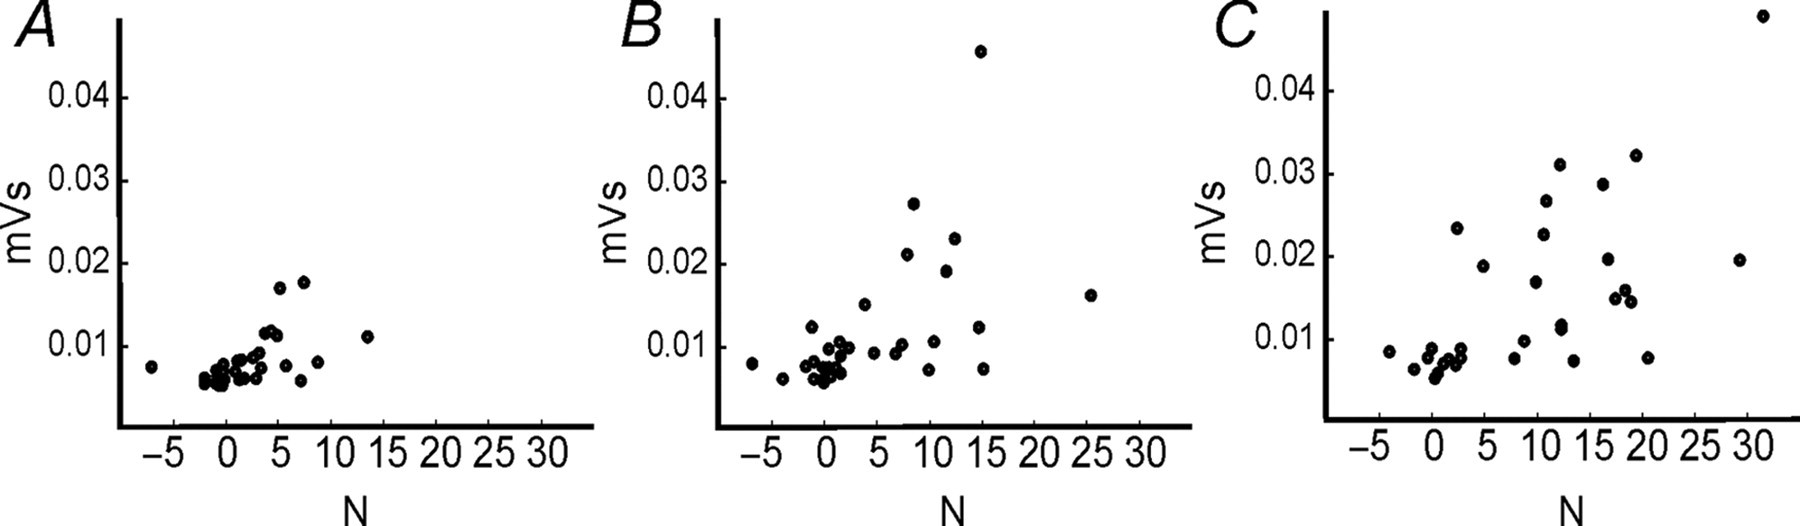
Correlation between the neural component (NC; ordinate) and the integrated EMG (abscissa) in stroke patients (N = 31) at 3 different velocities of muscle stretch: (A) 71°/s, (B) 142°/s; and (C) 236°/s (mV s, millivolt second; N, newton).
In the patients who underwent ischemic nerve block, the NC also correlated with the integrated EMG across time points (T0-T35) during the ischemic nerve block test (r = .86, P = .007).
Velocity dependence of the neural component
The third way to validate the model was to test whether the estimated NC would increase with increasing velocity of muscle stretch. 2 Figure 4A shows a clear velocity-dependent increase in the initial P1 peak and later during the ramp movement. The total force developed during stretch was larger in the patients compared with controls, in particular during the end of stretch and at higher velocities (Figure 4A). The VC increased with velocity in both patients (χ2 =58.3, df = 2, P < .001) and control subjects (χ2 =26, df = 2, P < .001; Figure 4C). The VC was lower in patients than in controls at all velocities (P < .01). The NC (Figure 4D) showed a significant velocity-dependent increase in the stroke patients (χ2 =37.4, df = 2, P < .001) but not in the control subjects. Patients had significantly larger NC compared with controls at 142°/s and 236°/s (P < .05). The integrated EMG was also velocity-dependent in the patients (ANOVA χ2 = 49.2, df = 2, P < .001; Figure 4E) but not in control subjects. It was also higher in patients than in controls across all velocities (P < .05; Figure 4E).
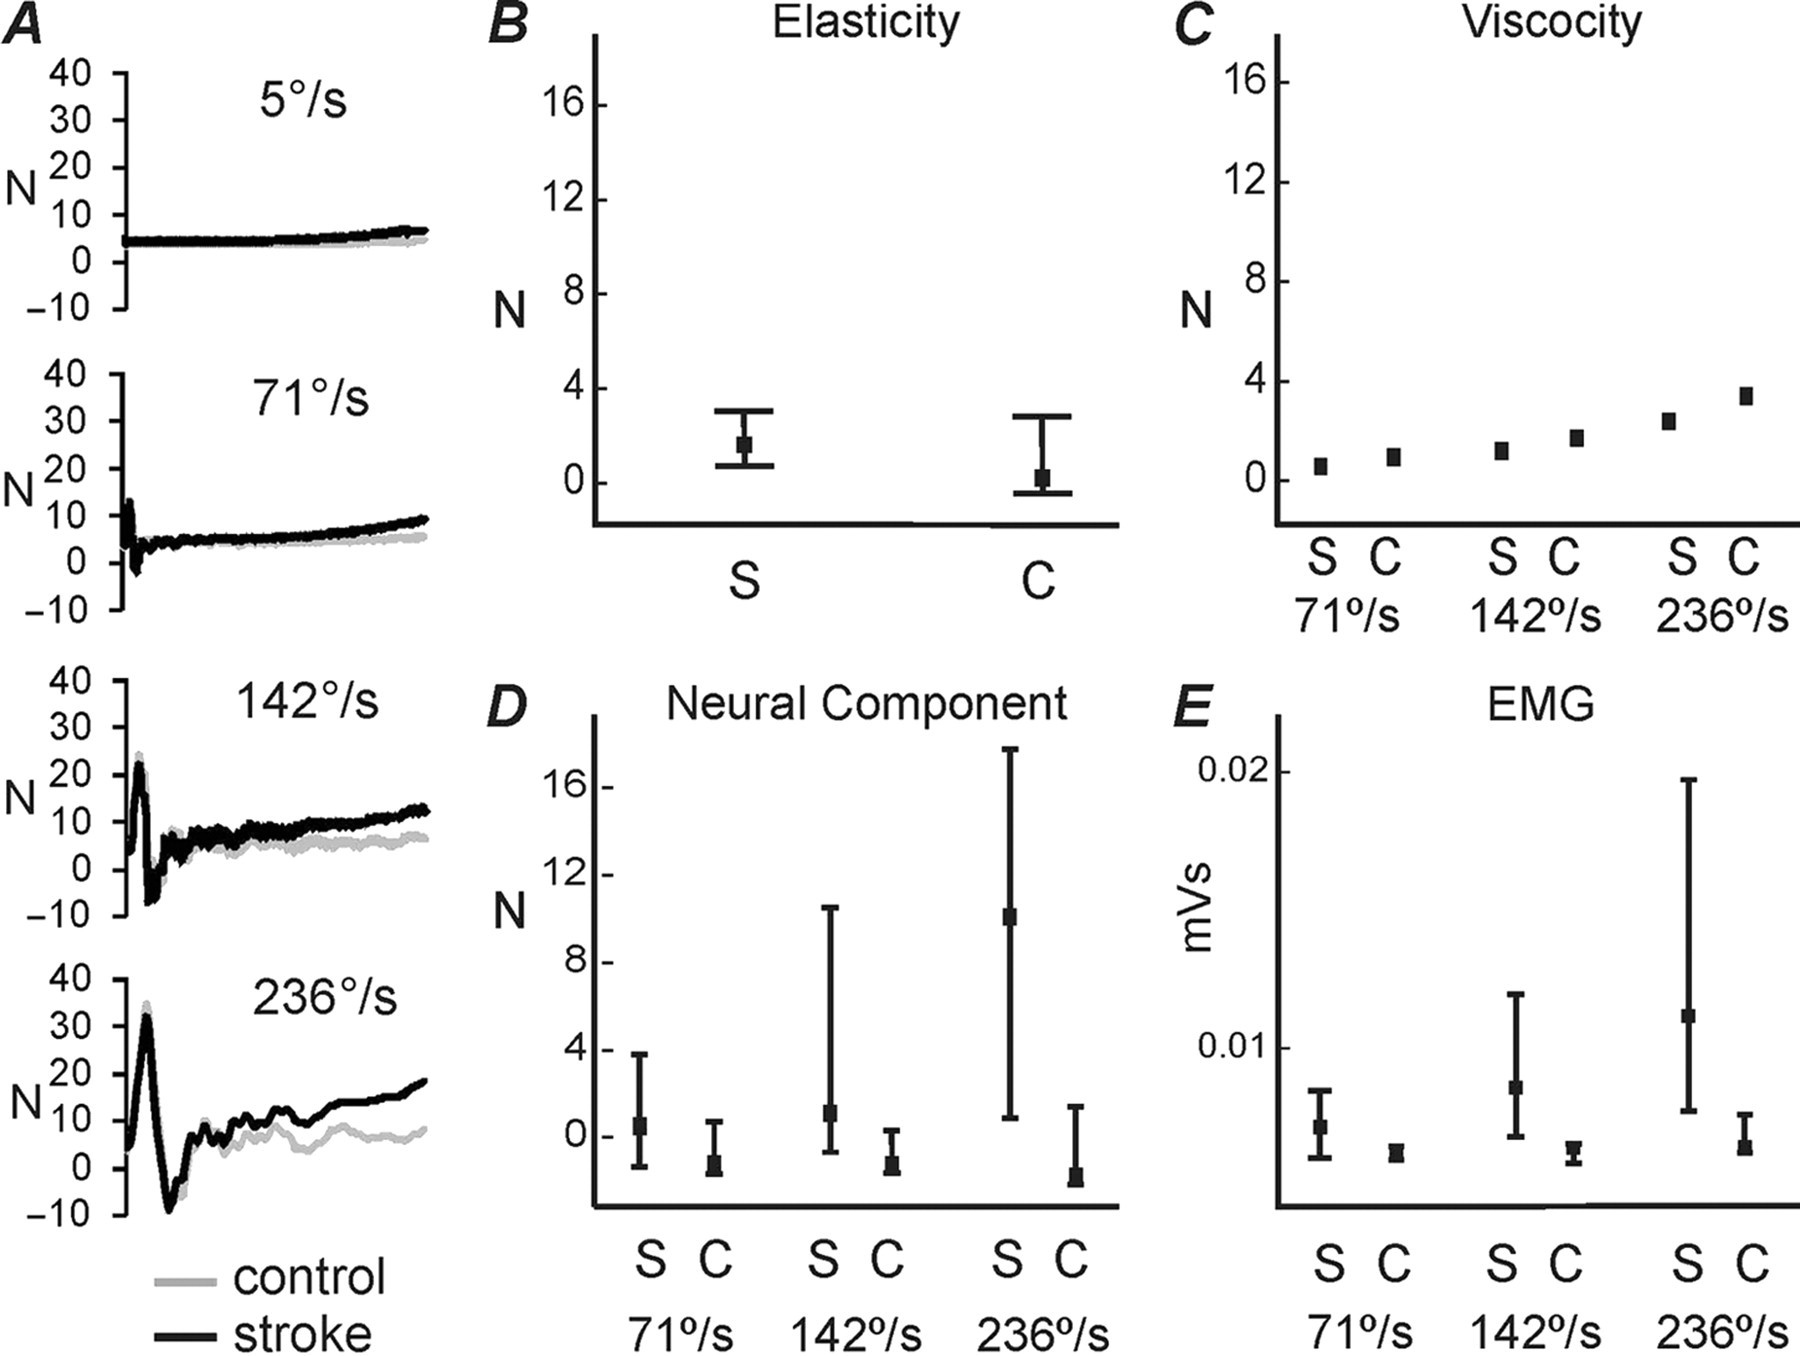
Velocity-dependent modulation of the forces that resist the passive muscle stretch in stroke patients and control subjects. A, The mean total force trajectories during passive wrist extensions are shown in black for stroke patients and in gray for control subjects at 5°/s, 71°/s, 142°/s, and 236°/s. B, C, and D show the estimated force components, that is, elasticity, viscosity, and neural components, respectively, at the 3 different velocities (elasticity only at 5°/s). In E, the integrated EMG is shown at the 3 velocities. Squares and whiskers show median and quartile ranges, 25% to 75% (N, newton; S, stroke; C, control).
The EC was only tested at 5°/s. It varied substantially in patients and showed a trend toward increased elasticity and end range stiffness in patients compared with controls, but the difference did not reach significance (patients, 1.53 N [0.68 to 2.82 N]; control subjects, 0.21 N [−0.38 to 2.62 N]; P = .1; Figure 4B). Inertia did not differ between groups at any velocity (P > .2).
Correlation between the resisting forces and modified Ashworth scores
We also investigated the correlations between the total force and various force components with the clinically scored muscle tone according to the modified Ashworth scale. There was a strong positive correlation between the Ashworth score and both NC and total force across velocities (r > .6, P < .001), whereas EC and VC did not show any consistent correlations.
EC, VC, and NC were not related to body mass index (BMI), age, time since stroke, or gender (P > .1). Nor did any of these 3 components correlate with each other, neither in the stroke patients nor in the control groups (P > .1).
Variation of the Composition of Forces Resisting Muscle Stretch in Stroke Patients
The model was used to estimate the partial contribution of the NC, EC, and VC, making up the total force resisting the passive muscle stretch. The distribution of the 3 components is shown for each stroke patient in Figure 5. In general, the NC was larger both in absolute and relative measures in subjects with larger total resistance. However, there was also an individual variation among patients, in which some had a relatively high EC (eg, patients S28, S18, and S12; indicated by arrows in Figure 5).
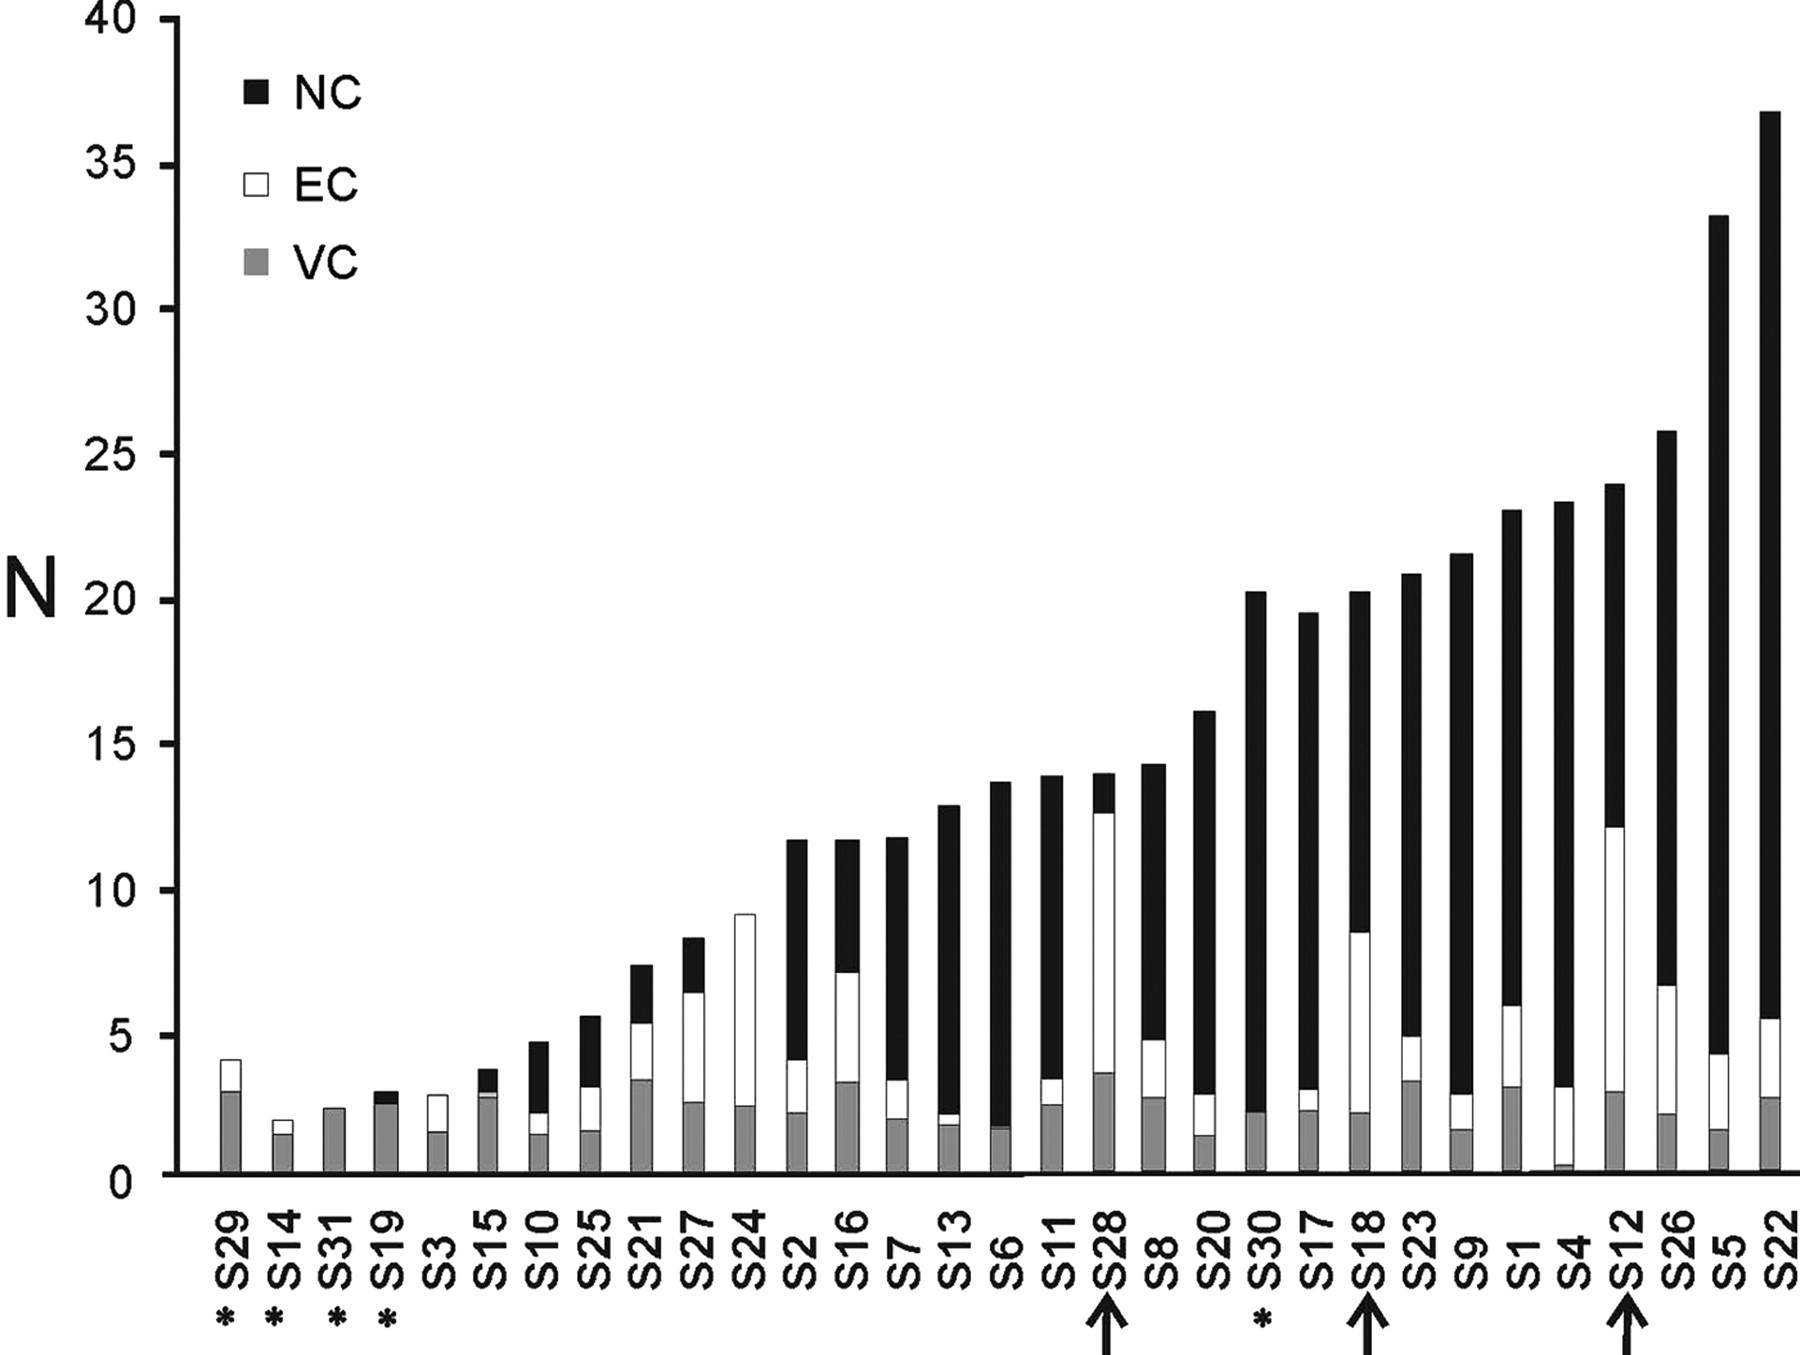
The contribution of the viscosity (gray), elasticity (white), and neural (black) components to the total force resisting the muscle stretch at 236°/s in the stroke patients. The patients are presented in the order of increasing total resistance. Asterisks indicate zero or negative values in one of the components (see Materials and Methods section for details). Arrows indicate subjects in which the neural component (NC) was relatively small in relation to the total force (N, newton).
Discussion
Validation of the Neural Component of the Model
The purpose of the model was to determine the neural and nonneural force components that resist a passive stretch, which is fundamental in clinical measurements of spasticity. Our main focus was to validate the neural component (NC). The most significant validation of the NC was the reduction of NC after an ischemic nerve block that prevented muscle contractions by inhibiting the stretch reflex. The model is further supported by the strong correlation between NC and the integrated EMG both across subjects and in each of the subjects during the nerve block test. The estimated NC is velocity dependent, 17,19 that is, it becomes larger with increasing speed of the passive stretch. Taken together, these findings strongly support that the model of calculating NC is valid and that NC is produced by neural muscle activity. In addition, NC correlated well with the Ashworth score, although the validity and reliability of this latter method has been questioned. 7
Nonneural Components of the Model
The EC showed a trend to be increased in the patients compared with controls. Increased elasticity may occur in some stroke patients. 4 However, the lack of a significant group difference in our study is consistent with other reports after stroke 27,28 and supports the view that the increased passive resistance is predominantly neural in origin. 17,19,28 It should be pointed out that patients with a limited range of movement, that is, less than 60° of wrist extension, were excluded from our study, and that in patients with such reduced range of movement, EC might well be higher.
The VC increased with increasing velocity (Figure 4C), which is in accordance with the expectations. However, the finding that the VC was consistently smaller in patients than in controls across all velocities was not expected. Similar findings of reduced initial resistance peaks in spastic stroke patients have been reported by others. 13 Interestingly, Lieber et al 3 reported that although spastic muscles are stiffer and smaller, the extracellular matrix exhibits inferior mechanical strength. They showed that the extracellular matrix (composed of fibrous proteins such as collagen) in spastic muscle occupies more of the relative space in the muscle bundle (since muscle size is reduced) and that the extracellular matrix is more disorganized. Although further evidence is required, it is intriguing to consider that viscosity is reduced secondary to such remodeling of the extracellular matrix (ie, disorganization of proteins such as collagen). Alternatively, the reduced muscle mass after stroke may also cause reduced viscosity. 29
Limitations
The model presented is simple and should not be expected to give 100% accurate values. Errors can be introduced directly depending on the placement of the hand, for example, if the center of mass of the hand does not fall directly above the force sensor or if there is slight misalignment of the wrist joint with the axis of rotation of the hand apparatus. Errors will also be introduced by the individual discrepancies between the subjects and the general model. The results clearly show that the NC is sensitive to measurement errors and that several stroke patients ended up with negative values with values down to −1.5 N at 236°/s. In addition, a few patients had small negative EC or VC values at 71°/s (<1 N). The negative values were within the range of measurement errors depending on the position of the hand on the platform (see Materials and Methods section) and can thus partly be explained by small variations of hand placement. The negative values were mainly present in stroke subjects and control subjects, who had a low total resisting force. This suggests that the present model is better suited for estimation of mechanical and neural components in patients with moderate to severe increase in muscle tone.
Clinical Considerations
The method we have proposed may offer an alternative way for the clinician to objectively quantify “spasticity” in an easy and noninvasive way. The model only requires monitoring of the force during slow and fast passive movements; no electrophysiological recording is required. Another advantage of this method, not available in the clinical rating scales, is the objective and quantitative character of the measurements and the potential to differentiate the neural and mechanical components of the total resisting force. The individual profile of components (Figure 5) may be of clinical value for targeting of treatment, 1 for example, patients with a large NC component should be considered for therapies aimed at reducing the exaggerated spinal stretch reflex, whereas those with dominant mechanical components may benefit from other strategies such as exercise and stretch.
Footnotes
Acknowledgements
We thank the staff of the Department of Rehabilitation Medicine, Danderyd University Hospital, and the Department of Neurophysiology, Karolinska University Hospital for assistance during data collection.
The author(s) declared a potential conflict of interest (eg, a financial relationship with the commercial organizations or products discussed in this article) as follows: The method described has been patented (WO/2008/121067) and the following authors own part of the commercial rights of the patent: PL, JG, AF, JB, and HF.
The author(s) disclosed receipt of the following financial support for the research and/or authorship of this article: This study was supported by the Health Care Sciences Postgraduate School and the Strategic Neuroscience Program at Karolinska Institutet, the Swedish Research Council (5925), Swedish Foundation for Strategic Research, VINNOVA, and the Swedish Brain Foundation.