
Abstract
Background. Transplants of cellular grafts expressing a combination of 2 neurotrophic factors, brain-derived neurotrophic factor (BDNF) and neurotrophin-3 (NT-3) have been shown to promote and enhance locomotor recovery in untrained spinalized cats. Based on the time course of recovery and the absence of axonal growth through the transplants, we hypothesized that recovery was due to neurotrophin-mediated plasticity within the existing locomotor circuitry of the lumbar cord. Since BDNF and NT-3 have different effects on axonal sprouting and synaptic connectivity/strengthening, it becomes important to ascertain the contribution of each individual neurotrophins to recovery. Objective. We studied whether BDNF or NT-3 only producing cellular grafts would be equally effective at restoring locomotion in untrained spinal cats. Methods. Rat fibroblasts secreting one of the 2 neurotrophins were grafted into the T12 spinal transection site of adult cats. Four cats in each group (BDNF alone or NT-3 alone) were evaluated. Locomotor recovery was tested on a treadmill at 3 and 5 weeks post-transection/grafting. Results. Animals in both groups were capable of plantar weight-bearing stepping at speed up to 0.8 m/s as early as 3 weeks and locomotor capabilities were similar at 3 and 5 weeks for both types of graft. Conclusions. Even without locomotor training, either BDNF or NT-3 only producing grafts promote locomotor recovery in complete spinal animals. More clinically applicable delivery methods need to be developed.
Introduction
Delivery of neurotrophins to the spinal cord is an effective approach to stimulate locomotor recovery.1-3 We have previously demonstrated the locomotor benefits provided by brain-derived neurotrophic factor (BDNF) and neurotrophin-3 (NT-3) delivery via modified fibroblasts transplanted into the lesion site of spinal transected cats. 1 Four experimental groups were compared—cats receiving no treatment, cats that received body weight–supported treadmill training only, cats that received neurotrophin-producing transplant only, or cats that received a combination of treadmill training and neurotrophin-producing transplant. The spinal cats that received neurotrophin treatment only performed as well on treadmill locomotion as the spinal cats that received daily treadmill training. Improvements in locomotion were likely related to plasticity within the circuitry of the lumbar cord, since recovery occurred as early as 2 weeks post-transection in the neurotrophin-treated animals (without axonal growth through the lesion site 1 ) compared with 4 to 5 weeks for trained animals.1,4-6
Because we used a combination, the individual contribution of each neurotrophin could not be ascertained. BDNF and NT-3 promote fiber sprouting and modifications in synaptic transmission efficiency, which has been implicated in the recovery provided by treadmill training.7-9 While NT-3 promotes the growth of large sensory fibers associated with proprioception in dorsal root and dorsal column lesions injury models,10 -14 BDNF has limited growth promotion effects for the large afferent fibers of the dorsal columns.10,12 Both neurotrophins have also been shown to modify synaptic transmission. NT-3 enhances monosynaptic transmission to motoneurons 15 but tends to reduce polysynaptic responses. 16 BDNF has more complex effects, initially facilitating, then suppressing monosynaptic responses in motoneurons, 17 while increasing polysynaptic responses. 16
Based on its sprouting effects on large afferent fibers and enhancement of the monosynaptic responses to motoneurons, we assumed that NT-3 was primarily involved in the recovery of locomotion. Yet, Boyce et al 2 showed better recovery of locomotion with BDNF only–producing viral transfection in spinalized rats. To investigate the individual contribution of each neurotrophin to recovery in the cat, we grafted single neurotrophin-producing, either BDNF or NT-3 only, transplant into the injury site of adult spinal transected cats. We show that each neurotrophic factor can independently promote locomotor recovery in the absence of locomotor training.
Methods
Animals and Experimental Protocol
Eight adult domestic short hair female cats (weight = 2.7-4.6 kg) were used. All animal care and procedures were performed according to National Institutes of Health guidelines and approved by the Institutional Animal Care and Use Committee of Drexel University. Prior to surgery, the cats were acclimated (5 d/wk, 15-20 min/d) to walk quadrupedally on a motorized treadmill at speeds ranging from 0.3 to 0.8 m/s. Kinematics of locomotion were recorded for each speed. The animals’ spinal cords were then transected at the T12 thoracic level to create a 3- to 4-mm cavity and rat fibroblasts (about 20 × 106 cells) producing one type of neurotrophic factor (BDNF or NT-3) were grafted acutely into the spinal transection site. Four cats received BDNF-producing transplants and the other 4 received NT-3-producing transplants (Figure 1). Animals were not trained on the treadmill following transection. To prevent graft rejection, cats were given cyclosporine A (CsA, Sandoz Pharmaceuticals, East Hanover, NJ). Oral doses of 2 mg/kg were administered every 12 hours starting 3 days before transection and continuing for the duration of the study.
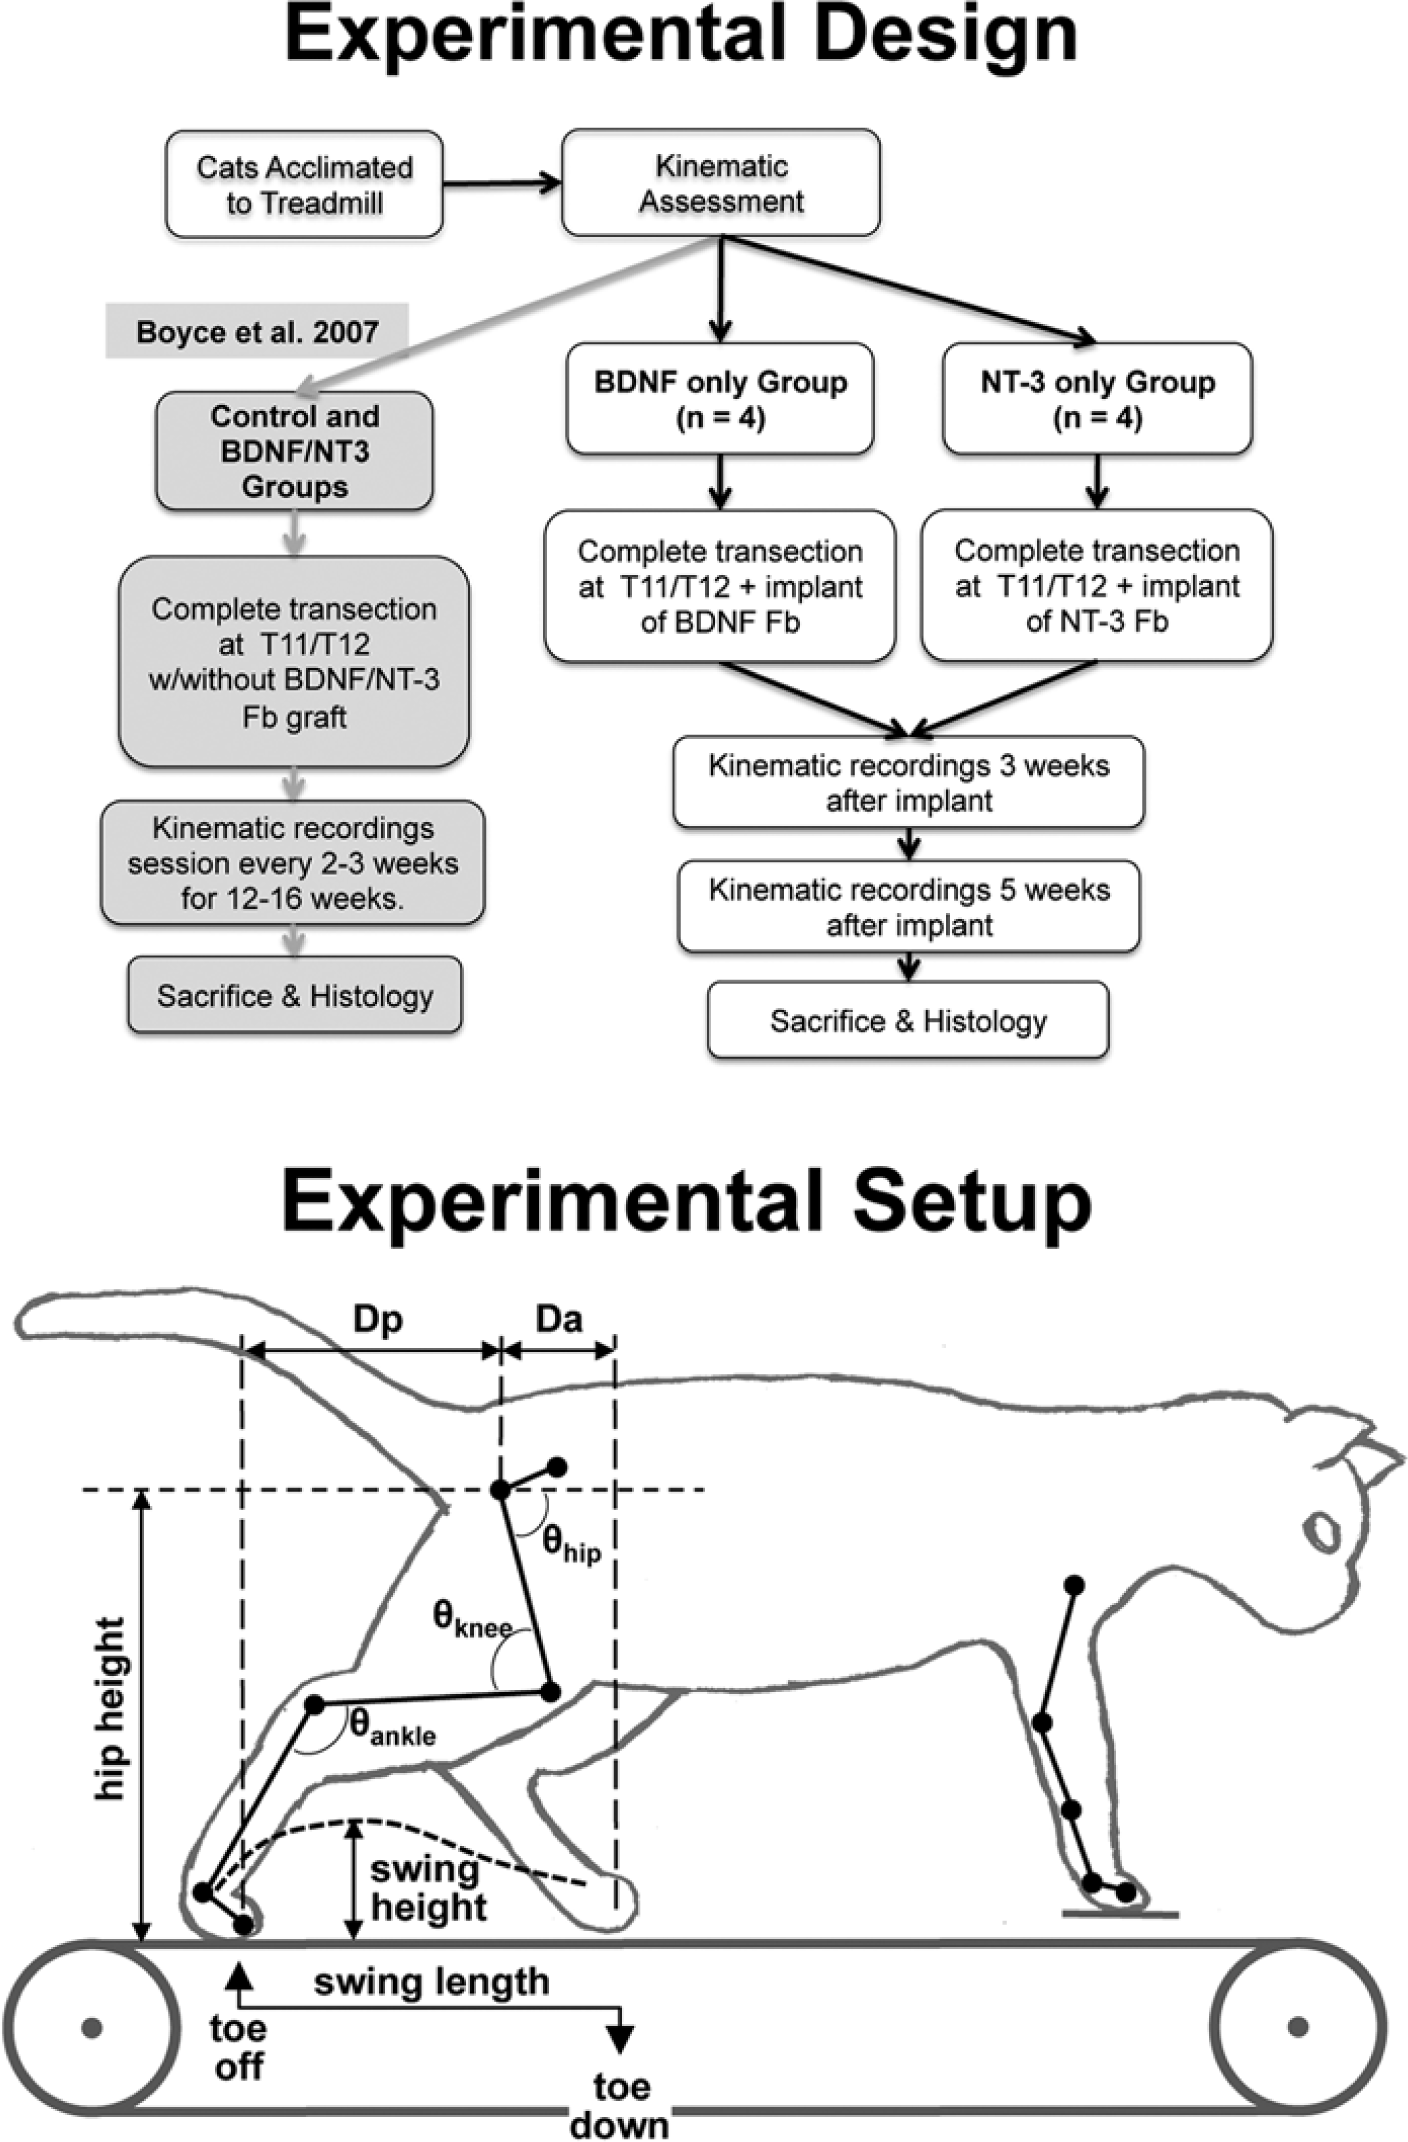
(Top) Experimental timeline for the cats in the study. Animals were acclimated and locomotor kinematics on the treadmill at speed from 0.3 to 0.8 m/s were measured pre-transection. The animals received a transplant of neurotrphin-3 (NT-3) or brain-derived neurotrophic factor (BDNF)-producing fibroblasts at the time of transection and locomotor performance was measured at 3 and 5 weeks post-transection. At the completion of the experiments the animals were perfused and the spinal tissue retrieved for histological analysis. The locomotor recovery obtained in cats receiving no locomotor training and a transplant of either unmodified fibroblasts or a mix of fibroblasts modified to produce either BDNF or NT-31 served as comparison for the locomotor recovery observed in this study. (Bottom) Experimental apparatus showing the marker locations and kinematics measurements used to evaluate locomotor recovery.
At 3 and 5 weeks post-transection and grafting surgery, the hindlimbs’ locomotor capabilities were tested on a treadmill at 6 different speeds (ranging from 0.3 to 0.8 m/s). The forelimbs were stationary, standing on a platform raised 1 cm above the treadmill and a 4-cm high Plexiglas divider was placed between the hindlimbs to prevent scissoring of the limbs during locomotion. The animals’ hindquarters were supported at the tail to provide balance and perineal and/or tail stimulation was used to initiate/maintain stepping. 1 Stimulation was adjusted to optimally elicit stepping in each animal, and typically involved tail crimp and tonic finger pressure on the perineal area. Five weeks was chosen as the study’s endpoint because it has been shown that locomotor recovery reaches a plateau by that time for animals receiving combined BDNF-/NT-3-producing transplants and no locomotor training. 1 At the termination of the experiments, cats were euthanized and perfused transcardially with 4% paraformaldehyde.
Spinal Transection Procedure
Spinal cord transection and cell graft procedures were conducted as in our previous study. 1 A laminectomy was performed over the T11-T12 vertebral bodies. The dura was opened over its midline, xylocaine (1%) was applied to the cord, and it was transected between the T11 and T12 roots using microscissors. 1 The transection cavity was filled with the fibroblast preparation. Analgesics (transdermal fentanyl patch, Duragesic, 25 µg/h, 72 hours) and antibiotics (ampicillin, 250 mg/d, subcutaneous, 10-day course) were administered following surgery. Bladders were expressed manually and reflex defecation was initiated twice daily post-transection.
Fibroblasts Preparation
The procedures for isolation of fibroblasts genetically modified to produce BDNF and NT-3 and the properties of these cells have been described previously. 18 In the 3 first animals tested, the cells were infected using retroviral vectors, 18 while fibroblasts infection was performed using lentiviral vectors (generously provided by Dr A. Blesch 19 ) for the last 5 animals. Neurotrophin production by the cells modified via retroviral or lentiviral vectors was verified using enzyme-linked immunosorbent assay (Promega, Madison, WI) Emax ImmunoAssay System for NT-3; R&D Systems (Minneapolis, MN; DuoSet #DY248 for BDNF) of the supernatant and found to be within the range produced by our previously used cells. 20 On the day of surgery, the fibroblasts were harvested using aseptic techniques21,22 and suspended in 1 mL of Hanks’ buffered salt solution (HBSS). Just before grafting, the solution was centrifuged and the HBSS extracted. The packed cells were then transferred into the cavity site using a glass micropipette. The number of cells implanted (~15 × 106) was within the range previously used. 1
Kinematics Data Collection
Kinematics of the right hindlimb and forelimb were captured at 300 Hz using a motion analysis system (Vicon Motion System, Inc, Denver, CO). Markers were placed on the skin overlying the ischium, femoral head, estimated knee joint center, lateral malleolus, metatarsophalangeal joint, and the tip of the digits of the right hindlimb as well as on the humeral head, estimated elbow joint center, lateral epicondyle, metacarpophalangeal joint, and the tip of the digits of the right forelimb (see details in Boyce et al 1 and Figure 1). An animal was defined as capable of stepping at a given speed when it could successfully execute 10 consecutive steps without stumbling or dorsistepping. Cats were evaluated at increasing treadmill speeds from 0.3 up to 0.8 m/s in increments of 0.1 m/s and the evaluation sessions were limited to 5 to 8 minutes in order to minimize training effects that could occur during these sessions.
Kinematics Data Analysis
The horizontal and vertical positions of each joint marker were exported to Matlab (Mathworks, Natick, MA). Slippage of the knee and elbow markers over the skin was corrected by interpolating their positions. 23 Then, stick figures of the hindlimb marker positions and quantitative data on stepping parameters were extracted in IgorPro (Wavemetrics, Lake Oswego, OR). Swing length and height of the right hindlimb were calculated, as well as stance length. The length of the swing phase was measured as the horizontal distance between toe-lift and touch-down of the right foot marker; stance length was measured as the horizontal distance between touch-down and toe-lift of the right foot marker. The swing height was determined using the maximal vertical displacement of the metatarsophalangeal joint during the swing phase. 1 All parameters were measured before and after transection over repeated steps. Since stance length was never statistically different from swing length (t test between 20 steps average, P > .05) under any of the conditions (pre- or post-transection) or speeds tested, we only report swing length. Post-transection swing length and height were reported as a percentage of their respective pretransection values. They were defined as the swing length index and the swing height index, respectively (Figure 1).
Additional kinematic parameters that were calculated for the 0.4 m/s speed (comfortable walking speed in intact 24 and spinal5,25 cats) at the 3 and 5 week post-transplant time points included Da, the anterior displacement of the foot marker relative to the horizontal position of the hip (femoral head marker) at toe-down, and Dp, the posterior displacement of the foot marker relative to the hip at toe-lift (see Figure 1). The average height of the hip during each step was also calculated. Da, Dp, and hip height were normalized to the averages of those values pretransection (producing Da, Dp, and hip height indices). Hip, knee, and ankle angles were also calculated (Figure 1) and the maxima, minima, and ranges (maximum–minimum) were compared between groups. Additionally, we also measured step cycle duration and the percent of the step cycle (toe-down to toe-down) at which swing initiated. Step cycle duration posttransection was normalized to the average pre-transection step cycle duration and is reported at the cycle duration index.
Finally, the hindlimbs’ interlimb coordination at 5 weeks post-transplant (speed = 0.4 m/s) was measured using analysis of footfall patterns for 10 step cycles. 26 Coordination between the hindlimbs was measured as the variability in the onset of left hindlimb stance with respect to right hindlimb stance. This variability was measured as percentage of the step cycle and compared using t test applied to the difference in average variability for each treatment group.
For all other measures (besides hindlimb coordination), comparisons between groups were made over 20 hindlimb step cycles. Repeated-measure linear mixed models were employed for analysis of variance of the kinematic parameters measured. For the comparisons at multiple time point and speed, the dependent variables were swing length and swing height indexes (one model for each variable) with treatment (BDNF vs NT-3), time post-transection (3 vs 5 weeks) and treadmill speed (0.3-0.8 m/s) and an interaction term (treatment * time * treadmill speed) as fixed effects with time post-transection, treadmill speed and steps within a cat as repeated measures (PASW Statistics, IBM SPSS Inc, Armonk, NY). Post hoc pairwise comparisons (with Bonferroni adjustment for multiple comparisons) of the estimated marginal means of the models were used to assess the significance of the differences between groups for the parameters with a significant effect on model output. All models with step (from 1 to 20) as a fixed effect showed no significant differences within steps and therefore step was not used as a fixed effect. Models using the 20 steps averages of the swing length or height indexes gave the same results as the models using the individual steps as repeated measures.
The kinematic parameters compared at a single speed (Da index, Dp index, hip height index, cycle duration index, percentage of cycle at swing onset, angles minima, angles maxima, angles ranges) were also compared using repeated-measure linear mixed models. The parameter of interest was each of the dependent variable (one model per variable) with treatment (BDNF vs NT-3), time post-transection (3 vs 5 weeks) and an interaction term (treatment * time) as fixed effects with time post-transection and steps within a cat as repeated measures. Post hoc pairwise comparisons (with Bonferroni adjustment for multiple comparisons) of the estimated marginal means of the models were again used to assess the significance of the differences between groups for the parameters with a significant effect on model output.
All values, unless otherwise stated, are reported as means ± standard deviations (SDs).
Tissue Preparation, Histological Staining, and Lesion Verification
At the conclusion of the experiments, the animals were euthanized and intracardially perfused with 0.9% saline flush followed by ice-cold 4% paraformaldehyde. The thoracic and lumbosacral cord were prepared and embedded using standard histological techniques. 1 The cord was cut into 25-µm thick transverse sections and mounted in series. The mounted slides were air dried at room temperature for 2 hours, and then stored at −20°C until staining was performed. To verify lesion completeness, every seventh slide in the lesion-transplant series was stained for Nissl-myelin as described in Boyce et al. 1 The stained sections were examined using light microscopy for the presence of myelinated fibers clustered at the lateral edges of the graft, which would indicate an incomplete lesion and sparing of white matter pathways.
Results
Locomotor Recovery Occurs With Either BDNF or NT-3
With either type of neurotrophin-producing transplant, most cats executed plantar weight-bearing steps at all treadmill speed(s) tested (0.3-0.8 m/s) by 5 weeks post-transection (a phenomenon that never occurred with animals receiving no training or neurotrophin-producing transplant 1 ). An illustration of the right hindlimb kinematics during locomotion for a representative cat from each group is presented in Figure 2. Kinematics of stepping was similar in all cats pre-transection. At 3 weeks post-transection, 3 of the 4 animals with BDNF-producing transplants and 1 of the 4 animals with NT-3-producing transplants executed plantar weight-bearing steps (Figure 3) at all treadmill speeds tested (0.3-0.8 m/s) and by 5 weeks post-transection 3 of the 4 animals in each group stepped at 0.8 m/s. In each group, 1 cat did not recover up to the highest speed tested (0.8 m/s). In the BDNF group, 1 cat did not step at any speed at 3 weeks post-transection and did not step faster than 0.4 m/s at 5 weeks, while in the NT-3 group 1 animal did not step faster than 0.5 m/s at 5 weeks post-transection after stepping only up to 0.3 m/s at 3 weeks post-transection (Figure 3). In both cases, the animals showed poor survival of the transplants as assessed by an experienced neuroanatomist (JDH) blind to the animal’s locomotor performance.
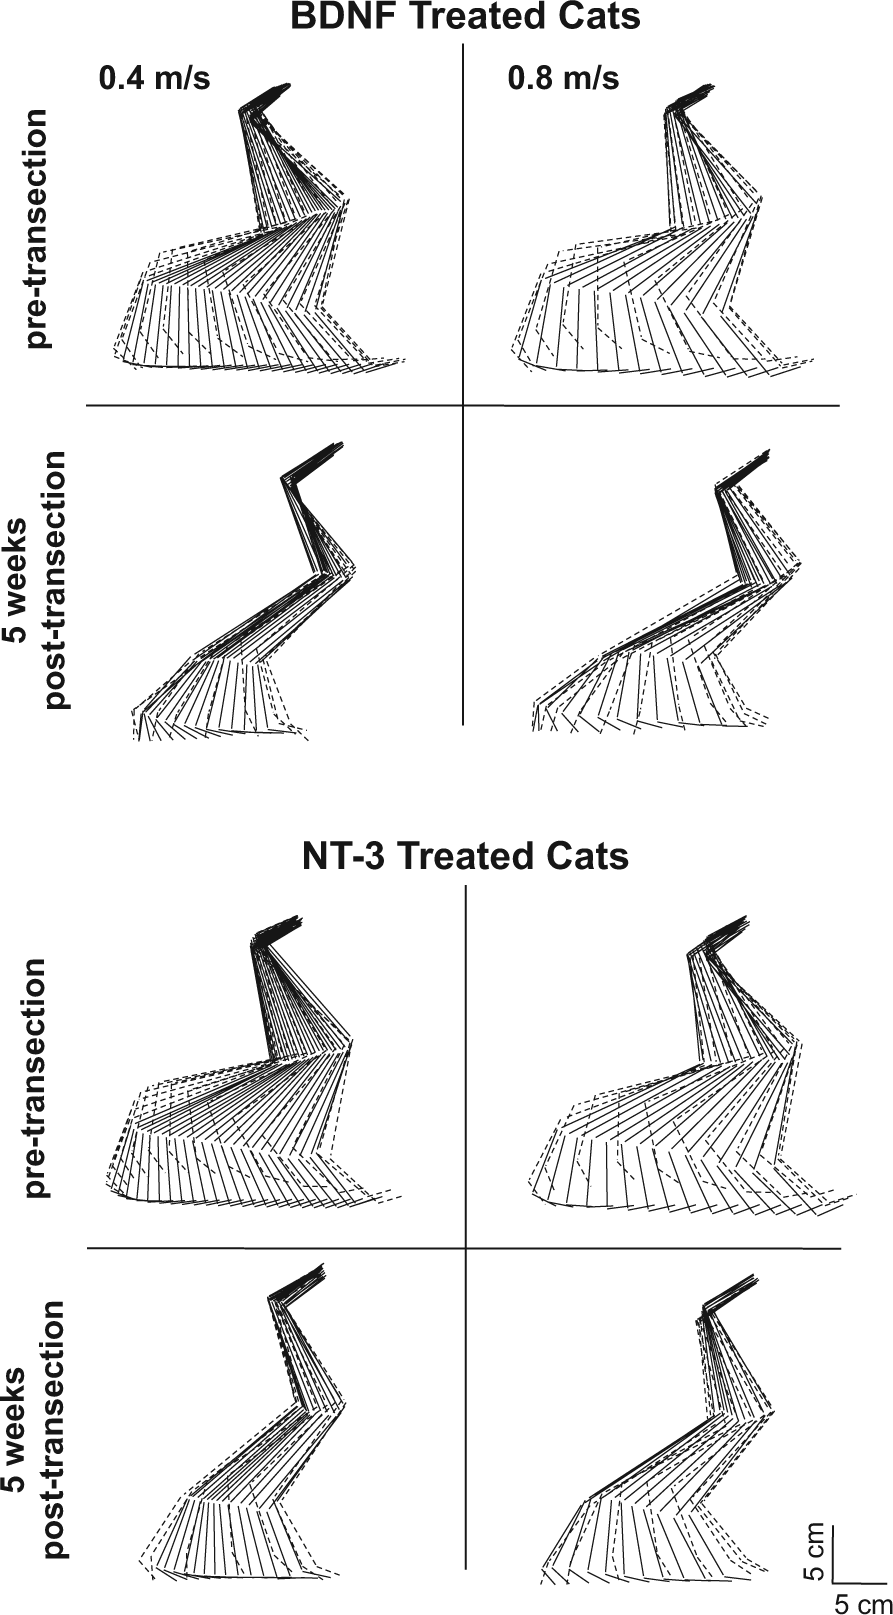
“Stick diagram” representations of the pre- and post-transection (5 weeks) hindlimb kinematics for one step of a representative cat from both groups (neurotrophin-3 [NT-3] and brain-derived neurotrophic factor [BDNF]) at 2 different treadmill speeds: 0.4 and 0.8 m/s. The position of the hindlimb is presented as stick figures throughout the step cycle at 30-ms intervals. Both cats showed similar stepping characteristics with good plantar weight-bearing stepping at all the speed tested but with reduced swing length and height. Solid lines, stance portion of the step; dashed lines, swing portion of the step.
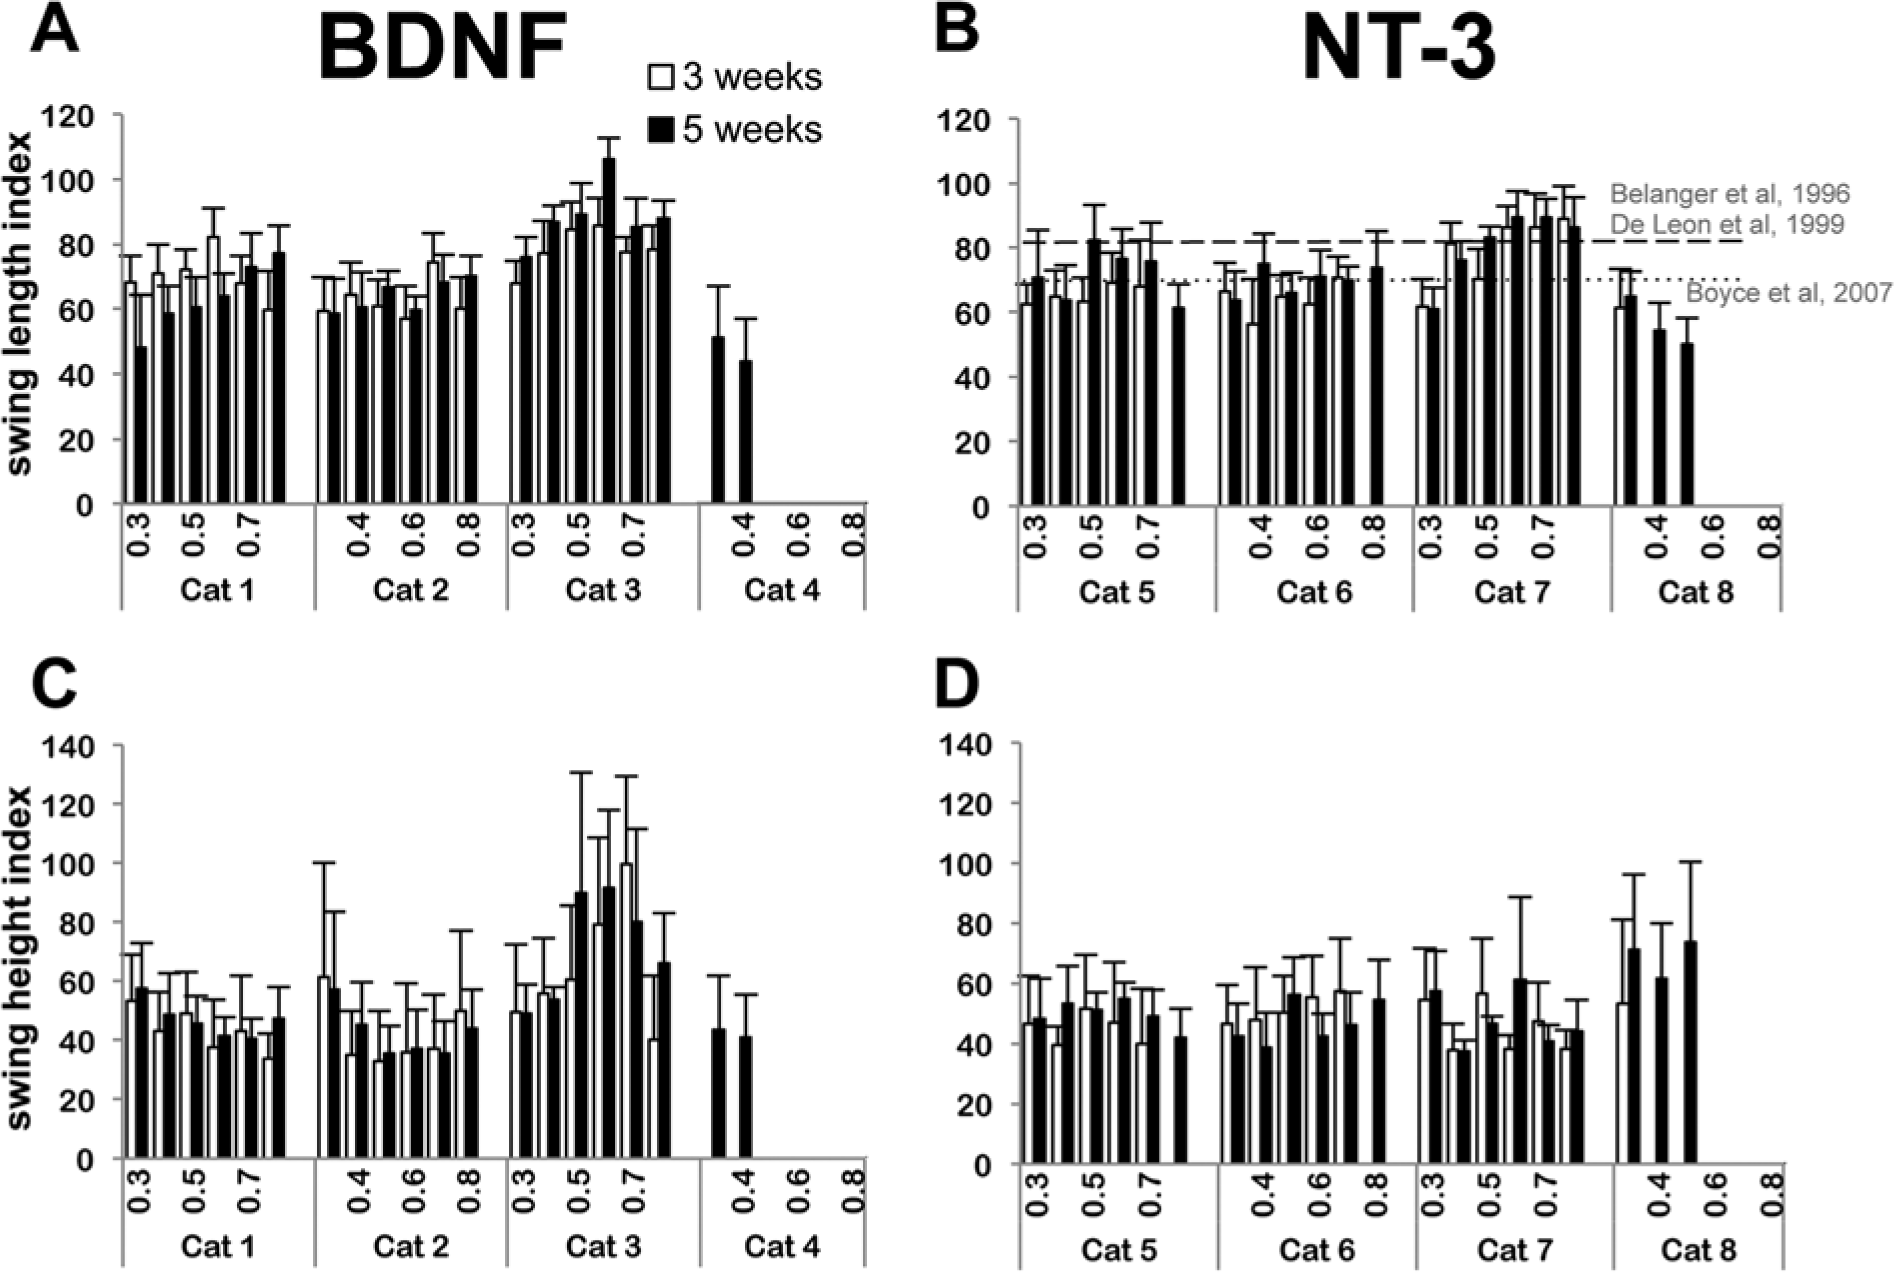
Post-transection (3 and 5 weeks) swing length and swing height index for all cats at the 6 treadmill speeds tested (0.3-0.8 m/s). (A) Swing length index for the brain-derived neurotrophic factor (BDNF) cats. (B) Swing length index for the neurotrophin-3 (NT-3) cats. (C) Swing height index for the BDNF cats. (D) Swing height index for the NT-3 cats. Data were normalized with pretransection values for each cat. In both groups, most cats were able to locomote with plantar weight-bearing steps at speeds up to 0.8 m/s by 5 weeks post-transection. However, 1 cat in each group did not recover. Number of steps n = 20 for each situation. Data are mean ± standard deviation of the 20 steps for each cat. Recovery in swing length index obtained with body weight–supported locomotor training is indicated by a dashed line in panel B (Belanger et al 5 /De Leon et al 27 ), while the recovery obtained with transplant producing both neurotrophins but no locomotor training is indicated by a dotted line (Boyce et al 1 ).
Neurotrophin Type, Time Post-injury, and Treadmill Speed Effects
Average swing length and swing height at the 2 time points post-injury and at the 6 treadmill speeds tested are shown for the individual cats in Figure 3A-D. The ratios of post- versus pre-transection swing lengths or swing heights (swing indexes) were used to quantitatively assess stepping. Only data of cats 1, 2, and 3 for the BDNF group and cats 5, 6, and 7 for the NT-3 group were used in the mixed models, since cats 4 and 8 did not recover, which we attributed to poor graft survival. The linear mixed model for swing length showed no significant effect for neurotrophin type on the recovery of swing length; a similar lack of significant effect for neurotrophin type on swing height was also obtained. Time post-injury, treadmill speed, and the 3-way interaction term had a significant effect on both swing length and swing height. Swing length and height increased with time post-injury. When using the average swing length and height indexes, the interaction term was no longer a significant factor in either mixed linear models and time post-injury was not a significant factor for swing length index. Overall, these results indicate that stepping recovery was similar in both step length and height with either single neurotrophin treatment.
Recovery Time Course for BDNF Versus NT-3 Only Producing Grafts
Overall averages for all the steps analyzed were calculated for 2 different speeds: a medium speed (0.4 m/s) and maximal speed (0.8 m/s) and the average swing length and swing height indexes are shown in Figure 4A and B. To estimate if the differences between average indexes were statistically significant we used the estimated marginal means of the linear models of swing length and height indexes and considered the differences significant if the 95% confidence estimate of the means did not overlap.
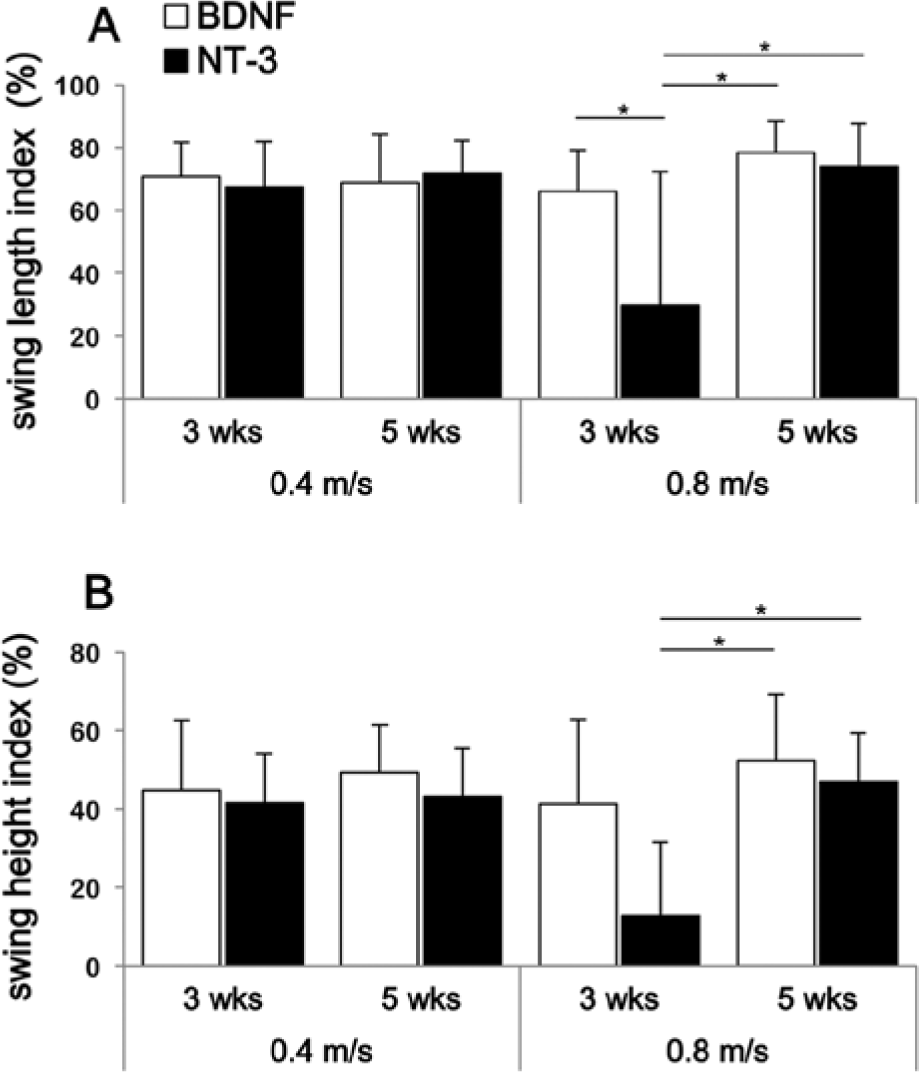
Average post-transection swing length (A) and height (B) indexes for both groups (brain-derived neurotrophic factor [BDNF] and neurotrophin-3 [NT-3]). Averages of 3 cats per group were calculated for 2 different treadmill speeds (0.4 and 0.8 m/s) at 3 and 5 weeks post-transection. Number of steps n = 60 for each situation, and data represent mean ± standard deviation. The 95% confidence interval of the estimated marginal means of the linear mixed model of swing length and height overlap in most conditions except where indicated (ie, at 0.8 m/s treadmill speed) where recovery of swing length and height is shown to be slower for the NT-3-treated animals.
The swing length index was about 70% of pre-transection level for both treatment groups at 5 weeks and 0.4 m/s (BDNF = 69% ± 15%; NT-3 = 72% ± 10%; Figure 3A). In comparison, Belanger et al 5 obtained a recovery of about 81% (n = 4) while De Leon et al 27 obtained a recovery of about 82% (n = 7) in spinal cats locomotor trained for 6 to 12 weeks (Figure 3B). Both investigators used bipedal stepping and similar speeds for their evaluations. For further comparison, Boyce et al 1 obtained a recovery of about 70% in animals that received transplants producing both neurotrophins and walking quadrupedally on the treadmill (Figure 3B). The only statistical difference between our 2 treatment groups was observed for a speed of 0.8 m/s at 3 weeks where 2 out of 3 cats treated with NT-3-producing cells were not capable of stepping at this speed. As a result, the estimated marginal mean for swing length index was lower than at 5 weeks for the NT-3-treated cats. This result suggests that recovery of stepping may be slower with NT-3 compared with BDNF. However, there was no difference between these two groups at 5 weeks for this same speed (BDNF = 78% ± 10 %; NT-3 = 74% ± 14%; 95% confidence intervals of the estimated marginal means overlapped). In addition, there was no statistical difference at either time points between the treatment groups at the medium speed (0.4 m/s). The difference in time course of recovery between the 2 treatment groups (BDNF vs NT-3) was only apparent at the highest speed tested (0.8 m/s).
Results for the time course of recovery were similar for the swing height index, although the recovery in swing height was more limited than for swing length. The swing height index was found to be about 46% of pretransection level for both groups at 5 weeks and 0.4 m/s (BDNF = 49% ± 12%; NT-3 = 43% ± 12%; Figure 4B). Here again, the only difference between treatment groups was observed for the high speed (0.8 m/s) where recovery at 3 weeks was lower for the NT-3 transplant animals. However, this difference disappeared at 5 weeks where both groups showed similar recovery (BDNF = 53% ± 17%; NT-3 = 47% ± 12%; 95% confidence intervals of estimated marginal means overlap).
Treadmill Speed Effect on Swing Length and Height
The analysis of variance with linear mixed models indicated an effect of speed on swing length and height indexes but this effect was rather small as shown in Figure 5. There was an increase in both swing length and height as speed increased, except at the maximal speed at 3 weeks post-injury where it dropped for the NT-3 group because one animal did not recover locomotion at that speed until week 5. Analysis of the estimated marginal means indicate that this is the only speed where confidence intervals of swing length and height indexes do not overlap with the indexes at the lower speeds. Overall, the results indicate that swing length and height varied little in the 0.3- to 0.8-m/s velocity range, which is similar to what has been observed with intact cats walking on a treadmill at those speeds. 28
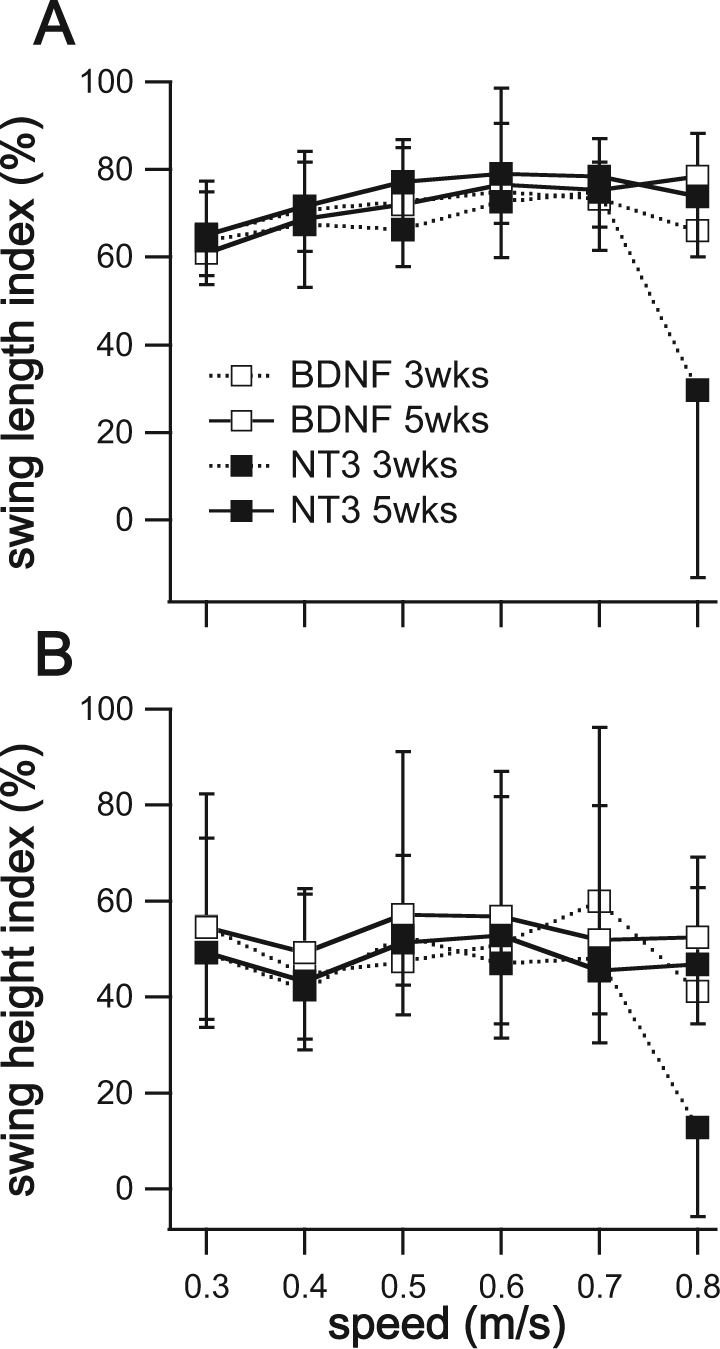
Swing length (A) and swing height (B) indexes for each group as a function of speed and time post-transection. Swing length index increased slightly in the range of speed studied while swing height index was essentially constant. The only index that was significantly lower than the other was the swing length or height for the neurotrophin-3 (NT-3)-treated group at 3 weeks post-transection and at the highest speed tested (95% confidence interval of the estimated marginal mean for that point did not overlap with the intervals of the others, linear mixed model analysis of swing length or height indexes).
Effects of Neurotrophin Type on Other Kinematic Parameters for a 0.4 m/s Speed of Walking
The linear mixed models for sessions at 3 and 5 weeks post-injury (speed 0.4 m/s) indicated an effect for time, treatment or their interaction on a number of variables (Da index, Dp index, minimum hip and ankle angles for group; various joint angles for time; joint angles along with Dp and hip height indices as well as the percentage of cycle at swing onset for the time * treatment interaction term). Nevertheless, only 3 of the variables of interest showed significant differences: ankle yielded more significantly for BDNF treated cats during stance (5° more ankle flexion for the BDNF cats) and also yielded less at 5 weeks compared with 3 weeks (5° difference). Finally, hip flexion was significantly greater at 5 weeks by about 5°.
Using only the data at 5 weeks post-transection (linear mixed model with treatment group as factor) we found only the difference in % of cycle at swing onset to be significantly different. All the other locomotion kinematic parameters showed no significant differences between cats receiving BNDF- or NT-3-producing transplants by 5 weeks post-transection. Data for Da, Dp, hip height and cycle duration indices as well as percentage of cycle at swing onset and the various joint angles at 5 weeks posttransection are presented in Figure 6 for each of the individual cats. Variability in the stance onset between hindlimbs was about 5% of the step cycle (as found previously in cats treated with both neurotrophins or body weight–supported, locomotor trained 1 ) and not statistically different for cats treated with BDNF versus cats treated with NT-3 (t test, P > .05).
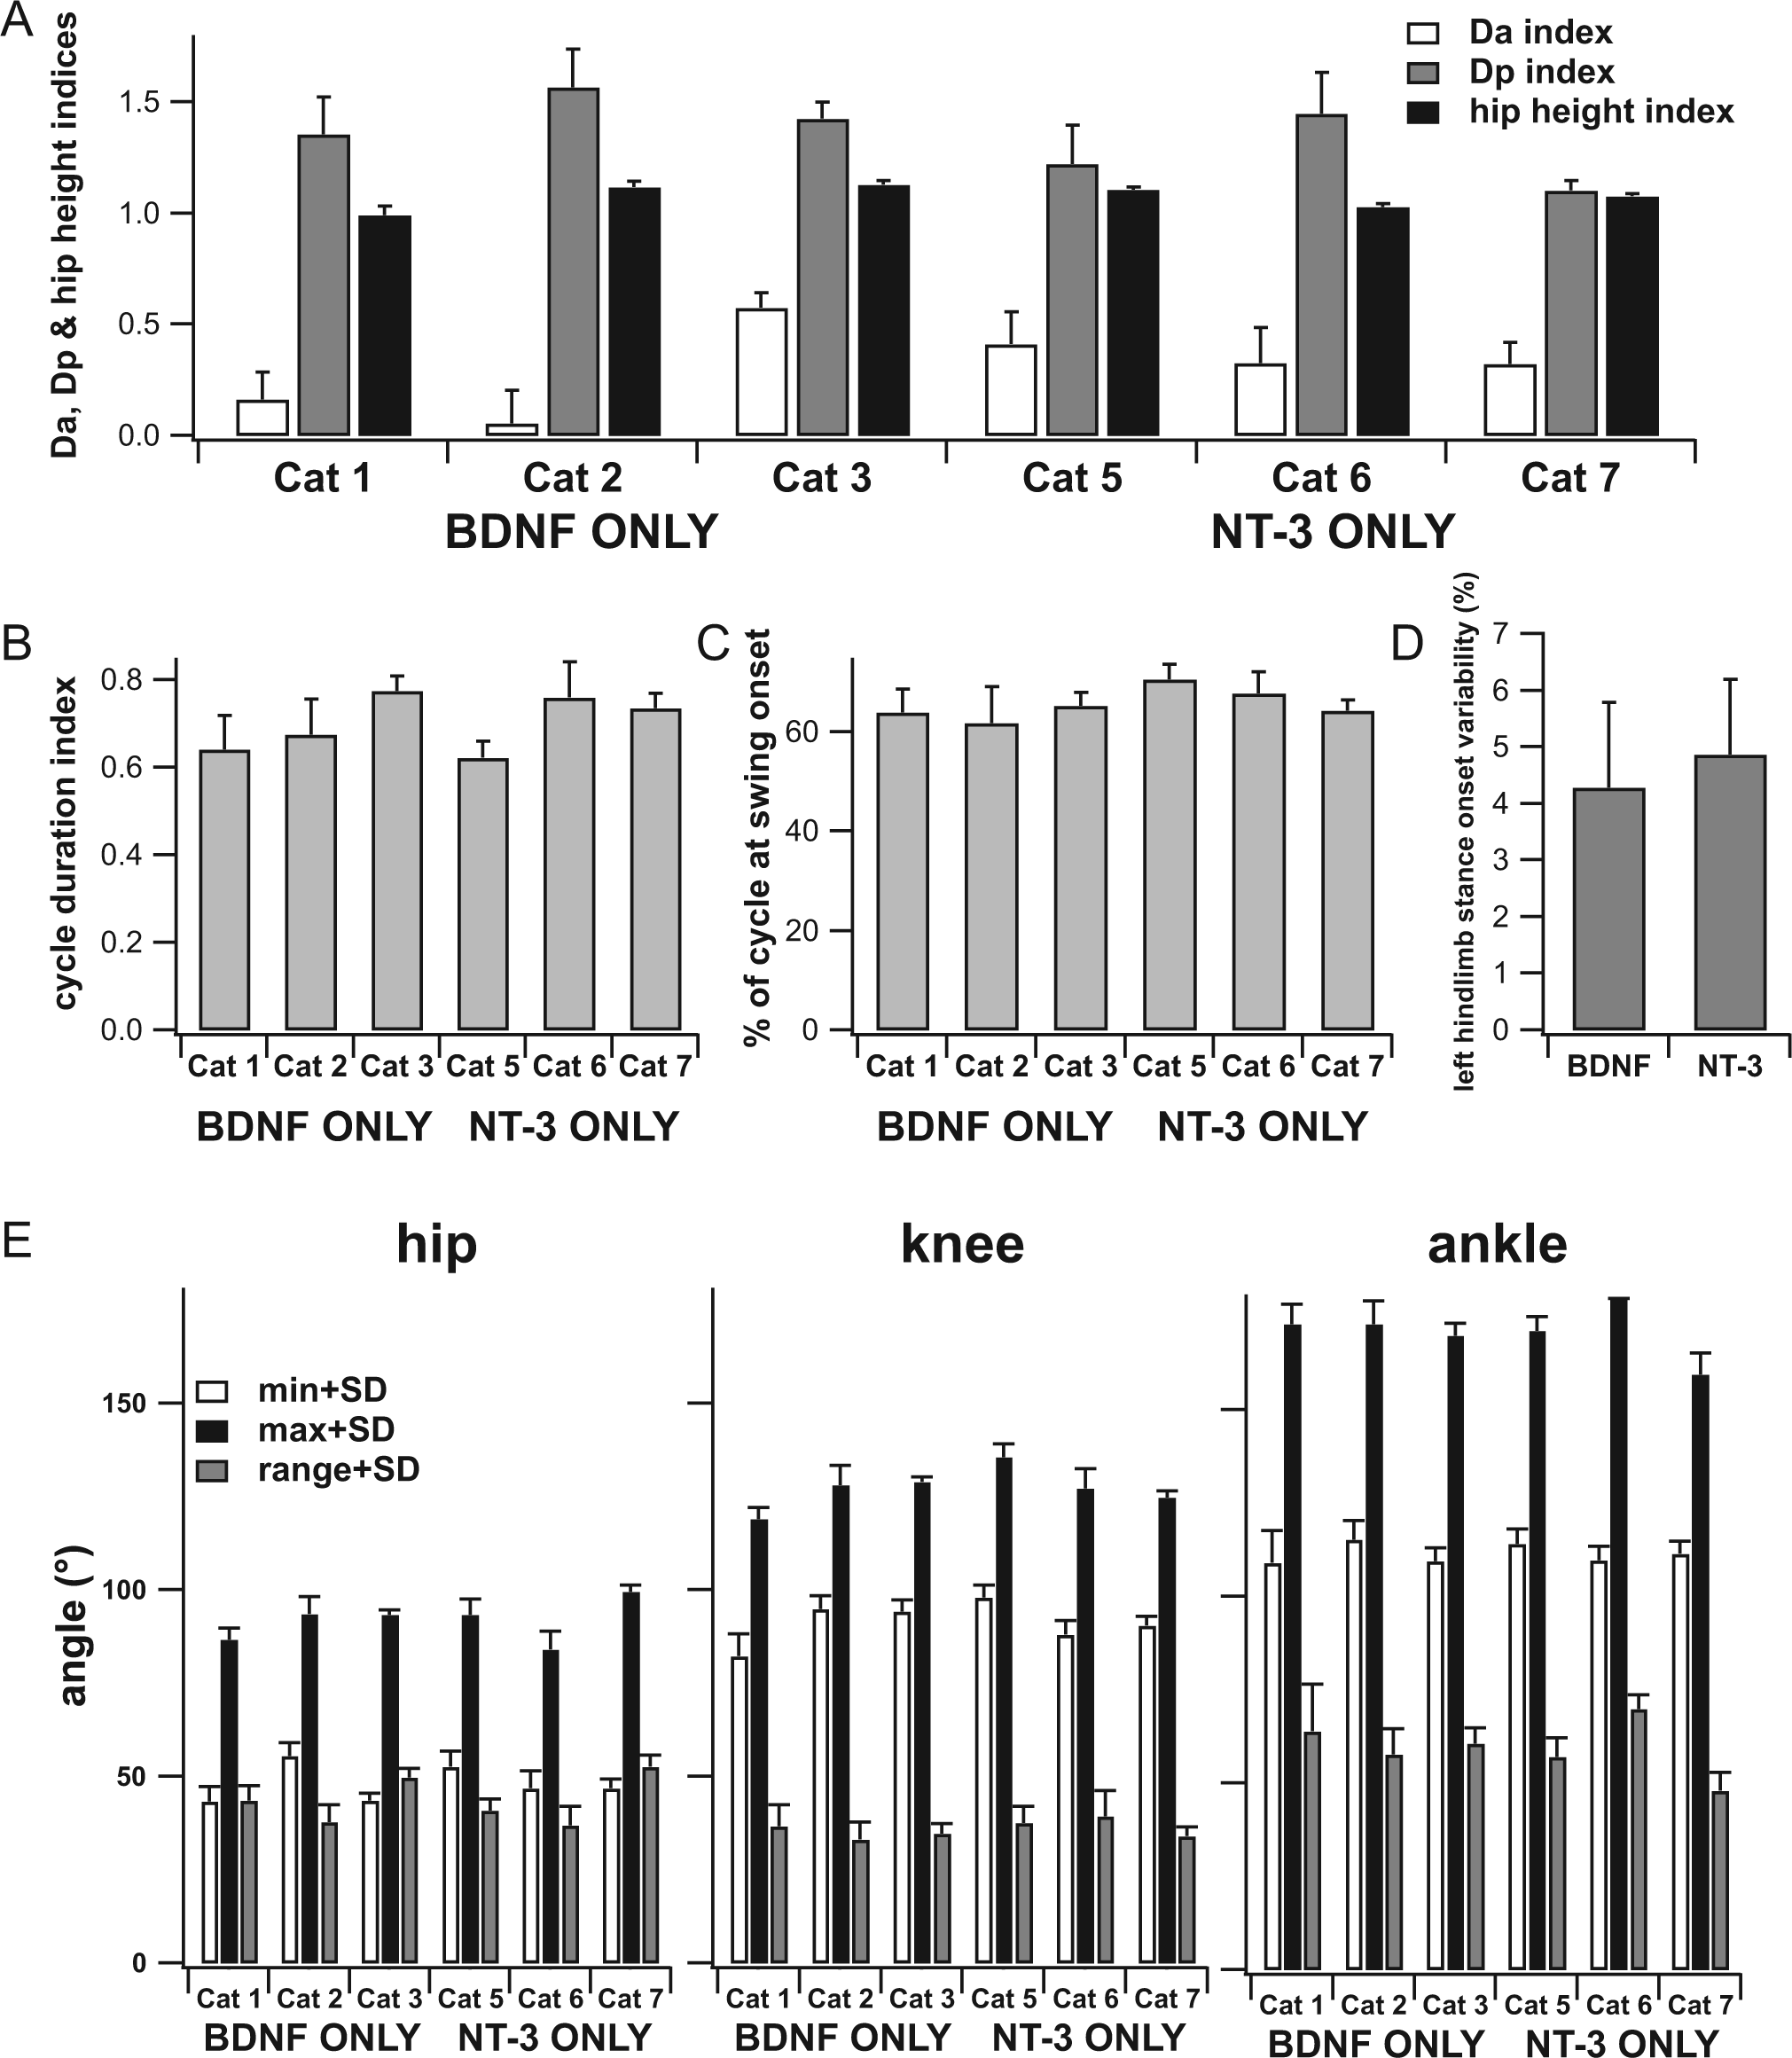
Kinematics of gait for each individual cat at 5 weeks post-transection for a treadmill speed of 0.4 m/s. (A) Da (anterior foot placement), Dp (posterior foot placement), and hip height indices. (B) Step cycle duration index. (C) Percentage of step cycle at which swing onset occurs (cycle define as stance onset to stance onset). (D) Variability in left hindlimb stance onset with respect to right hindlimb stance onset as percentage of the step cycle. (E) Maxima, minima, and ranges for the hip, knee, and ankle angles. Data are mean ± standard deviations of 20 steps for each cat, except for D where 10 steps were used.
Discussion
Single Neurotrophin (BDNF or NT-3) Versus Dual Neurotrophin (BDNF and NT-3)
In this study, we followed the same protocol as Boyce et al, 1 where a mix of BDNF- and NT-3-producing cells were used, to compare our results. First, swing length index for the cats that received combined BDNF- and NT-3-producing transplant was 70% of normal in the study by Boyce et al 1 while it was 69% for the BDNF-only cats and 72% for the NT-3-only cats (at 0.4 m/s), thus yielding essentially identical results. Our results also compared favorably with results obtained with body weight–supported treadmill training5,27 (Figure 3). Animals that received transplants of unmodified rat fibroblasts and no training never recovered the ability to plantar step with weight bearing. 1 The limited-to-absent plantar weight-bearing treadmill stepping capabilities of untrained adult transected spinal cats has been demonstrated in a number of laboratories for both quadrupedal and bipedal conditions.4,6,25,29 With either neurotrophin-producing (BDNF or NT-3) graft, we observed recovery of plantar weight-bearing stepping at speeds up to 0.8 m/s in the absence of locomotor training.
BNDF or NT-3 in Rats Versus BDNF or NT-3 in Cats
A recent study by Boyce et al 2 showed recovery with either type of neurotrophins in the spinal rat, but with some important differences. In their study, adeno-associated virus constructs were used to deliver either BDNF or NT-3 to the thoracic lesion site of spinally transected rats. They observed recovery of plantar weight-bearing stepping during overground locomotion (balance provided by side walls of the runway) for the animals receiving BDNF neurotrophin, while NT-3-recipient animals were only capable of treadmill locomotion with continual perineal stimulation delivery. Step length was also significantly lower in rats receiving NT-3 compared with rats receiving BDNF. In our study, swing length and height recovery was similar for our 2 groups, and qualitative analysis of the amount of perineal stimulation given (through analysis of the video footage) did not suggest that cats receiving NT-3-producing transplants required a greater amount of perineal stimulation to achieve plantar weight-bearing stepping. While “spastic-like” symptoms were observed in the BDNF recipient rats, 2 we did not observe heightened spasticity in our animals. This difference may be a result of the continual production of neurotrophins with the viral constructs while neurotrophin production is known to down-regulate with the cellular transplants used in our study. 21
Effect of Neurotrophins on Spinal Circuitry
Locomotor recovery occurs too early (by 3 weeks) after transection in cats receiving a neurotrophin transplant to be attributed to regeneration of descending axons. The likelihood is that BDNF or NT-3 affects the lumbar spinal circuitry. Although diffusion of the neurotrophins away from the transplant and into spinal tissue is limited, 3 the neurotrophic factors secreted by the transplanted fibroblasts at T11/T12 could be transported retrogradely or anterogradely2,30 -32 to the lumbar spinal cord to induce structural and/or functional plasticity.
In addition to their roles in axonal growth, both neurotrophins are also involved in synaptic plasticity, although the effects are different for NT-3 and BDNF suggesting that different synapses may be involved for the 2 groups.2,16,17,33 The 2012 study by Boyce et al 2 showed an increase in activity (c-fos staining of the lumbar cord) of the lumbar interneuronal population in the neurotrophin-treated rats, demonstrating that changes in interneuronal activity are likely involved in the recovery of the stepping pattern. Histological attempts to demonstrate elevated c-fos expression in the lumbar interneuronal population in our cats using our standard rat staining protocol 34 were unsuccessful.
Simulation studies with a simple neuromechanical model of the cat hindlimb has shown that increases in the neural locomotor model synaptic strengths similar to the ones seen with neurotrophin administration are sufficient to restore locomotor capability to the system. 9 Synaptic plasticity of propriospinal, sensory and other interneurons thus remains a potential mechanism by which neurotrophins restore locomotor capabilities in spinal rats and cats.
Footnotes
Declaration of Conflicting Interests
The author(s) declared no potential conflicts of interest with respect to the research, authorship, and/or publication of this article.
Funding
The author(s) disclosed receipt of the following financial support for the research, authorship, and/or publication of this article: This research was supported by National Institute of Neurological Disorders and Stroke Grants NIH NS055976, NS048844, and NS007440 (postdoctoral training grant to K. Ollivier-Lanvin).