
Abstract
Background. Abnormal task-related activation in primary motor cortices (M1) has been consistently found in functional imaging studies of subcortical stroke. Whether the abnormal activations are associated with neuronal alterations in the same or homologous area is not known. Objective. Our goal was to establish the relationships between M1 measures of motor-task-related activation and a neuronal marker, N-acetylaspartate (NAA), in patients with severe to mild hemiparesis. Methods. A total of 18 survivors of an ischemic subcortical stroke (confirmed on T2-weighted images) at more than six months post-onset and 16 age- and sex-matched right-handed healthy controls underwent functional MRI during a handgrip task (impaired hand in patients, dominant hand in controls) and proton magnetic resonance spectroscopy (1H-MRS) imaging. Spatial extent and magnitude of blood oxygen level–dependent response (or activation) and NAA levels were measured in each M1. Relationships between activation and NAA were determined. Results. Compared with controls, patients had a greater extent of contralesional (ipsilateral to impaired hand, P < .001) activation and a higher magnitude of activation and lower NAA in both ipsilesional (P = .008 and P < .001, respectively) and contralesional (P < .0001, P < .05) M1. There were significant negative correlations between extent of activation and NAA in each M1 (P = .02) and a trend between contralesional activation and ipsilesional NAA (P = .08) in patients but not in controls. Conclusions. Our results suggest that after stroke greater neuronal recruitment could be a compensatory response to lower neuronal metabolism. Thus, dual-modality imaging may be a powerful tool for providing complementary probes of post-stroke brain reorganization.
Introduction
Stroke remains the leading cause of motor disability among adults. 1 A major contributor to disability is persistent arm/hand motor impairment. 2 During movements of the impaired arm, stroke survivors show altered brain activation patterns in both hemispheres on functional imaging studies. Specifically, execution of simple movements with the impaired arm is associated with increased activation in the ipsilesional (same as the stroke) nonmotor areas, 3 contralesional (opposite to the stroke) motor areas,4-6 and bilateral premotor areas.5,7 Successful recovery occurs in patients who return to relatively normal patterns of brain activation, whereas patients who show persistent bilateral cortical activation typically have poorer recovery.8,9
Although the normalization of activation in the ipsilesional M1 (iM1) is generally associated with return of arm motor function,9-11 the relationship between contralesional M1 (cM1) activation and arm motor recovery remains under debate. Studies using transcranial magnetic stimulation12-14 or cathodal transcranial direct current stimulation15,16 suggest that cM1 is recruited to compensate for damaged crossed pathways. 17 Some argue that the cM1 recruitment reflects the recruitment of uncrossed pathways,4,18 although there is no evidence that contralesional activation represents firing of uncrossed corticospinal tract fibers, which would be expected to involve proximal rather than distal movements. 19 Contralesional M1 recruitment might also represent an epiphenomenon reflecting either a diffuse recruitment of the motor networks driven by higher-order areas during a task performance 18 or a dendritic overgrowth caused by overuse of the healthy hand. Hence although the exact role of cM1 in recovery remains elusive, interactions between cM1 and iM1 are likely to be critical for motor recovery, particularly in patients with poor recovery.5,20-22
Although the neural mechanisms underlying the M1 functional changes after stroke remain largely unknown, noninvasive proton magnetic resonance spectroscopy studies have found lower M1 levels of N-acetylaspartate (NAA), particularly in the ipsilesional hemisphere.23-26 Though the precise biological functions remain uncertain, reduced NAA levels are thought to index neuronal loss, dysfunction, or both. 27 This suggests that changes in activation of the M1 may be a consequence of, or a compensation for, an underlying neuronal impairment. 28 However, no study to date has acquired these measures within the same area in the same patient.
In the present study, we sought to clarify the neural basis underlying the activation changes seen in chronic subcortical stroke using a combined functional magnetic resonance imaging (fMRI) and 1 H-MRS approach. We focused primarily on the primary motor cortex (M1), given previous evidence of its major involvement in motor recovery after stroke.9-11 For the fMRI paradigm, we used the handgrip task that has been shown to robustly activate M1.5,26 We then acquired 1 H-MRS measures from the activated M1 regions. Based on previous work, we hypothesized that patients would show increased handgrip-related activation, particularly in cM1, and decreased NAA levels in both M1s. We also determined the relationships between activation and NAA within and between M1s. We hypothesized that inverse relationships would constitute evidence in support of compensatory M1 activation driven by a neuronal impairment.
Methods
Participants
A total of 18 right-handed stroke patients and 16 right-handed healthy controls provided written informed consent to this study, which was approved by the institutional ethics committee. Of these, 11 patients and 10 controls participated in an earlier study that explored M1 neurochemical levels. 26
Patients were required to have had a first-ever ischemic subcortical stroke at least six months previously, have M1 intact on T2-weighted MRI, and be able to perform a handgrip task (Fugl-Meyer Upper Extremity Scale [FMUE] ≥ 10). Patients were also required to understand simple instructions (Token test) and have no visual attention deficits (Cancellation test), apraxia (clinical observation of the use of scissors to cut paper and making coffee), or other neurological or psychiatric diseases. Patients were on antihypertensive (75%), cholesterol-lowering (62%), and/or antiplatelet (81%) therapy but were not receiving rehabilitation treatment.
Age-, sex-, and education-matched healthy controls, without neurological or psychiatric disorders, participated.
Patients attended an initial screening session to assess arm motor impairment using FMUE (where a score of 66 indicates no impairment 29 ). All participants completed one MRI session, including brain structural, functional, and 1 H-MRS imaging (3T Allegra MR system, Siemens Medical Solutions, Erlangen, Germany). The total duration for the MRI session was about 45 minutes. Full details of the MRI protocol appear elsewhere.26,30
Structural MRI
Two structural data sets were acquired, T1-weighted structural (repetition time [TR] = 2300 ms; echo time [TE] = 3 ms; field of view [FOV]= 240 mm; matrix = 256 × 256; resolution = 1 × 1 × 1 mm3) and T2-weighted structural (TR = 4800 ms; TE1/TE2 = 18/106 ms; FOV = 240 mm; matrix = 256 × 256; slice thickness = 5 mm, no gap), to (1) confirm lesion location. Lesions were defined as tissue having an abnormal high signal on T2-weighted images and as subcortical if they included >50% of subcortical tissue 31 ; (2) exclude other pathological conditions; (3) estimate the brain tissue volume in spectroscopic voxels (see below); (4) quantify lesion volume. We manually traced the lesion slice by slice on axial T2-weigthed images (MedINRIA, Cedex, France, http://www-sop.inria.fr/asclepios/software/MedINRIA/) and estimated the lesion volume using MIPAV (http://mipav.cit.nih.gov/); (5) identify white matter hyperintensities (Fazekas scale 32 : range 0 to 3, 0 and 1 being considered normal in elderly people); and (6) estimate global gray matter volume (SIENAX 33 ).
Functional MRI
Blood oxygenation level-dependent (BOLD; TR = 2000 ms; TE = 50 ms; 25 slices; slice thickness = 5 mm; 0 skip; 100 data points; resolution: 5 × 5 mm2) data were acquired while performing a visually cued handgrip, as described previously.26,30 For this task, we used an MRI-compatible device, consisting of an air-filled polymer bulb connected to a pressure transducer (placed outside of the scanner field). During the handgrip, pressure values were detected by transducer and presented graphically to the participant (LabVIEW 7.1, National Instruments, TX). Patients performed the task with the impaired hand, and controls used the right (dominant) hand. Because the ability to perform handgrip returns earlier than fractioned finger movements, 34 the handgrip task is well suited to study patients with a wide range of recovery. Thus, we were able to study patients with mild to severe hemiparesis.
Each participant’s maximal voluntary contraction (MVC) on the handgrip task was measured outside the scanner. Participants generated MVC on three 5-s trials; the highest peak pressure produced was used as the MVC. Outside the scanner and during scanning, a target pressure of 25% of MVC was displayed graphically while participants performed the handgrip task. This target pressure was used to control for effort across all participants. On reaching the target pressure, the grip was released. Practice outside the scanner (n=5 trials) minimized unwanted movements and made the participant comfortable with the task.
During scanning, we used a block design consisting of 2 alternating conditions: movement and rest. In the movement condition, each handgrip was cued by the appearance of the word “MOVE.” In the resting condition, participants were instructed (by the word cue “STOP”) to remain motionless. The word cue was repeated 5 times, every 4 s, for each condition (20 s each), and the run consisted of 25 cued events (handgrip) and 25 null events (1 run = 3 minutes 28 s).
BOLD data analysis was performed off-line using Brain Voyager software (Brain Innovation BV, Maastricht, Netherlands). The first 2 volumes of each scan were discarded to avoid T1 saturation effects. Preprocessing included motion correction using rigid body transformation, estimating 6 parameters (3 translational and 3 rotational). We inspected these parameters and found that none of the participants moved their head more than 2 mm in any direction; spatial smoothing was done using a 4-mm Gaussian filter to permit valid statistical inferences based on Gaussian random field theory; mean-based intensity normalization of all volumes was done by the same factor; and high-pass temporal filtering at 0.01 Hz was done to remove low-frequency confounds.
Without knowledge of the activation patterns, M1 was outlined on the coincident T1-weighted image using standard sulcal and gyral landmarks, namely, the anterior bank of the central sulcus with the caudal border lying in the depth of the central sulcus close to its fundus and anterior border abutting the Brodmann area 6 35 , and the total number of voxels was counted for each M1. We then counted the activated voxels in M1 using a Bonferroni corrected P = .01 (see below). The ratio between the number of activated voxels and the total voxels in each M1 represents the spatial extent of activation (SEA). 36 The general linear model was used to contrast BOLD signal between movement and rest conditions, modeled by a boxcar function with hemodynamic response modification (predictor movement). The voxel values were considered significant if the activation survived a Bonferroni-corrected significance threshold of 0.01. We selected a cluster of 100 contiguous voxels for hand representation in each M1. Signal intensity versus time curves were examined for each significant activation, and a mean signal change (or MSC) in movement versus rest condition was calculated.
Proton Magnetic Resonance Spectroscopy Imaging
Immediately after the BOLD acquisition was completed, we analyzed the fMRI results using the scanner analysis software to locate the M1 activation for 1 H-MRSI positioning. These results were not used for the subsequent analyses. Point-resolved spectroscopy was used (TE = 30 ms; TR = 1500 ms; FOV = 160 mm2; matrix = 16 × 16; slice thickness = 15 mm; in-plane resolution = 5 × 5 mm2; spectral width = 1200 Hz). We minimized lipid artifact from the scalp by using 8 outer voxel suppression bands (thickness = 30 mm) around the volume of interest. We used automatic and manual shimming to achieve full-width at half maximum of <20 Hz of the water signal from the entire excitation volume.
NAA concentrations were calculated using LCModel. 37 Using custom-designed software (Matlab v7.1) to overlay the LCModel output, BOLD images, and segmented T1-weighted images (SPM2 Department of Cognitive Neurology, London, UK), we selected 3 spectroscopic voxels in the hand representation in M1 26 with a signal-to-noise ratio >10 and >75% brain tissue (BT, grey + white matter from SPM2 segmentation) and NAA Cramer-Rao lower bounds <20%. If M1 activation was absent, we selected the spectroscopic voxels corresponding to the “hand knob” in M1 (http://neuro.imm.dtu.dk/services/jerne/ninf/voi.html; Figure 1A).
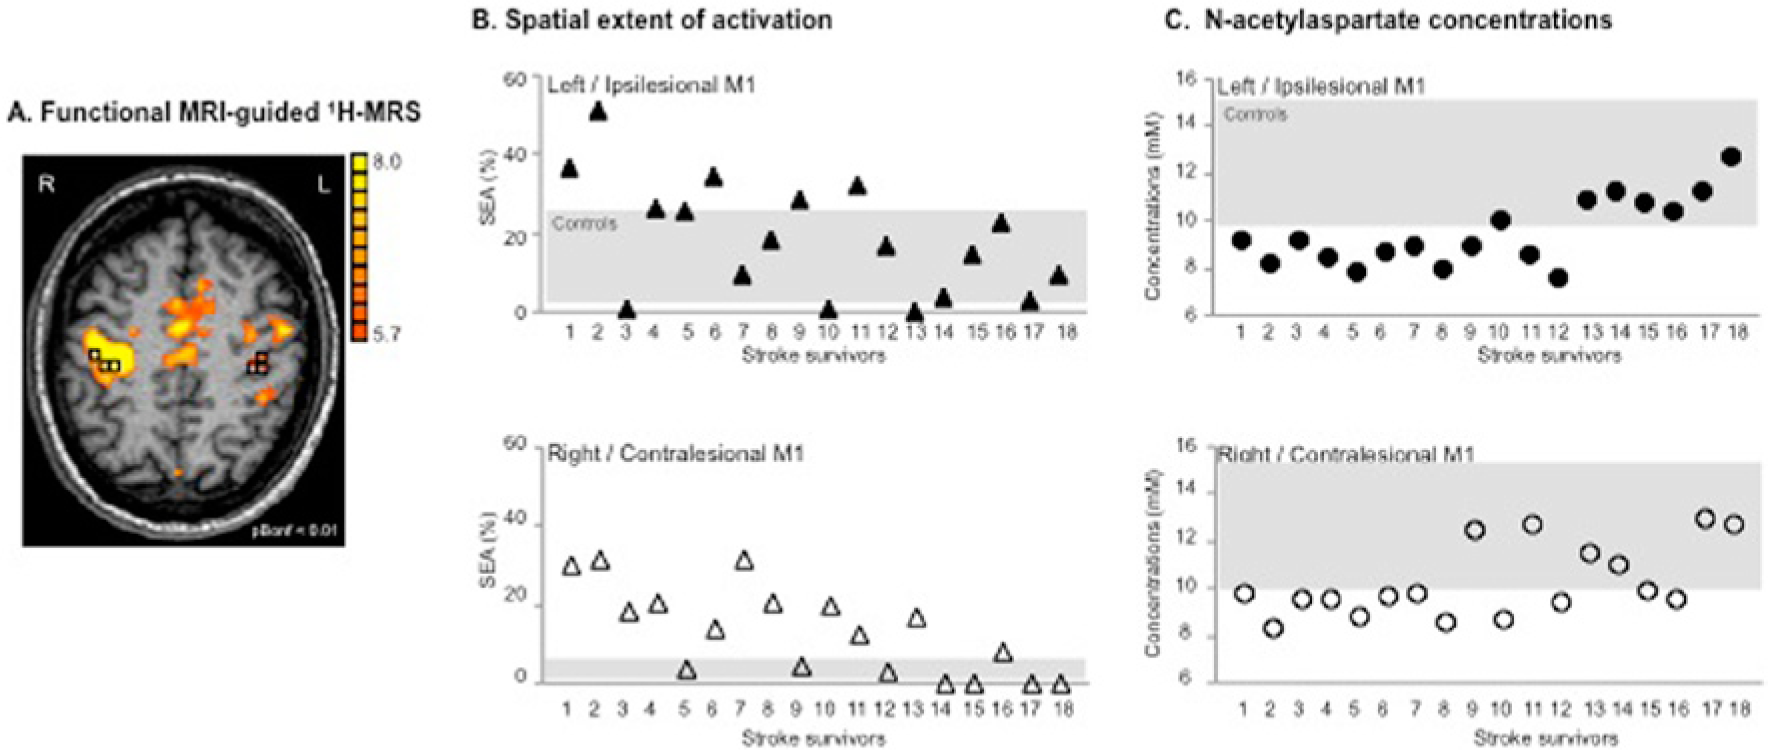
(A) Motor-related cortical activation during a handgrip task executed with the impaired right hand in a 45-year-old patient who had experienced infarct involving the left basal ganglia and corona radiata (patient 7, Table 1). Spectroscopic voxels (black squares) were selected in the hand knob area (based on M1 activation and anatomical landmarks). The front of the brain is upward. (B) Spatial extent of M1 activation during handgrip executed with the impaired hand (%) and (C) NAA concentrations (mM) in both ipsilesional (upper row, closed symbols) and contralesional (lower row, open symbols) M1 are shown for the individual patient. Stroke survivors are ranked by FMUE scores (see Table 1, with #1, no arm motor impairment; #18, severely impaired). Gray rectangles signify the range of spatial extent activation (B) and NAA concentrations (C) in left (upper row) and right (lower row) M1 in healthy controls.
We corrected NAA concentrations as follows: c = cLCModel/BT where c is the BT-corrected concentration, cLCModel is the concentration in institutional units (from the LCModel), and BT is the estimated brain tissue. The BT-corrected concentration was then converted into molar concentrations (millimoles per kilogram wet-weight brain tissue). 26
Statistical Analysis
Variables (demographic: age, years of education; clinical: FMUE scores, time poststroke, lesion volume, white matter hyperintensities, global gray matter volume) and M1 outcomes (primary: NAA, SEA; secondary: MSC) were described by means and standard deviations (SDs). Because lesion volume was not normally distributed, we used a logarithmic transform. To quantify differences in SEA and MSC between M1s, we used the activation laterality index3,38: LI = (C − I)/(C + I), where C and I represent the contralateral M1 SEA (MSC) and ipsilateral M1 SEA (MSC) to the hand performing the motor task, respectively. The LI can range from 1.0 (all activity in the contralateral M1) to −1.0 (all activity in the ipsilateral M1).
Between-group differences in demographic variables and M1 outcomes were explored using parametric (t test) or nonparametric (Wilcoxon rank-sum test) statistics, depending on their distributions.
Within-group, between-hemisphere differences in variables were assessed using 2-tailed paired t tests. We used the Spearman rank order correlation to analyze the relationships between (1) primary outcomes and clinical variables and (2) SEA, MSC, and NAA within and across M1. The significance level was set at P < .05 (SPSS 18.0, SPSS Inc, Chicago, IL).
Results
Participant Characteristics
Patients
Stroke survivors had experienced a single subcortical infarction between 6 and 144 months prior to scanning (mean ± SD = 37.4 ± 36.7 months) leading to moderate arm paresis (FMUE = 42.9 ± 16.9). Lesion volume varied from 180 to 25 340 mm3 (8575.4 ± 15 239.0 mm3). Among the patients, 12 had left-sided infarcts; 14 had infarcts in the basal ganglia, with extension to the posterior limb of the internal capsule (PLIC) in 6 patients, to the anterior limb of the internal capsule (ALIC) in 2 patients, to both the PLIC and ALIC in 2 patients, and to the corona radiata in 5 patients. One patient had an infarct in the PLIC with extension to the thalamus, 1 had an ALIC infarction, 1 had cerebral peduncles infarction, and 1 had an infarct in the pons. Fazekas scores varied between 0 and 1 (Table 1).
Demographic and Clinical Stroke Characteristics. a
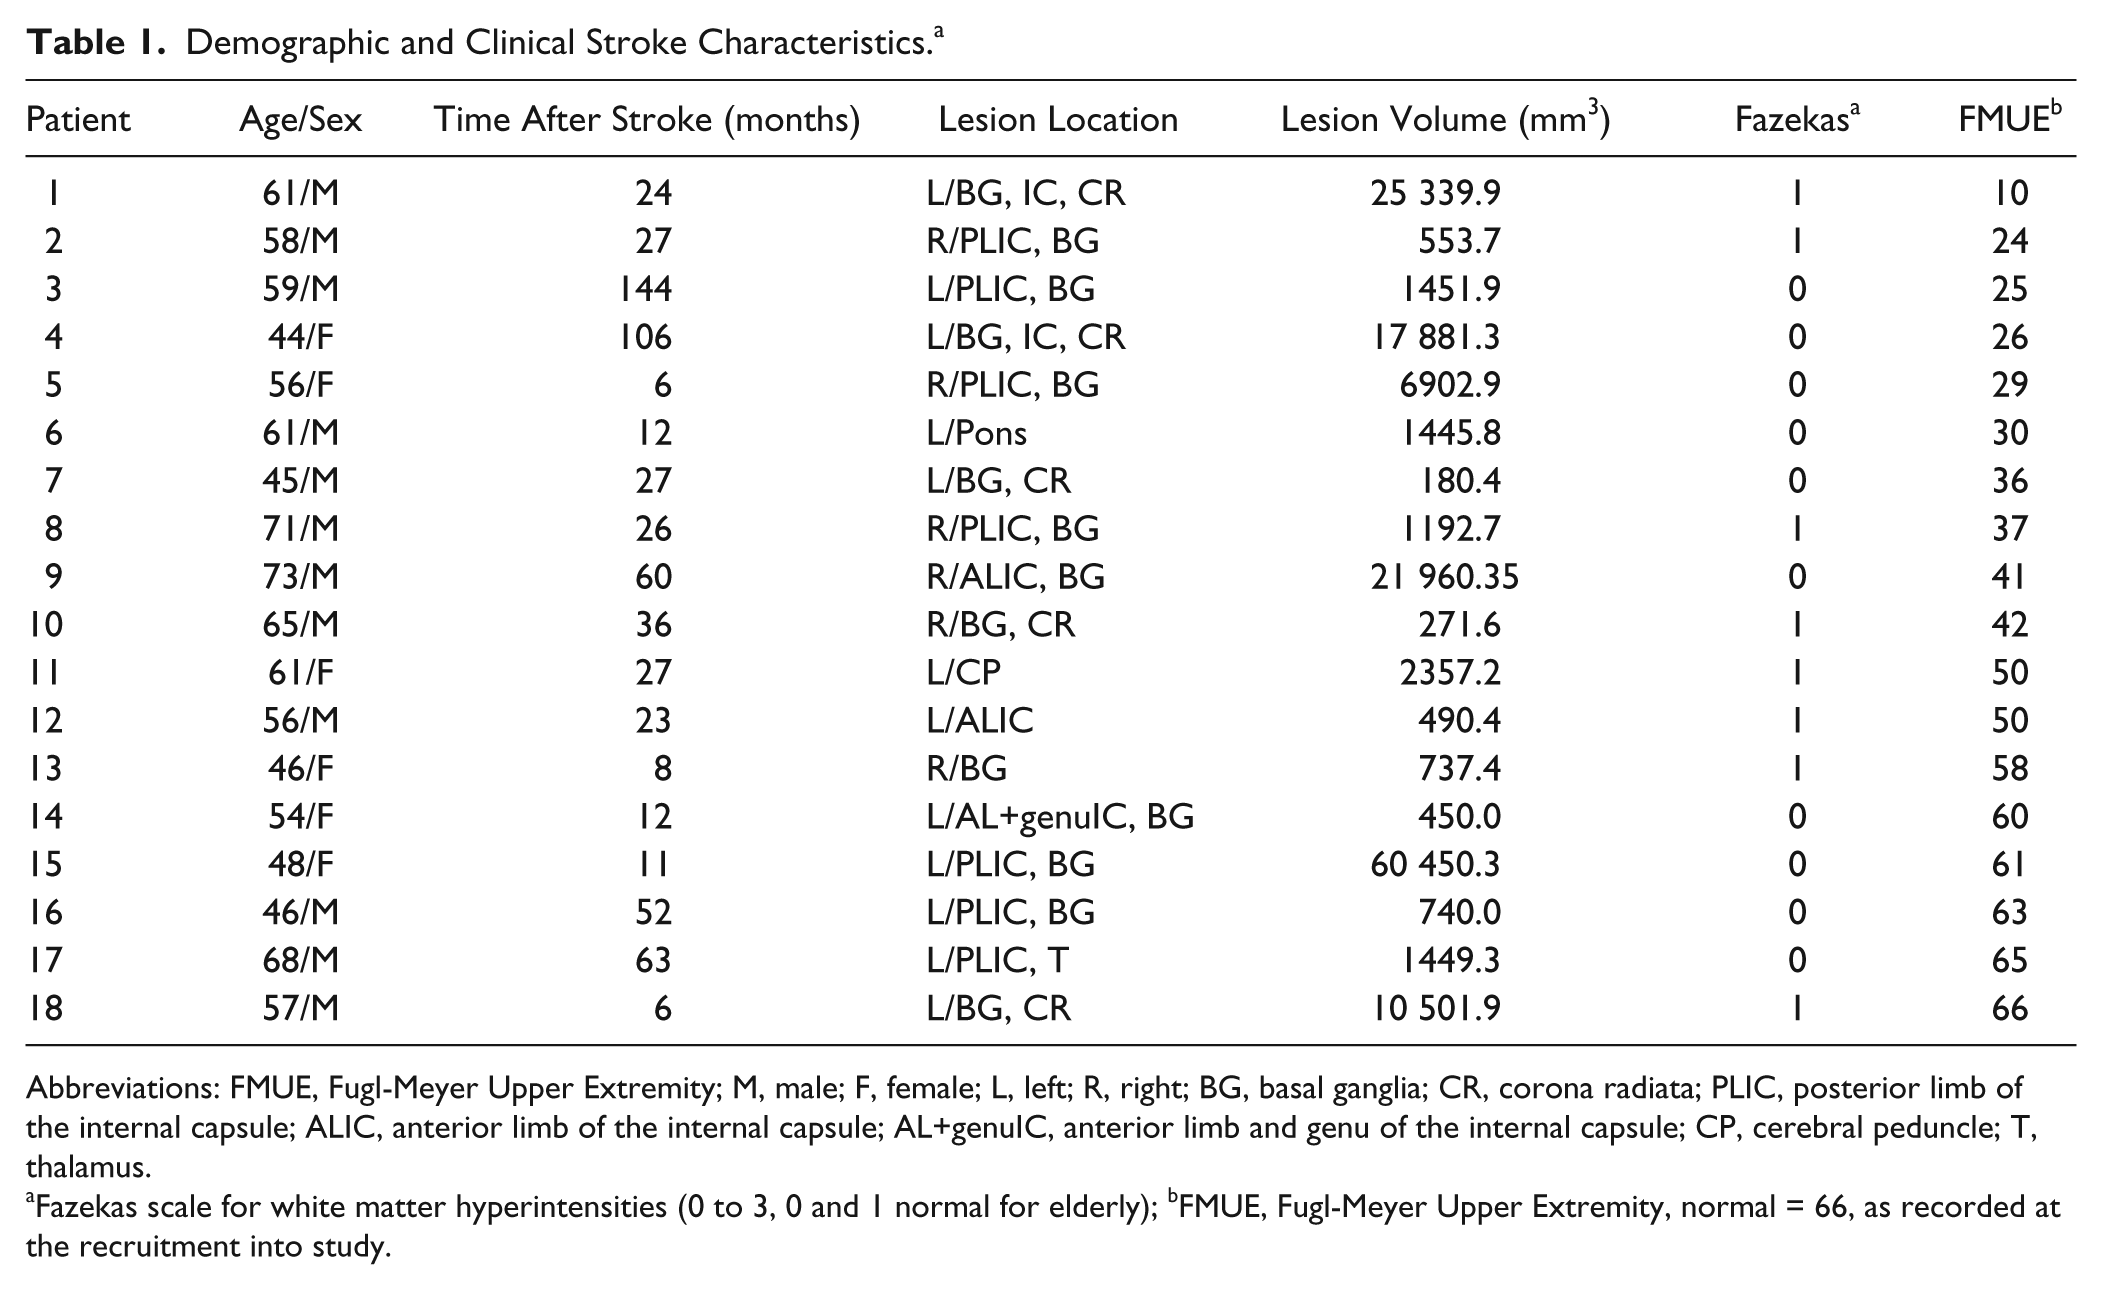
Abbreviations: FMUE, Fugl-Meyer Upper Extremity; M, male; F, female; L, left; R, right; BG, basal ganglia; CR, corona radiata; PLIC, posterior limb of the internal capsule; ALIC, anterior limb of the internal capsule; AL+genuIC, anterior limb and genu of the internal capsule; CP, cerebral peduncle; T, thalamus.
Fazekas scale for white matter hyperintensities (0 to 3, 0 and 1 normal for elderly); bFMUE, Fugl-Meyer Upper Extremity, normal = 66, as recorded at the recruitment into study.
Patients Versus Controls
Age (57.4 ± 9.1 vs 49.9 ± 13.7 years, NS), male/female distribution (12/6 vs 10/6, NS), or years of education (13.6 ± 1.7 vs 14.0 ± 2.5 years, NS) did not differ between patients and controls. We compared the iM1 with the left M1 (lM1) from controls based on (1) lack of M1 NAA lateralization in healthy controls,26,30 (2) similar handgrip activations for both dominant and nondominant hands in healthy controls, 5 and (3) left-hemisphere injury in most (67%) of our patients.
Spatial Extent of Handgrip-Related Activation in the Primary Motor Cortex
Controls
A robust contralateral BOLD response was seen in all controls while using the right (dominant) hand (lM1, 13.0% ± 8.8% of total lM1, Figure 1B for range of SEA). Ipsilateral right M1 activation was significantly smaller (0.6% ± 1.4%, P < .001) and was recorded in only 5 out of 16 controls. The LI was 0.9, suggesting dominant contralateral M1 activation.
Patients
Patients consistently activated both M1s while using the impaired arm (iM1, 18.6% ± 14.7%; cM1, 13.0% ± 11.2.0%). No significant differences between iM1 activation and cM1 activation were found (P = .2). Spatial extent of M1 activation was significantly correlated with FMUE scores but not with lesion volume, global gray matter volume, or time after stroke (Table 2). Subgroup analysis (Table 3) showed no significant differences in M1 activation based on stroke lateralization, left versus right hemisphere, or internal capsule location—that is, PLIC versus ALIC.
Spearman Correlations (r, P value) Between Primary Motor Cortex (M1) Outcomes, Measured Bilaterally, and Clinical Variables in Stroke Survivors.
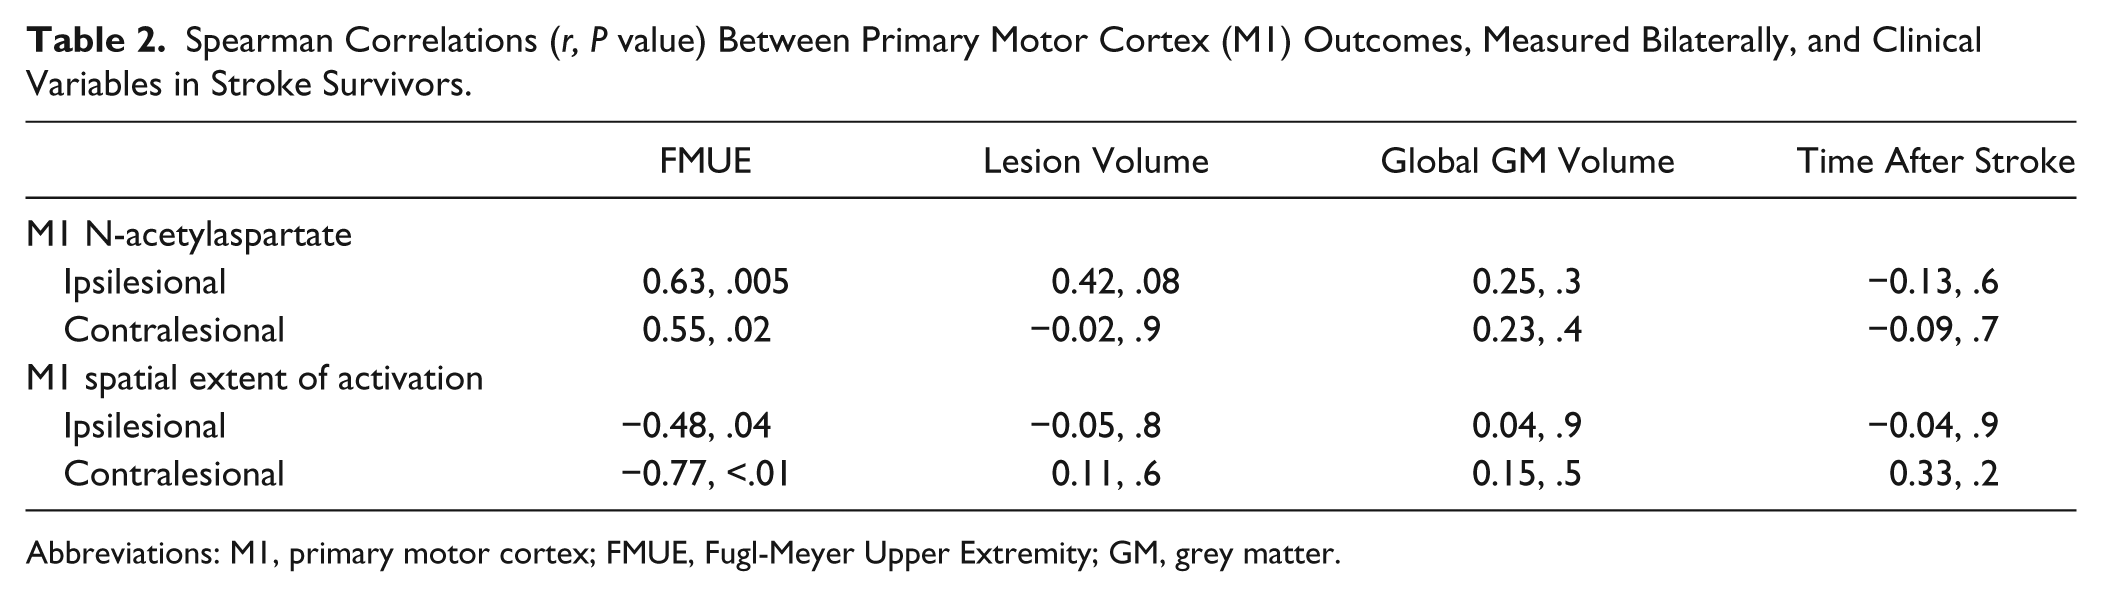
Abbreviations: M1, primary motor cortex; FMUE, Fugl-Meyer Upper Extremity; GM, grey matter.
Comparisons of Mean (SD) of Primary Motor Cortex (M1) Outcomes in Patients With Left Versus Right Stroke and With PLIC Versus ALIC Stroke.
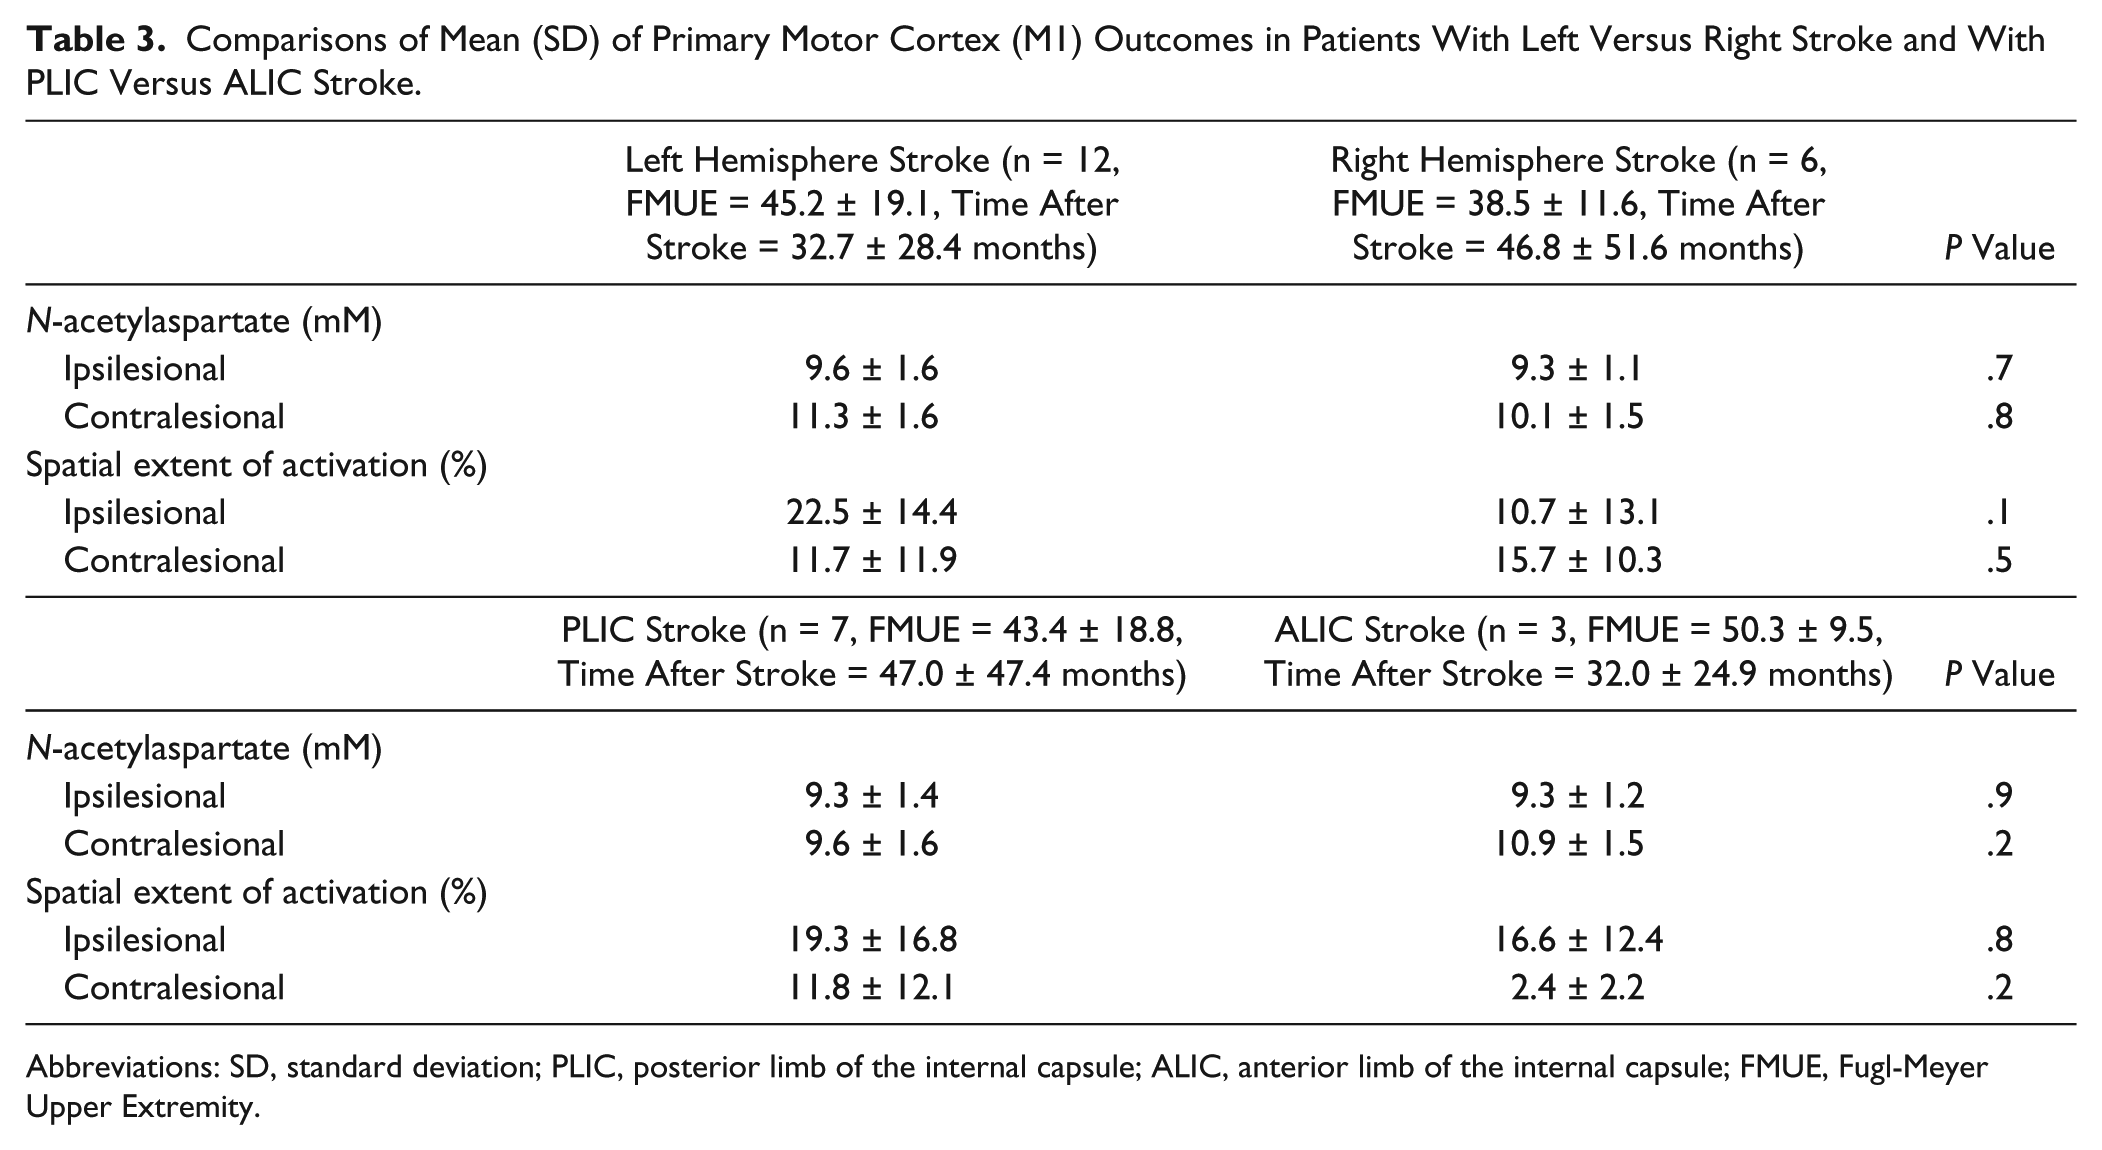
Abbreviations: SD, standard deviation; PLIC, posterior limb of the internal capsule; ALIC, anterior limb of the internal capsule; FMUE, Fugl-Meyer Upper Extremity.
Patients Versus Controls
Although patients, as a group, generally activated a larger iM1 than controls, this did not reach statistical significance (P = .2). Out of 18 patients, 5 showed greater SEA than the range recorded from the uninjured group (Figure 1B). As expected, cM1 SEA in patients was considerably greater than in controls (13.0 ± 11.2% vs 0.6 ± 1.4%, P < .001). Also, 11 patients activated more cM1 compared with the range of our control group (Figure 1B). We also found altered lateralization for the patient group. The LI was 0.2, reflecting an increased involvement of cM1.
Magnitude of Handgrip-Related Activation in the Primary Motor Cortex
Patients Versus Controls
The magnitude of M1 activation, as measured by MSC, was significantly higher in patients than in controls (iM1 = 0.9% ± 0.3% vs lM1 = 0.7% ± 0.2%, P = .008; cM1 = 0.8% ± 0.7% vs rM1 = 0.01% ± 0.02%, P < .001). Activation was also less lateralized in patients compared with controls (LI = 0.05 vs 0.95 in controls), similar to the results for SEA (see above).
NAA Levels in the Primary Motor Cortex
1 H-MRS spectra with good signal-to-noise ratios were obtained consistently from both control and stroke participants. Similar percentages of brain tissue within spectroscopic voxels were found between groups (iM1 = 89.0% ± 6.2% vs lM1 = 88.8% ± 7.2%, P = .9; cM1 = 87.0% ± 7.9% vs rM1 = 88.9% ± 5.0%, P = .4).
Controls
Consistent with our previous findings,26,30 similar NAA levels were found in lM1 and rM1 in healthy controls (11.5 ± 1.4 mM vs 11.7 ± 1.9 mM, P = .8; see Figure 1C for range of NAA).
Patients
Ipsilesional NAA was significantly lower than contralesional NAA (9.5 ± 1.4 mM vs 10.4 ± 1.6 mM, P = .02). Significant positive correlations were found between NAA and FMUE (Table 2), suggesting that NAA is lower in both M1s in patients with poorer outcomes (Figure 1C). There were no significant correlations between NAA and stroke volume, global gray matter volume, or time poststroke (Table 2). NAA levels were not significantly different in left versus right stroke or in PLIC versus ALIC stroke (Table 3).
Patients Versus Controls
Mean NAA levels in each M1 in patients were significantly lower than those in controls (iM1 vs lM1 P < .001; cM1 vs rM1 P < .05).
Relationships Between Spatial Extent and Magnitude of Activation and NAA Levels in the Primary Motor Cortex
Controls
No significant correlations were detected between SEA and NAA levels within lM1 (Spearman r = −0.17, P = .5) or rM1 (r = 0.36, P = .2) nor between MSC and NAA (lM1, r = −0.08, P = .8; rM1, r = −0.04, P = .9).
Patients
In contrast, patients showed a significant negative correlation between SEA and NAA in each M1 (ipsilesional, r = −0.55, P = .02; contralesional, r = −0.53, P = .02; Figure 2, upper row). Patients showed weaker negative correlation between cM1 SEA and iM1 NAA (r = −0.42, P = .08, Figure 2A, lower row). Although correlations between MSC and NAA within or across M1s were all negative, similar to SEA (iM1, r = −0.14, P = .6; cM1, r = −0.38, P = .1; iM1 MSC/cM1 NAA, r = −0.24, P = .4; cM1 MSC/iM1 NAA, r = −0.42, P = .1), they did not reach statistical significance.
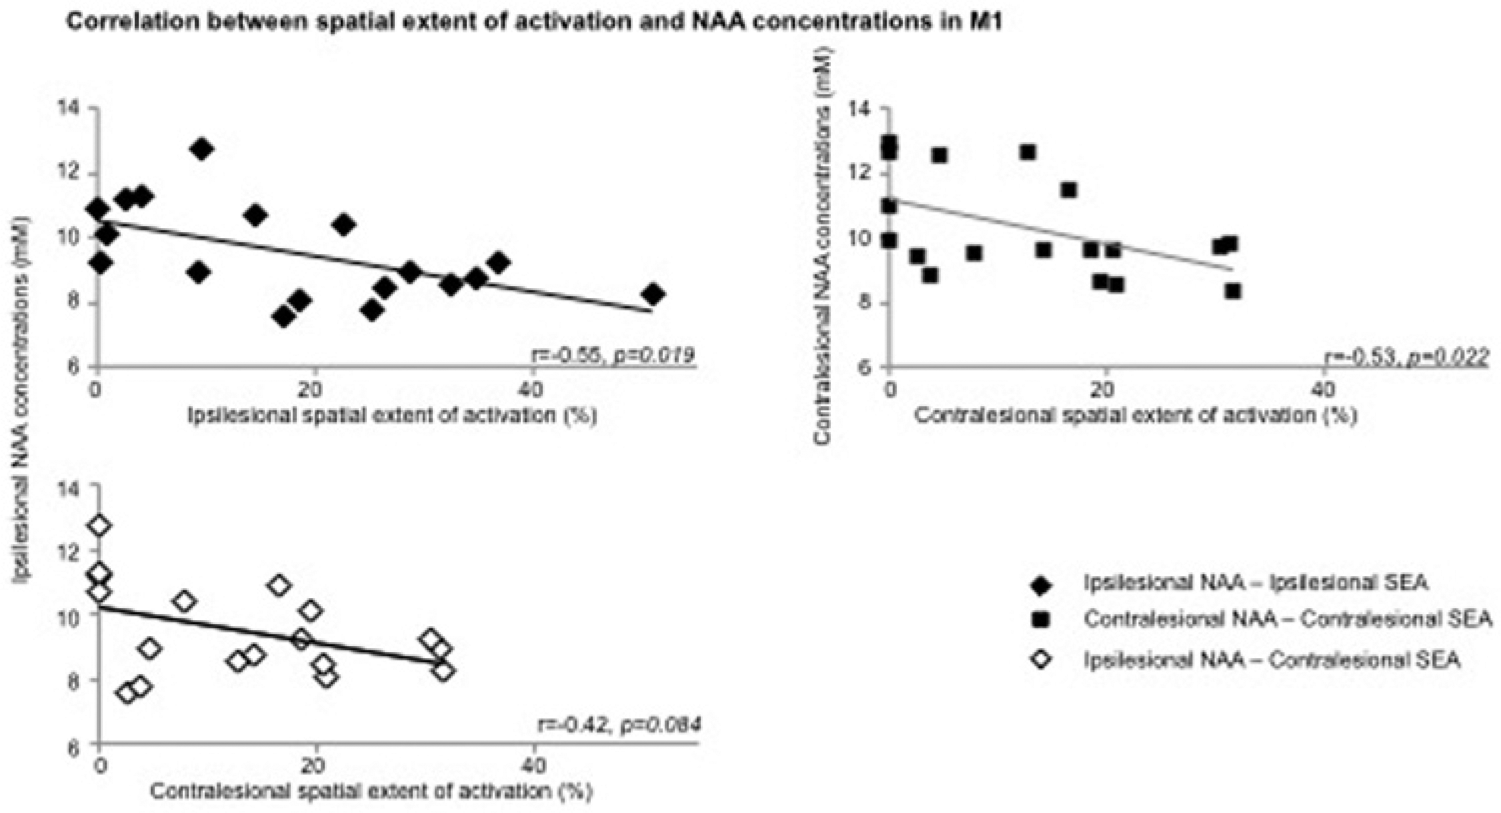
Scatterplot of Spearman correlations between (A) ipsilesional NAA concentrations (mM) and ipsilesional (top row, black diamond, r = −0.55, P = .02) and contralesional (low row, white diamond, r = −0.42, P = .08) handgrip-related SEA (%), and between (B) NAA and SEA within contralesional M1 (square, r = −0.53, P = .02) in stroke patients.
Discussion
Although numerous studies have used either fMRI or 1 H-MRS to examine brain reorganization after stroke, to our knowledge, this is the first report that integrates these modalities to investigate the relationships between activation and neuronal metabolism measures in primary motor cortex after stroke.
Handgrip-Related Activation in the Primary Motor Cortex in Chronic Subcortical Stroke
As reported in previous studies,5, 20-22 our data showed that the activation pattern associated with impaired hand movement consistently included both ipsilesional and contralesional M1. Increased ipsilesional activation is likely to reflect a recruitment of a larger pool of neurons with intact axons 39 probably because of a loss of recurrent inhibition onto surrounding pyramidal cells, 40 changes in the properties of existing neuronal pathways, 41 and/or changes in anatomical connections between areas. 42 Our finding of greater contralesional activation might be a result of altered interhemispheric inhibition, 14 dendritic overgrowth caused by overuse of the healthy hand, recruitment of uncrossed corticospinal tract fiber recruitment,4,19 and/or mirror movements. 43 An alternative explanation might be that patients with poor motor outcome might perceive the task as more complex, resulting in greater bilateral M1 activation. 44 Although the effort levels of our task were matched at 25% of individual MVC, we did not control attention. Thus, we cannot rule out the possibility that attention differences contributed to larger M1activations.
NAA in the Primary Motor Cortex in Chronic Subcortical Stroke
Our second finding of lower NAA corroborates prior reports in stroke.23-26 Although the specific mechanism underlying lower NAA remains the topic of some conjecture, dysfunctional neurons may contain lower NAA because of less synthesis and/or release. 45 Indeed, in the ipsilesional M1, dysfunctional neurons could result from distal ischemic axotomy46-48 and/or diaschisis, that is, depressed neural activity in brain regions distant but structurally or functionally connected to the damaged brain area.49,50 Although it is unknown whether biochemical and/or electrophysiological changes described in surviving neurons with ischemic axotomy47,48 are similar to those classically described in diaschitic neurons, 51 these changes are likely to be associated with impaired mitochondrial function and hence NAA decline. The concept of metabolically depressed neurons is further supported by observation of morphological and biochemical cell body changes47,48 after axonal injury, indicating that neurons shift from a “transmitting” to a “degenerative/regenerative” state. 52 Our findings of lower NAA in the contralesional M1 also confirm our prior work 26 and might result from transhemispheric diaschisis.51,53
Other explanations for lower NAA are also possible. NAA is involved in myelin/fatty acid synthesis and osmotic regulation, but these processes are unlikely to be altered in a normal-appearing cortex remote from the injury. Lower NAA can also result from dead neurons. 54 However, neuronal loss seems unlikely in M1 because there is little evidence of retrograde degeneration 55 or cortical cell death after subcortical stroke. 52 Moreover, we found no differences in brain tissue volume in the spectroscopic voxels in patients compared with controls, which would be expected in the context of appreciable neuronal loss. Therefore, although lower NAA levels potentially reflect a variety of underlying mechanisms, in the context of the present findings, we consider that lower NAA levels suggest metabolically depressed neurons.
Correlation Between Handgrip-Related Activation and NAA in the Primary Motor Cortex in Chronic Subcortical Stroke
Our third finding of a negative correlation between extent of activation and NAA levels in each M1 suggests that the amount of neuronal recruitment during a motor task is related to the magnitude of M1 neuronal abnormality. We speculate that the morphological and biochemical neuronal body changes in the ipsilesional M1, associated with increased synthesis of proteins related to growth 56 , may support formation of new local intracortical connections. 42 For instance, these could recruit adjacent neurons with intact axons, that is, pyramidal tract neurons, which potentially have muscle projections similar to that of metabolically depressed neurons. Similarly, the changes in neuronal morphology in the contralesional M1 57 could be associated with a larger neuronal recruitment in this area. Moreover, the contralesional recruitment was also negatively correlated to ipsilesional NAA, suggesting that as the more the ipsilesional M1 neuronal compartment is compromised, the more the contralesional M1 recruited. Although this result is supported by recent findings that contralesional M1 activation correlates with ipsilesional motor pathway integrity 58 , it requires further attention.
An alternative strategy for investigating BOLD activations is to examine the magnitude of signal changes. Our results are generally consistent with those from the SEA analysis discussed above: that is, the NAA levels were also negatively correlated to a modest extent with the magnitude of activation. However, further studies are needed to elucidate the relationships between the BOLD signal and the physiological role of NAA in neurons.
Nevertheless, these findings help us rule out the contribution of attention or mirror movements to enlarged M1 activation because we would not expect underlying neuronal disturbances in the areas regularly recruited during normal motor programmi Furthermore, contralesional dendritic overgrowth could also be omitted from our interpretation, based on our findings of lower contralesional M1 NAA levels.
Study Limitations
We recruited a relatively large sample for a study of this type: neuroimaging study in stroke patients. Because this was the first study to use a dual-imaging modality approach, we increased our statistical power by recruiting only survivors of subcortical stroke and examining only one cortical motor area, M1. We also chose to examine only one neurochemical, NAA, and asked a series of very focused questions. Nonetheless, there were some limitations. The focus on subcortical infarcts provides statistical power by minimizing patient variance but limits our ability to explore the effects of infarct location on the relationships between brain function and neurochemistry. Similarly, because our analysis focused on M1, we cannot comment on the involvement of other brain regions that are critical to stroke recovery. Our focus on NAA means that we can make no comment on other neurochemicals, such as glutamate and γ-aminobutyric acid. Clearly, future studies of the relationship between these neurochemicals and motor performance and recovery would be of great interest.
Our NAA findings could be explained, in part, by resting cerebral blood flow alterations, perhaps resulting from carotid stenosis. However, there is evidence that reduced resting cerebral blood flow also results in elevated choline and lactate, 59 which were not significantly altered in our sample (results not shown). Thus, we consider that carotid stenosis is not a significant contributor to our findings.
Finally, because of the point-spread function of 1 H-MRSI, the effective voxel size is bigger than the nominal voxel size. Thus, we cannot rule out the possibility that our measurements include more than hand representation in each area.
Summary
Although overlapping processes underlie functional M1 changes after stroke, 60 our findings suggest that one factor could be the altered neuronal metabolism in these areas. Thus, we advocate that functional MRI and 1 H-MRS provide complementary probes of cerebral tissue that, when used together, improve our understanding of the cellular substrate of brain reorganization after stroke in humans. Further use of such combined approach might help us better understand the mechanisms of recovery and develop better therapeutic approaches.
Footnotes
Declaration of Conflicting Interests
The authors declared no potential conflicts of interest with respect to the research, authorship, and/or publication of this article.
Funding
The authors disclosed receipt of the following financial support for the research, authorship, and/or publication of this article: This work was supported by the American Heart Association (0860041Z to CMC; 0655759Z to WMB). The Hoglund Brain Imaging Center is supported by a generous gift from Forrest and Sally Hoglund and National Institutes of Health (P30 AG 035382, P30 HD 002528, and UL1 TR000001). The contents are solely the responsibility of the authors and do not necessarily represent the official views of the NIH or its institutes.