
Abstract
Background. Retraining walking following spinal cord injury using visually guided tasks may be especially efficacious because it engages the motor cortex, whose input may facilitate improvements in functional walking. Objectives. To contrast 2 methods of retraining, one emphasizing precise, visually guided walking over obstacles and on targets (Precision Training), the other emphasizing mass practice of walking on a treadmill (Endurance Training). Methods. A randomized, single-blind, crossover design was used. Twenty-two participants, ≥7 months postinjury, were randomly allocated to start with Precision or Endurance Training. Each phase of training was 5 times per week for 2 months, followed by a 2-month rest. Measures of walking speed, distance, skill, confidence, and depression were obtained before training, then monthly thereafter. Results. Both forms of training led to significant improvements in walking, with Endurance Training inducing bigger improvements in walking distance than Precision Training, especially for high-functioning walkers who had initial walking speeds >0.5 m/s. The largest improvements in walking speed and distance occurred in the first month of Endurance Training, with minimal changes in the second month of training. In contrast, improvements in walking skill occurred over both months during both types of training. Retention of over ground walking speed, distance, and skill was excellent for both types of training. Conclusions. Intensive walking training in the chronic phase after spinal cord injury is effective in improving over ground walking. Visually guided tasks for training individuals with chronic spinal cord injury were not superior to mass practice on a treadmill.
Introduction
Retraining of walking after incomplete spinal cord injury (SCI) has largely focused on mass practice with repetitive stepping on a treadmill or over ground. Adjuncts during such training have included partial body weight support,1-7 functional electrical stimulation of muscles,8,9 and/or robots10-16 to assist or resist the walking movements (recent reviews17-20). In our literature scan, only one study (a case series) considered a very different form of training, called “skill training,” which incorporated precise stepping over ground that challenged balance. 21 Large randomized controlled trials comparing over ground training with treadmill training have shown no differences in outcome.5,6,22
In individuals with chronic incomplete SCI, improvements in walking were correlated with training-related strengthening of the corticospinal tract. 23 Even though rhythmic stepping is controlled by the spinal cord and brainstem, 24 training that enhances the participation of the motor cortex may be especially efficacious. One way to engage the primary motor cortex is to use visually guided walking, such as stepping precisely over obstacles and onto targets. In cats, such precise stepping enhanced the firing of neurons from the primary motor cortex, especially when the paw stepped over obstacles. 25 Training methods incorporating such precise stepping may better engage and strengthen the corticospinal tract, thereby translating into better over ground walking. Alternatively, stepping on a treadmill may already be sufficiently difficult to engage the motor cortex in many individuals with SCI, so that making as many steps as possible (ie, mass practice) may be more important in training.
Here, we contrast 2 forms of training, based on the reasoning above. A randomized crossover study determined how participants improved in over ground walking with each form of training. Although many other electrophysiological measures were taken, this article will focus on the outcome measures for walking.
Methods
Participants
Inclusion Criteria
Spinal cord injury from trauma or other stable lesions
Injury occurred ≥7 months prior
Able to walk independently ≥5 m with a walking aid and/or braces
Injury between C1 and L1
Able to attend training sessions 5 times per week
Exclusion Criteria
Head injury
Cognitive or musculoskeletal impairments that limit walking training
Seizures or head implants that preclude participation in transcranial magnetic stimulation experiments
Recruitment started October 2007 and finished January 2012. The last participant completed follow-up in September 2012. The study was approved by the Health Research Ethics Board, University of Alberta and Alberta Health Services.
Study Design
A randomized, single-blind, crossover design was used. Sample size (n = 34) was estimated from previous data, 21 using a difference score of 17% between groups for the modified Emory Ambulation Profile (mEFAP) 26 and a standard deviation of 25%, power of 0.8, and confidence level of .05. We used the mEFAP because our primary outcome measure, the Spinal Cord Injury–Functional Ambulation Profile (SCI-FAP) 27 was modeled after the mEFAP. Participants were screened by a physical therapist. Once suitability and written consent was obtained, participants were block-randomized (block size 4) to start with either Endurance or Precision Training by picking a label out of a box. Each type of training was ~1 h/d, 5 times per week, for 2 months. After the first phase of training, participants rested for 2 months with no training, then crossed over to the other form of training for 2 months, followed by another 2 months of rest. Measurements were taken at least 3 times before the first training period (separated by at least 1 week) to confirm baseline stability and then once monthly thereafter. By using a crossover design, we maximized the number of participants receiving each type of training, and counterbalanced the order of training. This trial is registered in clinicaltrials.gov (NCT01765153).
Variables Controlled
Participants maintained the same medication dosages and exercise outside of our intervention throughout the study period.
Clinical Outcome Measures
Physical therapists blinded to group assignment administered the measures. The primary outcome measure, the SCI-FAP, 27 measured walking skills in daily life (uninjured score = 7). Secondary measures included the following: the 6-minute walk test (6MWT), 28 the 10-meter walk test 29 performed over 14 m (timing middle 10 m) at a self-selected speed [10MWT(ss)] and a fast speed [10MWT(f)], and the Walking Index for Spinal Cord Injury–Version II30,31 performed in 2 ways—self-selected [WISCI-II(ss)] and maximum [(WISCI-II(max)]. 32 Psychometric properties of these tests have been established (6MWT,29,31,33 SCI-FAP,27,34 10MWT,29,31,33 WISCI-II29,33,35). Walking confidence was measured with the Activities-specific Balance Confidence scale, 36 and depression was measured with the Center for Epidemiologic Studies–Depression Scale. 37 Manual muscle strength of the lower extremities was assessed prior to any treatment, including hip extension, flexion, abduction, adduction, knee flexion, extension, ankle dorsiflexion, and plantarflexion according to clinical standards, 38 with modification for the plantarflexor group as previously reported. 39
Interventions
Precision Training
Participants had to step over obstacles of different heights and onto targets of different sizes. Obstacles were 3-cm high Styrofoam blocks (stacked to increase height), varying in width from 4 to 20 cm in increments of 4 cm. Targets were fabric circles, diameter from 7 to 10.5 cm. The maximum ability for targets and obstacles was determined by trial-and-error prior to the beginning of Precision Training. A different course was designed each day, consisting of a straight track (15 m) with ~15 obstacles and targets (ie, ~1 m apart). Based on the error recorded each day (see below), the course was altered for the next day to aim for 80% success. The emphasis was on accuracy, not speed. Extra steps between obstacles and targets were allowed at the beginning of training, and rest breaks were taken as needed. As participants improved, course difficulty was increased by requiring that each obstacle/target was executed without taking extra steps in between. Reducing gait aids also challenged walking balance.
Endurance Training
Participants walked on the treadmill, with body weight support and manual assistance if needed. The treadmill speed was initially set to be faster than their over ground walking speed as measured by the 10MWT(ss). Walking as far and as fast as possible with minimal rests was encouraged. Progression involved reducing manual assistance and body weight support, increasing walking speed and distance, while reducing rest breaks.
Documentation of Training
Training parameters were recorded each session. The number of steps executed (StepWatch, Orthocare Innovations, Oklahoma City, OK), total time, distance, and walking speed for each walking bout were measured, along with heart rate before and immediately after each bout of walking (Polar FT7, Polar, Lachine, Quebec, Canada). Errors during Precision Training were defined as any touch to the obstacle, and any target incompletely obscured by the foot. A Success Index was calculated each day, defined as:
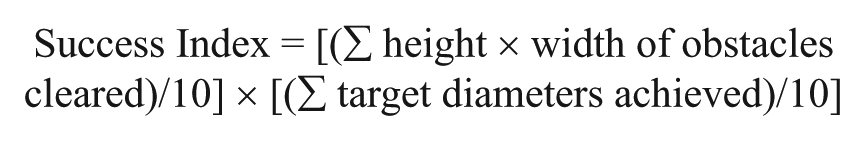
where units for height, width, and diameter were in meters, summed (∑) over all successful obstacles and targets. The division by 10 was arbitrary, to convert the score to a workable number. This new measure is used for descriptive purposes only.
Statistical Analysis
Baseline variables were compared between the two groups: those starting with Endurance vs Precision Training. In all comparisons between groups, a standard t test was used for variables that were continuous, whereas the Mann–Whitney U test was used for ordinal data (ie, WISCII(ss) and level of injury). Paired t tests were used for within-participant comparisons, and Wilcoxon signed rank test for ordinal data. A P value of <.05 was considered significant for all comparisons.
To determine if Precision and Endurance Training each led to significant improvements, pre- and posttraining scores for all outcomes were compared using the paired t tests. Pretraining scores were either the average of the baseline scores (for phase 1) or the average of the 2 scores obtained during the first rest period (for phase 2). Data were collapsed across phase of training to counterbalance for a potential order effect.
To determine if one type of training was superior to the other, we compared the change scores (ie, posttraining minus pretraining) from each type of training using the standard t tests. To further determine if the changes were greater than measurement error, the minimally detectable change (MDC) was obtained from the literature for the 10MWT,40,41 6MWT, 40 and WISCI-II 32 and SCI-FAP. 34
Since individuals with high compared with low walking function may respond differently to the training, we stratified individuals based on their walking speed (10 MWT(ss)) at the beginning of each type of training. The ability to walk >0.5 m/s, that is, sufficient for community walking,42,43 separated individuals into high- (>0.5 m/s) versus low- (<0.5 m/s) functioning walkers. The change scores from each of these groups were compared for each type of training using the standard t tests.
The time course for improvement was determined by comparing the change scores for the first month versus the second month of training, using the paired t tests.
Retention of gains was determined by comparing the outcome measures at the end of the 2-month rest with those immediately after the training (paired t tests). A retention index was calculated for each outcome measure as the ratio of the score at the end of a 2-month rest divided by the score immediately after training (ie, ratio of 1 = perfect retention). The retention index was compared between the 2 types of training, and between phases 1 and 2 using the standard t tests. The correlation between retention index and final walking speed indicated if achieving a higher final walking speed led to better retention.
The P value for number of comparisons was not corrected. Because the statistical power is low with the small number of participants, we did not want to risk missing a difference if one existed. Nevertheless, we also determined if using a single test on the primary outcome measure (SCI-FAP) would change the results. A linear mixed model was used, with factors treatment (Precision vs Endurance), carryover (no treatment preceding vs Precision or Endurance preceding), and sequence of treatment (Precision first vs Endurance first, participants nested within sequence).
Results
Participants
Seventy potential participants were screened (Figure 1). Forty-eight were excluded because 13 were ineligible (ie, lesion level too low, progressive spinal condition, and/or other injury to the central nervous system), 18 were not able to walk 5 m without an assistant, 9 lived too far away and could not relocate, 4 were younger than 18 years, 2 had other problems (pressure sores, substance abuse), and 2 were lost after initial contact. Twenty-two were randomized and received the intervention. Twenty provided data for the analyses. Eleven participants each started with Precision or Endurance Training. One participant was excluded because of low attendance (<3 times per week), and another was excluded because wrist pain was aggravated during Precision Training with a walker. No other adverse events resulted from the training. Of the 10 that started with and completed Endurance Training, all completed Precision Training. The first participant (P10) who started with Endurance Training did the training over ground, thus her data from the Endurance phase were not used. Endurance Training was initially planned to be done over ground. However, P10’s walking speed and heart rate were too limited by her over ground walking ability to induce a strong training effect. Thus, all subsequent Endurance Training was done on the treadmill, where walking speed can be more easily increased by providing some body weight support. Of the 10 who started and completed Precision Training, 1 dropped out after this phase (P11), and 1 started chemotherapy during the Endurance phase of the training (P19), so 8 in this group completed both phases of training. Thus, when we collapsed the data across the order of training to compare Precision versus Endurance Training, there were 20 participants for Precision Training and 17 participants for Endurance Training. The trial was stopped at this point because an interim calculation of sample size, based on the mean change scores in SCI-FAP, indicated that a very large number of participants (n = 360) would be needed to obtain a statistical power of .8.
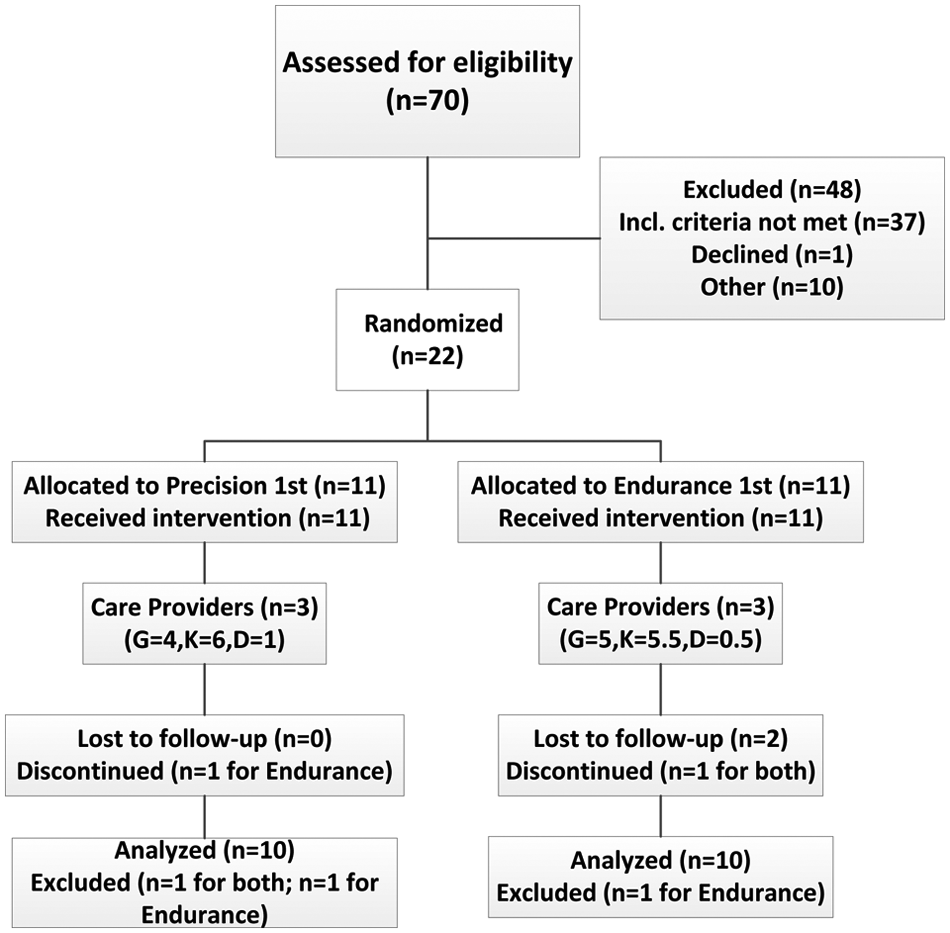
CONSORT diagram summarizing the number of participants in each arm of the study. Excluded individuals in the Other category were mostly those who lived too far away and could not relocate for personal reasons. Care provider codes: G, K, and D are for the 3 physical therapists (PTs) who provided the training; numbers that are fractions are because the PT provided one phase of the training (ie, 0.5). See text for those who discontinued or were excluded.
Baseline Measures From the Two Groups Were Not Different
The groups starting with Endurance versus Precision Training were not significantly different from each other (Table 1).
Participant Characteristics and Initial Walking Scores.
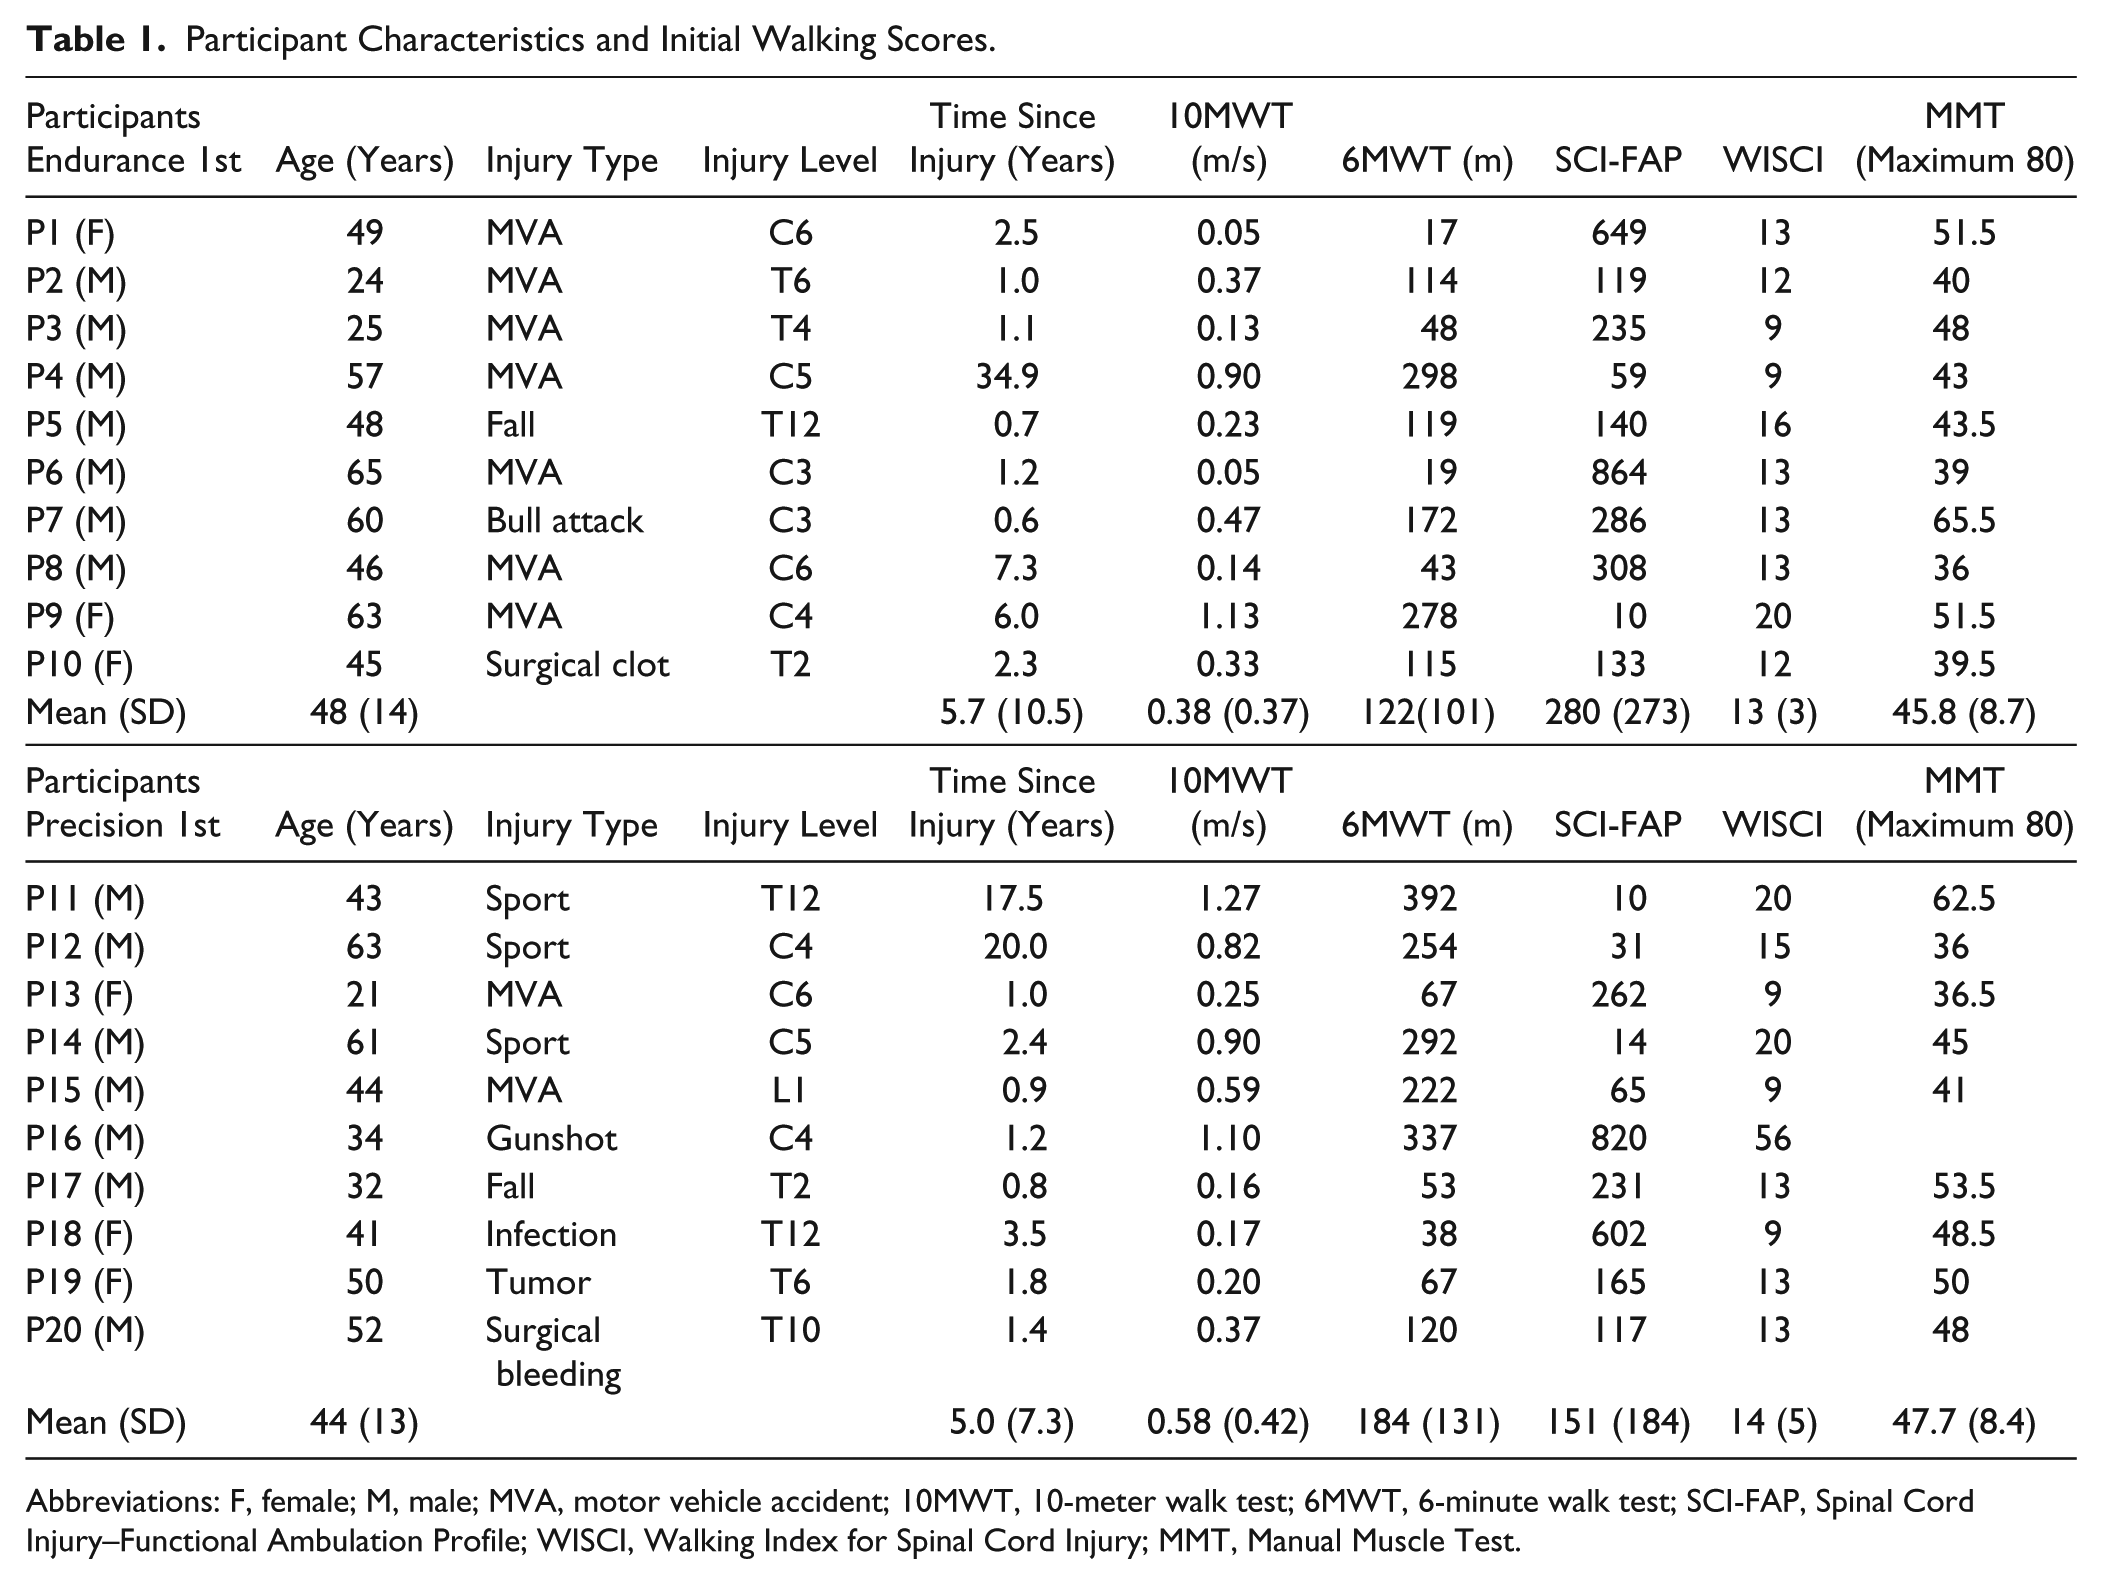
Abbreviations: F, female; M, male; MVA, motor vehicle accident; 10MWT, 10-meter walk test; 6MWT, 6-minute walk test; SCI-FAP, Spinal Cord Injury–Functional Ambulation Profile; WISCI, Walking Index for Spinal Cord Injury; MMT, Manual Muscle Test.
Intensity of Training
The number of training sessions and the average walking duration/session were the same for both training methods, but the average walking speed and the average number of steps (strides) executed per session were ≥3 times higher for Endurance Training (Figure 2A). Peak change in heart rate (ΔHR), averaged across all sessions, was also higher for Endurance Training (Figure 2A).
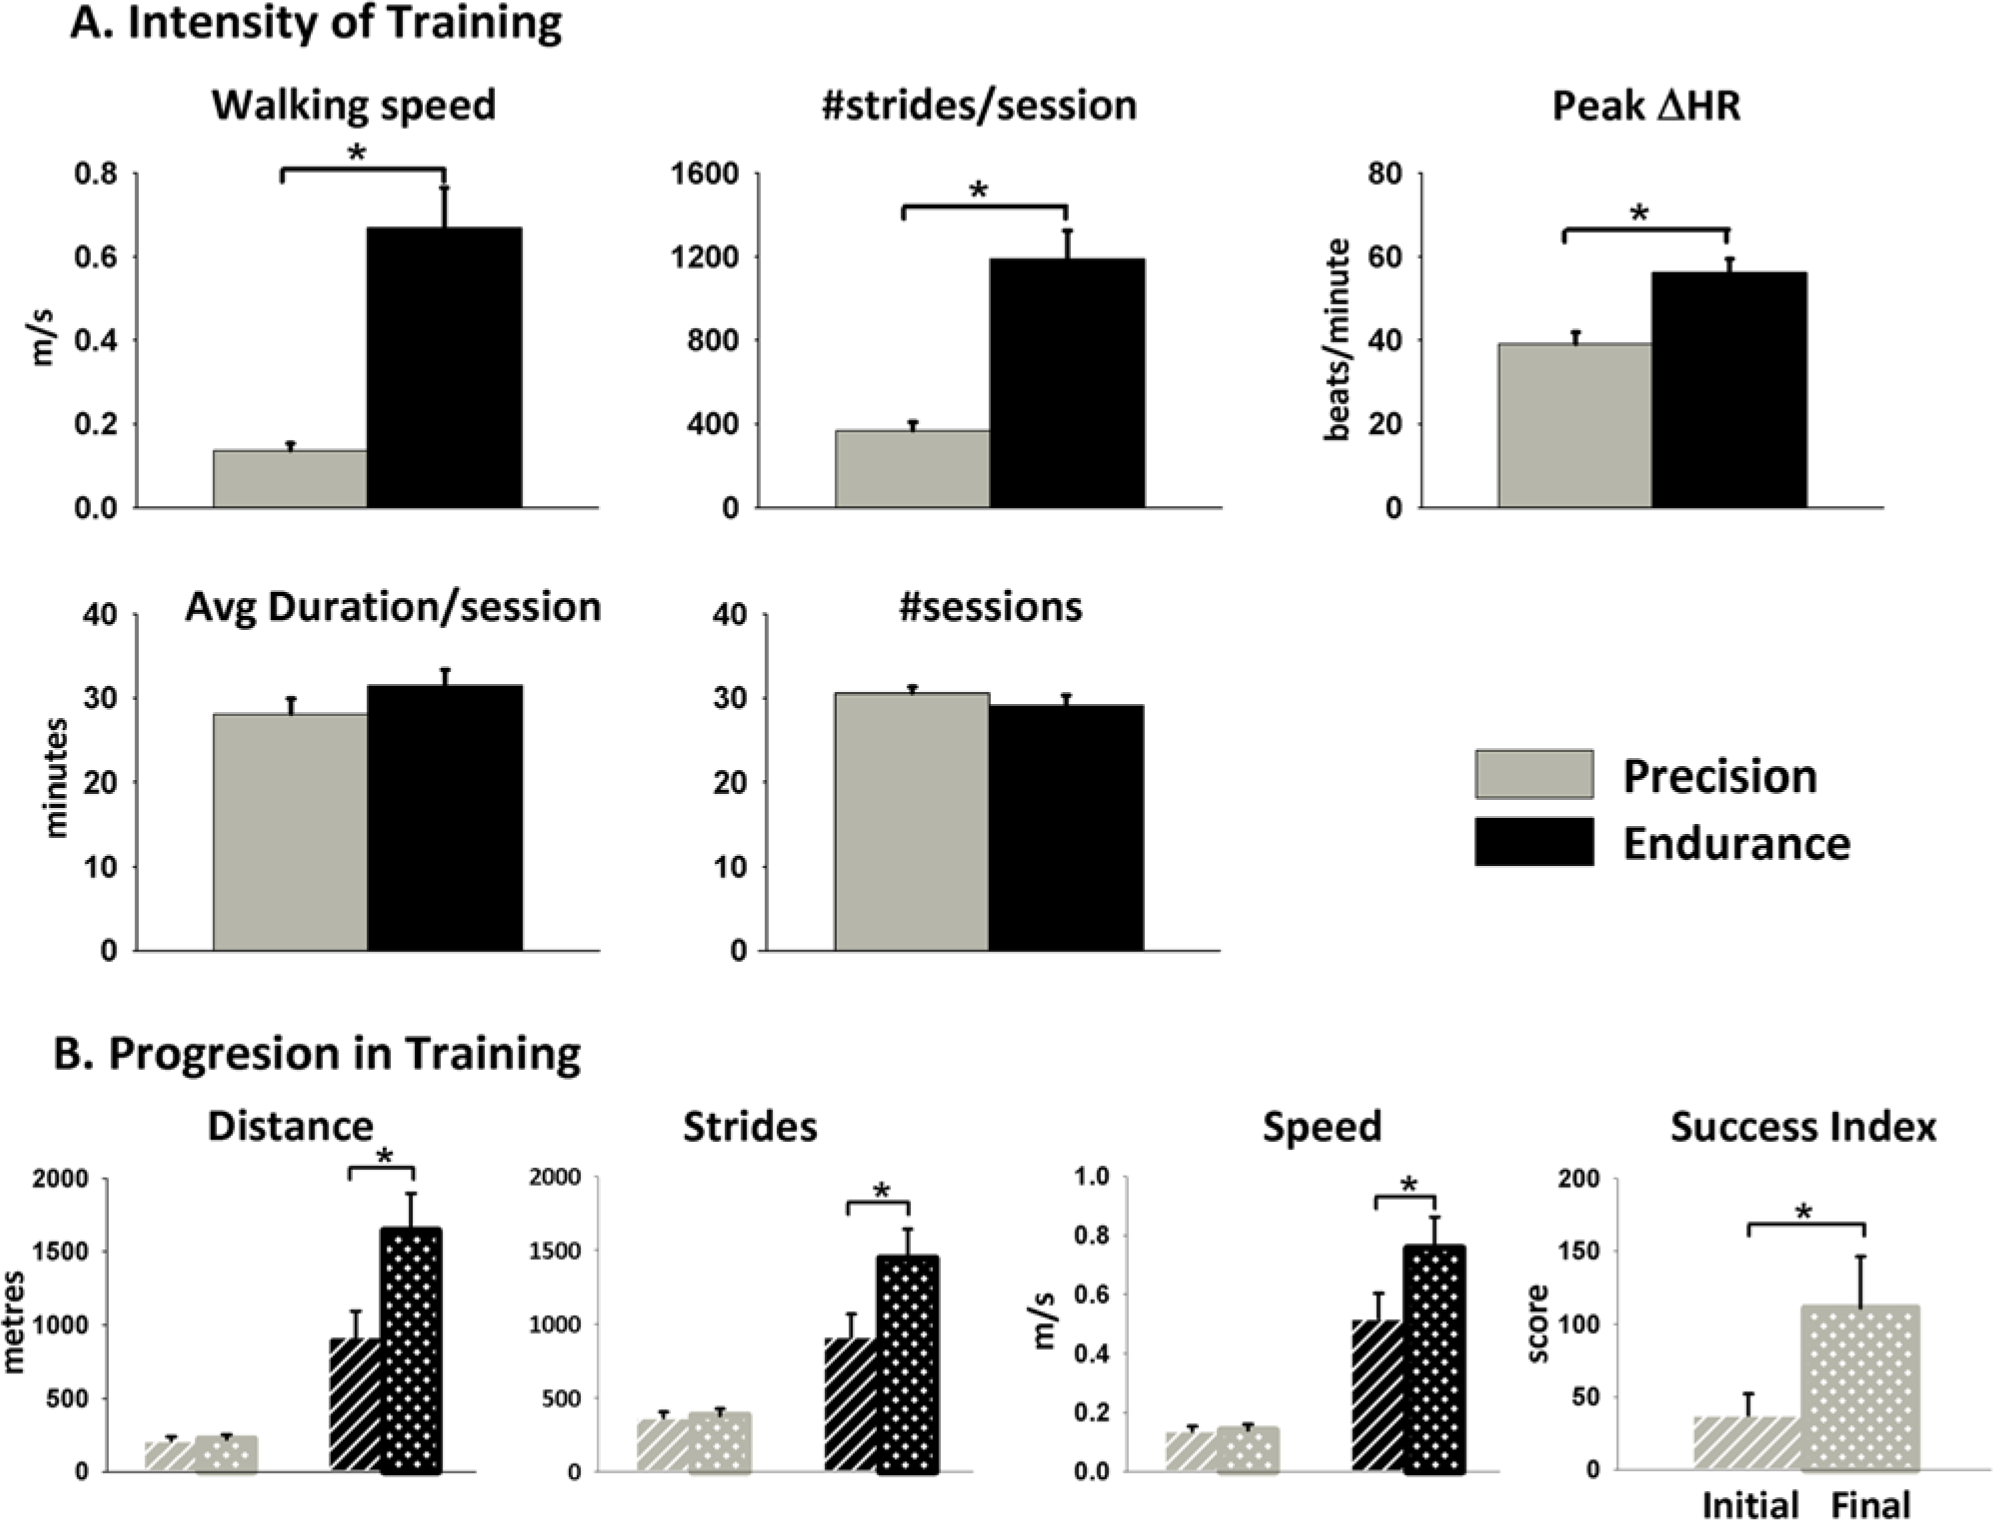
Intensity and progression in training. (A) Measures of training intensity are shown for Precision and Endurance Training (mean and standard error of the mean). Significant differences (standard t test; P < .05) indicated with *. (B) Progression of training measured during Precision and Endurance phases from initial (average of first 3 training sessions; hatched) to final (average of last 3 training sessions; cross hatched) training. Significant improvements (paired t test; P < .05) indicated with *.
Progression During Training
Endurance Training was characterized by significant improvements in distance, number of strides, and speed (Figure 2B). The 5 participants who required body weight support reduced the support by 60% ± 42% (not shown). Precision Training was characterized by a significant improvement in the Success Index, but no change in distance, speed, and number of strides. Thus, the original premise that one method focused on mass practice of fast and long walks, whereas the other focused on precise, slow stepping, was achieved.
Endurance Versus Precision Training
Most of the outcome measures were significantly improved from pre- to posttraining, shown as change scores with a white asterisk (*) in Figure 3. The estimated MDCs (see Statistical Analysis in Methods section) are shown as dashed horizontal lines. Endurance Training led to improvements that were ≥MDCs for more measures than Precision Training. Improvement in the 6MWT was significantly greater for Endurance compared with Precision Training (Figure 3, black *, P = .045, standard t test); no other comparisons were significant (P values for standard t tests: SCI-FAP = .35, 10 MWT both (ss) and (f) = .37, Activities-specific Balance Confidence scale = .52, and for the Mann–Whitney U test: WISCI(ss) = .42 and WISCI(max) = .82). The linear mixed model analysis showed the same results for the SCI-FAP, as described above. Furthermore, since most participants retained their gains during the rest period after phase 1 training, we also compared the effects of Endurance and Precision Training from phase 1 separately (see Supplemental Data available online at http://nnr.sagepub.com/supplemental). The change scores were still very similar between Precision and Endurance, none of them being statistically different. More of the change scores from phase 1 exceeded the MDC than shown in Figure 3, because the changes were greater in phase 1 compared with phase 2.
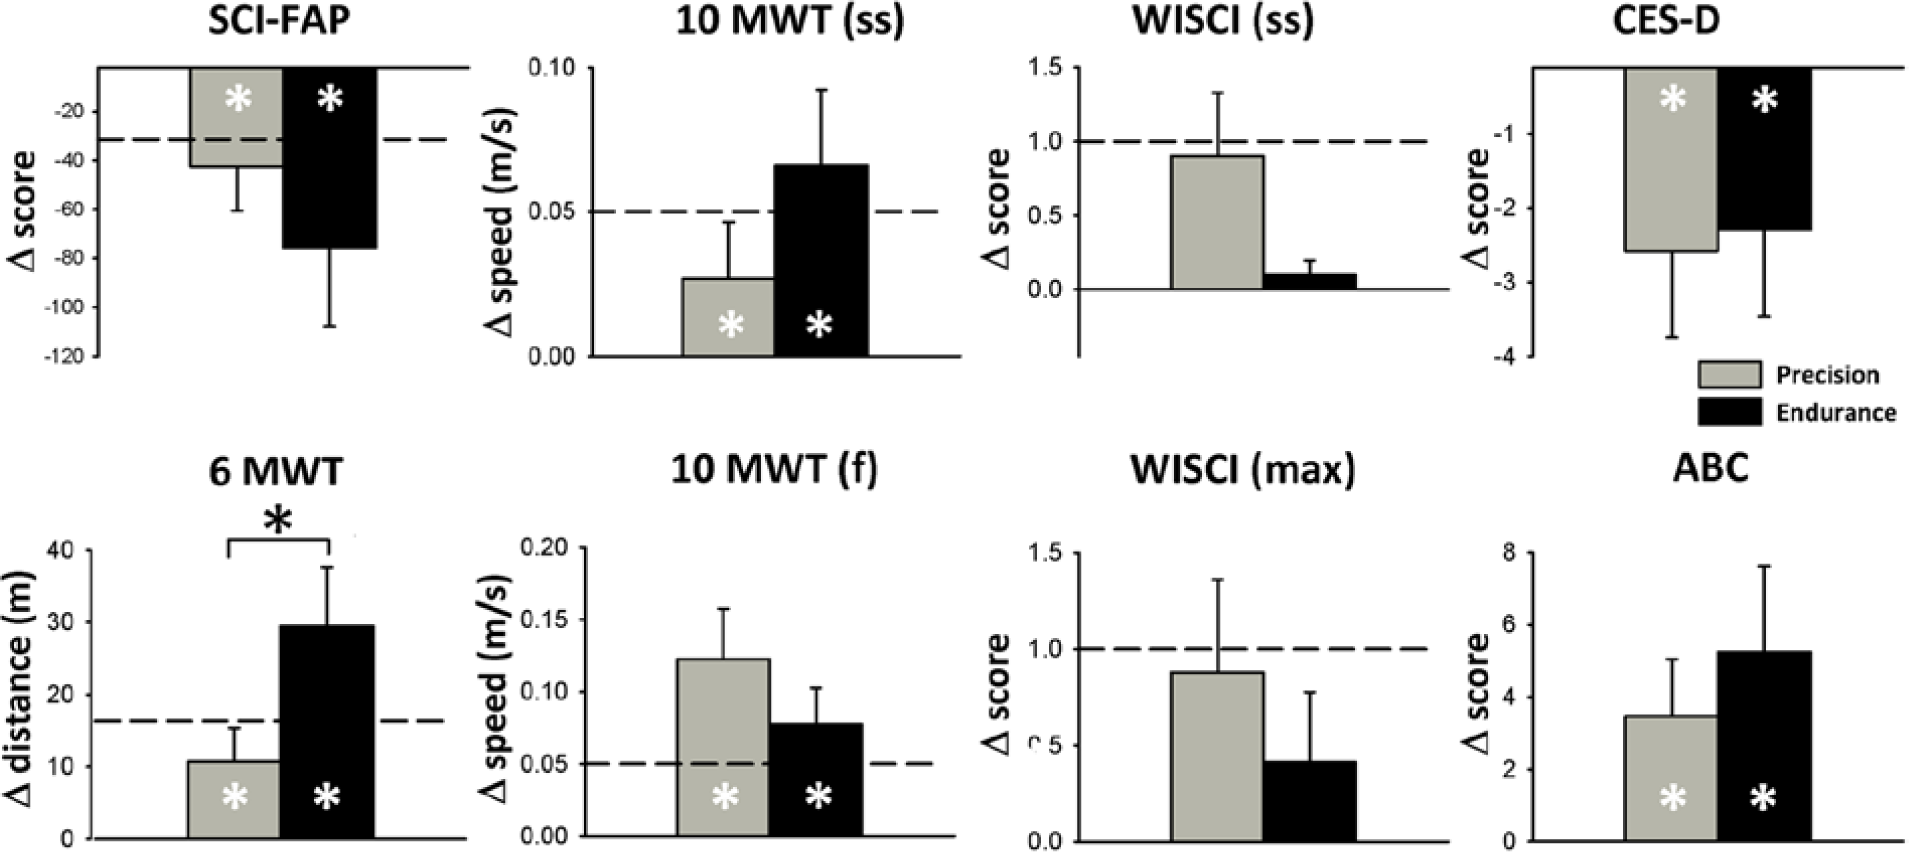
Change scores for all outcome measures with each type of training. Mean change is shown with one standard error of the mean. Statistically significant improvement within each method is shown with a white * in the bar (paired t test comparing scores pre- and posttraining; P < .05). Statistically significant difference between the 2 methods is illustrated with a black * above the bars (standard t test; P < .05). The minimally detectable change (dashed line) is shown for walking measures. The number of participants in each group was 20 for Precision Training and 17 for Endurance Training.
Low Versus High Functioning Walkers
High- (n = 8 Endurance, n = 9 Precision) and low- (n = 9 Endurance, n = 11 Precision) functioning walkers tended to respond differently to the 2 methods of training (Figure 4). High-functioning walkers improved more with Endurance Training, as reflected by significant differences in the 6MWT (P = .03). In contrast, there were no significant differences between the 2 training methods for low-functioning walkers.
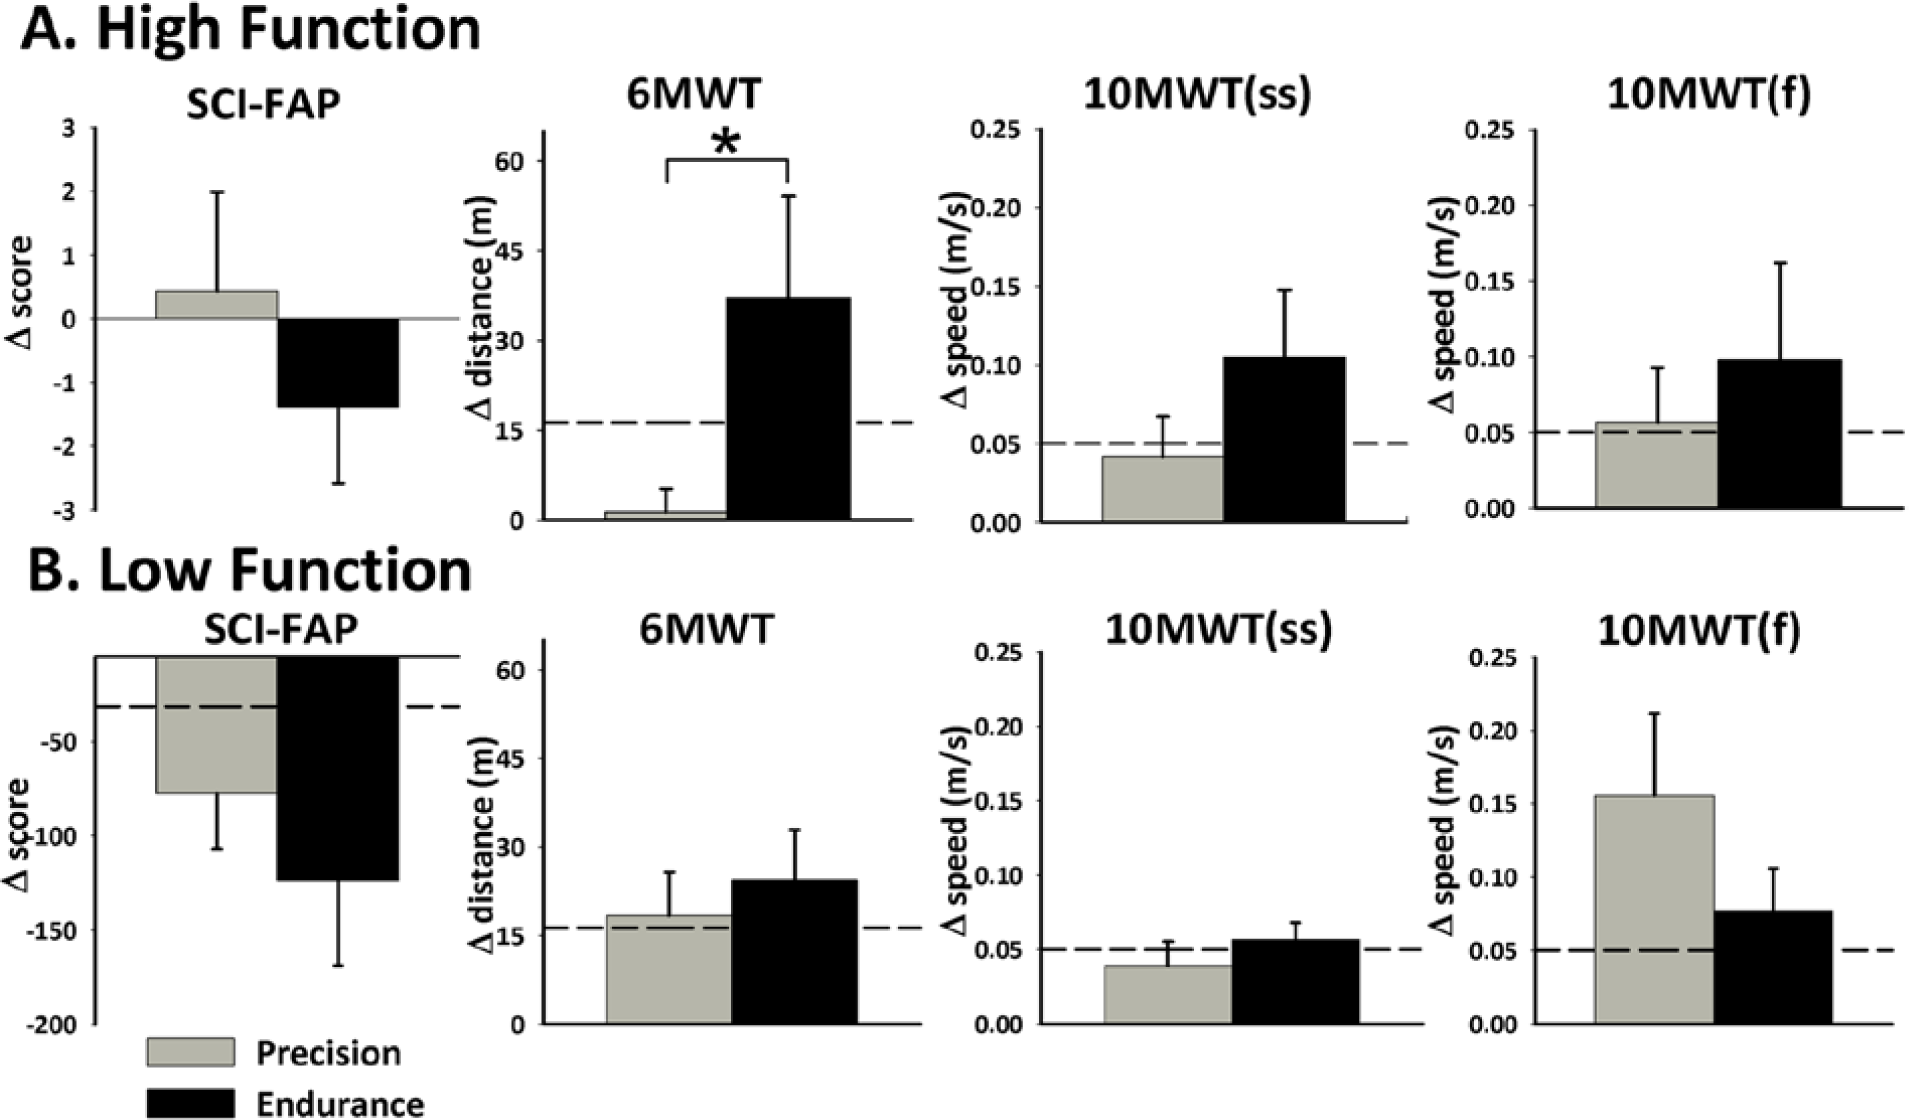
Response of high versus low functioning individuals to Precision versus Endurance Training. Individuals were considered high or low functioning based on their walking speed pre-training, for each phase of the training, using the 10MWT(ss) (ie, high >0.5 m/s, low <0.5 m/s). Change scores are shown with one standard error of the mean. Statistically significant difference between the two methods is shown with * (standard t test; P < .05). Horizontal lines indicate minimally detectable difference (see text).
Time Course of Improvement During Training
In Precision Training, the improvements in walking speed, distance, and skill (SCI-FAP) occurred approximately equally over the 2 months (compare hatched vs dotted gray bars, Figure 5). Conversely, in Endurance Training, improvements in walking speed and distance (ie, 10MWT(ss), 10MWT(f), 6 MWT) occurred mostly during the first month of training, while improvements in SCI-FAP occurred over both months.
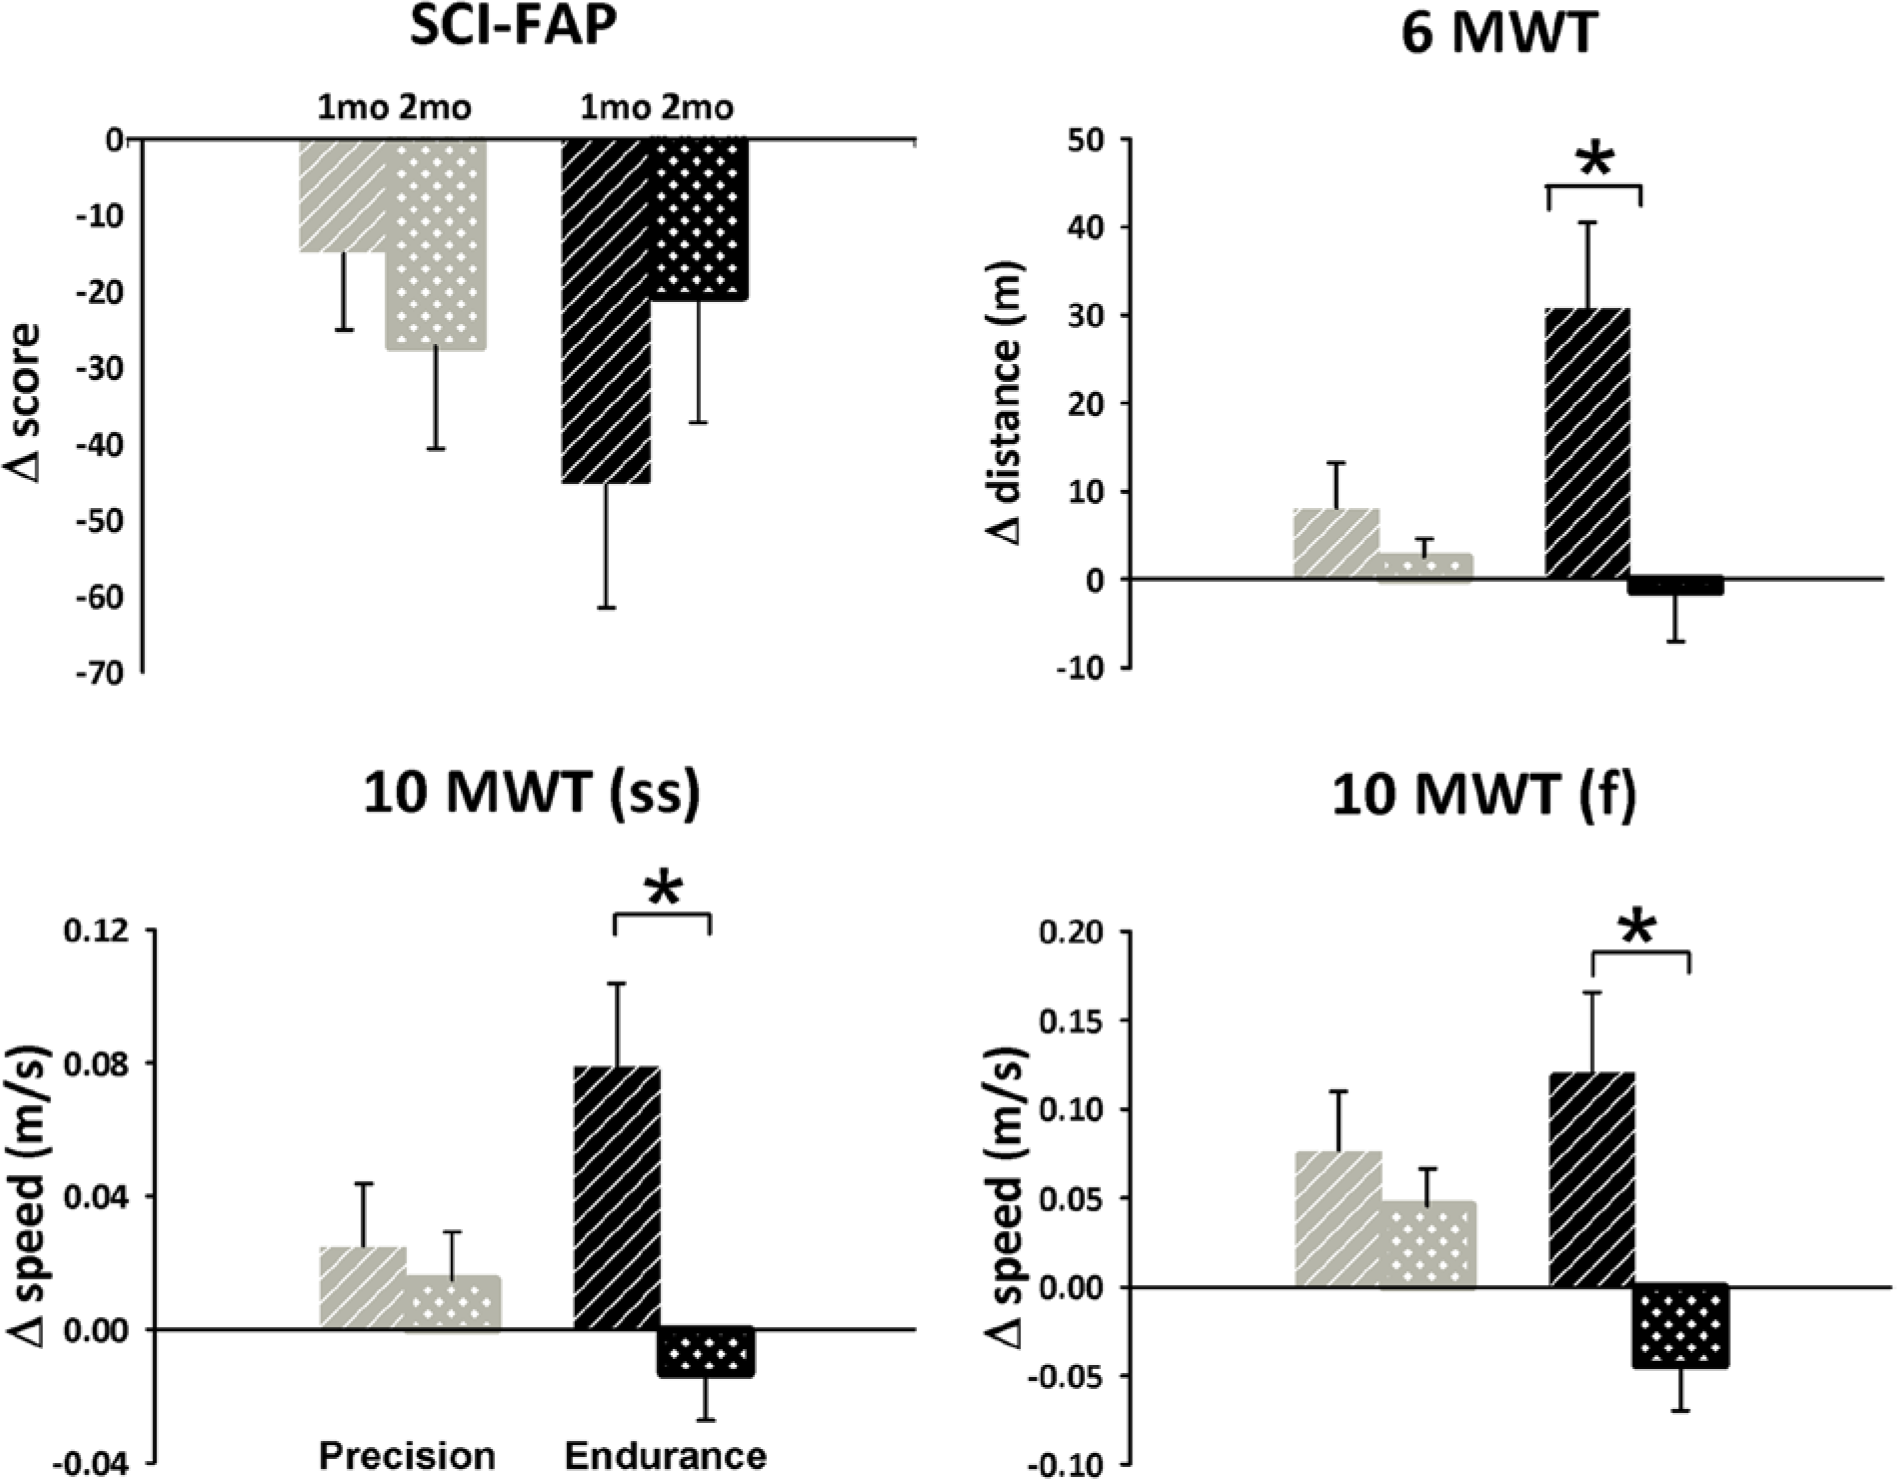
Time course of improvements in each type of training. Improvements in walking speed (10MWT) and distance (6MWT) tended to occur in the first month of training, especially with Endurance Training (black bars). Improvements in walking skill (SCI-FAP) were seen over both months, for both types of training. Statistically significant difference change scores in the 2 months is shown with * (paired t test; P < .05).
Characteristics of Those Who Did Not Improve
Three individuals (P2, P4, P16; 18%) did not improve by >MDC in any walking outcome during Endurance Training, 2 of the 3 (P2, P4), together with 4 others (P1, P10, P11, P14; ie, 6 total; 30%) did not improve during Precision Training. There were no differences between time since injury, age at onset of training, initial walking ability, MMT prior to training, and training intensity between those who did and did not improve.
Retention of Improvements
We lost 2 individuals to follow-up after the second phase of training, both cases being after Precision Training. One did not attend the final assessment, while the other joined another intensive treatment program and was ineligible for follow-up. We compared retention after each type of training (average follow-up time 1.9 ± 0.4 months for Endurance, and 1.9 ± 0.5 months for Precision Training), and after phase 1 versus phase 2 of training. In addition, individuals who improved by >MDC were analyzed separately, to avoid biasing the results by individuals who did not improve during training, but maintained their function nevertheless. Regardless of the training type, or the phase of training, participants retained their gains whether those who did not respond to treatment were included or not. Furthermore, retention of walking ability was the same for the 2 training methods (ie, average Retention Index for walking measures: Endurance=1.04 ± 0.05 (mean ± SD), Precision = 1.05 ± 0.21). Correlations between the final walking speed and the Retention Index were small to moderate (r = 0.05-0.38), indicating high- and low-functioning walkers retained their gains equally well. Correlation between Center for Epidemiologic Studies–Depression Scale with the Retention Index was also low (ranging from r = 0.03 to 0.08), indicating retention was unrelated to depression scores in our cohort.
Discussion
Is Mass Practice Better Than Precise Practice?
Endurance Training (mass practice) was superior to Precision Training (skill practice) for inducing large improvements in walking distance. Surprisingly, it also improved walking skill just as much as Precision Training (Figure 3), opposite to our original hypothesis that Precision Training might be superior to Endurance Training, because it engages the motor cortex 25 (see Introduction section). The findings may mean that challenging individuals with SCI to walk faster and longer on a treadmill is sufficient to induce corticospinal tract plasticity. Indeed, increases in motor-evoked potentials with single-pulse transcranial magnetic stimulation recorded before and after endurance training supports this. 44 Furthermore, Endurance Training involved 3 times as many steps at more than 3 times the speed in each training session (Figure 2), so the number of steps and/or the speed of walking may also be very important to induce plasticity. The improvements could also have been due to cardiovascular conditioning, since the peak ΔHR during Endurance Training was 56 ± 14 beats/min compared with Precision Training, which was 39 ± 12 beats/min, although cardiovascular conditioning should not have affected measures of walking skill. To identify the key ingredient(s) responsible for the differences between Endurance and Precision Training, such as walking speed, number of steps per session, or ΔHR during training will require control of these variables in future studies.
Another possible explanation why Precision Training was not superior to Endurance Training is that our outcome measures could not gauge the high-level improvements made during Precision Training in the high-functioning group. The types of improvements expected from Precision Training are dynamic balance and skill during walking. Indeed, all participants could walk over much higher and wider obstacles, as documented by the Success Index (Figure 2B). Our primary measure of walking skill was the SCI-FAP, which was designed to measure daily walking skills, so the ceiling may be too low to measure these higher level skills. A normal score on the SCI-FAP is 7; 3 participants had scores just above 7 prior to Precision Training. The other measure that may reflect walking balance is the WISCI, but the ceiling was too low for some (ie, WISCI(ss) = 20 for 4 participants before Precision Training). Thus, better outcome measures to gauge high-level walking skill are needed.
The improvements in walking outcomes with both types of training resembled those reported by others. For example, improvement in self-selected walking speed in randomized controlled trials of people with chronic injury, with n > 10 per group7,16,22 were mean change scores of: 0 or 0.01 m/s, 16 0.01 m/s to 0.09 m/s, 22 and 0.02 m/s and 0.4 m/s, 7 while we report 0.07 m/s for Endurance and 0.04 m/s for Precision Training. Our change scores could have been reduced because we collapsed the data across 2 phases. As most of the gains were made in phase 1, collapsing the data will under estimating the change scores overall. The change scores for phase 1 only are 0.07 m/s for Endurance and 0.06 m/s for Precision (Supplementary Data). Our participants were not unique compared with those in other studies with respect to chronicity of the injury or walking ability prior to training. Our training parameters (number of sessions, duration of sessions) are also close to the median values reported by others (reviewed in Yang and Musselman 19 ). Finally, the number of steps executed in Precision Training is low, but this parameter is rarely reported in the literature. In the case where the target number of steps had been reported (800-1250), 10 Endurance Training is comparable (1189 ± 557), but Precision Training is lower (369 ± 180). Thus, we suggest that this training parameter may be very important to follow in the future.
High- and Low-Functioning Walkers Benefitted Differently From the Two Types of Training
Endurance Training induced greater change than Precision Training in the 6MWT for high-functioning walkers, whereas there were no differences for any of the walking outcomes for the low-functioning walkers. The difference in response could not be explained by a relative difference in the way they trained, since the number of strides executed in training was approximately 3 times higher for Endurance Training compared with Precision Training for both groups. Thus, we suggest that the method of training is less critical for individuals with low walking function, while higher functioning individuals may benefit more from Endurance Training. Of course, these conclusions cannot be generalized to very low functioning individuals, since they were excluded from participating.
Improvements in Walking Speed and Distance Are Acquired Faster Than Walking Skill
The largest changes in walking speed and distance were induced by Endurance Training in the first month (Figure 5). This suggests that the fastest way to boost walking speed and endurance is to use mass practice as we did in Endurance Training. In contrast, walking skill (ie, SCI-FAP) improved more slowly, extending over the 2 months with both types of training. This agrees with our previous case report, in which we trained individuals with a program of alternating treadmill and over ground walking training, 21 in which improvements were found over at least 6 months. Thus, it is important that treatment not be terminated too early. Furthermore, it is insufficient to only measure walking speed and distance in walking outcome; skill is an important and different aspect of walking, which has a different time course for improvement.
Retention of Walking Ability After Training
Retention of walking speed, distance, and skill was good after both forms of training. Since the relationship between final walking speed and retention was weak to modest, it suggests that other factors unrelated to walking speed may have been more important to retention, such as the motivation of the individual. In the future, it would be useful to quantify the activities participants engaged in during the rest period, to better understand the factors affecting retention.
Limitations
First, the participants were a sample of convenience. As the study required heavy time commitment from participants, they were among the highly motivated, a selection bias. Second, the sample size was small, resulting in moderate statistical power for detecting small differences (Cohen’s d 45 between 0.21 and 0.69 for walking outcome measures). Third, 4 participants (P5, P11, P15, P18) had lesions at T12-L1, whose response to training could be different from participants with higher levels of injury. However, no differences were seen between the improvements made by these individuals compared to the rest of the cohort (ie, Δ10MWT(ss) during Endurance = 0.04-0.06 m/s for T12-L1 lesions, 0.07 ± 0.12 m/s for higher lesions, and during Precision = 0.0-0.15 m/s for T12-L1 lesions, 0.04 ± 0.06 m/s for higher lesions). Fourth, 4 participants (P5, P7, P15, P17) were injured less than a year ago, so it is possible that spontaneous recovery influenced their improvement, even though their baseline scores were stable. Indeed, their improvements in 10MWT (ss) were higher than the mean of the other participants, although still within the range of improvements observed in the other individuals (0.04-0.16 m/s for <1 year postinjury vs 0.06 ± 0.12 m/s >1 year postinjury for Endurance, and 0-0.15 m/s for <1 year postinjury vs 0.03 ± 0.06 m/s for >1 year postinjury for Precision). Finally, it was difficult to enforce the same level of physical activity in our participants, especially during the rest periods.
Conclusions
The 2 forms of training, although very different, both led to improvements in over ground walking. Mass practice (Endurance Training) resulted in greater changes in walking distance. Both led to improvements in walking skills needed in daily life. Finally, better outcome measures to gauge improvements, especially in walking balance and skill, are still needed as the ceiling in many measures remains low.
Footnotes
Acknowledgements
We thank Drs Blair Calancie and Hubertus van Hedel for helpful comments on earlier versions of this manuscript. We thank the physical therapists, Sarah Pletch, Tina Carter, and Michelle Krappala, for serving as blinded assessors, the physical therapy assistants, Rachelle Lohlun and Katelyn Brown, for assisting with the training and organization, and the participants for devoting their time and effort to the study.
Declaration of Conflicting Interests
The author(s) declared no potential conflicts of interest with respect to the research, authorship, and/or publication of this article.
Funding
The author(s) disclosed receipt of the following financial support for the research, authorship, and/or publication of this article: This project was supported by the Canadian Institutes of Health Research, Christopher and Dana Reeve Paralysis Foundation, Alberta Paraplegic Foundation, Rick Hansen Institute, and the Rehabilitation Medicine Students Association.
References
Supplementary Material
Please find the following supplemental material available below.
For Open Access articles published under a Creative Commons License, all supplemental material carries the same license as the article it is associated with.
For non-Open Access articles published, all supplemental material carries a non-exclusive license, and permission requests for re-use of supplemental material or any part of supplemental material shall be sent directly to the copyright owner as specified in the copyright notice associated with the article.