
Abstract
Background. Neurorehabilitation protocols based on the use of robotic devices have recently shown to provide promising clinical results. However, their efficacy is still limited because of the poor comprehension of the mechanisms at the basis of functional enhancements. Objective. To increase basic understanding of robot-mediated neurorehabilitation by performing experiments on a rodent model of stroke. Methods. Mice were trained to pull back a handle on a robotic platform and their performances in the task were evaluated before and after a focal cortical ischemic stroke. The platform was designed for the quantitative assessment of forelimb function via a series of parameters (time needed to complete the task, t-target; average force; number of sub-movements). Results. The animals rapidly learned the retraction task and reached asymptotic performance by the fifth session of training. Within 2 to 6 days after a small, endothelin-1-induced lesion in the caudal forelimb area, mice showed an increase in t-target and number of sub-movements and a corresponding decrease in the average force exerted. These parameters returned to baseline, pre-lesion values with continued platform training (10-14 days after stroke). Conclusions. These results highlight the utility of the devised platform for characterizing post-infarct deficits and improvements of forelimb performance. Further research is warranted to widen the understanding of device-dependent rehabilitation effects.
Introduction
Stroke affects 15 million people worldwide each year and is one of the leading causes of long-term disability.1,2 Loss of limb function is a common consequence of stroke, and there is a pressing need to develop novel, more effective methods to restore sensory–motor functions after stroke. Recently, several robotic devices have been developed for rehabilitation of the limbs following brain injury. 3 Mechatronic devices have key advantages over conventional physiotherapy as they (a) provide an intensive and highly repeatable “dosage” of therapy and (b) offer a quantitative and objective evaluation of the outcome for each patient, thanks to built-in sensors that measure different parameters such as forces exerted by the subject and smoothness of movement.3,4
However, a major obstacle that limits the effective design of robotic devices—for example, with respect to the clinical outcome of intensive therapy 5 —is that the mechanisms of limb recovery following infarct are not well understood.6,7 Preclinical animal studies can offer a significant contribution to gain this knowledge, but need specific methodologies to assess impairments and, eventually, motor recovery in a quantitative way. In this context, the mouse allows coordinated electrophysiological, neuroanatomical, biochemical, and mechanistic studies because of the availability of several transgenic and mutant strains. Thus far, some robot-based rehabilitation protocols have been proposed for rodents, but they were limited to investigate gait function after spinal cord injuries.8,9 Robotic protocols for rehabilitation of forelimb function have not been described in mice, and rehabilitation in rodent models typically relies on the repetitive execution of a behavioral task.10-13
The development and use of a robotic platform for mice is appealing for mechanistic studies but raises challenging issues from behavioral and technological points of view. For example, the possibility of training mice to use their forelimb in a robotic system has not been previously explored. Moreover, monitoring kinetic and kinematic parameters of limb motor task poses strict requirements on accuracy and sensitivity. Here, we have developed a robotic platform for mice that mimics a human robot device for upper limb stroke rehabilitation. 14 This mechatronic platform allowed us to obtain a quantitative assessment of pre- and poststroke motor function of the forelimb in an objective and repeatable way.
Materials and Methods
The Robotic Interface
Our robotic system (dimensions 300 × 300 mm) was composed of a linear actuator (Micro Cylinder RCL, IAI Industrieroboter GmbH, Schwalbach am Taunus, Germany), a 6-axis load cell (Nano 17, ATI Industrial Automation, Apex, NC), a precision linear slide (IKO BWU 25-75), and a custom-designed handle that was fastened to the mouse wrist (Figure 1A). The handle was composed of 2 hinged parts, an upper (UC) and a lower (LC) component, which had a semicircular groove (1.15 mm radius) and one magnet stuck near the hinge to help in maintaining the UC and LC juxtaposed. One extremity of the LC was screwed on the load cell for lossless transfer of the forces to the sensor; the other end formed a support for the animal wrist by allowing a comfortable fixing (i.e., no compression) without letting the forepaw slide through.
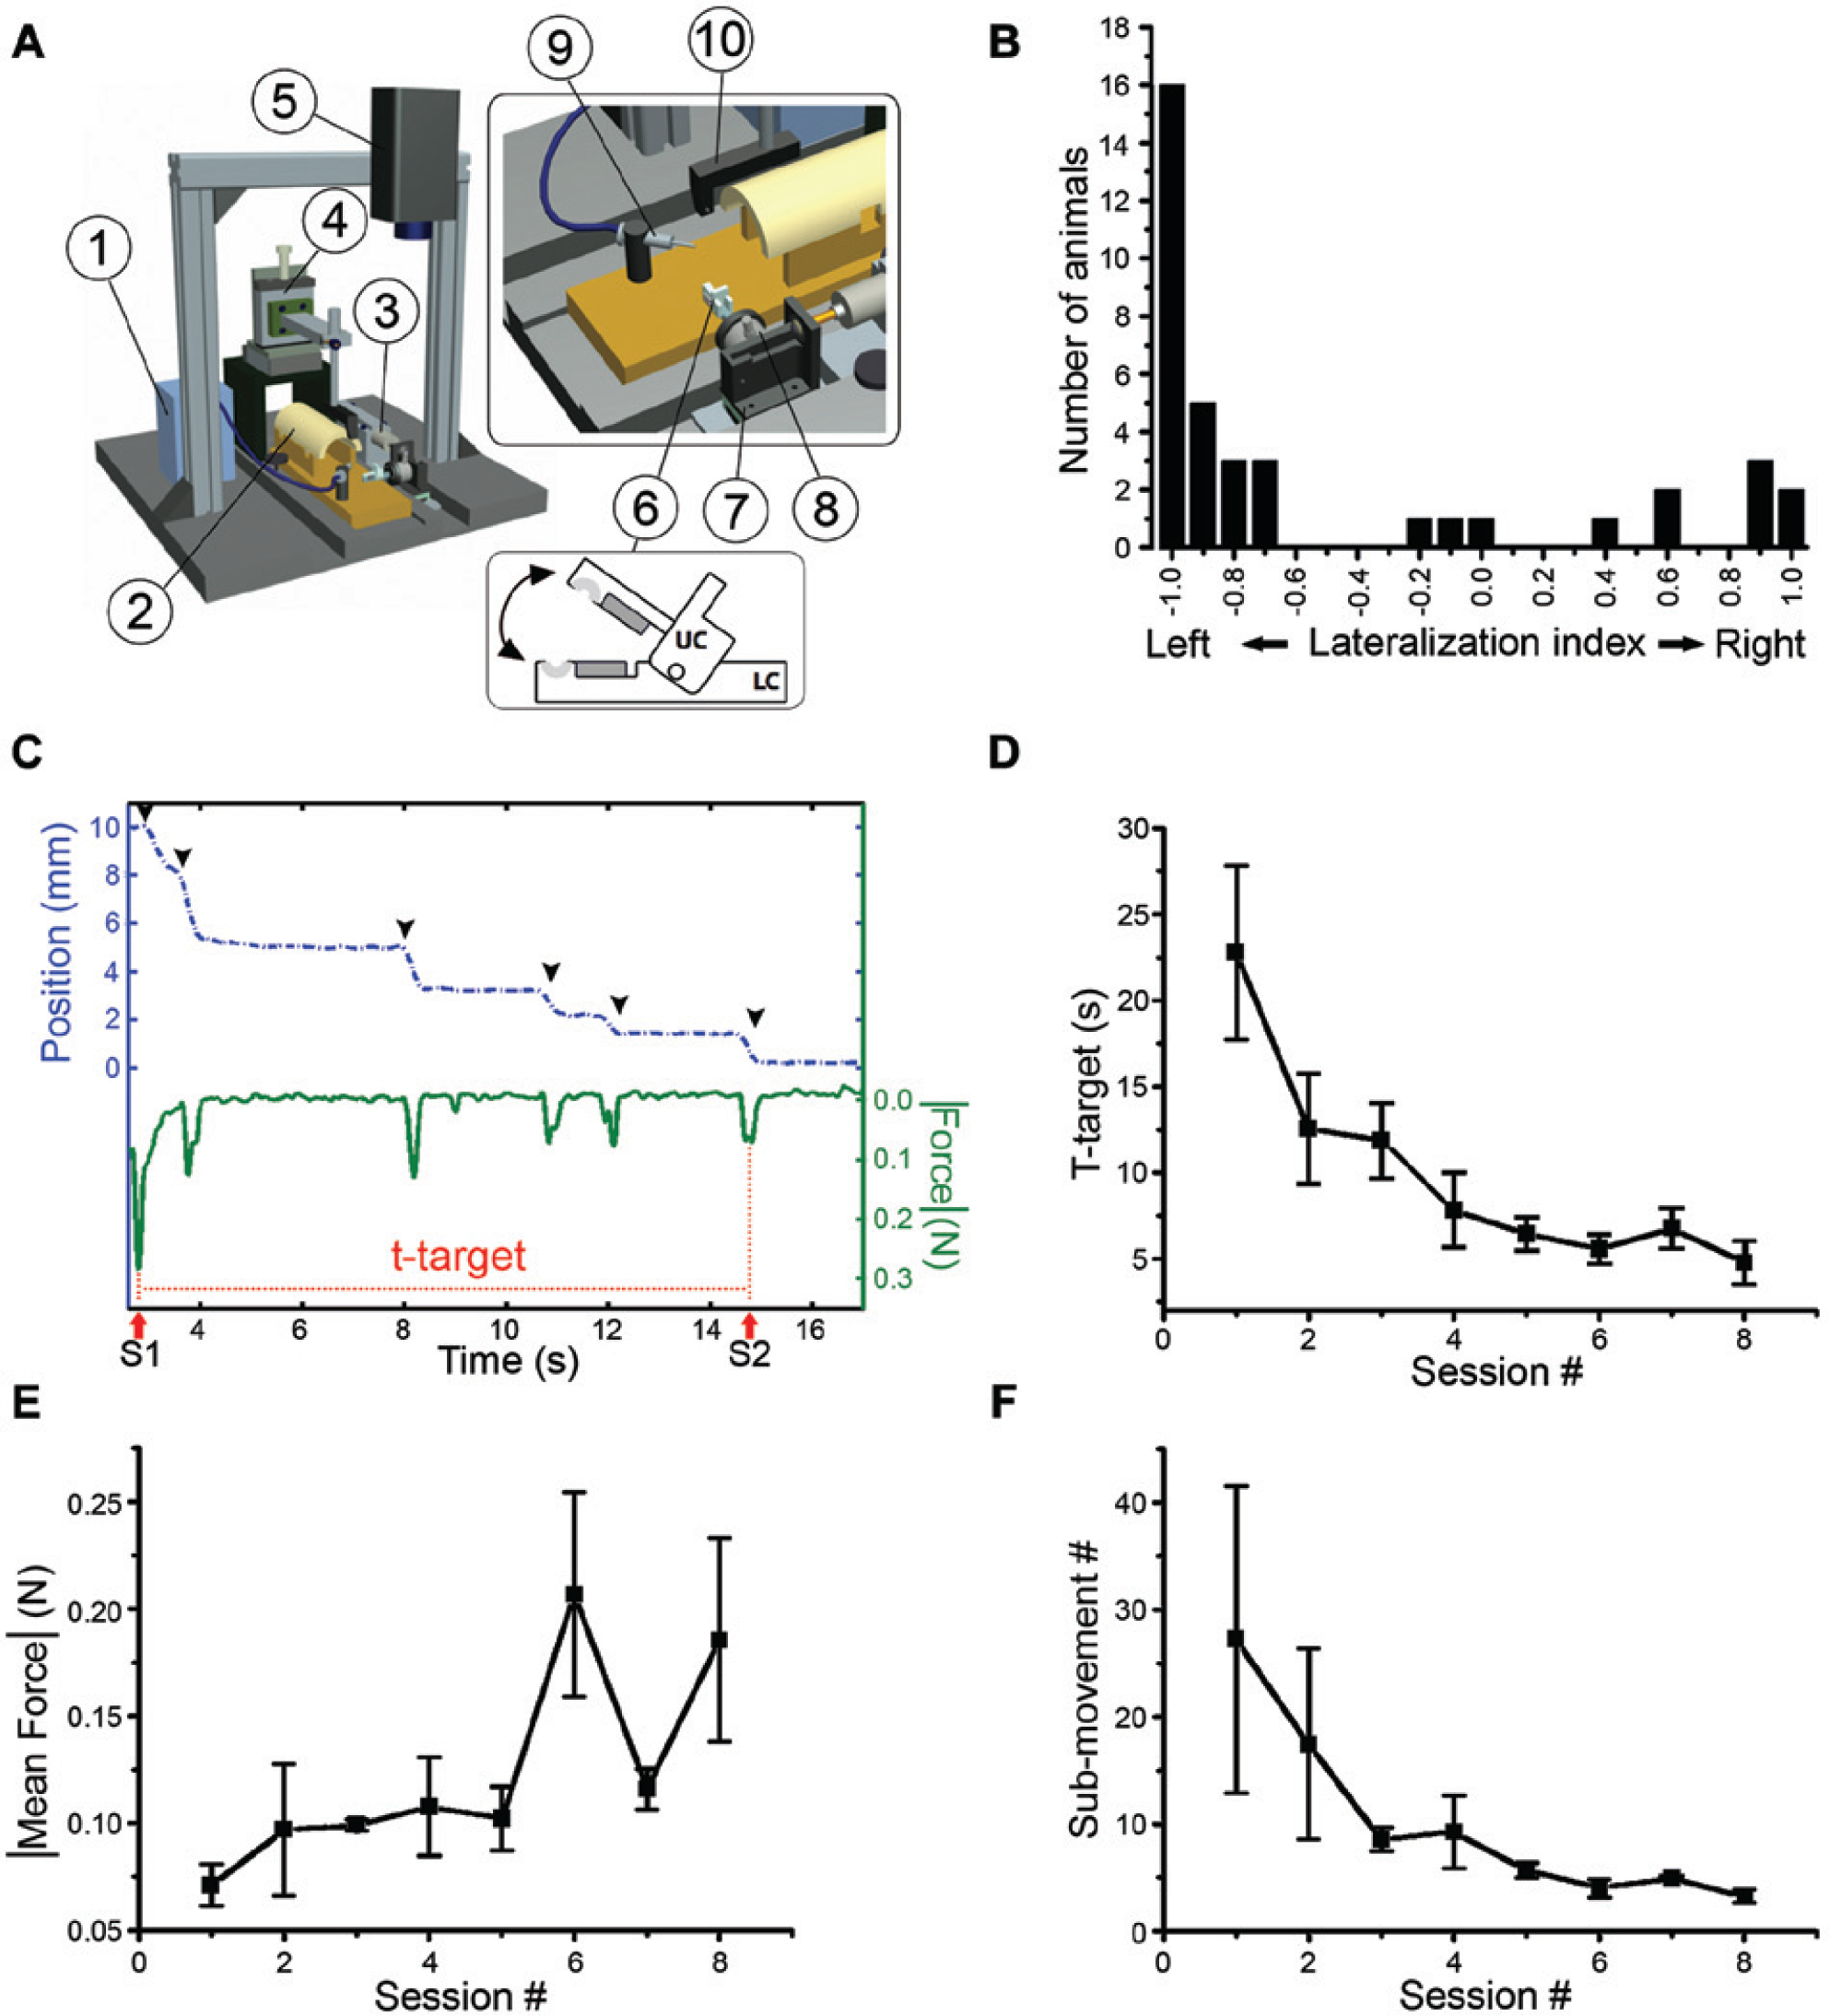
Learning of the retraction task in the robotic platform. (A) Schematic of the robotic interface. It consists of a peristaltic pump for reward delivery (1), mouse restrainer (2), linear actuator (3), micromanipulator (4) for precise positioning of the mouse head, camera (5), handle (6), slide (7), load cell (8), gavage-feeding needle (9), and head fixation system (10). A schematic of the handle is also shown: the upper and lower components (respectively UC and LC), the 2 magnets (gray) and the semicircular groove (light gray). (B) Lateralization of the mice in the Collins paw preference task. (C) Representative example of a single retraction task (active phase) in the robotic platform. Blue dotted line, position of the handle over time; green continuous line, force over time. S1 and S2, tones indicating begin and end task. The offset of the force profile at S1 was because of the opposing force exerted by the animal during extension by the actuator. Arrowheads indicate single sub-movements; note force peaks in correspondence of each sub-movement. T-target was calculated as time S2 − time S1. (D-F) Variation of t-target (D), mean force exerted (E), and number of sub-movements (F) over the training sessions. Data are mean ± standard error.
During the task, the animal was kept in a U-shaped restrainer (interior dimensions 35 × 80 × 30 mm), and its head was fixated by means of a post cemented to the skull and connected to a translation stage (Melles Griot 2493M, Rochester, NY). In each trial, the linear motor pushed the handle and extended the mouse forelimb (passive phase); then, it quickly decoupled from the slide and retracted, such that the animal had to voluntarily pull back the handle (active phase) to move the slide. Mice pulling attempts resulted on handle displacements whenever the applied force level overcame the static friction resisting to sliding movements (Fs = 20 mN). A Hall effect position sensor (SS495A1, Honeywell International Inc, Morristown, NJ) and a tone generator were included for detecting and signaling task initiation and completion. A peristaltic pump (80204 Liquid Pump, Campden Instruments Ltd, Loughborough, UK) was used for liquid reward (apple juice) delivery.
Custom-made standard circuitry for Nano17 signal conditioning was developed, achieving a resolution of 2.5 mN root mean square, in all directions and a bandwidth of 0 to 1.2 kHz. Force signals were acquired and digitized (16 bits) using a USB DAQ board (USB-M6251, National Instruments Corp, Austin, TX). A programmable logic controller was used to control the linear actuator (ACON-CG, IAI, Industrieroboter GmbH, Schwalbach am Taunus, Germany). A custom-made interface circuitry between the programmable logic controller and the DAQ board was developed, capable to shift voltage levels and making communication between the 2 devices possible.
A linear encoder embedded in the actuator monitored the position of the handle during the passive phase of the protocol. The repeatability of the system during this phase was characterized by the repeatability standard deviation (RSD) computed according to ASTM International. 15 The RSD is the root mean square value of the standard deviation (SD) of position signals acquired while imposing the same trajectory repeatedly. The RSD was calculated on 540 repetitions of the passive phase of the protocol performed by 2 different mice (270 repetitions per mice). The RSD was 0.085 mm on a range of 10 mm.
During the active phase of the protocol, the position of the handle was monitored with a video camera (MVX3i, Canon). A black squared marker (5 × 5 mm) fixed to the linear slide was used as a reference. The handle was rigid (Young’s modulus ≈ 2.5 GPa) and assembled on the linear slide, such that the variation in position for the 2 components was basically the same. Signals from the video camera were analyzed offline. The video was synchronized with the force signal from the load cell. A custom-made Matlab (Mathworks, Inc, Natick, MA) algorithm was used to extract the position values from the recorded video frame by frame. To obtain speed values, a conventional 5-point method to compute the first derivative of the position in time was used. 16
Animals and Experimental Protocol
All procedures were performed according to the guidelines of the Italian Ministry of Health for care and maintenance of laboratory animals (law 116/92), and in strict compliance with the European Communities Council Directive n. 86/609/EEC.
A total number of 38 C57BL/6 mice were used. All the animals included in the study started the experiments at postnatal day 90 ± 5 days, and weighed 22 to 26 g for female and 25 to 29 g for male animals. Mice were housed in an animal room with a 12-hour/12-hour light/dark cycle, with food and water available ad libitum. Left-handed mice were selected in the Collins paw preference task 17 as follows. Animals were placed in a Plexiglas chamber (3.7 × 5.5 × 11 cm), in which a feeding tube (1 cm diameter) was attached to the front wall equidistant from the right and left sides, and at a height of 5 cm from the base. Small food pellets (weight = 15 ± 2 mg) were placed into the feeding tube, and the number of reaching movements was recorded for each forelimb. A lateralization index was calculated according to the following equation:
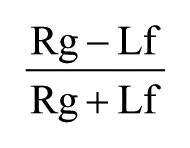
where Rg and Lf are the number of reaching movements performed with the right and the left paw, respectively. Following assessment of paw preference, we selected a total number of 14 mice (7 females and 7 males) with a strong preference for the left forelimb use (lateralization index ≤ −0.7). A metal post was implanted on the skull of all selected animals for purposes of head fixation. The 7 female mice were used for the initial study of task learning in the platform and were trained for at least 8 sessions, after which they received either endothelin-1 (ET-1; n = 5) or vehicle injections (n = 2). The 7 male mice received ET-1 (n = 5) or vehicle (n = 2) injections following a training of at least 5 sessions. All lesioned animals were trained for another 7 sessions in the platform and form the basis for Figure 3. The 4 animals used for vehicle injections were tested for 3 sessions post-treatment. All the animals received histological fixation at the completion of the behavioral tests for the stereological reconstruction of lesion volume.
Chronic Implant for Behavioral Testing
Mice were anaesthetized with Avertin (2.5% w/v Tri-Br-ethanol (Sigma, Milan, Italy) in 5% v/v tert-amyl alcohol in water; 0.02 mL/g) and placed in a stereotaxic apparatus. Using a motorized micromanipulator (Sutter Instruments, Novato, CA), a metal post (length 8 mm, diameter 2 mm, weight 0.2 g) was placed on the occipital bone and fixed by means of dentistry cement (Paladur, Pala, Germany).
Shaping and Training on the Platform
The mice were food and water–deprived for 10 ± 1 hours before testing on the robotic platform, which was always performed at the same hour in the afternoon. At least 2 consecutive days were devoted to habituate the animals to stay in the test chamber and to associate the reward, provided at regular intervals, with a tone. Then, the animal’s wrist was positioned in the handle and the following 2 to 3 days were needed to let the animal associate the reward with the end of the retraction task.
After the shaping phase, the animals were subjected every 2 days to experimental sessions within the robotic platform. An average of 15 trials per session were performed before the animals become satiated by the liquid reward and lost their motivation, that is, they stopped licking the juice drop from the gavage-feeding needle.
The training protocol consisted of a passive and an active phase. During the first one, the actuator extended the mouse forelimb from the resting position (RP) to the maximum extension position (MEP, 10 mm from RP). Then, the actuator was turned off and a tone (Ts1 = 0.50 seconds) informed the mouse about the task initiation. During the active phase, the animal performed the task by flexing the forelimb and pulling back the handle up to the RP. A different tone (Ts2 = 1.00 seconds) signaled task completion and the peristaltic pump automatically supplied a liquid reward (10 µL apple juice) only when the handle reached the RP. Finally within a fixed time delay (T2 = 5.00 seconds) the animal could drink the reward before starting a new cycle.
Induction of a Focal Cortical Ischemic Lesion
An ischemic cortical lesion was induced by intracortical delivery of ET-1 (Sigma, Milan, Italy).18-21 Mice were anesthetized with Avertin, placed in a stereotaxic apparatus and body temperature was maintained at 37°C. Injections were performed within the caudal forelimb area (CFA) 22 of the right hemisphere. The stereotaxic coordinates were defined according to the mouse atlas by Paxinos and Franklin 23 and previous intracortical mapping studies.22,24 We used 3 sites, where 200 nL each of ET-1 (1 µg/µL in sterile saline) were injected, to target the core of CFA. The coordinates for injection, all in millimeters and relative to bregma were as follows: (a) +0.5 anteroposterior, +1.7 mediolateral; (b) −0.25 anteroposterior, +1.7 mediolateral; (c) 0.0 anteroposterior, +1.25 mediolateral. The solution was injected by means of heat-pulled glass micropipettes (Harvard Apparatus, Holliston, MA) at 700 µm cortical depth as described. 18
Post-injection Training
After injections, all animals were allowed to recover from surgery and were tested again on the Collins paw preference test 2 days after stroke. They performed the task on the robotic platform every 2 days starting from day 2 after injury. The vehicle group (n = 4) was tested for 3 sessions (i.e., days 2, 4, and 6 after saline injection). The ischemic group (n = 10) continued the training for 7 sessions (i.e., until day 14 post ET-1 injection).
Neuroanatomy and Quantification of Lesion Volume
After the completion of motor performance tests animals were transcardially perfused with 4% paraformaldehyde. Brains were cut using a sliding microtome (Leica, Wetzlar, Germany) to obtain 50-µm-thick coronal sections and for each experimental case, 1 out of every 3 sections was used for NeuN immunostaining (anti-NeuN guinea pig antibody 1:1000, Millipore, Billerica, MA) as described. 18
The lesion boundaries were identified using a 10× objective by loss of NeuN immunoreactivity. The ischemic region was contoured and its area measured in µm2 using the StereoInvestigator software (MBF Bioscience, Magdeburg, Germany).18,25-27 The lesion volumes in individual animals were calculated by summing up all damage areas and multiplying this by section thickness and by 3 (spacing factor). Total infarction volume is given as mean ± standard error of all analyzed animals.
Data Analysis
Parameter Extraction
Data acquired during each session were processed offline using custom routines implemented in Matlab.
A threshold method was used to detect the force-peaks exerted by the animal during the retraction task. A peak was defined by force values transiently exceeding a threshold and represents either a displacement of the handle or an attempt to move it. To estimate the threshold, the standard deviation of the noise in the force signal, fSD, was measured over a set of recording sessions in which the animals were not connected to the handle. The threshold was then computed as 3 × fSD, and yielded a force value of 8.1 mN.
Similarly, a threshold method was used to detect speed-peaks, that is, variations in speed associated with a displacement of the handle. The threshold value was estimated from an extensive set of trials performed by a small group of animals (n = 5). For each trial, the parts of the speed signal corresponding in time to well-identified force-peaks were removed. Then, the standard deviation, sSD, was estimated. The threshold, defined as 3 × sSD, yielded a value of 0.49 mm/s.
Based on the position, speed, and force signals, several task-related variables were calculated: (a) the t-target (i.e., the time spent by the animal to reach the RP starting from the MEP); (b) the number of sub-movements needed to accomplish the task (i.e., the suprathreshold speed peaks); (c) the average force (i.e., the mean force value computed from the force peaks during sub-movements); and (d) the number of “attempts” not resulting in a sub-movement (i.e., the suprathreshold force-peaks not corresponding to a sub-movement).
Statistical Analysis
The data were analyzed by using statistical software SigmaPlot 11.0 (Systat Software Inc, Chicago, IL) and GraphPad Prism v.6 (GraphPad Software, San Diego, CA), considering the value of significance at α = .05.
Changes in the lateralization index value before and after stroke were evaluated using a paired t test. Analysis of variance was performed with non-parametric tests since our data were not normally distributed. To assess longitudinal variations in t-target over sessions, the Friedman test followed by Dunn’s post hoc method was used. The Kruskall–Wallis test followed by Dunn’s post hoc method was used to compare performances on the robotic platform before and after injury (days 2-6 and days 10-14) in the ischemic animal group. To compare performance on the robotic platform before and after vehicle injections, the Mann–Whitney rank sum test was used.
Results
Training of Mice in the Robotic Device
The platform is a 1-degree-of-freedom robotic device that allows head-fixed mice to perform repeated sessions of retraction of the preferred forelimb (Figure 1A and Supplementary Movie 1) For consistency, in this study we selected only left-handed animals because the Collins task results clearly showed that the majority of mice in our colony were strongly left-handed (Figure 1B).
During each trial, the actuator extended the forelimb and the animal was trained to pull back the handle (10 mm) in order to receive a liquid reward (10 µL apple juice) on reaching the RP. Forces exerted during the task, time required for task execution (t-target), and number of sub-movements were quantified for each trial (Figure 1C and Supplementary Movie 1).
Mice rapidly learned the retraction task, as shown by the consistent decrease in t-target over training sessions (Figure 1D). In particular, a plateau was reached starting from the fifth session (Friedman test, P < .001, followed by Dunn’s post hoc method, P < .05). In parallel to the reduction of the t-target, we observed a significant increase of the mean force exerted by the mice (Friedman test, P < .001, followed by Dunn’s post hoc method, P < .05). This was also accompanied by a very consistent decrease in the number of sub-movements required to complete the task (Friedman test, P < .001, followed by Dunn’s post hoc method, P < .05). In summary, these data show that mice can efficiently learn the retraction task and that forelimb performance can be accurately quantified by the robotic platform.
Induction of a Localized Cortical Ischemic Lesion
Following training, animals (n = 10) underwent intracortical injections of ET-1 to induce a cortical infarct into the CFA. A control group (n = 4) received vehicle injections. Testing of forelimb preference on the Collins paw preference test 2 days after stroke showed no shift in limb preference with respect to the pre-lesion limb dominance (lateralization index before vs. after stroke, paired t test, P > .95; data not shown).
To precisely define the boundaries of the ET-1-induced neuronal loss, we performed immunofluorescence staining on brain sections, using the neuron-specific marker NeuN. A representative image of the ischemic lesion is shown in Figure 2A. The ischemic area appeared as a portion of brain parenchyma completely devoid of neurons. The area of the lesion was measured in serial coronal sections and Figure 2B shows that the anteroposterior extent of the damage was highly consistent among animals. Location of the lesion was established according to the mapping data available in the literature.22,24 It appears that the damage predominantly targeted the posterior portion of the CFA. Total infarction volume calculated 30 days after ET-1 injection was 0.76 ± 0.18 mm3.
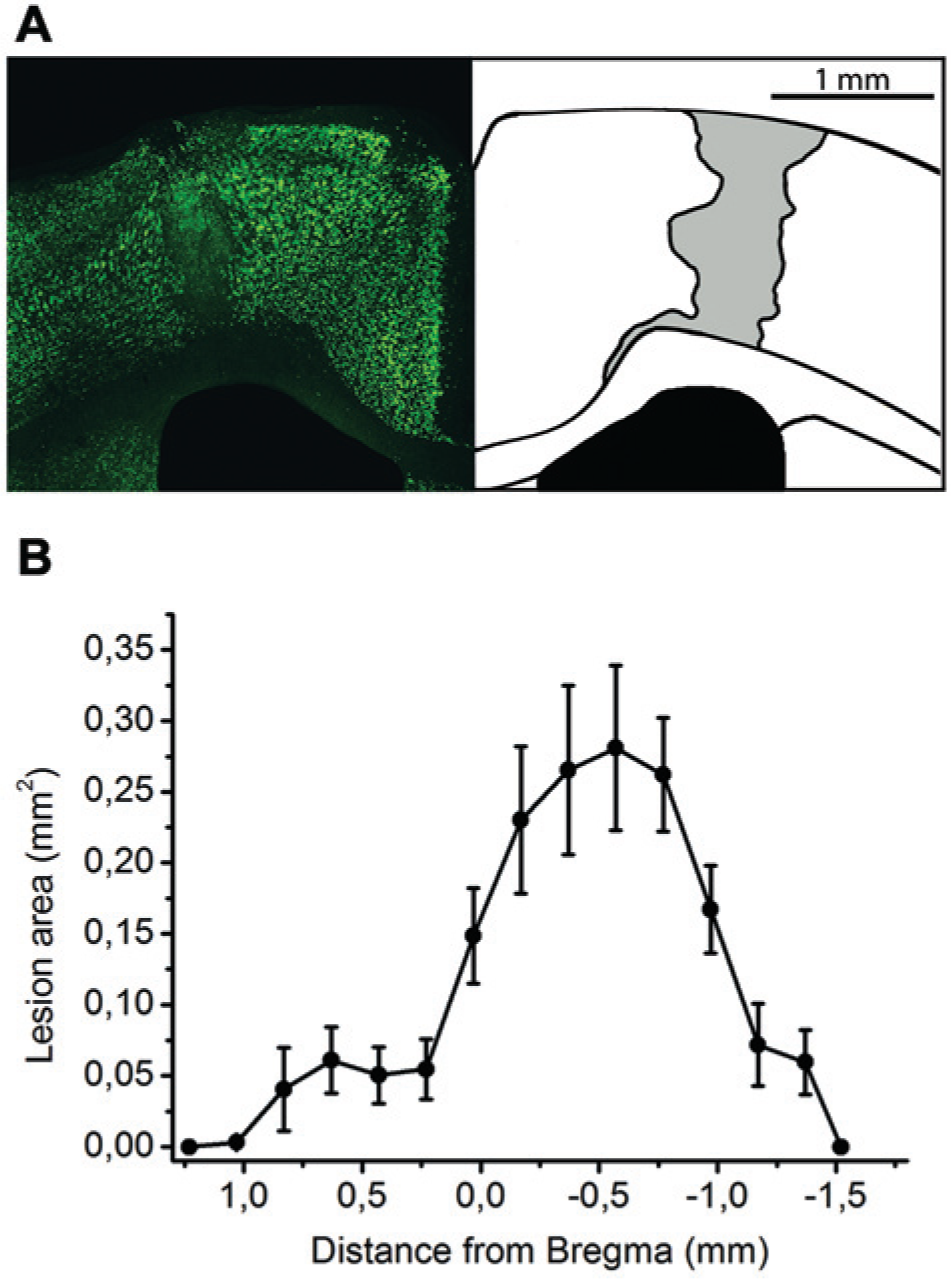
Neuroanatomical analysis of endothelin-1 (ET-1)-induced lesions. (A) Coronal section through the forebrain (anteroposterior location with respect to bregma = −0.25 mm) of an animal injected with ET-1. On the left, immunostaining for NeuN (green); on the right, schematic drawing of the lesion (gray). Note complete loss of neurons in the damaged area. (B) Lesion area along the anteroposterior axis (in millimeters with respect to bregma). Data are the average (± standard error) of the values obtained in 6 different mice.
Poststroke Assessment of Forelimb Retraction Performance in the Robotic Platform
We next investigated whether (a) the parameters measured by the robotic platform are sensitive enough to detect deficits in performance after a localized cortical stroke and (b) post-lesion training is effective in restoring performance on the robotic platform to baseline, pre-lesion values.
After injection, both the ischemic and vehicle groups performed the task for at least 3 sessions (days 2, 4, and 6 following surgery). In the ischemic group the time required to complete the retraction task was significantly increased after the infarct (Figure 3A, “baseline” vs. “days 2-6” Dunn’s test, P < .0001). On the other hand, injection of vehicle solution had no statistically significant impact on performance (t-target pre- vs. post-injury, Mann–Whitney test, P = .472; data not shown).
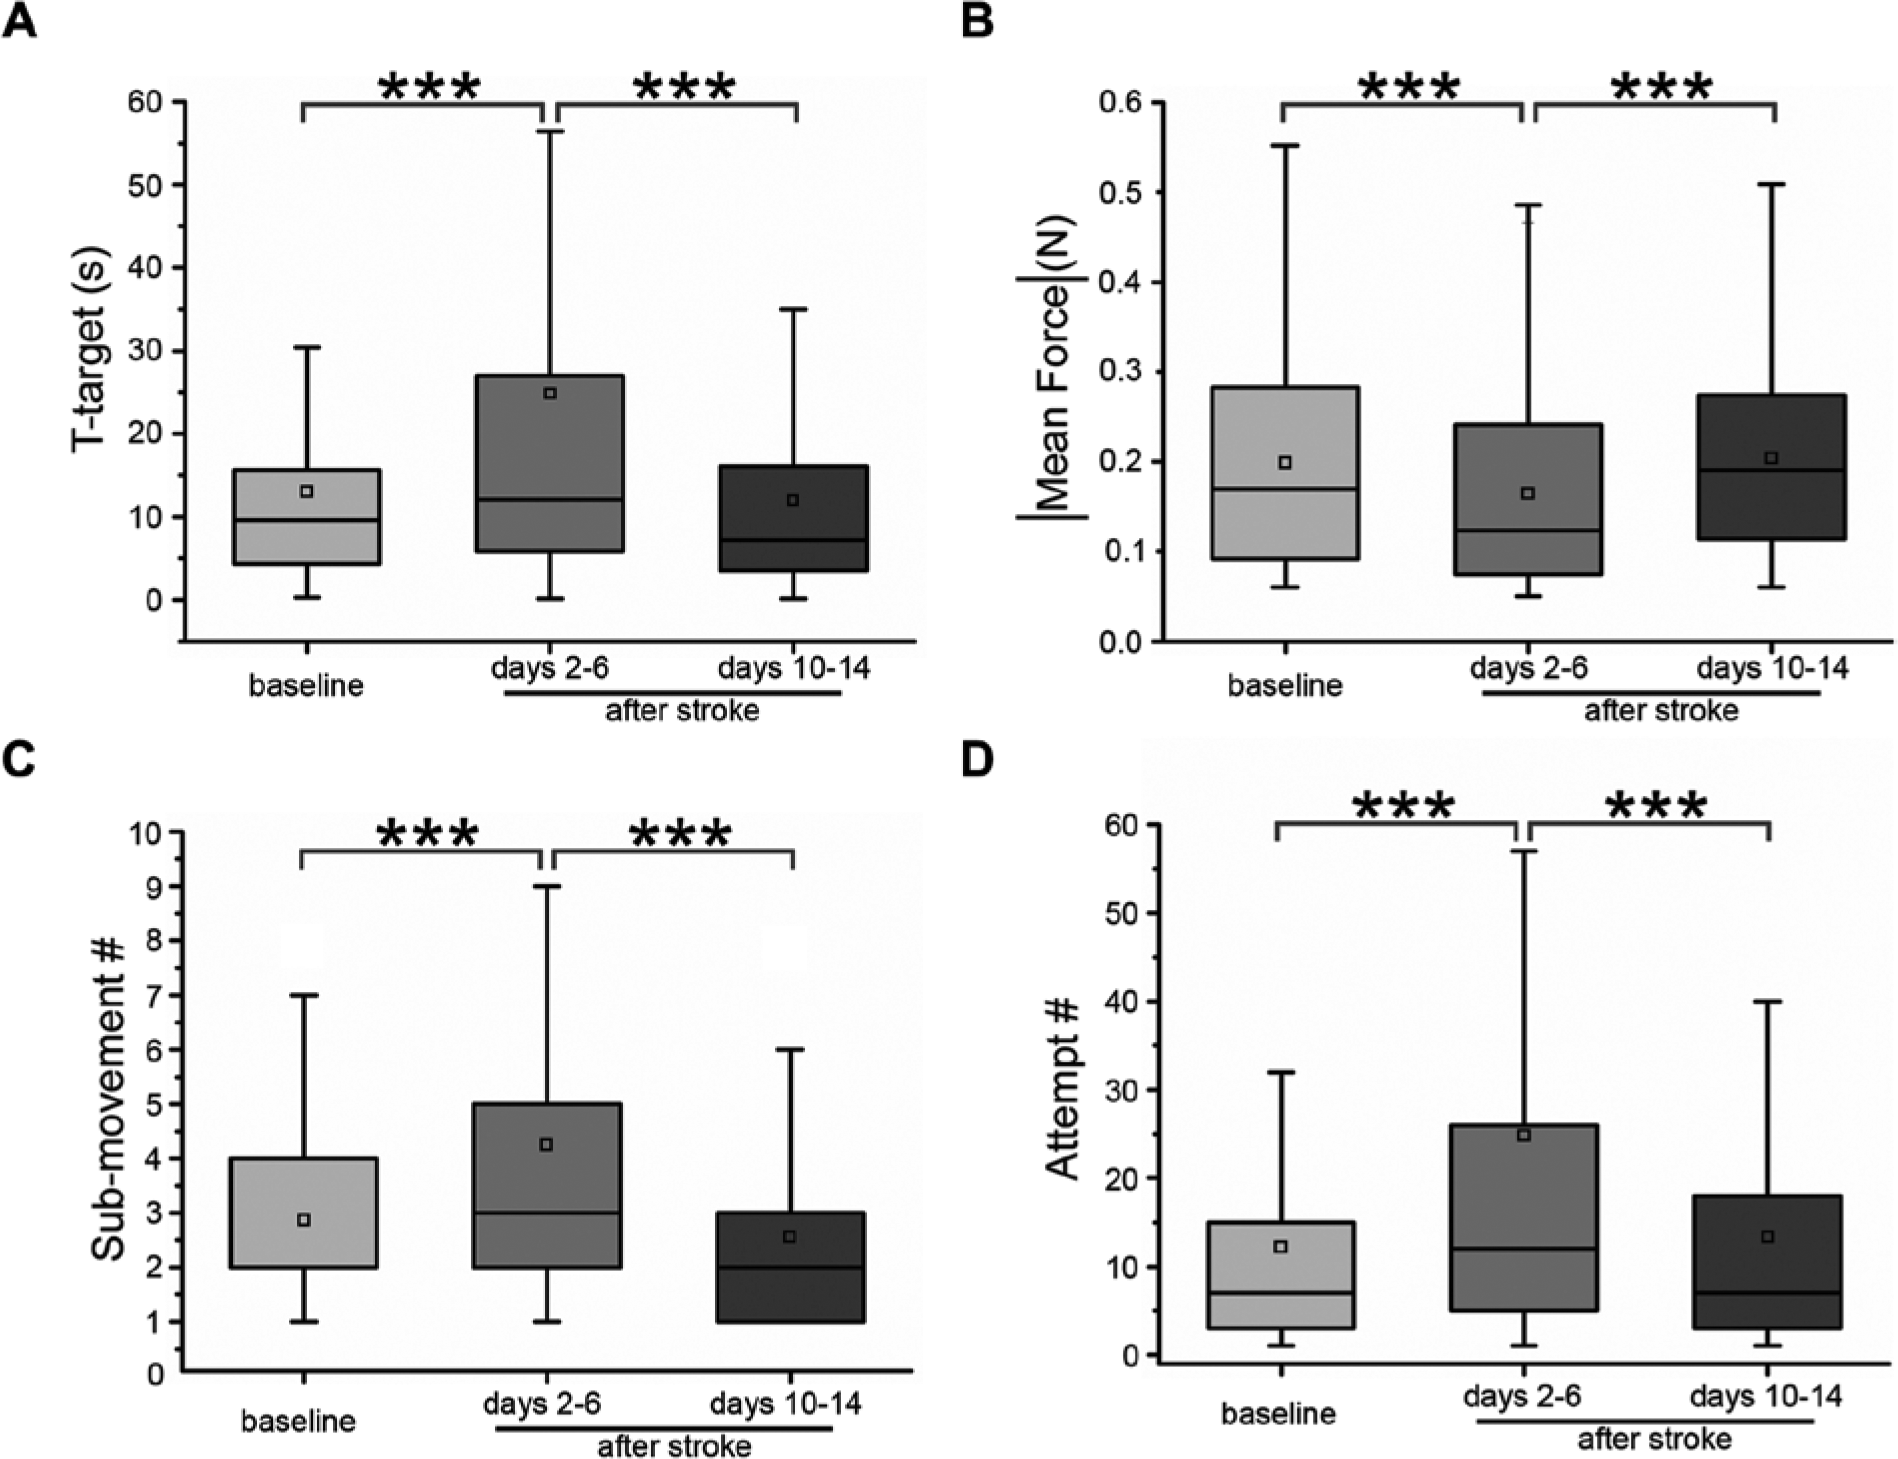
The robotic platform efficiently detects deficits and improvement of forelimb flexor performance following stroke. T-target (A), mean force exerted (B), number of sub-movements (C), and number of attempts (D) in baseline (pre-lesion) condition and either 2 to 6 days or 10 to 14 days after stroke. All animals were tested every other day in the robotic platform. Note the return to pre-lesion values of all parameters at the end of the training. Data are summarized by a box chart, in which the horizontal lines denote the 25th, 50th, and 75th percentile values, and the error bars denote the 5th and 95th percentile values; the square indicates the mean of the data set. ***P < .001 (Friedman test, P < .001, followed by Dunn’s post hoc test).
In addition, ET-1-induced lesions led to a significant reduction in the force exerted by the forelimb contralateral to the cortical infarct (Figure 3B, “baseline” vs. “days 2-6,” Dunn’s test, P < .0001).
Importantly, execution of movement was impaired following stroke, as there was a consistent increase in the number of sub-movements required to complete the task (Figure 3C; “baseline” vs. “days 2-6,” Dunn’s test, P = .0013). Moreover, the number of force peaks (attempts) not resulting in a displacement of the handle, was significantly increased after lesion (Figure 3D; “baseline” vs. “days 2-6,” Dunn’s test, P < .0001).
We continued the training of the ischemic group until day 14 post-lesion. We found a significant reduction of t-target to levels (Figure 3A, third column) that were comparable to those attained in the pre-lesion condition (Figure 3A, “baseline” vs. “days 10-14,” Dunn’s test, P > .95; “days 2-6” vs. “days 10-14,” P < .0001)
Similar results were observed for the mean force values, which showed a substantial increase during the course of poststroke training (Figure 3B, “baseline” vs. “days 10-14,” Dunn’s test, P = .0516; “days 2-6” vs. “days 10-14,” P < .0001).
Importantly, the number of both sub-movements and attempts were decreased after 14 days of post-lesion training and became comparable to prelesion values (sub-movements, Figure 3C, “baseline” vs. “days 10-14,” Dunn’s test, P = .0798; “days 2-6” vs. “days 10-14,” P < .0001; attempts, Figure 3D, “baseline” vs. “days 10-14,” Dunn’s test, P > .95; and “days 2-6” vs. “days 10-14,” P = .0002).
Altogether, these data indicate that the robotic platform provides sensitive measures to probe deficits and recovery of forelimb function after a localized cortical infarct in mice.
Discussion
In this article, we have designed and validated a robotic platform for mice that mimics a robot for human rehabilitation. 14 We report that this device (a) provides a quantitative assessment of forelimb flexion movement, (b) is sensitive to detect deficits in performance after a localized cortical infarct, and (c) measures functional improvements during poststroke training.
The system allows for direct, quantitative, and reliable assessment of forelimb flexion performance by means of parameters (t-target, average force, and number of sub-movements) extracted from force exerted and movements produced during a retraction task. These measures vary reliably with both training and poststroke rehabilitation. One limitation (inherent in every behavioral task) is that the t-target is partially influenced by the animal’s motivation. It might also be argued that reduced force production following stroke is bound to an increase in sub-movements; however, a Pearson analysis for the couples (sub-movement number, mean force) of the same experimental session indicates a non significant correlation.
Since the animal’s wrist is positioned in the movable handle, the primary joints involved in the retraction task are the elbow (via the biceps) and shoulder (via several muscle groups). Thus, the device effectively isolates the proximal forelimb and excludes the distal forelimb (forepaw and digit muscle groups). Furthermore, since the only active movement by the mouse is to retract the forelimb, the platform isolates the flexor muscle groups from the extensor groups. It is important to note that the handle can move only in response to an active pull by the mouse able to overcome the static friction force. For this reason, we computed the number of “attempts” that is, the number of quantifiable force-peaks measured by the load cell without any detectable displacement of the handle. The progressive reduction of attempts over the poststroke training sessions indicates a substantial restoration of the capability to overcome friction and hence generate movement.
We have shown that the platform can measure proximal forelimb flexor performance with high accuracy and track its modifications. In the rodent literature, such measures have been thus far obtained with behavioral tasks (e.g., tests of skilled motor training).10-13 Compared with these methods, our robotic platform is unique in that (a) it is free from experimenter’s bias and (b) it provides thorough kinetic and kinematic information on motor performance. In particular, the platform efficiently detected signs of motor dysfunction following a localized cortical stroke in primary motor area. Our results suggest that this robotic platform might be applied to the quantitative assessment of motor performance in murine models of other neurological disorders, such as spinal cord injury 28 or motoneuron diseases. 29
Induction of a cortical stroke was achieved via intracortical delivery of the vasoconstrictor ET-1.18-21 Serial reconstruction of the damage indicated that the posterior portion of the CFA was predominantly affected by the lesion. This region is mainly involved in generating flexion movements of the forelimb,24,30 that is, exactly those tested in the robotic platform. A very limited damage of the hindlimb motor area (located >1 mm posterior to bregma 22 ) is also present, but is unlikely to affect the results of the study, which are based on assessment of forelimb performance in head-fixed animals. We found no spread of damage to the primary somatosensory cortex (located more laterally in the cortex 24 ). The rather confined damage may be because of the limited efficacy of ET-1 in the mouse.19-21
Quantitative measures of the ischemic animals on the robotic device showed a restoration to pre-lesion values over the training sessions. Previous studies reported that motor recovery from functional deficits due to injuries in the motor cortex can occur spontaneously. 2 Nevertheless, it would be important to assess in future studies whether robotic training can induce significant device-dependent rehabilitation benefits, and whether they can possibly extend to dissimilar tasks. Experiments to address these issues are currently ongoing in our laboratory.
In summary, we have described an innovative robotic device for the assessment and training of forelimb retraction in mice. Robot-assisted rehabilitation is prominent in the clinical stroke research literature, and current robotic solutions for human rehabilitation can already provide significant effects, 5 but the underlying neural mechanisms are only partly understood. Our platform holds promise for detailed investigation of the electrophysiological, biochemical, and anatomical mechanisms of robot-assisted rehabilitation in a suitable animal model.
Footnotes
Authors’ Note
Cristina Spalletti and Stefano Lai contributed equally as first authors. Silvestro Micera and Matteo Caleo contributed equally as senior scientists.
Declaration of Conflicting Interests
The author(s) declared no potential conflicts of interest with respect to the research, authorship, and/or publication of this article.
Funding
The author(s) disclosed receipt of the following financial support for the research, authorship, and/or publication of this article: This work was supported by a grant from Fondazione Cassa di Risparmio di Pisa.