
Abstract
Background. Although functional imaging and neurophysiological approaches reveal alterations in motor and premotor areas after stroke, insights into neurobiological events underlying these alterations are limited in human studies. Objective. We tested whether cerebral metabolites related to neuronal and glial compartments are altered in the hand representation in bilateral motor and premotor areas and correlated with distal and proximal arm motor impairment in hemiparetic persons. Methods. In 20 participants at >6 months postonset of a subcortical ischemic stroke and 16 age- and sex-matched healthy controls, the concentrations of N-acetylaspartate and myo-inositol were quantified by proton magnetic resonance spectroscopy. Regions of interest identified by functional magnetic resonance imaging included primary (M1), dorsal premotor (PMd), and supplementary (SMA) motor areas. Relationships between metabolite concentrations and distal (hand) and proximal (shoulder/elbow) motor impairment using Fugl-Meyer Upper Extremity (FMUE) subscores were explored. Results. N-Acetylaspartate was lower in M1 (P = .04) and SMA (P = .004) and myo-inositol was higher in M1 (P = .003) and PMd (P = .03) in the injured (ipsilesional) hemisphere after stroke compared with the left hemisphere in controls. N-Acetylaspartate in ipsilesional M1 was positively correlated with hand FMUE subscores (P = .04). Significant positive correlations were also found between N-acetylaspartate in ipsilesional M1, PMd, and SMA and in contralesional M1 and shoulder/elbow FMUE subscores (P = .02, .01, .02, and .02, respectively). Conclusions. Our preliminary results demonstrated that proton magnetic resonance spectroscopy is a sensitive method to quantify relevant neuronal changes in spared motor cortex after stroke and consequently increase our knowledge of the factors leading from these changes to arm motor impairment.
Keywords
Introduction
Human imaging studies have revealed that early after subcortical stroke, restoration of paretic arm function is associated with a greater involvement of radiologically normal-appearing (or spared) motor (primary motor cortex or M1) and premotor (dorsal premotor cortex or PMd, supplementary motor area or SMA) areas in both injured (ipsilesional) and uninjured (contralesional) hemispheres.1-3 Later, successful recovery occurs in stroke survivors who exhibit relatively normal patterns of ipsilesional activation and less contralesional motor activation, whereas patients, who often show bilateral cortical activation, typically have less complete recovery.4-6 These results should be viewed in the context of the anatomic structures and pathways of these areas. Although M1 motor pathways are critical, the premotor areas also contribute to motor control and might be recruited during motor recovery after stroke. The parallel nature of the direct (corticospinal) pathways from premotor areas and M1 emphasizes that PMd and SMA are, in some respects, at a similar level of hierarchical organization as M1, 7 although these projections to spinal cord motor neurons are less numerous and less efficient than those from M1.8-10 Another possibility is the indirect (corticoreticulospinal) projections to cervical propriospinal premotoneurons, which have divergent projections to muscle groups operating at multiple joints.11,12 Finally, corticocortical connections between these areas might also play an important role in poststroke recovery.7,13-15 Thus, understanding the neural events associated with the functional changes in these areas could provide critical insight into successful treatments of patient’s impairment.
Proton magnetic resonance spectroscopy (1H-MRS) provides a noninvasive means to measure concentrations of certain metabolites associated with a specific cell type 16 after stroke. 17 Most clinical stroke studies report lower levels of N-acetylaspartate (NAA, putative marker of neuronal integrity) in spared ipsilesional M1 and PMd.18-21 In some instances, the NAA levels were related to clinical severity. In a series of studies of stroke survivors, we also found higher myo-inositol (mI, putative marker of glial cells) in ipsilesional and contralesional M1. 21 However, none of these studies addressed the changes in key metabolites related to neuronal and glial compartments, that is, NAA and mI, in motor and premotor areas in stroke.
The first aim of the current study was to quantify NAA and mI concentrations in ipsilesional and contralesional motor and premotor areas in chronic subcortical stroke. Since neuronal integrity might be compromised in these remote areas,21,22 we expected NAA to be lower, especially in the ipsilesional areas. Given the role of glia in plastic brain changes,23-25 we also expected mI to be higher. The second aim was to explore correlations between metabolite concentrations and arm motor impairment. Since the premotor projections are significantly stronger on the proximal muscles than distal muscles compared with M18,9, we predicted that metabolite measures in ipsilesional PMd and SMA would be correlated with proximal (shoulder/elbow) motor impairment whereas those in M1 would be correlated with both proximal and distal (hand) impairments. Since both direct and indirect pathways from the contralesional M1 project to axial and proximal muscles rather than hand muscles,26,27 relationships between contralesional M1 metabolites and proximal impairment were also expected.
Materials and Methods
Participants
Twenty stroke participants and 16 healthy controls (all right-handed and without MRI [magnetic resonance imaging] contraindications) signed informed consent in accordance with the University of Kansas Medical Center Human Subjects Committee (Institutional Review Board) prior to their recruitment in the study.
Patients were included if they had (a) a single ischemic subcortical stroke more than 6 months prior to study recruitment, (b) radiologically normal-appearing motor and premotor areas based on T2-weighted MRI, (c) the ability to understand consenting (Token test), and (d) no visual attention deficits (Cancellation test), apraxia (clinical observation of the use of scissors to cut paper and making coffee), or other chronic or degenerative neurologic disease (medical chart review). Stroke survivors were on antihypertensive (95%), cholesterol-lowering (45%), and/or antiplatelet (45%) therapy but were not receiving inpatient or outpatient treatment.
Age-, sex-, and education-matched healthy controls, with normal T2-weighted MRI and without neurologic and psychiatric disorders, were recruited.
Data Acquisition
Magnetic resonance imaging studies were conducted on a 3T Allegra MR system (Siemens Medical Solutions, Erlangen, Germany). Each participant’s head was immobilized with head cushions. Our experimental protocol has been detailed previously. 21 In short, an axial proton density/T2-weighted MRI (TR = 4800ms; TE1/TE2 = 18/106 ms; FOV [field of view] = 240 mm; matrix = 256 × 256; slice thickness = 5 mm, no gap) and a whole-brain 3-dimensional (3D) T1-weighted MRI (TR = 2300 ms; TE = 3 ms; FOV = 240 mm; matrix = 256 × 256; resolution = 1 × 1 × 1 mm3) were acquired to confirm the location of a single lesion that did not involve the motor and premotor areas and to estimate the brain tissue volume in spectroscopic voxels respectively. A gradient echo blood oxygen level–dependent scan (BOLD; TR = 2000 ms; TE = 50 ms; FOV = 240 mm; matrix = 64 × 64; slice thickness = 5 mm; 0 skip; resolution = 5 × 5 mm2; 100 time points) was acquired to identify the hand representation area within our regions of interest (ROI), M1, PMd, and SMA, in each hemisphere. For BOLD scans, 2 alternating conditions were repeated: movement (20 seconds), where participants performed a handgrip with the impaired hand (dominant in controls) until a target pressure (25% of handgrip maximal voluntary contraction) was attained, and rest (20 seconds), where participants were motionless. BOLD scanning lasted for a total of 3 minutes 28 seconds.
BOLD data were analyzed initially using the scanner analysis software to guide the 1H-MRS imaging (1H-MRSI) slab positioning. Specifically, the slices corresponding to the activated motor/premotor areas were used to select the corresponding coincident T2-weighted image on which the 1H-MRSI slab was centered. The 1H-MRSI volume of interest was placed in the frontal and parietal lobes, including our ROIs, parallel to the anterior commissure–posterior commissure line, and positioned with the bottom edge of the slab at the cingulate sulcus and the anterior edge aligned with the anterior tip of the genu. 1H-MRSI was acquired using a point-resolved spectroscopy sequence (PRESS; TE = 30 ms; TR = 1500 ms; FOV = 160 mm2; matrix = 16 × 16; slice thickness = 15 mm; in-plane resolution = 5 × 5 mm2; spectral width = 1200 Hz). Scalp lipid artifact was minimized with eight 30-mm outer voxel suppression bands prescribed around the 1H-MRSI excitation volume. Automated and manual shimming yielded an optimal full-width at half-maximum of <20 Hz of the water signal from the entire excitation volume.
Analysis of Functional Imaging Data
We analyzed BOLD using Brain Voyager software (Brain Innovation BV, Maastricht, the Netherlands). Motion correction was performed using a rigid body transformation, estimating 6 parameters (3 translational and 3 rotational). Inspection of these parameters found that none of the participants moved their head more than 2 mm in any direction. Then, 3D spatial smoothing with a 4-mm Gaussian filter was used to permit valid statistical inferences based on Gaussian random field theory. The time series in each voxel was high-pass filtered at 0.01 Hz to remove low-frequency confounds. Movement and rest periods were modeled by a boxcar function with hemodynamic response modification (predictor movement) and the general linear model was used to extract foci of activation in each ROI (cluster threshold = 100 voxels, PBonferroni = .01). Then, we outlined ROIs on the background T1 image using standard sulcal and gyral landmarks, 28 without knowledge of the activation patterns: M1, on the anterior bank of the central sulcus with the caudal border lying in the depth of the central sulcus close to its fundus and anterior border abutting area 6; PMd, on the anterior half of the precentral gyrus; SMA, on the medial wall of the hemisphere from the top of the brain to the depth of the cingulated sulcus, between a posterior boundary, halfway between the extension of the central and precentral sulci onto the medial surface, and an anterior boundary, a vertical line through the anterior commissure. We then counted the activated voxels in the ROI using a Bonferroni corrected P = .01/total voxels in the ROI, as defined by BV software. The ratio (expressed as a percentage) between the number of activated voxels and the total number of voxels in the ROI represents the spatial extent of activation.
Analysis of Spectroscopic Imaging Data
1H-MRSI data were quantified using LCModel (linear combination of model spectra using a basis set included in the package and using a radiofrequency coil loading factor 29 ). We also segmented the T1-weighted images using SPM2 (Welcome Department of Cognitive Neurology, London, UK) into white matter (WM), gray matter (GM), and cerebral spinal fluid (CSF).
Then, to select the spectroscopic voxels in the relevant regions of M1, PMd, and SMA associated with motor output, we overlaid the BOLD images, quantitative spectroscopic output (LCModel), and segmented T1-weighted images (SPM2) using custom-designed software (Matlab v7.1). This graphical interface was used to display spectra and to obtain metabolite concentrations and brain tissue fraction from selected spectroscopic voxels. We selected 3 spectroscopic voxels per ROI (Figure 1), each with a signal-to-noise ratio greater than 10 and with more than 75% GM.
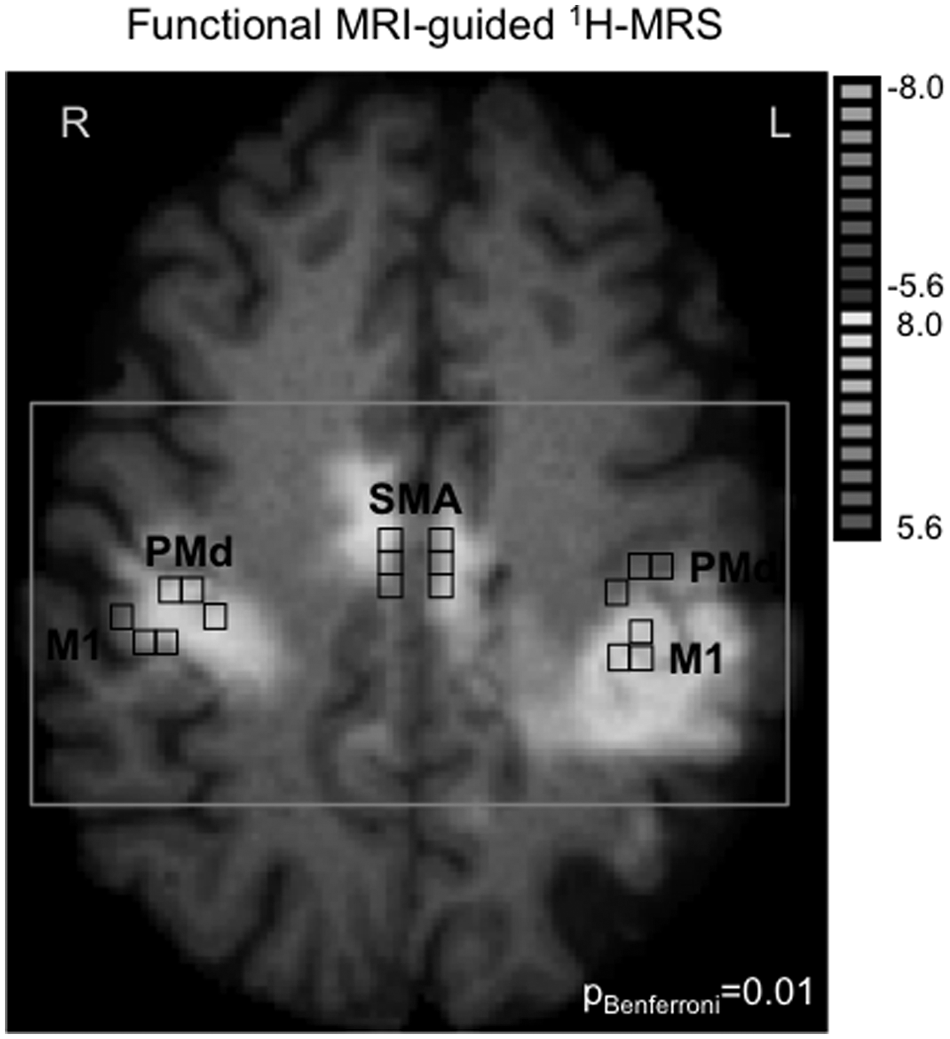
Motor-related cortical activation during a handgrip task executed with the impaired right hand in a 58-year-old patient who had experienced infarct involving the left striatocapsular area (patient 18, Table 1). Proton magnetic resonance spectroscopic imaging (1H-MRSI) slab (gray rectangle) was positioned on axial T1-weigthed MR image at the level of motor-related motor/premotor activation. Spectroscopic voxels (black squares) were selected based on M1, PMd, and SMA activation (or anatomic landmarks in case the activation tended to zero). Abbreviations: L, left; R, right; M1, primary motor cortex; PMd, dorsal premotor cortex; SMA, supplementary motor area.
The metabolites of interest, NAA and mI, were included in the quantitative analysis if their Cramer–Rao lower bounds were lower than 20% in all spectra. Since the metabolites have different concentrations in brain tissue (BT) and CSF, we corrected the concentrations as follows: c = cLCModel/BT where c is the BT-corrected concentration, cLCModel is the concentration in institutional unit from LCModel output, and BT is the estimated brain tissue, that is, WM + GM from the SPM segmentation. BT-corrected concentration was then converted into molar concentrations (millimoles per kilogram wet weight brain tissue). 21
In the stroke group, we selected the Fugl-Meyer Upper Extremity (FMUE) components specifically dealing with distal movements, including hand movements (distal subscore, normal = 14) and proximal movements, including active shoulder and elbow movements in and out of synergy (proximal subscore, normal = 30), to evaluate distal and proximal arm motor impairments.
Statistical Analysis
Metabolite concentrations were described by means and standard deviations and the between-group differences in mean concentrations were expressed as percentage change of the control group (see Figure 2A) for illustration purpose. The percentage change was computed as follows: % metabolite change = (mean metabolitestroke − mean metabolitecontrol) × 100/mean metabolitecontrol.
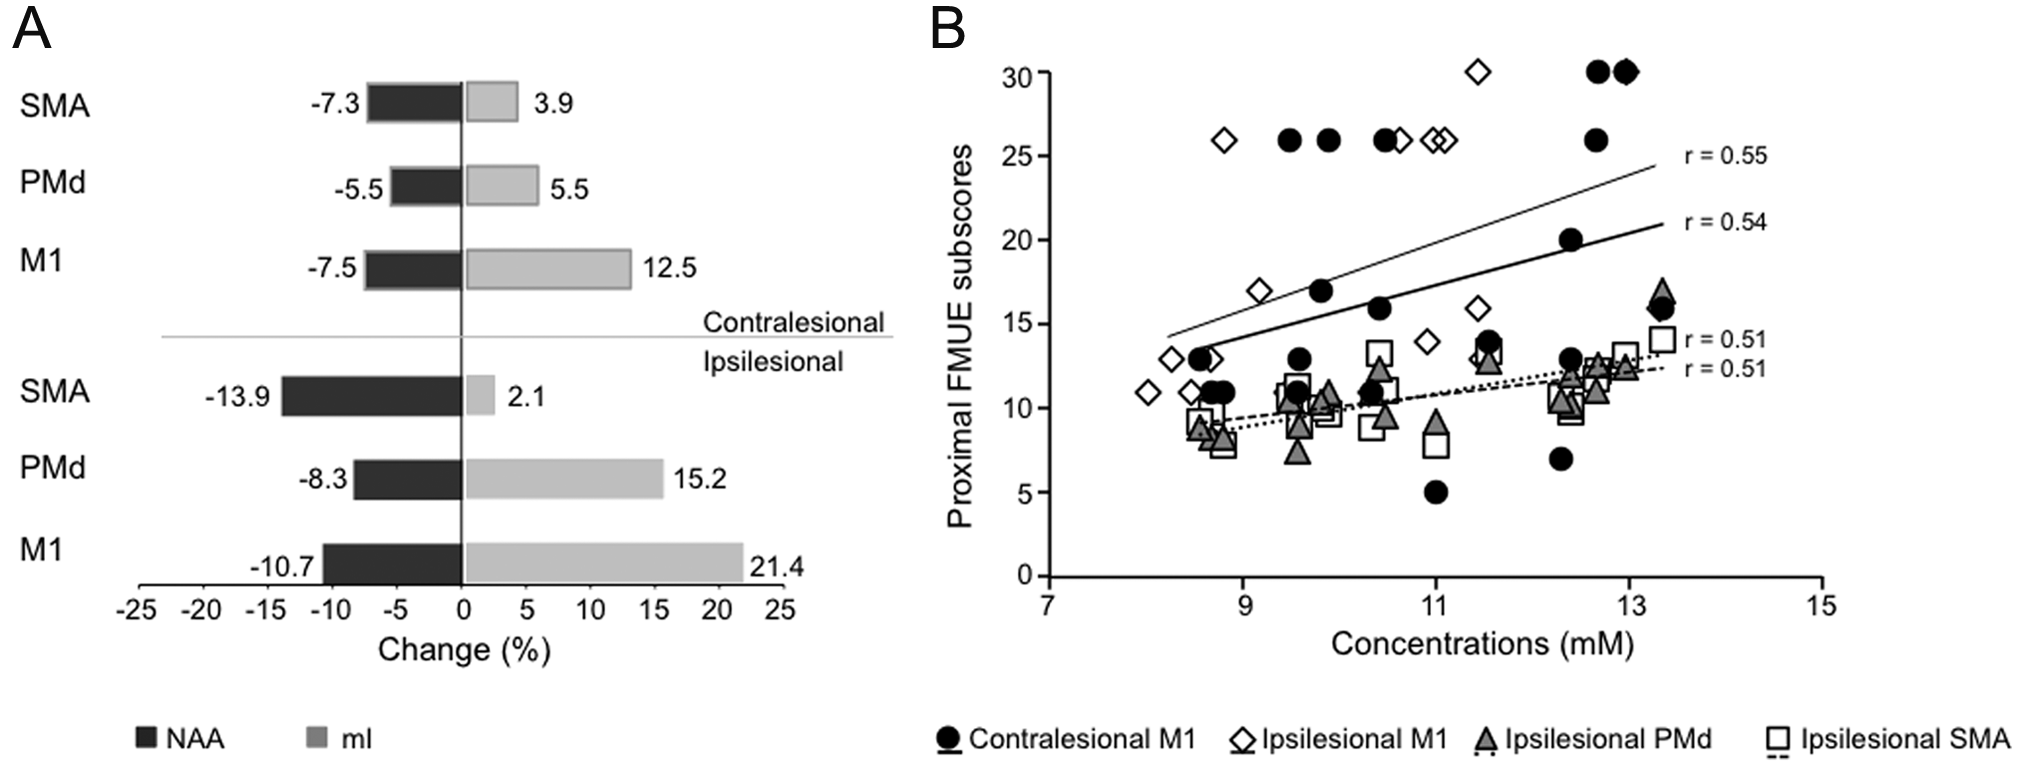
A, Changes (%) in concentrations of NAA (black) and mI (light gray) in M1, PMd, and SMA in both hemispheres in stroke survivors versus controls. Note that NAA is lower in ipsilesional M1 (P = .04) and SMA (P = .004) and mI is higher in M1 (P = .003) and PMd (P = .03). B, Correlations between NAA concentrations in contralesional M1 (black circle), ipsilesional M1 (diamond), ipsilesional PMd (triangle), and ipsilesional SMA (square) and proximal FMUE subscores. Abbreviations: NAA, N-acetylaspartate; mI, myo-inositol; M1, primary motor cortex; PMd, dorsal premotor cortex; SMA, supplementary motor area.
For inference, we used mixed-effects models to compare metabolite concentrations in each ROI within and between groups. Least-square means were used to assess the differences in metabolite concentrations between M1 and PMd or M1 and SMA within each hemisphere in each group (2 comparisons/metabolite/hemisphere × 2 hemispheres × 2 metabolites = 8 comparisons). Finally, group-by-ROI interactions were employed to evaluate between-ROI differences in each hemisphere between groups (2 between-ROI differences/hemisphere/metabolite × 2 hemispheres × 2 metabolites = 8 interactions).
In the stroke group, relationships between metabolite concentrations and FMUE subscores were analyzed with Spearman rank order correlation test.
Significant differences were considered at P < .05 (SPSS 18.0, SPSS Inc, Chicago, Illinois, except the mixed-effects analysis, which was performed on SAS 9.2, SAS Inc, Cary, North Carolina). Corrections for multiple comparisons were not performed in this exploratory study.
Results
Participants
Stroke participants’ characteristics are listed in Table 1. Patients (13 men and 7 women; age, range 36-73 years, mean ± SD, 57.3 ± 10.3 years) having a single subcortical infarction were recruited at 6 to 144 months (44.6 ± 37.8 months) postinjury. The site of cerebral infarction was determined from T2-weighted MRI. 30 Twelve patients had experienced right hemiparesis and 8 left hemiparesis. Seventeen patients had experienced infarcts involving the striatocapsular area. Of these, 3 were found to have anterior limb of internal capsule involvement, 7 posterior limb, 3 both anterior and posterior limbs of internal capsule, and 6 striatocapsular infarcts with extension to the corona radiata. In addition, 2 patients had suffered from pontine infarctions (pons), and 1 from infarction of the posterior cerebral artery territory involving the cerebral peduncles. Patients had proximal and distal motor deficits in their impaired arm based on the FMUE subscores (Table 1).
Stroke Participants’ Demographic and Clinical Characteristics.

Abbreviations: M, male; F, female; L, left; R, right; MCA, middle cerebral artery; PCA, posterior cerebral artery; SC, striatocapsular territory; CR, corona radiata; CP, cerebral peduncles; BG, basal ganglia.
Proximal and distal arm motor impairment refers to the Fugl-Meyer Upper Extremity subscores (30 for normal shoulder and elbow movements in and out of synergy; 14 for normal hand movements) as recorded at the recruitment into study.
The age of healthy controls (10 men/6 women) ranged from 36 to 74 years (49.4 ± 14.7 years). Stroke and control groups did not differ statistically with respect to age (P > .05), sex (65% vs 63% men), or education (13.6 ± 2.0 vs 14.7 ± 3.2 years, P > .05).
Spectral Quality
All spectra in each group showed a high signal-to-noise ratio (>10 from LCModel). Similar percentages of BT within spectroscopic voxels were found in each group (ipsilesional vs left: M1, 89.3% ± 5.8% vs 89.4% ± 6.5%, P = .9; PMd, 85.9% ± 7.4% vs 89.8% ± 8.1%, P = .1; contralesional vs right: M1, 86.7% ± 8.4% vs 86.2% ± 4.9%, P = .8; PMd, 85.8% ± 8.9% vs 84.9% ± 6.4%, P = .7; SMA, 82.2% ± 7.3% vs 85.1% ± 5.8%, P = .7) although the BT fraction in ipsilesional SMA was slightly higher in patients (81.3% ± 4.4% vs 77.6% ± 4.3%, P = .02).
Spectroscopic Voxel Location
Although larger motor-related activations were found in patients compared with controls (Table 2), the anatomic locations of spectroscopic voxels were similar between groups. Typical examples of voxel location for the 3 ROIs are shown in Figure 1.
Spatial Extent of Motor-Related BOLD Activation (Mean ± SD, %) Within M1, PMd, and SMA, Bilaterally Measured, in Control and Stroke Groups.
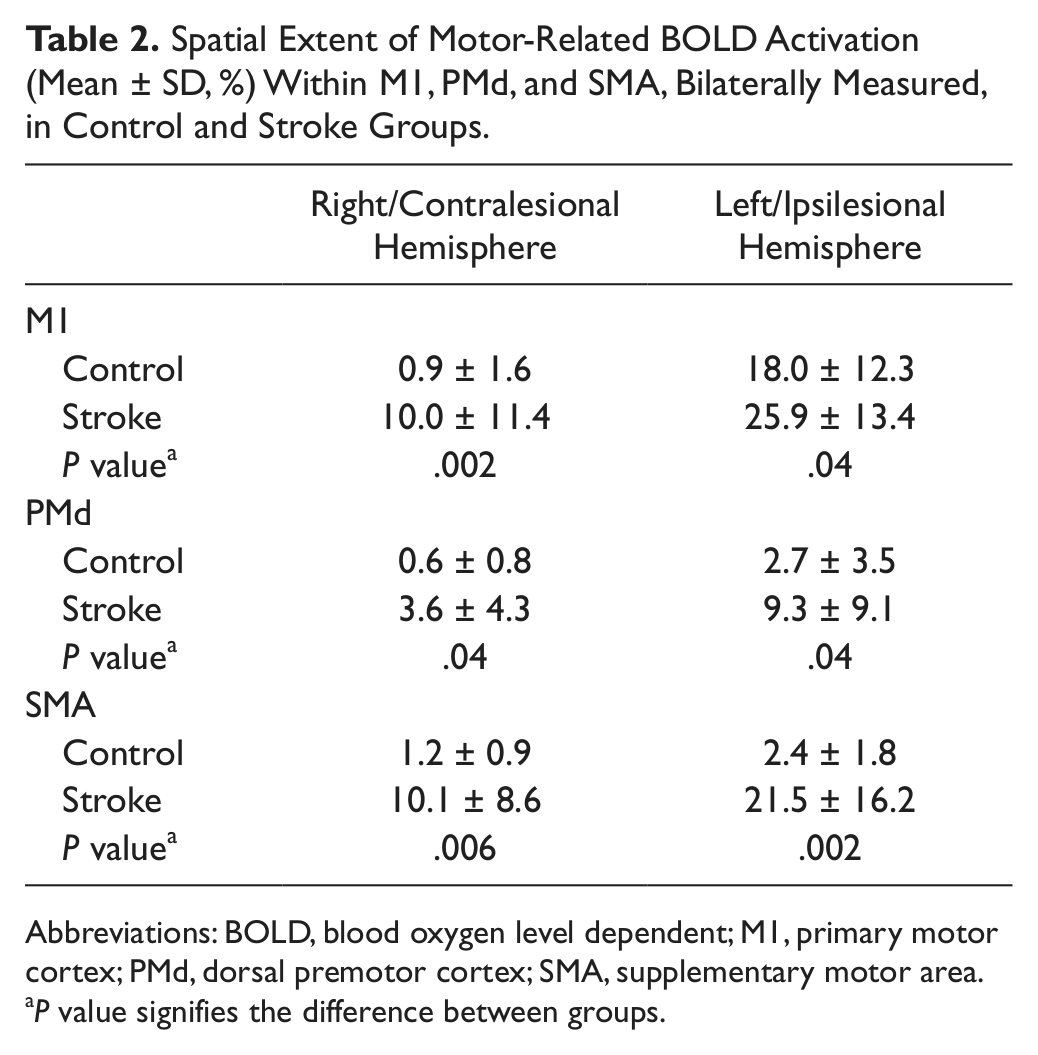
Abbreviations: BOLD, blood oxygen level dependent; M1, primary motor cortex; PMd, dorsal premotor cortex; SMA, supplementary motor area.
P value signifies the difference between groups.
Metabolite Concentrations
Healthy controls
Comparing motor areas within each hemisphere, we found that mI was higher in SMA than in M1 (left, P < .0001; right, P = .0002). NAA was not different between ROIs. Overall, no significant differences in any metabolite concentrations were detected between left and right motor cortices (P > .05) in healthy brains.
Stroke participants
Within each hemisphere, similar to healthy controls, mI concentrations were higher in SMA than in M1 (ipsilesional, P = .002; contralesional, P = .006). NAA concentrations were similar across ROIs. Similar to controls, in patients, comparable metabolite concentrations were found between ipsilesional and contralesional homologous areas.
Comparisons between stroke participants and healthy controls
Since there were no lateralization differences in metabolite concentrations in controls, and most patients (12 out of 20) had left-sided infarcts, we compared metabolites in the ipsilesional hemisphere with left-hemisphere metabolites from controls. Table 3 shows between-group differences in metabolite concentrations within each ROI. Across all ROIs, NAA concentrations were generally lower and mI generally higher in stroke survivors than in controls (Table 3 and Figure 2A). Not surprisingly, these findings were more prominent, and reached statistical significance, in ipsilesional ROIs: NAA was lower in M1 (by 10.7%, P = .04) and SMA (13.9%, P = .004); mI was higher in M1 (21.4%, P = .003) and PMd (15.2%, P = .03). Subgroup analysis of those patients with lesions of the posterior limb of the internal capsule (n = 7) showed lower NAA in M1 (by 16.9%, P = .02), PMd (14.8%, P = .03), and SMA (20.8%, P = .01) and higher mI in M1 (21.7%, P = .001) in the ipsilesional hemisphere.
Metabolite Concentrations (Mean ± SD, mM) Within M1, PMd, and SMA, Bilaterally Measured, in Control and Stroke Groups.
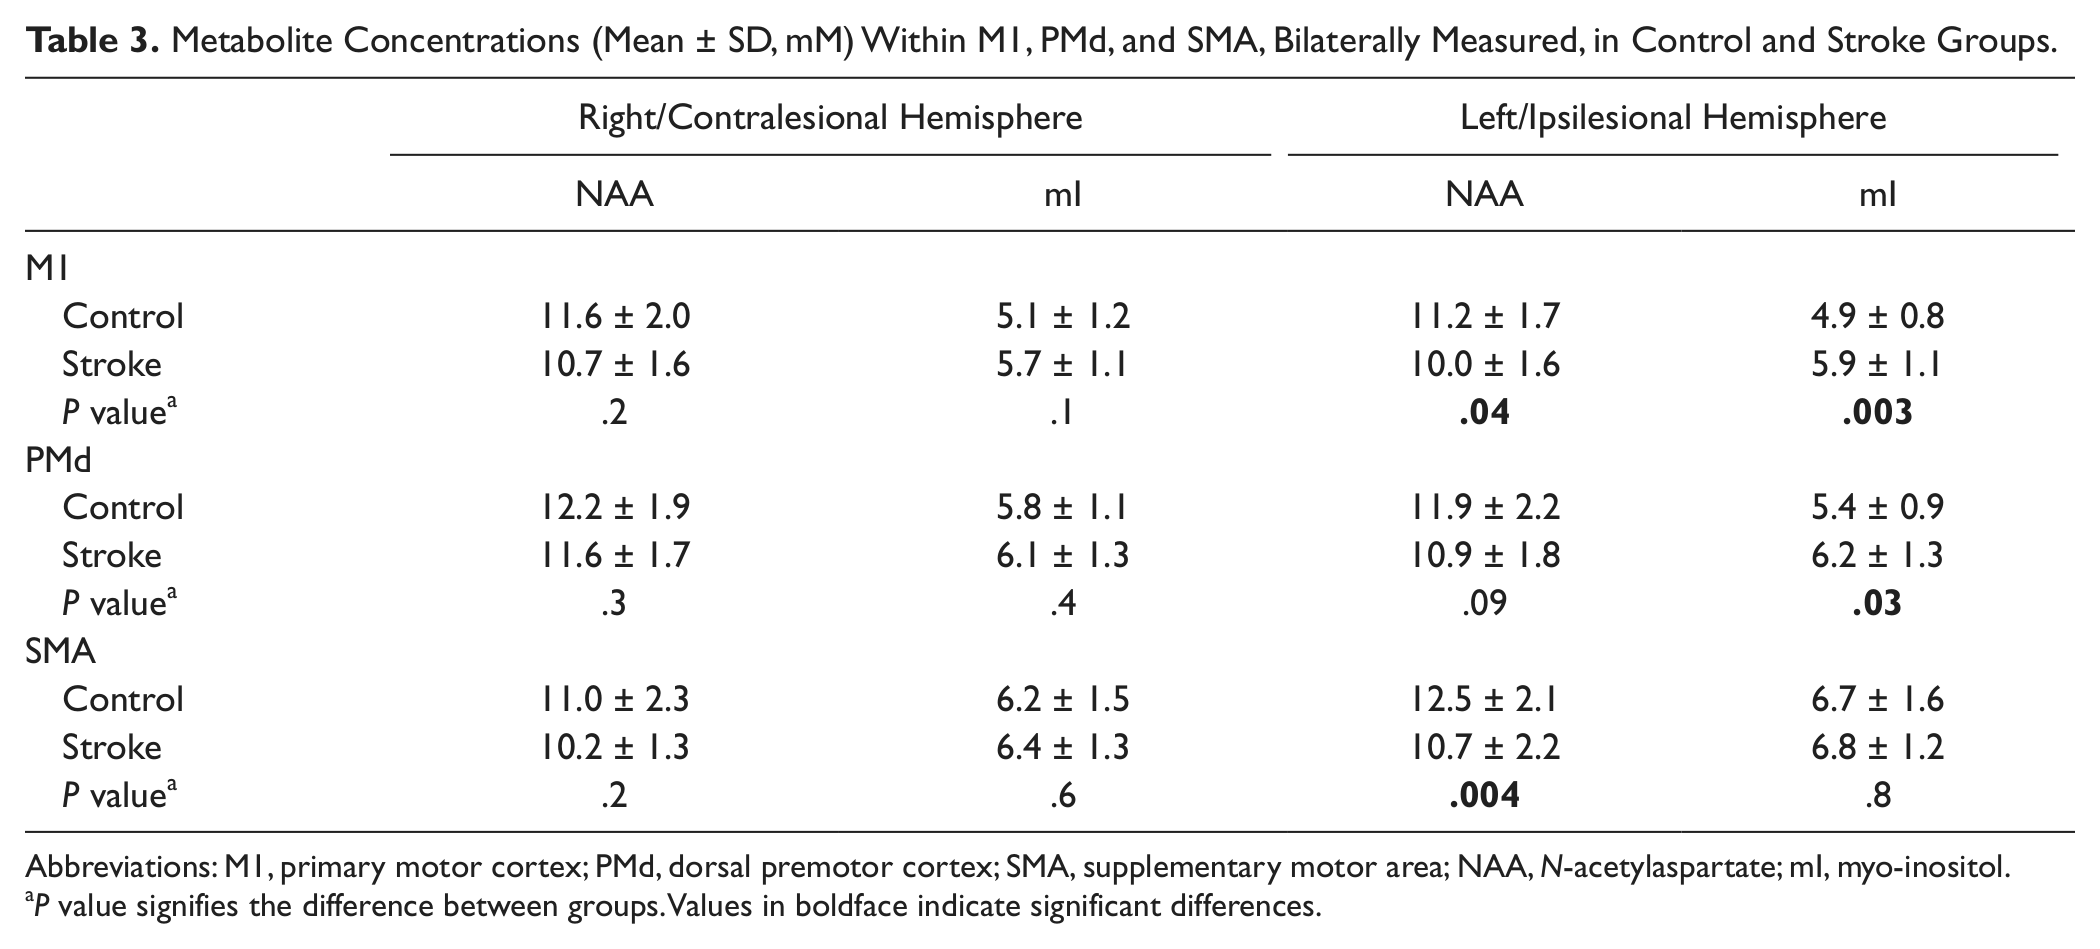
Abbreviations: M1, primary motor cortex; PMd, dorsal premotor cortex; SMA, supplementary motor area; NAA, N-acetylaspartate; mI, myo-inositol.
P value signifies the difference between groups. Values in boldface indicate significant differences.
Correlations Between Metabolite Concentrations and Arm Motor Impairment
Significant correlations were found between ipsilesional NAA and both hand (M1, r = .51, P = .04) and shoulder/elbow (M1, r = .55, P = .02; PMd, r = .51, P = .01; SMA, r = .51, P = .02) FMUE subscores (Figure 2B). Contralesional M1 NAA was significantly correlated with shoulder/ elbow FMUE subscores (r = .54, P = .02). There were no significant correlations between ipsilesional or contralesional mI concentrations and FMUE subscores.
Discussion
We used noninvasive magnetic resonance spectroscopy to investigate the effects of an ischemic subcortical stroke on metabolites related to neurons and glia in spared motor and premotor areas. We also investigated the relationships between these metabolites and the clinical severity of arm motor impairment. We found altered metabolite concentrations, that is, lower NAA and higher mI, across ipsilesional motor and premotor areas. Ipsilesional NAA values were correlated with proximal and distal arm motor impairments while contralesional motor NAA with proximal impairment.
Stroke-Related Metabolite Alterations in Spared Motor and Premotor Cortices
The magnitude of the metabolite alterations described here is similar to spectroscopic findings in normal-appearing brain tissue in other central nervous system pathologies such as systemic lupus erythematous, 31 traumatic brain injury, 32 multiple sclerosis,33,34 and Alzheimer disease. 35 Accordingly, although the physiologic mechanisms might differ, we consider the changes in NAA and mI reported in our patients to be biologically robust.
Since NAA is found almost exclusively in neurons, 36 lower concentrations in ipsilesional M1 and SMA might be due to neuronal loss 37 and/or neuronal mitochondrial depression.21,22 On one hand, irreversible neuronal loss seems unlikely since few data regarding retrograde degeneration 38 or remote apoptotic cell death have been reported after stroke. On the other hand, within remote hypoperfused brain territory (middle cerebral artery territory in 95% of our patients), unless the recanalization or collateral blood supply is sufficient to prevent ischemia, 39 multiple remote focal infarctions may occur. This may partially explain low NAA in ipsilesional M1 (and in ipsilesional PMd in the subgroup of patients with lesions of the posterior limb of the internal capsule) but not in ipsilesional SMA (supplied by anterior cerebral artery). Moreover, if neuronal loss was significant, cortical volume loss might be expected, but we found percentages of brain tissue volume measured in the spectroscopic voxels to be similar in patients and controls. Therefore, appreciable remote neuronal death seems unlikely. However, these areas might contain neurons with “damaged” axons, since subcortical stroke is likely to involve both motor and premotor pathways.40,41 Indeed, after axonal injury, morphologic and biochemical cell body changes produce shifting from a “transmitting” to a “degenerative/regenerative” state causing neuronal depression.38,42 In our sample, the anterior limb of the internal capsule was involved in 15% of patients, the posterior limb in 35% of patients and both anterior and posterior limbs in 15% of patients. Although the majority of premotor efferents course through the anterior limb and genu of the internal capsule 43 those efferents relevant for arm recovery per se generally course more posteriorly through the posterior limb.40,41 Indeed, our subgroup analysis on patients with lesions of the posterior limb of the internal capsule showed notably lower NAA not only in M1 but also in PMd and SMA. Hence, our data could reflect the events that occur in remote motor and premotor neurons with “damaged” axons at the subcortical level. However, since only 3 patients suffered anterior limb lesions, we could not draw strong conclusions.
Currently, only one other study reported lower NAA in ipsilesional motor and premotor (PMd) areas after stroke. 20 Our findings of lower NAA in M1 and PMd corroborates the findings of Kobayashi et al, 20 although the magnitude of our results in PMd for the entire group of patients is lower. This may reflect methodological differences, for example, the use of white matter NAA/creatine ratios, 20 or the fact that we studied chronic survivors of an ischemic subcortical stroke (>6 months postonset) compared with acute deep intracerebral (thalamus, putamen) hemorrhagic stroke (<1 month) in their study.
We also report higher mI concentrations in ipsilesional M1 and PMd. These results confirm the findings of our previous report on 14 patients, which suggested higher mI in ipsilesional M1. 21 Since glial cells contain high concentrations of mI, 37 reactive gliosis secondary to neuronal loss could explain elevated mI, but we found little evidence of neuronal death in these areas. Based on the role of the astrocytes in modulating synaptic transmission, synaptogenesis, and synaptic plasticity,23,24,44,45 we hypothesize that glia may play an important role in brain plasticity after stroke. Indeed, a direct relationship between astroglial and synaptic responses poststroke has been found in spared cortical areas. 46 Nonetheless, the specific mechanism underlying the altered mI concentrations remains an open question.
Clinical Correlations
In our study, patients with poor proximal recovery were more likely to have low NAA suggesting altered neuronal integrity in contralesional M1 and ipsilesional M1, PMd, and SMA. In explaining these results, it is useful to consider the high degree of similarity between the corticospinal projections from the hand regions of M1, PMd, and SMA,8-10 thus providing the substrate whereby these motor areas could generate an output necessary for movement. This implies that damage in one of these areas could be at least partially compensated by recruitment of another.
Abnormal proximal movements of the arm are directly related to the use of compensatory behavior, that is, new motor patterns resulting from the adaptation of remaining motor elements, in hemiparetic patients.47,48 Our group, and also others, suggests that the neural systems mediating such behavior are likely to include remaining intact brain tissue in both hemispheres.49-53 Concordant with these findings, our data may suggest that compensatory behavior is related to the neuronal integrity in spared contralesional motor and ipsilesional motor and premotor areas. This result has important implications for neurorehabilitation. Given that motor function could be altered through rehabilitative interventions, for example, electromagnetic stimulation,54,55 preventive or permissive strategies for compensatory behavior could be developed.
Study Limitations
There are several limitations to this study. First, although our focus on subcortical infarcts provides statistical power by minimizing patient variance, it limits our ability to explore the effects of infarct location on metabolite concentrations (eg, subcortical vs cortical). Second, our sample included a wide range of time after injury (6-144 months). This might have contributed to the spread of metabolite concentrations, although no data regarding the evolution of metabolites in remote areas over such a long period have been reported. Third, our results (lower NAA) could be explained, in part, by cerebral blood flow alterations, perhaps resulting from carotid stenosis. However, there is some evidence that reduced blood flow also results in elevated choline and lactate.56-59 Since we did not observe alterations in these 2 metabolites, we consider that carotid stenosis is not an appreciable contributor to our findings. Fourth, it is difficult to rule out contributions of plasticity occurring elsewhere within the network. Future studies are required to determine the relative contributions of different sites of plasticity and the experimental conditions in which they apply differentially. Finally, because of the point-spread function of 1H-MRSI acquisitions, the effective voxel size is bigger than the nominal voxel size. Thus, we cannot rule out the possibility that our measurements include more than hand representation in each area.
Conclusions
We promote the use of the cutting-edge MRS measurements to improve our understanding of the neural substrates underlying reorganization in remaining intact brain structures after stroke. Such an approach may further enable monitoring recovery or compensation based on this reorganization and evaluating new treatment regimes that assist motor recovery.
Footnotes
Authors’ Note
SCC is presently at Neurosurgery Department IV, Bagdasar-Arseni Hospital, Bucharest, Romania. The content is solely the responsibility of the authors and does not necessarily represent the official views of the funding agencies.
Declaration of Conflicting Interests
The authors declared no potential conflicts of interest with respect to the research, authorship, and/or publication of this article.
Funding
The authors disclosed receipt of the following financial support for the research, authorship, and/or publication of this article: This work was supported by American Heart Association (0860041Z to Dr Cirstea; 0655759Z to Dr Brooks). The Hoglund Brain Imaging Center is supported by a generous gift from Forrest and Sally Hoglund and funding from the National Institutes of Health (P30 HD002528, S10 RR29577, UL1 RR033179, and P30 AG035982). Dr Brooks is also supported in part by P30 AG035982, R01 AG033673, R01 DK080090, R01 DK085605, and UL1 RR033179. Dr Nudo is supported in part by R37 NS030853.