
Abstract
Objective. Impaired attentional processes have been linked with poor outcomes after stroke, but their radiographical correlates have been infrequently studied. Our objective was to assess the relationship between stroke location and vigilant attention. Methods. A total of 39 patients presenting within 2 weeks of a minor stroke were prospectively recruited. Vigilant attention was assessed using the psychomotor vigilance task (PVT), and neuroimaging was used to assess stroke location, white matter hyperintensity (WMH) burden, and ischemic stroke involvement within lateral cholinergic projections. Correlational analyses and linear regression models tested the association between PVT performance and our neuroimaging parameters of interest. Subtractions of lesion overlays were used to identify brain regions of acute stroke patients who performed most poorly on the PVT. Results. Subcortical stroke location was a predictor of PVT performance in this cohort of acute stroke patients. Patients who performed most poorly on the PVT had lesions in the corona radiata, internal capsule, globus pallidus, and thalamus. Global WMH burden and cerebrovascular disease in lateral cholinergic pathways were not significant predictors of PVT performance. Interpretation. Subcortical stroke location was associated with impaired vigilant attention. The poorest PVT performers had stroke lesions involving the corona radiata, internal capsule, globus pallidus, and thalamus, suggesting that vigilance depends on the integrity of subcortical structures and their connections with cortical brain regions.
Introduction
Vigilance is defined as the ability “to maintain concentrated attention alert to stimuli over prolonged periods of time.” 1 (p. 433) A deficit of vigilance may correspond to a pathologically increased fatiguing more than to an alteration of the wake-sleep cycle. Deficits in vigilant attention are frequently reported after stroke and are among the most prominent neuropsychological alterations in this clinical setting. 2 Moreover, impaired attention is an important predictor of health-related quality of life following stroke 3 and is commonly targeted in poststroke rehabilitation programs. 4 Attention has been used to predict long-term functional recovery 5 and quality of life 6 and has been linked to important social and physical outcomes, such as falls in community-dwelling stroke survivors. 7 As such, focus has been directed to rehabilitate attention levels by relearning specific attention-related skills and retraining damaged cognitive function.
The neural substrates of impaired vigilant attention have been underexplored in the setting of stroke. Ischemic lesions disrupting sleep-wake modulatory circuits within the brainstem, and hypothalamic and thalamic regions may be important modulators of attention. Such lesions may compromise subcortical-frontal activating attentional networks of the basal ganglia and anterior-medial thalamus,8,9 whereas lesions affecting lateral cholinergic pathways may affect select executive functions and visuospatial attention.10,11
A clinically useful measure of vigilant attention is the psychomotor vigilance task (PVT), which is an easily administered neurocognitive assay that is sensitive to sleep loss and circadian rhythm disturbances.12,13 The PVT has been mostly validated in healthy populations, and deficits have been studied to date in only 1 stroke cohort. 14 Performance on the PVT has been associated with changes in vigilant attention, impaired driving, and a high rate of automobile accidents in patients with sleep disturbances,15,16 suggesting that the PVT may have a useful role in patients after stroke.
Our primary objective was to assess the relationship between stroke location and performance on the PVT. On the basis of prior magnetic resonance imaging (MRI) studies, we hypothesized that poorer performance on the PVT would be associated with lesions in subcortical structures involving the corona radiata, internal capsule, lentiform nucleus, and thalamus.17-20 Our secondary objectives were to assess the relationship of PVT performance with white matter hyperintensity (WMH) burden and the presence of cerebrovascular disease in lateral cholinergic pathways.
Methods
Ethics
This study was approved by the Sunnybrook Research Ethics Board prior to initiation. All participants provided written informed consent.
Study Population
As has been previously described, 21 we consecutively recruited patients presenting within 14 days of a neuroimaging-confirmed minor ischemic stroke (National Institutes of Health Stroke Scale score ⩽3). 22 We excluded patients with a life expectancy of less than 12 months at the time of recruitment (as determined by the study investigators), pronounced cognitive impairment, and/or a language barrier restricting the ability to answer the study questionnaires or a motor deficit affecting the ability to perform the PVT with the dominant hand.
Psychomotor Vigilance Task
To assess vigilant attention, participants underwent the standard 10-minute PVT (PVT-192, Ambulatory Monitoring Inc, Ardsley, NY), which has been previously validated to measure changes in sustained attention. 13 Participants were instructed to react as quickly as possible by pressing a button as soon as they saw a red millisecond-counter displayed on a small screen. The participant’s reaction time (RT) was then displayed for 1 s to provide feedback on their performance. This visual stimulus would appear in randomized intervals ranging from 2 to 10 s. The entire test lasted 10 minutes, corresponding to approximately 100 test visual stimuli. Using previous recommendations, 23 the following outcome measures were assessed per testing session: (1) mean reciprocal RT (MRRT), a measure of response speed; (2) number of lapses (defined as RT > 500 ms); and (3) the 10% fastest MRRT. Higher values of the MRRT indicated faster RTs. The inverse transformation of the RT (MRRT) emphasizes small changes in fast RTs while at the same time de-emphasizing the confounding effect of long duration lapses.
A valid response on the PVT included RTs >100 ms, whereas RTs <100 ms and responses without a stimulus were considered false starts. Invalid responses on the PVT included those in which the button was held for 3 or more seconds or when the wrong key was pressed; these were excluded in subsequent calculations.
Neuroimaging
All patients underwent MRI or computed tomography (CT) within 3.3 (3.9) days of their acute stroke. As has been previously described, 21 if CT and MRI were performed in the same patient, only MRI data were analyzed. MRI (General Electric Medical Systems) included T2 fluid attenuated inversion recovery (FLAIR) and diffusion-weighted image (DWI) sequences. Global WMH appearing hyperintense on FLAIR and hypodense on CT were visually scored using the Age-Related White Matter Change (ARWMC) Scale 24 by a neuroimaging analyst (RTM). This scale rates frontal, parieto-occipital, temporal, basal ganglia, and infratentorial brain regions on a scale of 0 to 3, with 3 being most diffuse. Total scores range from 0 to 30. Interrater reliabilities for the ARWMC ratings were examined using intraclass correlation coefficients (ICCs) for absolute agreement with 10 gold standards produced by an experienced research neuroradiologist (FG). The ICC for a single rater (RTM) wasr2 = 0.96 (P = .0001).
The previously validated Cholinergic Pathways Hyperintensities Scale (CHIPS) 25 was used to quantify the degree of WMH and ischemic stroke involvement within lateral cholinergic projections of the external capsule, corona radiata, and centrum semiovale. Originally described by Bocti et al, 25 CHIPS is a visual rating scale that utilizes immunohistochemical tracings of human cholinergic pathways imposed onto structural MRI scans that are divided into 10 regions and 4 index brain slices. The maximum score is 50 points per hemisphere; therefore, the highest score per scan is 100 points.
Acute stroke lesions on CT were defined as areas of significant hypodensity associated with the acute stroke symptom presentation. Similarly, acute stroke lesions on MRI were defined as areas of hyperintensity on DWIs with corresponding hypointensity on the apparent diffusion coefficient images. Acutely infarcted tissues appearing hypodense on CT or hyperintense on MRI DWI were traced using ANALYZE 8.0 (Biomedical Imaging Resource, Mayo Foundation, Rochester, MN). All stroke localizations were confirmed by a formal neuroradiology report.
Stroke Lesion Localization: A Case Series Description of Topographic Stroke Distribution
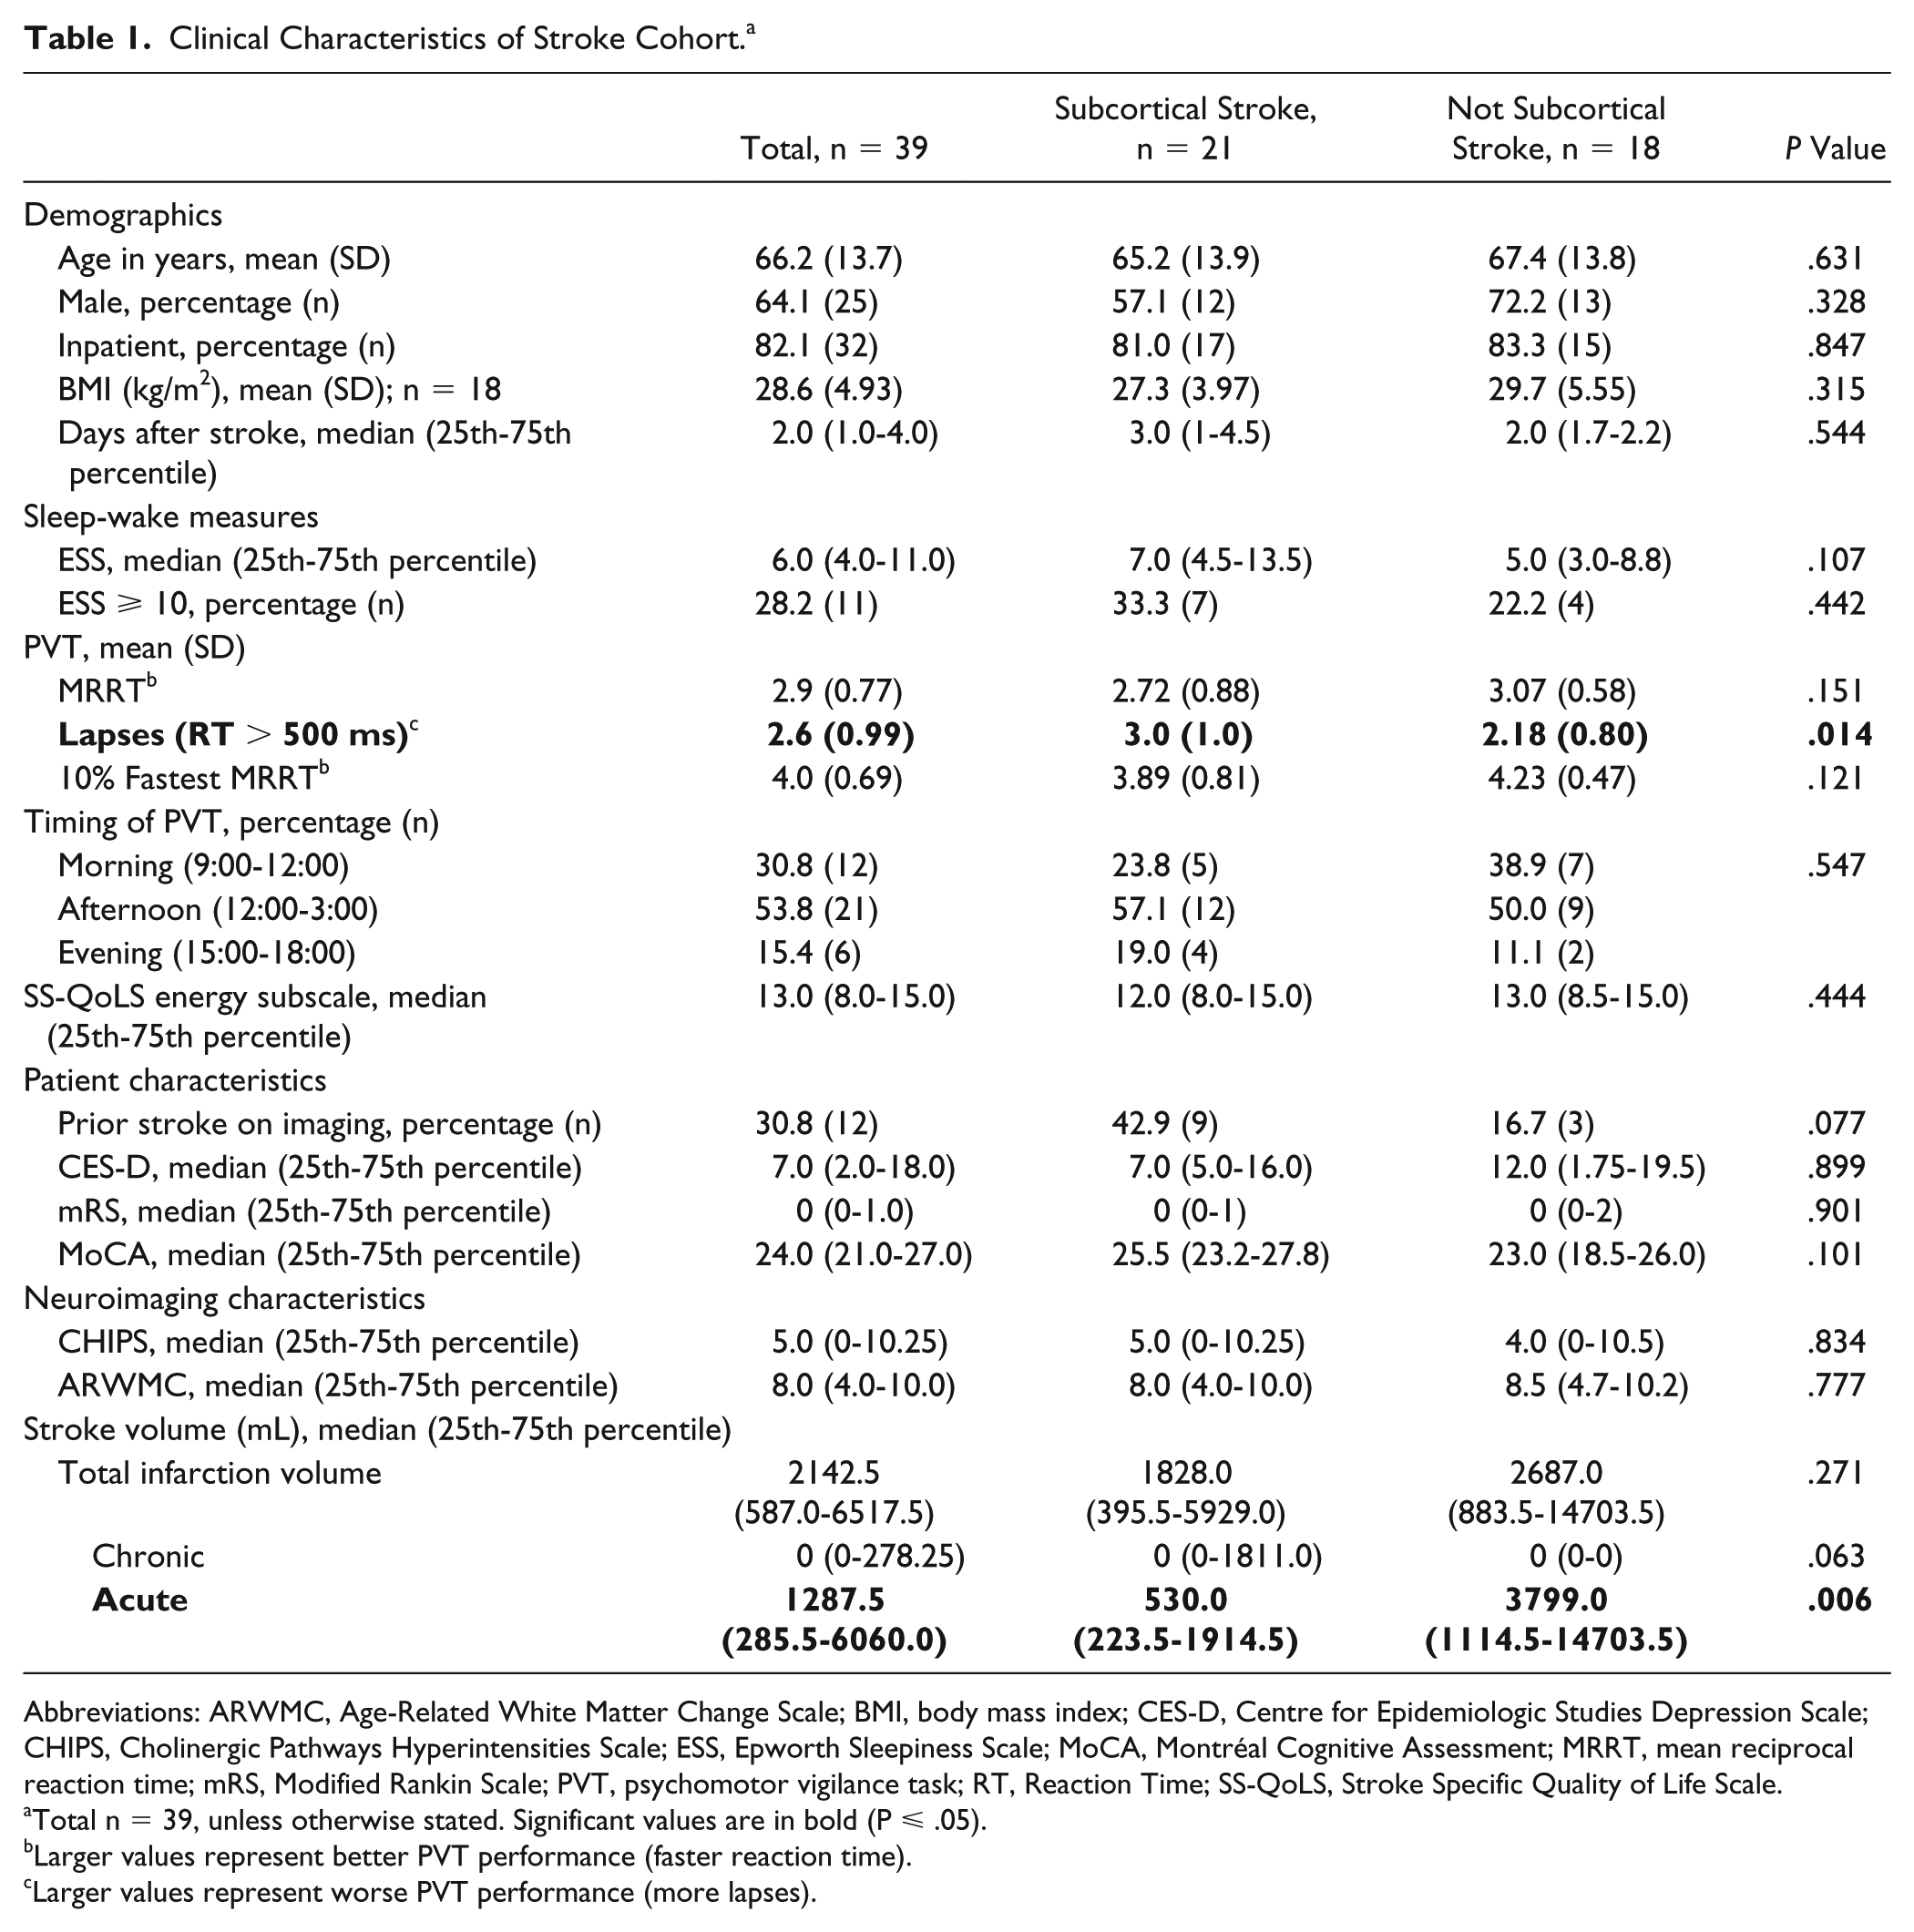
We assessed whether any specific brain regions might be commonly affected in those who performed most poorly on PVT by comparing the best (n = 20) and worst (n = 19) performers on the PVT. To visually compare stroke lesions between groups and assess for any unique areas of brain infarcted in the PVT poor performers, we transformed all stroke lesions into the Montreal Neurological Institute (MNI) 2009a T1-weighted, 1-mm MRI template space.26,27 We utilized a robust deformation and nonlinear coregistration algorithm provided by Advanced Normalization Tools (ANTS), to coregister patient native space MRIs and CT images to the MNI template space.26,27 ANTS is robust to intramodality and intermodality coregistration and transformation26,27 and was, therefore, appropriate for coregistration of the CT, MRI-DWI, and MRI-FLAIR sequences. Using ANTS, stroke tracings from patients were transformed into MNI space. All transformed stroke tracings were visually inspected and verified by an experienced research neuroradiologist (FG). All strokes were then flipped into a single hemisphere, and MRIcro software version 1.40 (Rorden, Columbia, SC) was used to subtract the overlays of the best (n = 20) and worst (n = 19) PVT performers; this allowed us to observe regions of infarction that were unique to those who performed most poorly on the PVT. Relevant brain structures were identified by a stroke neurologist and independently verified by a research neuroradiologist (FG) and neuroimaging analyst (RTM) with use of the MNI atlas. Given our sample size, we display the topographically transformed images in MNI space as a case series description. Of the 39 patients with an acute stroke on imaging, only 2 had CT imaging.
Clinical Outcome Scales
Participants completed the Epworth Sleepiness Scale (ESS), 28 the Sleep-Specific Quality of Life Scale (SS-QoLS), 29 and the Centre for Epidemiological Studies Depression Scale (CES-D) 30 as subjective poststroke measures of sleepiness, fatigue, and depressive symptoms, respectively.
The ESS is a widely used self-administered questionnaire that provides a subjective measure of daytime sleepiness. For the ESS, participants were asked to rate the chances that they would fall asleep in 8 common daily scenarios. Each item was scored by the patient on a 4-point Likert scale from 0 (never) to 3 (high chance), with a maximum possible score of 24 and a minimum score of 0. Patients with Epworth scores ⩾10 were considered to have excessive daytime sleepiness.
The SS-QoLS is a disease-specific assessment tool that examines different functional domains affected by stroke patients. The SS-QoLS “energy” domain has been used as a surrogate for the poststroke energy state and fatigue. 31 On the SS-QoLS, participants rated their scores on a range of commonly affected functional domains using 5-point Likert scales. Only the subset of responses on the SS-QoLS concerned with fatigue was examined.
The CES-D is a 20-item self-report scale used to measure current levels of depressive symptoms. The scale was designed to assess relationships between depression and other variables within different subgroups and has been validated to examine depressive symptoms in the stroke population. 32 For the CES-D, possible scores range from 0 to 60. Depressive symptoms are indicated by higher scores and are weighted by how frequently they were experienced within a given week (ie, less than 1 day, 1-2 days, 3-4 days, 5-7 days).
Statistics
For our descriptive statistics, categorical variables are described using counts and frequencies, and compared using the χ2 test. We report ordinal variables and nonnormally distributed continuous variables as medians and interquartile ranges, and the Mann-Whitney U-test was used for comparisons between groups. Normally distributed continuous variables (ie, age, body mass index, MRRT, lapses, and 10% fastest MRRT) are presented as means and SDs, and group values are compared using independent sample t-tests. Two of our PVT parameters of interest (ie, lapse count and the 10% fastest mean RT) were not normally distributed in their raw forms, so we transformed them in order to make them normally distributed continuous variables. A natural logarithmic transformation was applied for lapse count and an inverse transformation was used for the 10% fastest mean RT; normality was assessed using the Shapiro-Wilk test. Spearman’s rho (ρ) was used to assess associations between categorical variables and Pearson’s correlation coefficient for continuous variables.
Following our case series analysis of topographic stroke localization, a linear regression model was constructed to test our hypothesis that subcortical stroke location would be independently associated with poorer performance on the PVT while controlling for the effect of age, sex, and stroke volume. We also used linear regression models to assess the relationship of WMH burden and the presence of cerebrovascular disease in lateral cholinergic pathways with poorer performance on the PVT while controlling for the effect of age, sex, and stroke volume. Prior to modeling, all variables were assessed for multicollinearity (tolerance statistic value < 0.4); if multicollinearity was found, only 1 member of a correlated set of variables was retained in the model. The final model was assessed for any potential violations to linear regression modeling using residual plots. Based on established statistical methodology, the maximum number of correlates entered into each regression model was determined by our sample size (one correlate for every 10 participants). 33 Statistical significance was set at P ⩽.05. All analyses were performed using SPSS version 22.0 (SPSS, Inc, Chicago, IL) software. Because our analyses were considered exploratory in nature, we did not correct for multiple comparisons.
Results
Characteristics of the Study Population
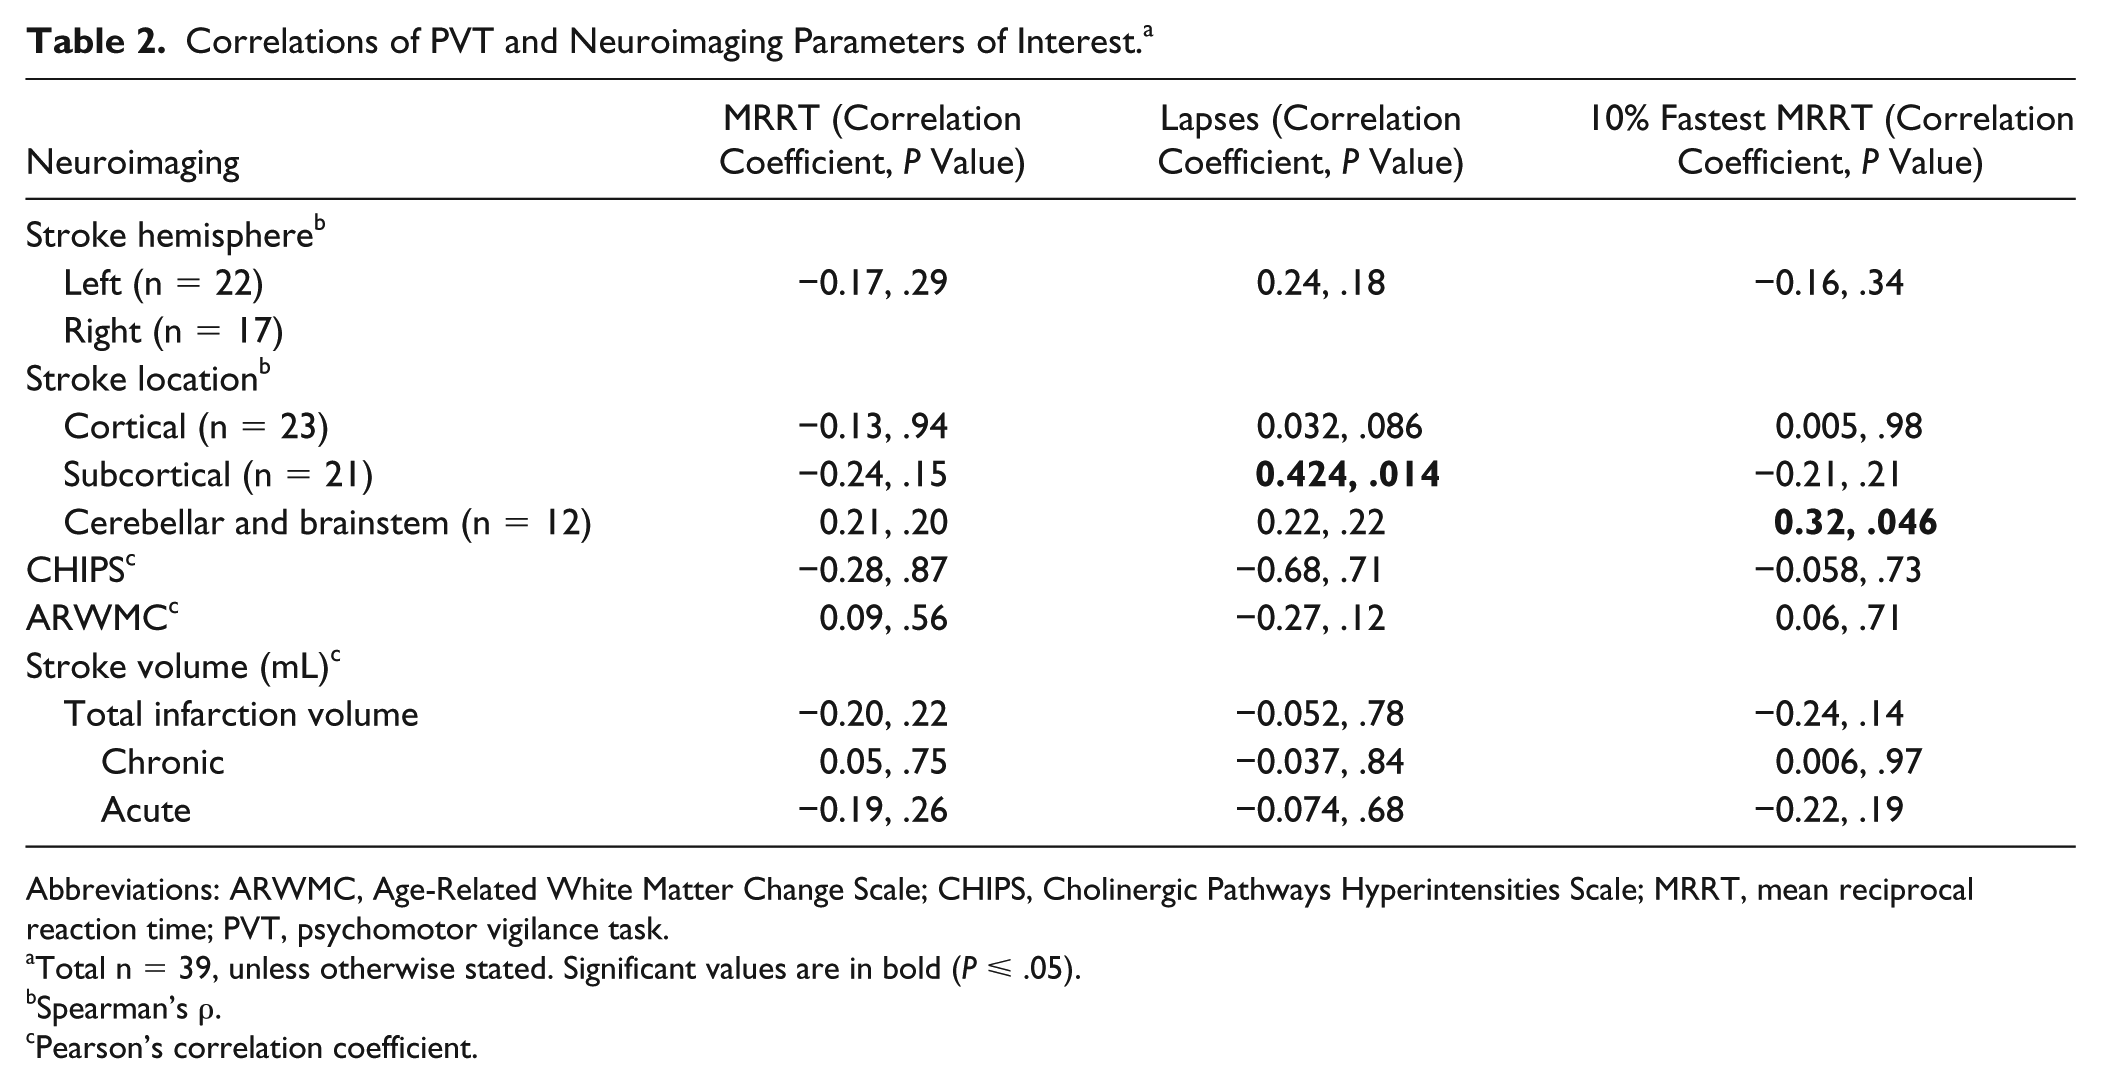
All clinical measures were obtained on the same day and, on average, 2.0 (2.3) days after the index stroke. Clinical and demographic data are presented in Table 1. A total of 39 patients were analyzed in our study: mean age, 66.2 (13.7) years; 64.1% male. No patient had hemiparesis that would have affected their performance on the PVT.
Clinical Characteristics of Stroke Cohort. a
Abbreviations: ARWMC, Age-Related White Matter Change Scale; BMI, body mass index; CES-D, Centre for Epidemiologic Studies Depression Scale; CHIPS, Cholinergic Pathways Hyperintensities Scale; ESS, Epworth Sleepiness Scale; MoCA, Montréal Cognitive Assessment; MRRT, mean reciprocal reaction time; mRS, Modified Rankin Scale; PVT, psychomotor vigilance task; RT, Reaction Time; SS-QoLS, Stroke Specific Quality of Life Scale.
Total n = 39, unless otherwise stated. Significant values are in bold (P ⩽ .05).
Larger values represent better PVT performance (faster reaction time).
Larger values represent worse PVT performance (more lapses).
Significant differences in lapse count were observed in patients who sustained a subcortical stroke compared with those who sustained a stroke elsewhere (Table 1). Stratification by the presence or absence of a sustained subcortical stroke revealed greater acute stroke volumes in those who had a stroke in nonsubcortical locations. Stratification did not reveal any differences in fatigue levels, as measured by the SS-QoLS, or daytime sleepiness, as measured by the ESS. Using the Center for Epidemiologic Studies Depression Scale (CES-D), there were no differences in depressive symptoms between those who sustained a subcortical stroke or those who sustained a stroke elsewhere. As such, we did not pursue the CES-D, ESS, or SS-QoLS in our subsequent analyses.
Description of Stroke Locations
A total of 21 (53.9%) patients sustained a subcortical stroke involving the caudate (n = 7, 17.9%), putamen (n = 9, 23.1%), thalamus (n = 9, 23.1%), internal capsule (n = 1, 2.6%), and/or the corona radiata (n = 4, 10.3%); 23 (59.0%) patients sustained a cortical stroke involving the frontal lobe (n = 4, 10.3%), parietal lobe (n = 1, 2.6%), temporal lobe (n = 3, 7.7%), or the occipital lobe (n = 3, 7.7%). The remaining patients had strokes that involved multiple lobes of the brain (n = 12, 30.8%), and 12 (30.8%) patients sustained a stroke in the cerebellum or brainstem.
PVT Performance and Neuroimaging Correlates
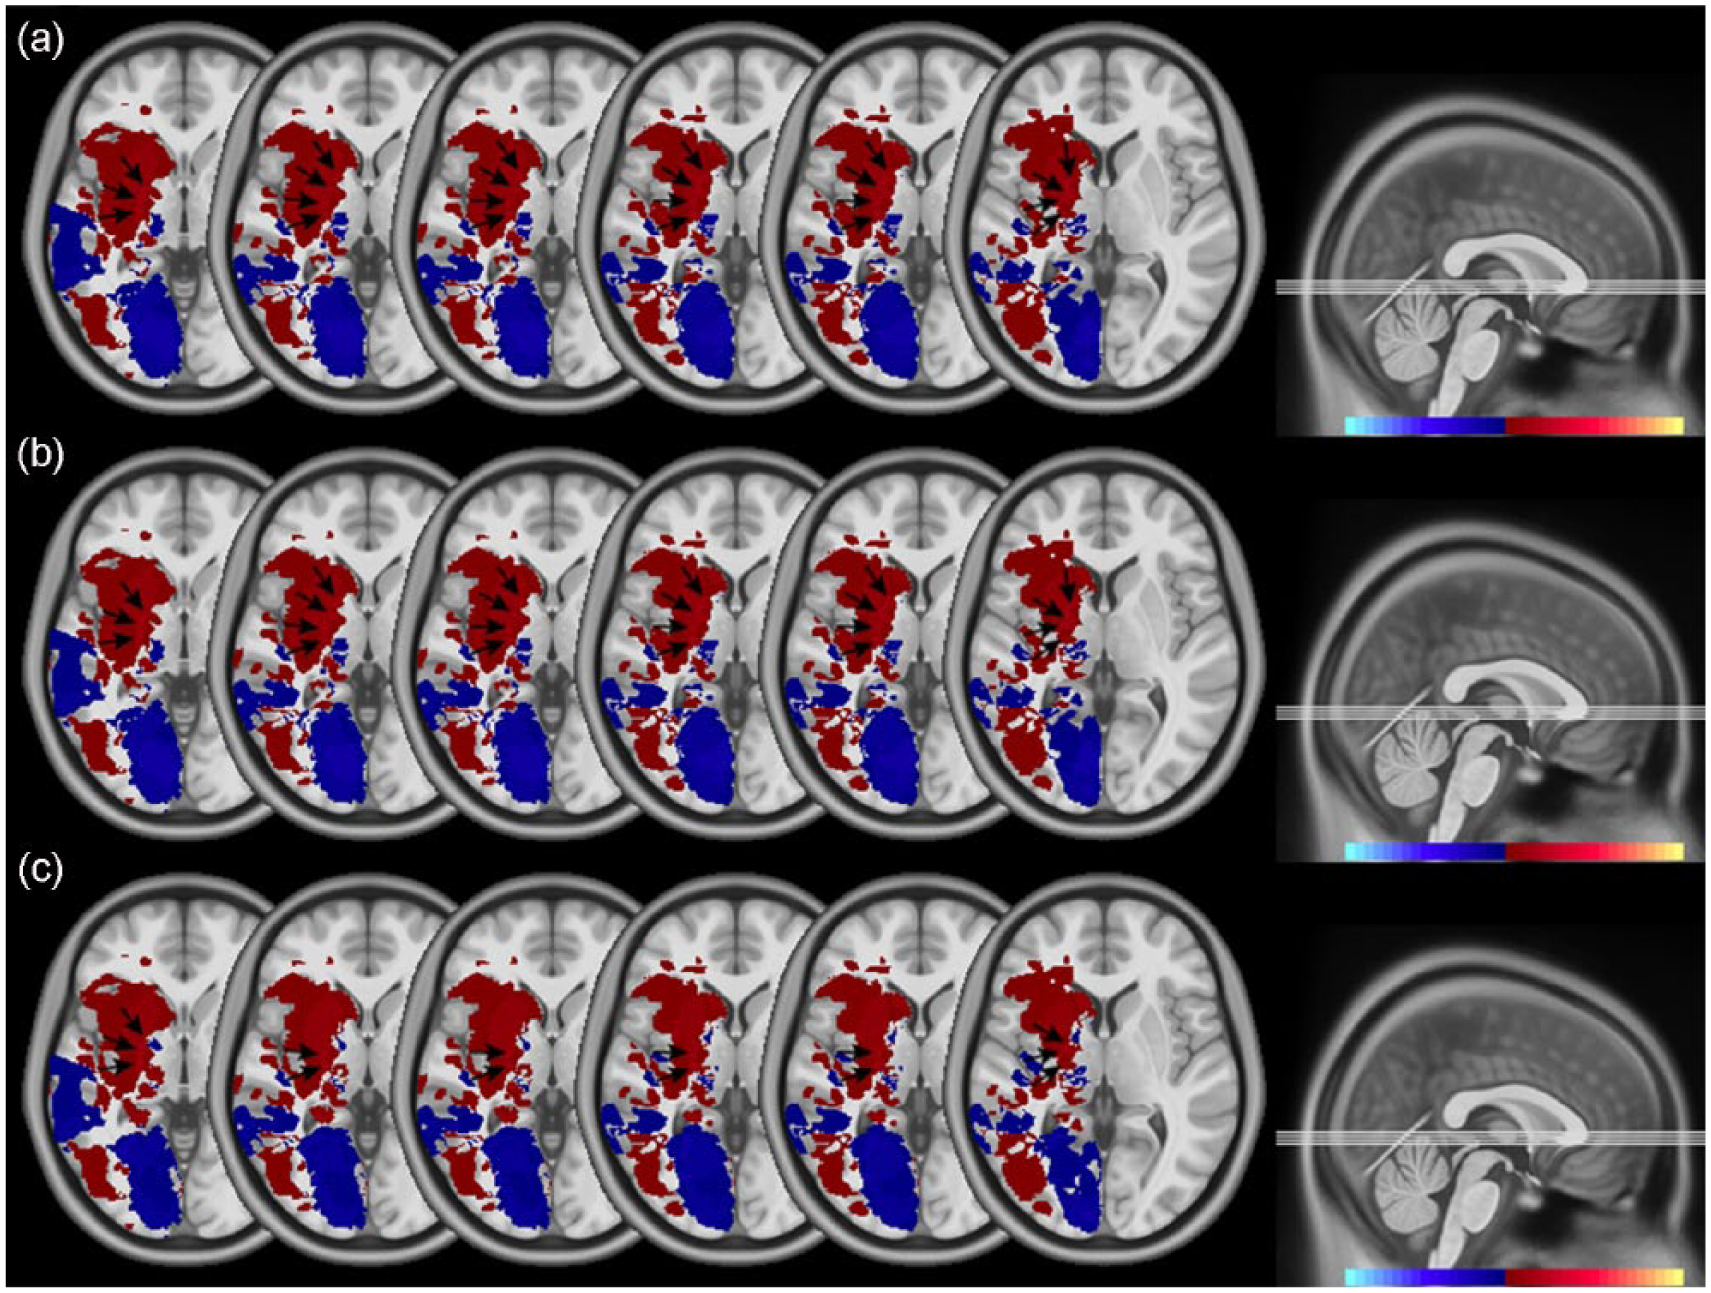
Correlational analyses revealed a significant relationship with stroke location and PVT performance, but not with brain lateralization, CHIPS, ARWMC, or stroke volumes. Those who sustained a stroke within subcortical brain structures held higher lapse counts on the PVT, whereas those who sustained a stroke in the cerebellar or brainstem regions overall performed better on the PVT, as indicated by fastest 10% MRRT (Table 2).
Correlations of PVT and Neuroimaging Parameters of Interest. a
Abbreviations: ARWMC, Age-Related White Matter Change Scale; CHIPS, Cholinergic Pathways Hyperintensities Scale; MRRT, mean reciprocal reaction time; PVT, psychomotor vigilance task.
Total n = 39, unless otherwise stated. Significant values are in bold (P ⩽ .05).
Spearman’s ρ.
Pearson’s correlation coefficient.
Case Series Stroke Topography According to PVT Performance
Results from the spatial subtractions of the stroke locations for the best (n = 20) and worst (n = 19) PVT performers are summarized in Figure 1. Overall, subcortical stroke location appeared more commonly in patients who performed most poorly on the PVT. Regions most commonly affected in this group included the corona radiata, internal capsule, globus pallidus, and thalamus.
Case series visual representation of the slowest and fastest PVT performers; image produced by the subtraction of stroke lesions of the best and worst performers on the following PVT parameters: (a) MRRT, (b) lapse count, and (c) 10% fastest MRRT. Blue regions indicate lesions of those individuals who demonstrated better PVT performance, and bright red regions (arrows) indicate lesions of individuals who performed most poorly on the PVT. Bright red regions represent the greatest degree of stroke overlap and included the corona radiata, internal capsule, globus pallidus, and thalamus.
Predictors of PVT Performance
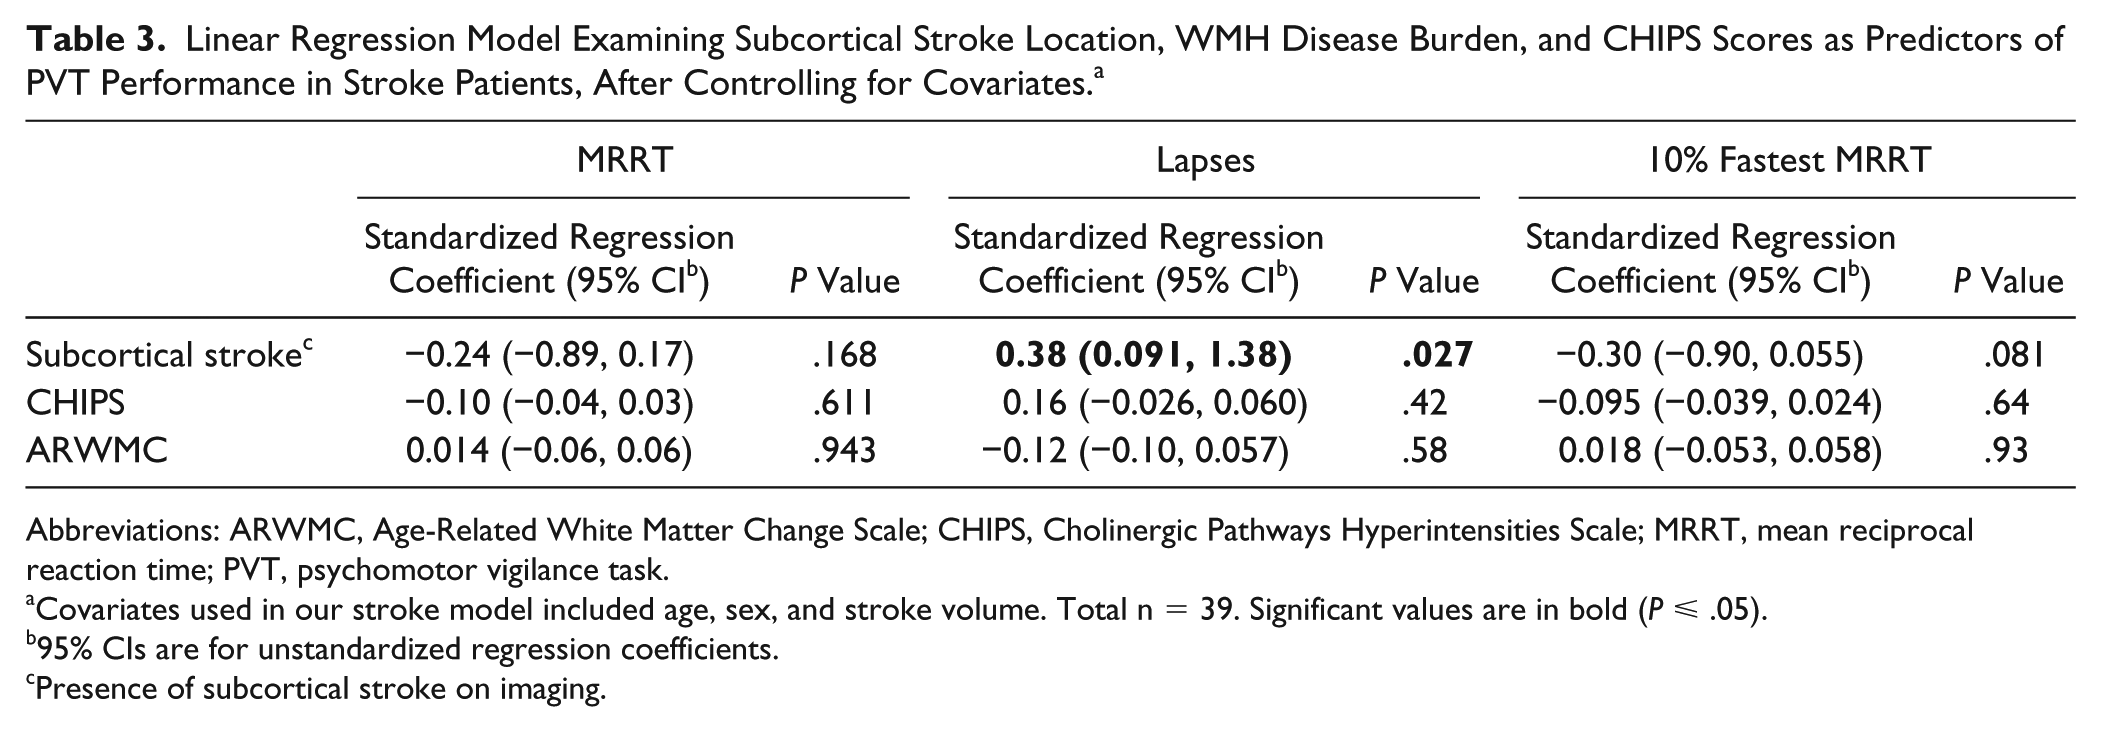
In our linear regression analyses, while controlling for the effects of age, sex, and acute stroke volume, subcortical stroke location was an independent predictor of poor PVT performance for 1 of the 3 PVT metrics (ie, lapse count) and approached significance in 10% fastest MRRT. CHIPS and global WMH quantity were not independent predictors of PVT performance (Table 3).
Linear Regression Model Examining Subcortical Stroke Location, WMH Disease Burden, and CHIPS Scores as Predictors of PVT Performance in Stroke Patients, After Controlling for Covariates. a
Abbreviations: ARWMC, Age-Related White Matter Change Scale; CHIPS, Cholinergic Pathways Hyperintensities Scale; MRRT, mean reciprocal reaction time; PVT, psychomotor vigilance task.
Covariates used in our stroke model included age, sex, and stroke volume. Total n = 39. Significant values are in bold (P ⩽ .05).
95% CIs are for unstandardized regression coefficients.
Presence of subcortical stroke on imaging.
Discussion
Our study evaluated the relationship between stroke location and vigilant attention in the acute stroke setting. This study examines the largest cohort of acute stroke patients using the PVT. We demonstrate that impaired vigilant attention is associated with subcortical stroke location as well as adjacent connecting white matter tracts (eg, internal capsule and corona radiata) but not with the presence of WMHs or cerebrovascular disease in cholinergic pathways. Consistent with our results, prior work has also suggested that optimal performance on the PVT relies on the recruitment of subcortical structures such as the basal ganglia and thalamus, in addition to the white matter tracts connecting frontal and subcortical brain regions, including the internal capsule and corona radiata.18,19
This study is the first to use a stroke model case series to suggest neuroanatomical regions that may be linked with PVT performance. In Figure 1, we provide a case series topographic depiction of the unique brain regions of the best and worst PVT performers. The greatest overlapping topography shared by those who performed the worst on the PVT included the corona radiata, internal capsule, globus pallidus, and thalamus. Diffusion tensor imaging (DTI) and functional MRI studies have identified similar neuroanatomical correlates with the PVT.19,34 Moreover, the dorsolateral prefrontal circuit has been linked with tasks involving sustained and focused attention as well as motor programming. 35 Consistent with the prior literature, our finding that those who performed poorly on the PVT experienced strokes that were localized to the corona radiata, internal capsule, globus pallidus, and thalamus lends support for an association between psychomotor function and the involvement of subcortical brain regions as well as projecting white matter tracts.
Per our overlay analysis, strokes involving subcortical structures such as the internal capsule, globus pallidus, and thalamus were common among the poorest PVT performers. Despite larger stroke volumes in patients who sustained strokes outside of subcortical brain regions (P = .006), vigilant attention was still significantly affected by the presence of a subcortical stroke on imaging. Subcortical stroke location was associated with higher rates of lapses on the PVT in Table 1 as well as in our correlational analyses (ρ = 0.424; P = .014). Unexpectedly, the presence of strokes in the cerebellar and brainstem regions seemed to enhance PVT performance, as measured by 10% fastest MRRT (ρ = 0.32; P = .046). However, this relationship was lost in our linear regression model. In sum, these findings support a delineation of integral brain regions that may play a functional role in vigilant attention processing and implicate subcortical brain structures.
Subcortical stroke location remained a significant predictor of PVT performance on 1 out of 3 PVT parameters in our regression analysis after controlling for age, sex, and stroke volume, indicating that infarcts in a subcortical stroke brain region may be associated with increased lapses in attention and psychomotor slowing (P = 0.027). However, we did not find an association between vigilant attention, WMHs, or ischemic lesions affecting the lateral cholinergic pathways. Although regional WMH volumes have been demonstrated to be correlated with cognitive and attentional deficits in stroke patients, 36 the ARWMC, which is a visual rating scale of global WMH burden, may have been limited in its ability to detect lesion-specific deficits. Our negative findings could also be the result of low total (mean) ARWMC values because a recent study demonstrated that the PVT was sensitive to regional and global WMH changes in patients with obstructive sleep apnea who were assessed using DTI. 19 As such, we invite future studies to investigate the use of image-based quantitative markers in assessing vigilant attention in stroke patients.
Our finding that cerebrovascular disease burden affecting lateral cholinergic pathways was not associated with vigilant attention is consistent with prior work, which showed that lateral cholinergic pathway integrity may have less to do with general alertness but more to do with focused attention and related aspects of executive function.10,11 In addition, the supporting literature suggests that medial-frontal, not lateral, brain regions are responsible for energization processes that guide vigilant attention, 37 which explains our negative findings.
Consistent with previous research, 38 age was not a significant predictor of poorer PVT performance in our stroke cohort. Interestingly, sex was also not related to performance on the PVT, as has been reported by another group studying patients with daytime sleepiness. 12 Although some previous work has demonstrated the role of sex in PVT performance, these findings are likely a result of different response biases between men and women rather than differences in task aptitude. 39 Previous studies have reported that men bias toward speed, whereas women favor accuracy. 38 In addition, brain hemisphere did not play a significant role in attentional deficits in our cohort, contrary to some previous literature. 40 A meta-analysis that observed the results of 67 neuroimaging studies found that vigilant attention primarily involves corticosubcortical networks with a right lateralization, whereas the left hemisphere can be recruited when the demand for cognitive resources increases, such as “increased selection demand.” 41
The main limitation of our study is its retrospective design, which makes it difficult to determine the temporal relationship between PVT performance and onset of deficits in vigilant attention. With respect to our case series description of stroke locations in Figure 1, we were unable to perform voxel-based lesion symptom mapping (VBLSM) because of limitations imposed by inadequate sample size. We could not, therefore, determine whether the unique regions we identified in the slowest PVT performers statistically differed from the fastest PVT performers. Our small sample size limited the ability to ascertain which specific structures of the brain were affected by stroke; however, our findings are hypothesis generating and require further investigation within larger stroke cohorts. Furthermore, although ANTS is robust for intramodality and intermodality coregistration and transformation, estimations in interpolation inevitably occur when transforming native space CT and MRI 5-mm interspaced axial slices to 1-mm interspaced axial sliced template space. Nonetheless, our analysis displayed in Figure 1 represents the first case series with visual delineation of subcortical stroke locations unique to those who performed poorly on the PVT. This work invites future studies using advanced imaging techniques (such as VBLSM) to investigate the hypothesis that strokes affecting structures within subcortical regions may be responsible for impaired vigilant attention in the acute setting poststroke.
Compared with other cognitive tests, the PVT demonstrates high signal-load and interrater reliability, 13 allowing large amounts of data to be collected in a short period of time, with little to no learning curve. These characteristics increase the sensitivity of the test in detecting even miniscule changes in attention, making the PVT an appropriate and easily administered clinical tool. Vigilant attention, as measured by the PVT, has demonstrated sensitivity in a range of clinically relevant contexts, such as aerobic fitness, 42 the diagnostic workup of patients with sleeping disorders, 12 and workplace readiness. 43 Accordingly, our study suggests that the PVT may also have a role in assessing patients with stroke, where sleep-wake disorders are prevalent.
Our study suggests that those who experience cerebrovascular events in subcortical structures and/or connecting white matter tracts (such as the internal capsule and corona radiata) may be at risk of impaired vigilant attention. Identifying high-risk patients who may benefit from targeted rehabilitation programs is a major goal for physicians and rehabilitators, thereby improving patient outcomes and quality-of-life following stroke. 44
In conclusion, we demonstrate using a stroke model that optimal performance on the PVT relies on the integrity of subcortical brain structures and connecting white matter tracts. Screening for impaired psychomotor vigilance may be pertinent in this clinical setting because of its significance as an important mediator of poststroke rehabilitation. Moreover, the interdependence between vigilant attention and subcortical strokes suggests an underlying neuroanatomical basis, though confirmation in larger stroke cohorts is needed.
Footnotes
Declaration of Conflicting Interests
The authors declared no potential conflicts of interest with respect to the research, authorship, and/or publication of this article.
Funding
The authors disclosed receipt of the following financial support for the research, authorship, and/or publication of this article: During this study, Dr Boulos was supported by a Focus on Stroke 2010 Research Fellowship, which was funded by the Heart and Stroke Foundation of Canada, the Canadian Stroke Network, and the Canadian Institutes of Health Research; he was also supported by fellowship funding from the Canadian Partnership for Stroke Recovery. Dr Swartz is supported by the Heart and Stroke Foundation of Canada New Investigator Award and Barnett Award, and this work was supported by operating grant funding from the Heart and Stroke Foundation and the Canadian Institute of Health Research.