
Abstract
Background. Everyday activities for youth with cerebral palsy (CP) require muscle power, but the velocity component of muscle contraction is neglected with traditional strength training (ST). Objective. To determine whether velocity training (VT), which includes resistance training at increasingly higher velocities, would induce specific muscle adaptations not observed with ST. Methods. Sixteen ambulatory youth with CP were randomized to VT or ST. Participants trained the knee extensors 3 times per week for 24 sessions on a Biodex dynamometer. At each session, 6 sets of 5 concentric repetitions were performed either at 30 deg/s (ST group) or progressively higher velocities from 30 deg/s to 120 deg/s (VT group). Outcomes included muscle architecture, power, strength, walking speed, and functional walking performance. Results. A significant increase in rectus femoris fascicle length was observed after VT with a decrease after ST. Rectus femoris cross-sectional area increased in both groups. Both showed significant increases in isokinetic strength at all tested speeds; however, peak velocity and power improved after VT only. Self-selected and fast walking speed and functional walking performance improved after VT only. Conclusions. Muscle architecture in CP is capable of adapting differentially to the training stimulus. VT was equally effective as traditional ST in improving isokinetic strength of the knee extensors but more effective in improving velocity of movement, muscle power, and walking performance. Differences may be partially attributed to specificity of training effects on muscle architecture, such as the increase in fascicle length after VT. Strengthening interventions involving higher velocity movements should be incorporated into clinical practice.
Keywords
Introduction
Cerebral palsy (CP) is the most common motor disability originating in childhood. 1 People with motor disabilities face even greater challenges in achieving adequate levels of physical activity as compared with the general population. It is well documented that youth with CP have decreased activity levels compared with typically developing youth.2,3 Muscle weakness in CP is considered to be one of the primary impairments that causes activity limitation. In fact, weakness of the quadriceps has consistently been reported to be highly correlated with gross motor function.4,5 The quadriceps are important for ambulation and other activities of daily living, such as stair climbing. During ambulation, the quadriceps muscle group contributes substantially to hip and knee extension during single limb support and is one of the largest contributors to the vertical acceleration of the center of mass.6,7
The architecture of a muscle is the primary determinant of muscle function. 8 In normal muscle, physiological cross-sectional area (CSA) determines the capacity of the muscle to produce force and is indicative of the number of sarcomeres in parallel, although other measures of muscle size have also been shown to be predictive of force-generating capacity.9,10 In children with CP, we have previously reported that anatomic CSA of the rectus femoris (RF) and muscle thickness of the vastus lateralis (VL) and RF are decreased and are predictive of voluntary peak torque production.11,12 However, fiber length is considered to be the single most important architectural parameter. 13 Fascicle, or fiber length, is the primary determinant of the shortening velocity and excursion of a muscle and is indicative of the number of sarcomeres in series. We have also shown that RF fascicle length is decreased in youth with CP compared with typically developing youth. 11 Muscle power, as the product of force and velocity, would be adversely affected by decreases in muscle size and fascicle length, respectively, as well as by other neural factors, such as voluntary activation deficits. Our preliminary data show that average muscle power during a knee extension isokinetic test at 60 deg/s is only 18% of an age-matched, typically developing comparison group. This decrement in quadriceps muscle power was much greater than muscle strength, which has been reported to be approximately 50% of typically developing youth.14-16
Because one of the main goals of rehabilitation interventions in CP is to maintain upright ambulation, strength training (ST) of the knee and hip extensors is often advocated. However, despite modest increases in strength, there is no high-level evidence that lower extremity ST improves walking speed or other measures of functional walking capacity.17,18 One possible reason for the lack of significant improvements in ambulation in youth with CP is the focus of resistance training programs solely on improving muscle strength. Because youth with CP have difficulty producing torque at higher velocities of movement 16 and have a decreased rate of force development, 15 it would appear that progressive resistance training focusing on greater movement velocities, and thus, muscle power, would be more beneficial than traditional ST. Second, several studies included in a recent meta-analysis were not intensive enough, in that the intervention did not provide an adequate load to effect changes at the muscle level. 17 This is not surprising, given that optimal dosing guidelines (frequency, intensity, and duration) for youth with CP have not been established.
Despite previously held beliefs that muscle changes in CP are irreversible, 19 we now know that muscles are one of the most plastic tissues in the body, adapting in very specific ways to both the amount and type of stimulation imposed on them. 20 Traditional ST with high loads performed at slow and controlled movement speeds has been shown to increase muscle thickness, CSA, and fascicle angles in healthy adults.21,22 In contrast, there have been reports of increased fascicle length, in addition to muscle thickness, in response to resistance training with the concentric portion performed at higher movement velocities.23 -25 Furthermore, evidence suggests that isokinetic training performed at high velocities is superior in inducing muscle hypertrophy as compared with low-velocity training.25,26 These data support a specificity of training effect where the training stimulus was associated with increases in the corresponding muscle architectural parameters. However, it is unknown whether specificity of training principles hold true in CP.
Therefore, the purpose of this study was to investigate whether velocity training (VT), which included resistance training at increasingly higher velocities, would induce specific architectural and muscle performance adaptations not observed with traditional ST. We hypothesized that increases in muscle size and strength would occur in both the ST and VT groups in response to training. However, we hypothesized that fascicle length and muscle power would increase after VT only. A secondary aim was to determine the effects of ST and VT on walking speed and functional walking performance.
Methods
Study Population, Recruitment, and Randomization
The study was approved by the institutional review board at the Medical University of South Carolina, and written informed consent was obtained. This randomized clinical trial was registered in ClinicalTrials.gov. Criteria for inclusion were a diagnosis of CP, Gross Motor Function Classification System (GMFCS) levels I, II, and III, and age between 8 and 20 years. Participants were excluded if they had orthopedic or neurosurgery within the past year, botulinum toxin injections within the 4 months prior to the study, or moderate to severe cognitive impairment that interfered with the ability to follow and understand commands. Enrolled participants agreed not to engage in any other physical therapy treatment during the study period.
To minimize group differences in GMFCS levels and age, an adaptive treatment allocation procedure was adopted similar to other rehabilitation trials.27,28 Participants were stratified according to age (2-year age band) and individual GMFCS levels after baseline assessments were completed. Participants were then randomized to a treatment group according to a predetermined computer-generated randomization scheme. If an imbalance existed in the groups (>2 participants) according to the stratification described above, the participant was placed into the opposite group.
Interventions
Participants trained the knee extensors 3 times per week for a total of 24 sessions on a Biodex System 4 Pro dynamometer (Biodex Medical Systems, Shirley, New York). Participants were allowed between 8 and 10 weeks to complete the 24 treatment sessions to allow for unforeseen absences and vacations. A minimum of 48 hours separated treatment sessions. Each session began with a 10-minute warm-up consisting of any of the following activities, which were tailored to each participant: walking at self-selected speed, stationary cycling without resistance, and stretching. Following the warm-up, each participant performed 3 to 5 submaximal efforts followed by 6 sets of 5 concentric knee extension maximum-effort contractions. Participants were told to relax their muscles during the flexion phase of the movement. The ST group performed all repetitions at a velocity of 30 deg/s. The VT group performed 6 sets of 5 concentric exertions at 30 deg/s during week 1 (first 3 sessions). For weeks 2 through 8 (sessions 4-24), set 1 was performed at 30 deg/s and set 2 at 60 deg/s. The following 4 sets of 5 repetitions were performed at a faster speed, starting at 60 deg/s and progressing to 75 deg/s, 90 deg/s, and 120 deg/s. Thus, all participants completed 6 sets of 5 repetitions. The training velocity was increased only when the participant was able to produce torque throughout the entire range at the previous faster speed. One minute of rest was given between sets to allow the muscle to recover.
Passive/concentric mode was used to enable strengthening throughout the participants’ full range of motion. During training, all received biofeedback from the computer display based on an individually determined target. The target value was determined initially from 80% of their maximum concentric test at 30 deg/s and increased weekly to match the highest torque value achieved in the previous week. Participants were encouraged to meet or exceed the target on each repetition. Verbal instructions were to “kick as hard and fast as possible.” Participants with spastic diplegia trained both lower extremities whereas those with hemiplegia trained only the affected side.
Outcome Measures
Muscle architecture
Muscle thickness, fascicle length, and fascicle angle of the RF and VL as well as RF CSA were examined with ultrasound imaging (GE Logiq i, GE Healthcare, Chalfont St. Giles, UK) in 2D B-Mode with a 6 to 12 MHz linear array transducer. Detailed methods have been described previously. 11 Briefly, subjects were positioned supine with knees resting in full available extension. Images were taken at the midway point between the anterior superior iliac spine and the superior pole of the patella for the RF and at the midway point between the greater trochanter and lateral femoral condyle for the VL in the midsagittal plane of the muscle. These locations were marked clearly on the skin with a surgical pen. Probe orientation was transverse for calculation of CSA and longitudinal (in the plane of the fascicular path) for muscle thickness, fascicle angle, and fascicle length. Muscle thickness was measured as the perpendicular distance between the deep and superficial aponeurosis, and fascicle angle as the angle between the fascicle and the deep aponeurosis. To obtain fascicle length, the visible portion of the fascicle was measured within the image frame and the remainder was estimated as a linear continuation of the fascicle and aponeuroses in the proximal direction using digitizing software as illustrated in Figure 1 (NIH ImageJ version 1.44, National Institutes of Health, Bethesda, Maryland). To ensure accurate probe placement across repeated scans (baseline and post), acetate paper was placed over the thigh during the baseline assessment, and the probe placements, anatomic landmarks, and any other distinguishing features, such as scars or moles were marked. For the postassessment, anthropometric measurements were also taken and marked on the skin. The acetate paper was repositioned over the thigh to verify accuracy of measurements and probe placement. 29 The knee joint angle was also measured with a goniometer on the postassessment to ensure that the knee was in the same position as the preassessment. A single, experienced examiner performed all of the ultrasound assessments. However, measurements from the obtained images were performed by a separate examiner to remove any potential bias.
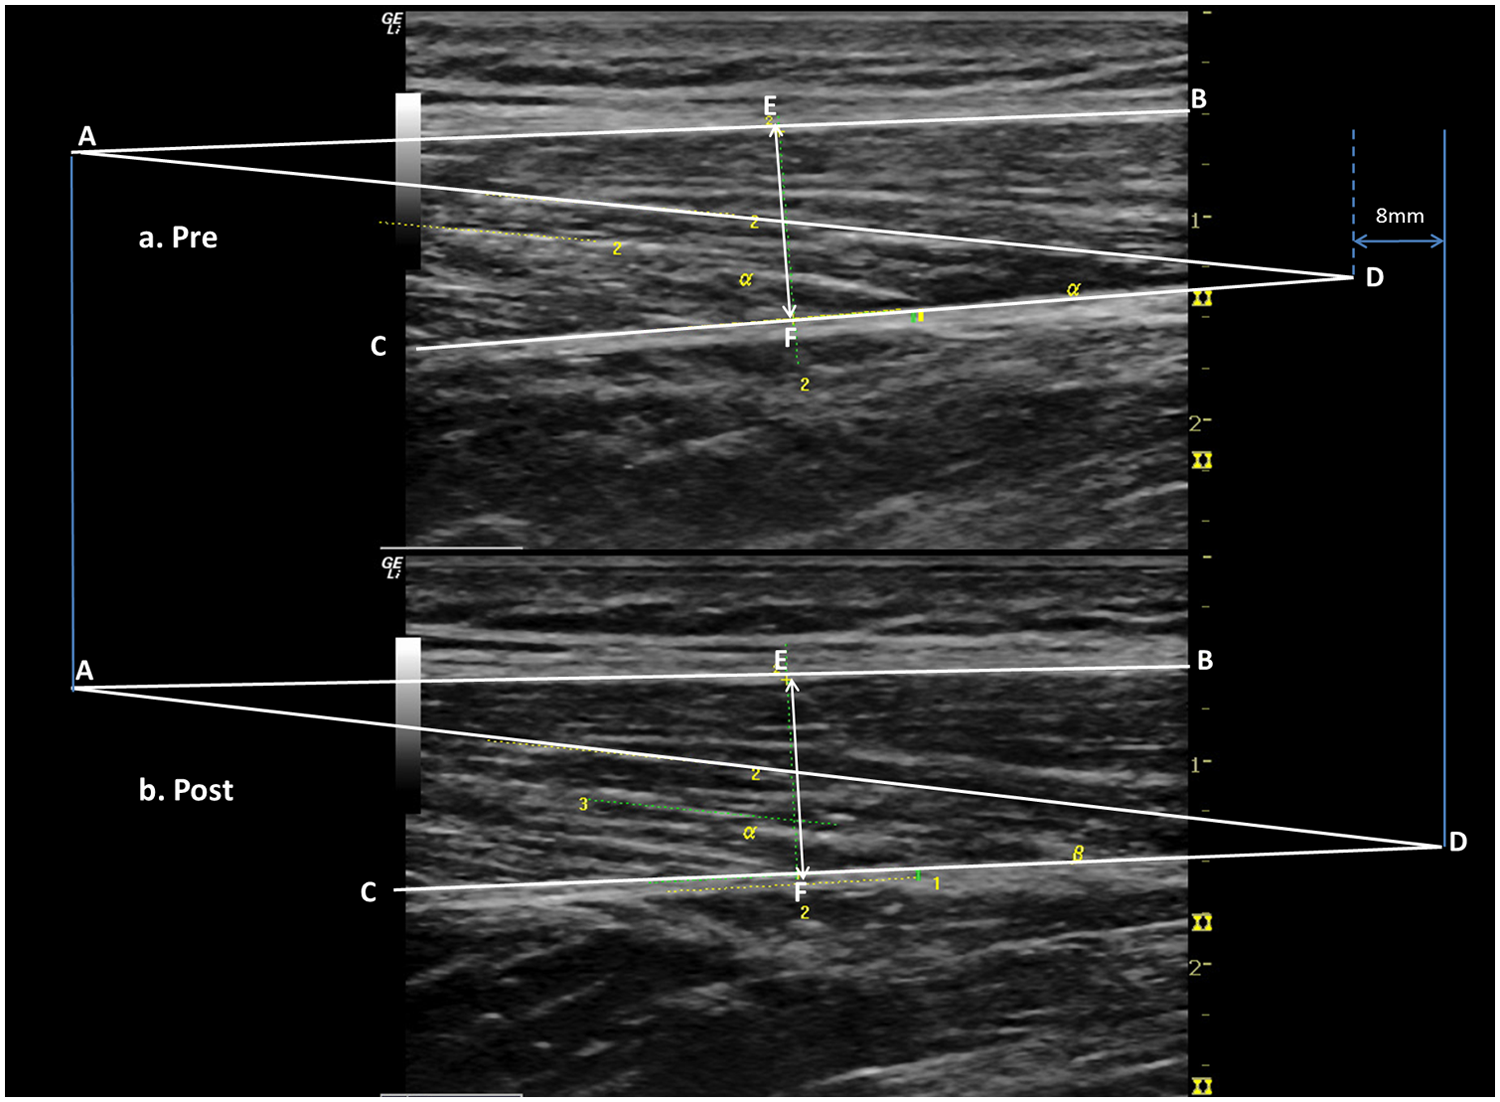
Ultrasound images of the rectus femoris preintervention (A) and postintervention (B) in one participant. Line AB represents the superficial aponeurosis. Line CD represents the deep aponeurosis. Line EF represents the measurement of muscle thickness as the perpendicular distance between lines AB and CD. Fascicle angle is measured as the angle between lines CD and AD. For fascicle length, a line of best fit was drawn along the length of a fascicle and joined lines AB and CD. In this example, fascicle length increased by 8 mm postintervention as illustrated visually in the upper right portion of the figure.
Muscle function
Each of the following assessments were administered on the Biodex System 4 Pro dynamometer with standardized positioning and set-up as described previously. 14 Two to 5 submaximal practice trials were given before each of the assessments. Knee extensor muscle strength was measured as the peak torque obtained over 3 trials during an isometric contraction with the knee flexed to 90°. Knee extensor strength was also measured isokinetically at 30 deg/s, 60 deg/s, 90 deg/s, and 120 deg/s using the passive concentric mode to test throughout the entire range of motion. Peak torque obtained over 5 repetitions per speed was used for analysis. Peak torque was gravity corrected using the Biodex system software. The change in torque–angle relationship was measured by calculating the angle of peak torque during maximal isokinetic knee extension contractions at 60 deg/s.
Peak power and peak velocity were measured in isotonic mode at a load equivalent to 20% of peak isometric torque. Isotonic contractions allow the assessment of muscle power without constraining the velocity of the movement and are believed to be more relevant to physical performance in activities of daily living. 30 Instructions were to kick (extend) the leg as fast as possible against the load when given the start signal (reference). Power was calculated every 10 ms over 5 repetitions (velocity × torque) to determine peak power.
Secondary Outcome Measures
Functional walking performance and speed
The 10-meter walk test was used to measure both self-selected and fast walking speeds over level ground. Three trials per condition were timed and averaged. 31 The timed up-and-go (TUG) test was measured and has been shown to be reliable in children and adolescents with CP. 32 For the 1-minute walk test, participants were instructed to walk as fast as possible without running or skipping, and the distance that the participant walked in 1 minute was recorded. The 1-minute walk test has been shown to be a valid test of functional ability in ambulatory children with CP. 33
Statistical Analysis
Sample size estimates were based on peak torque data from a systematic review of ST in CP 34 with an estimate of effect size of d = 1.25, when the probability of making a type I error is equal to or less than 5% (P ≤ .05). Based on the power calculations, a total sample size of 16 would provide adequate power (.80) for the anticipated differences in peak torque values.
Differences in baseline values were compared between the groups with independent t tests. For the primary outcome measures, mixed-models analyses were used to adjust for “clustering” or correlation between legs trained from the same individual. Differences between intervention groups (fixed effect) were tested using the change score (postintervention minus preintervention measures) as the dependent variable. Mixed-models analyses were also used for within-group comparisons to account for correlation between legs from the same individual and within the same leg from baseline to postintervention; differences between baseline and postintervention measures (fixed effect of time) were tested for primary outcome measures. For the secondary outcomes of functional walking performance and speed, mixed-models analyses without clustering were used for within-group comparisons (one value per subject).
Results
Characteristics of the Study Population
Figure 2 describes the recruitment and randomization process in detail. Sixteen participants were randomized to the 2 intervention groups: ST group (n = 7; 11 legs) and VT group (n = 9; 13 legs). No significant differences in baseline characteristics were found between the groups (Table 1). The mean age of participants for the VT group and ST group was 13.9 ± 2.6 and 13.7 ± 4.3 years, respectively. Four participants with spastic diplegia were in each group. Five with hemiplegia were in the VT group, and 3 with hemiplegia were in the ST group with an even distribution across GMFCS levels based on stratification procedures (ie, no group differences >2 participants per individual GMFCS levels; Table 1).
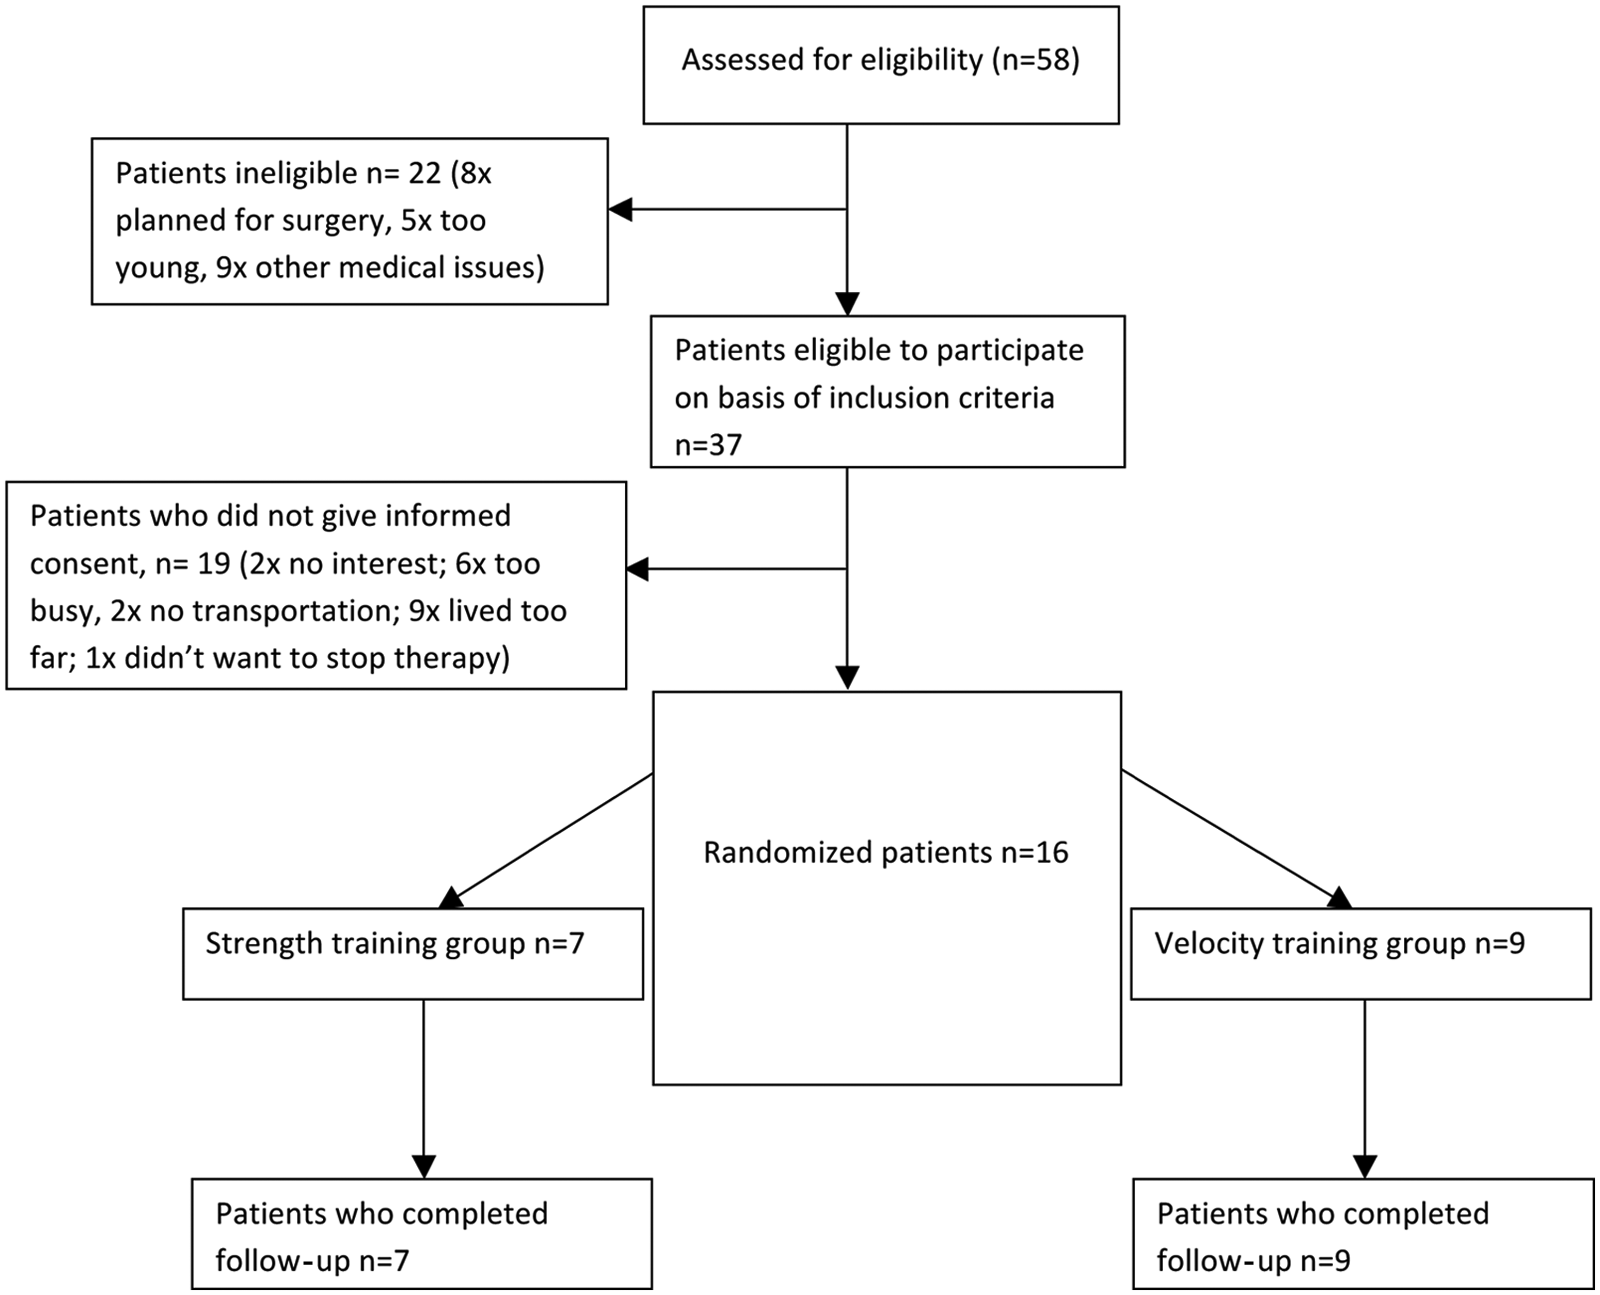
Consort flow diagram of recruitment.
Participant Characteristics
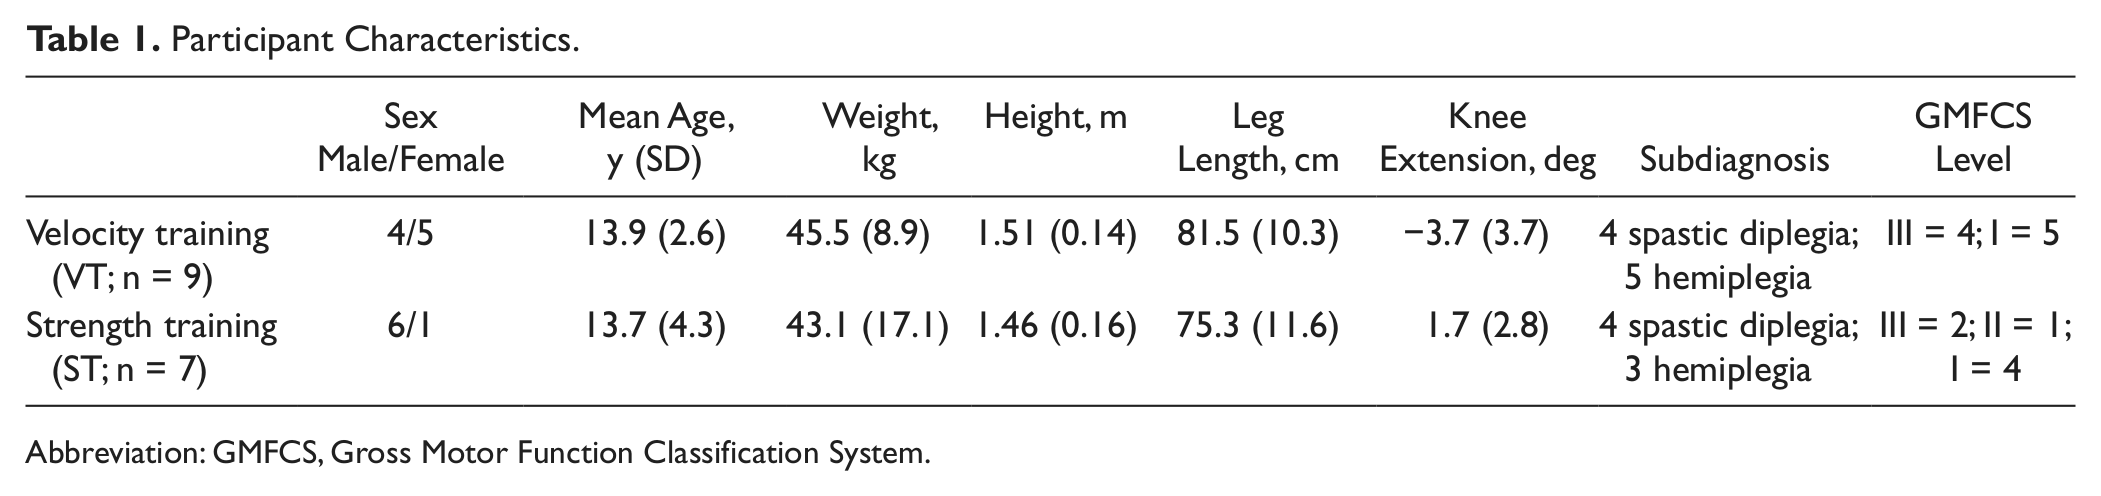
Abbreviation: GMFCS, Gross Motor Function Classification System.
Interventions
The intervention and postassessments were completed by 100% of the participants. All participants completed the 24 visits in the required time frame (mean = 9.25 ± 0.63 weeks), except for one participant who completed only 23 visits in 8.33 weeks. All the participants in the VT group reached the highest target training speed of 120 deg/s on average at session 16.3 ± 3.2, 90 deg/s at session 12.7 ± 3.3, and 75 deg/s at session 8.1 ± 1.8.
Outcome Measures
There were no significant differences between groups at baseline for any of the outcome measures.
Muscle architecture
A statistically significant difference between interventions was observed for RF fascicle length with a large effect size (d = 1.24, P = .012). RF fascicle length increased in the VT group (+1.23 cm; 95% confidence interval [CI] = 0.12-2.34, P = .044) and decreased in the ST group (−0.76 cm; 95% CI = −0.07 to −1.46, P = .049) after training as illustrated in Figure 3. Pre- and post- ultrasound images of a participant who increased fascicle length after VT are illustrated in Figure 1. Within-group comparisons revealed statistically significant increases in RF CSA for both groups (VT, +0.26 cm2, 95% CI = 0.09-0.44, P = .029; ST, +0.57 cm2, 95% CI = 0.17-0.97, P = .009). VL muscle thickness significantly increased after ST only (P = .011; Figure 3).
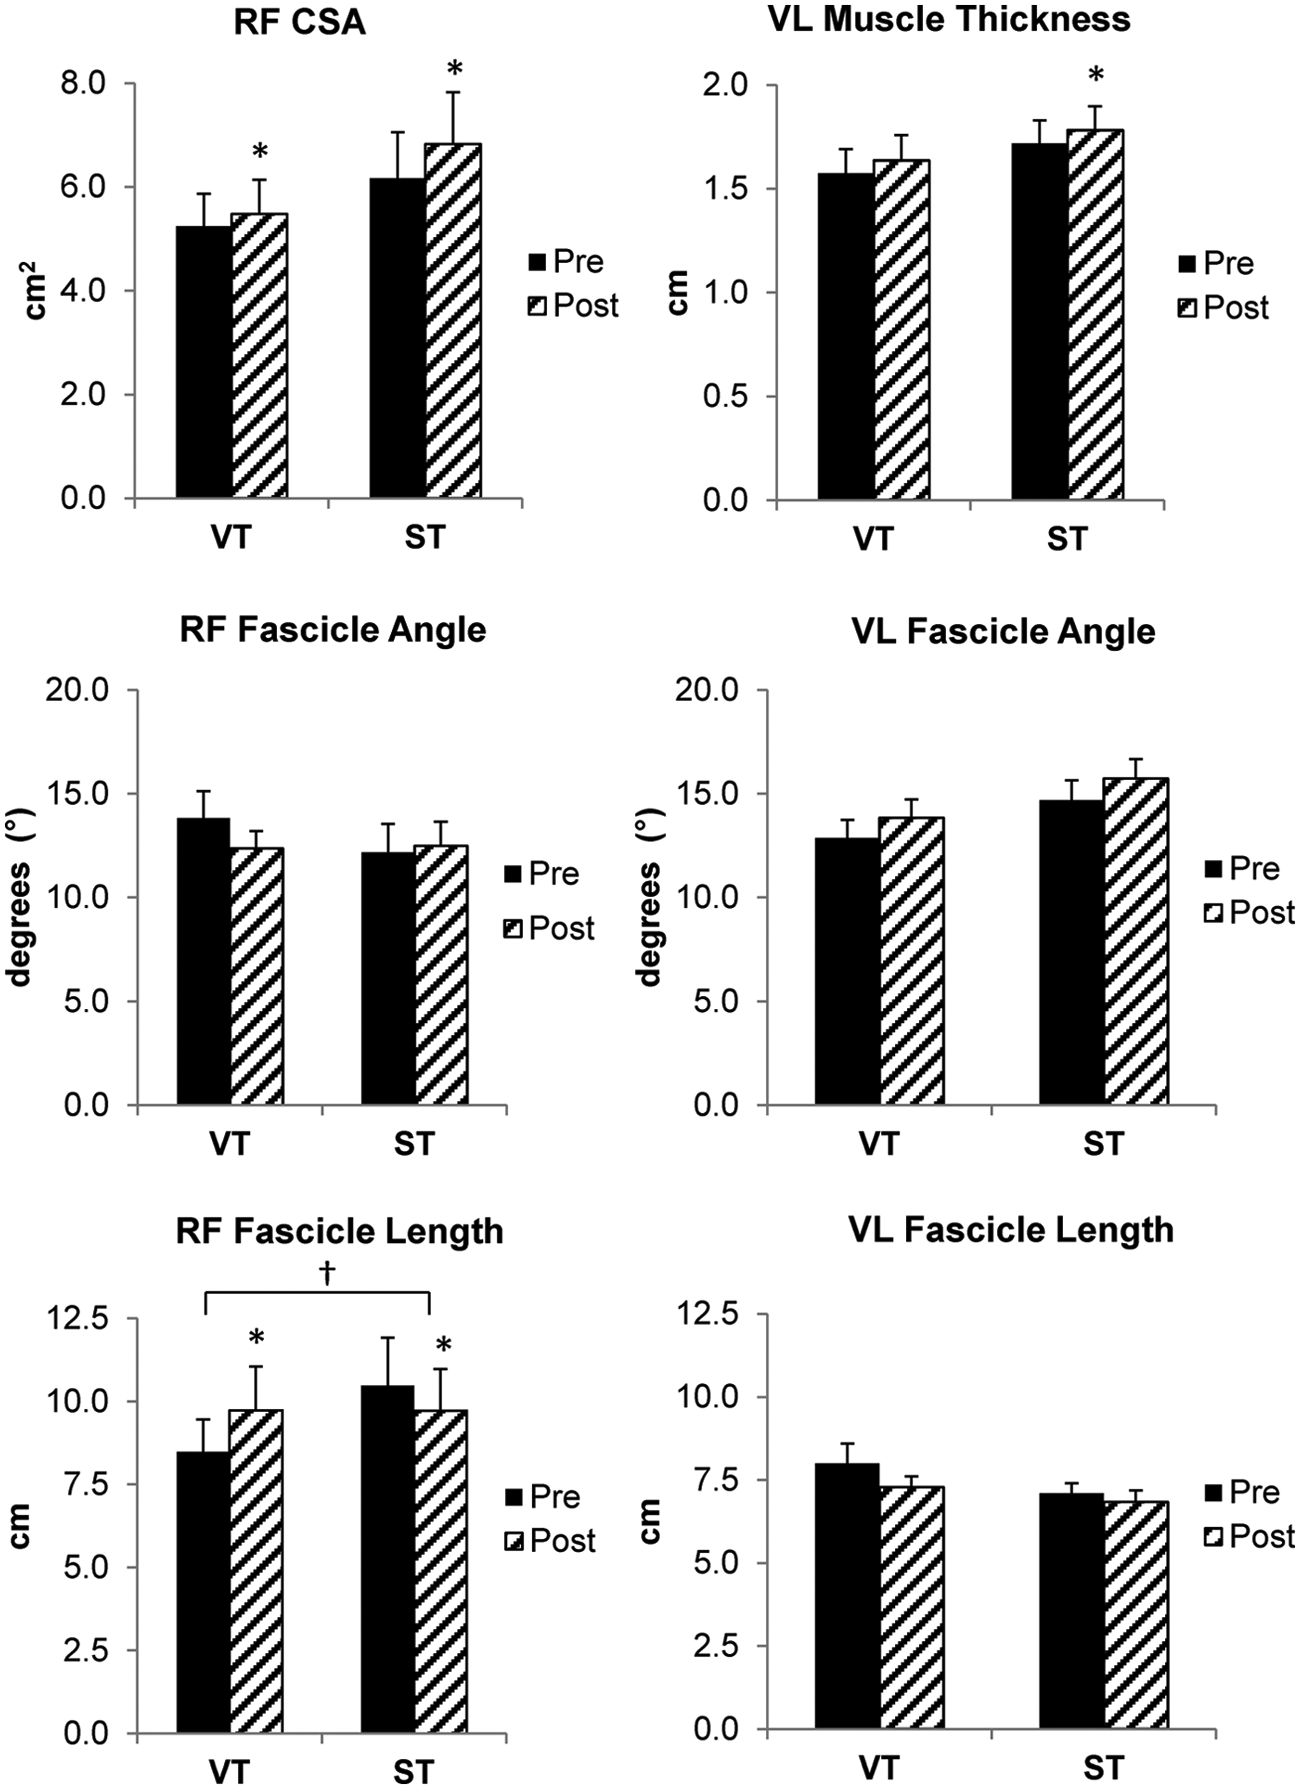
Preintervention to postintervention changes in muscle architecture of the rectus femoris (RF) and vastus lateralis (VL) for velocity training (VT) and traditional strength training (ST) groups (CSA = cross-sectional area). All values are means ± standard error. †Significant between-group differences (P < .05). *Significant within-group differences (P < .05).
Muscle function
Preintervention and postintervention results for muscle function are illustrated in Figure 4. Peak velocity improved by 16.5% in the VT group (P < .001) and decreased by 2% in the ST group (P = .408). A medium between-group effect size for peak velocity was found (d = 0.84; P = .098) favoring the VT group. Furthermore, peak power significantly increased by 64% in the VT group only (P = .023). Both groups had significant increases in peak torque at all isokinetic velocities. In contrast, isometric peak torque increased after ST only (P = .007). A shift in the torque–angle curve was noted in the VT group only with an increase in the angle of peak torque to longer muscle lengths (VT—pre, 68.8° ± 3.8°; post, 75.9° ± 2.7°; P = .029 and ST—pre, 67.9° ± 4.7°; post, 71.7° ± 2.2°, P = .277).
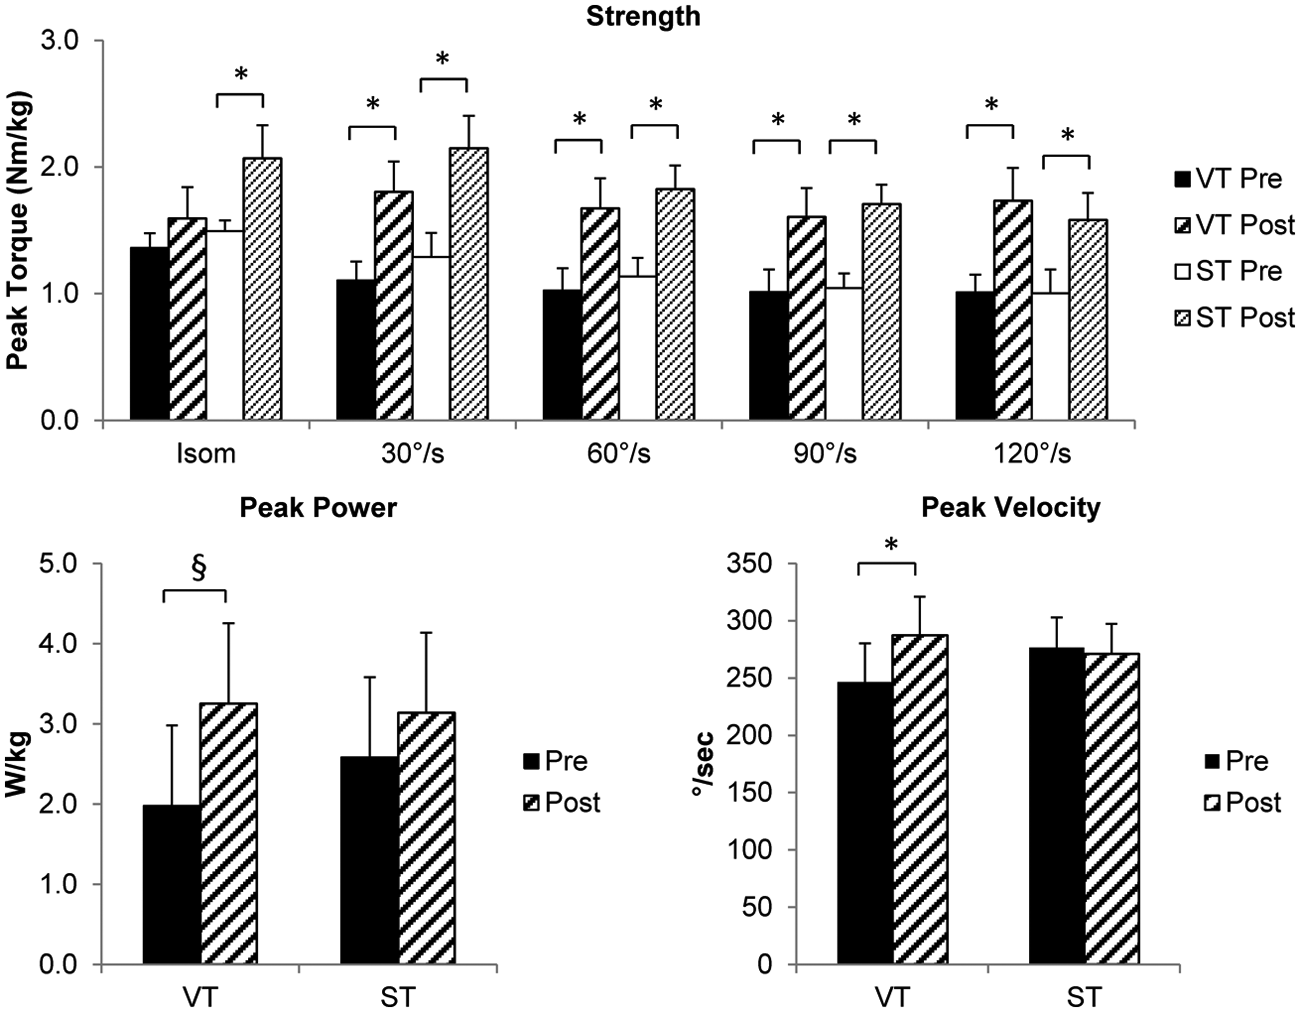
Preintervention to postintervention changes in knee extensor strength (peak torque), peak power; and peak velocity, for velocity training (VT) and traditional strength training (ST) groups. All values are means ± standard error. §Significant within-group differences (P < .01). *Significant within-group differences (P < .05).
Secondary Outcome Measures
Functional walking performance and speed
Baseline differences between groups were not statistically significant (P < .05). There were no significant improvements in the ST group. In contrast, self-selected and fast walking speeds, TUG, and 1-minute walk test all significantly improved in the VT group as illustrated in Table 2.
Pre and Post Means and SD for Gait and Functional Performance Variables
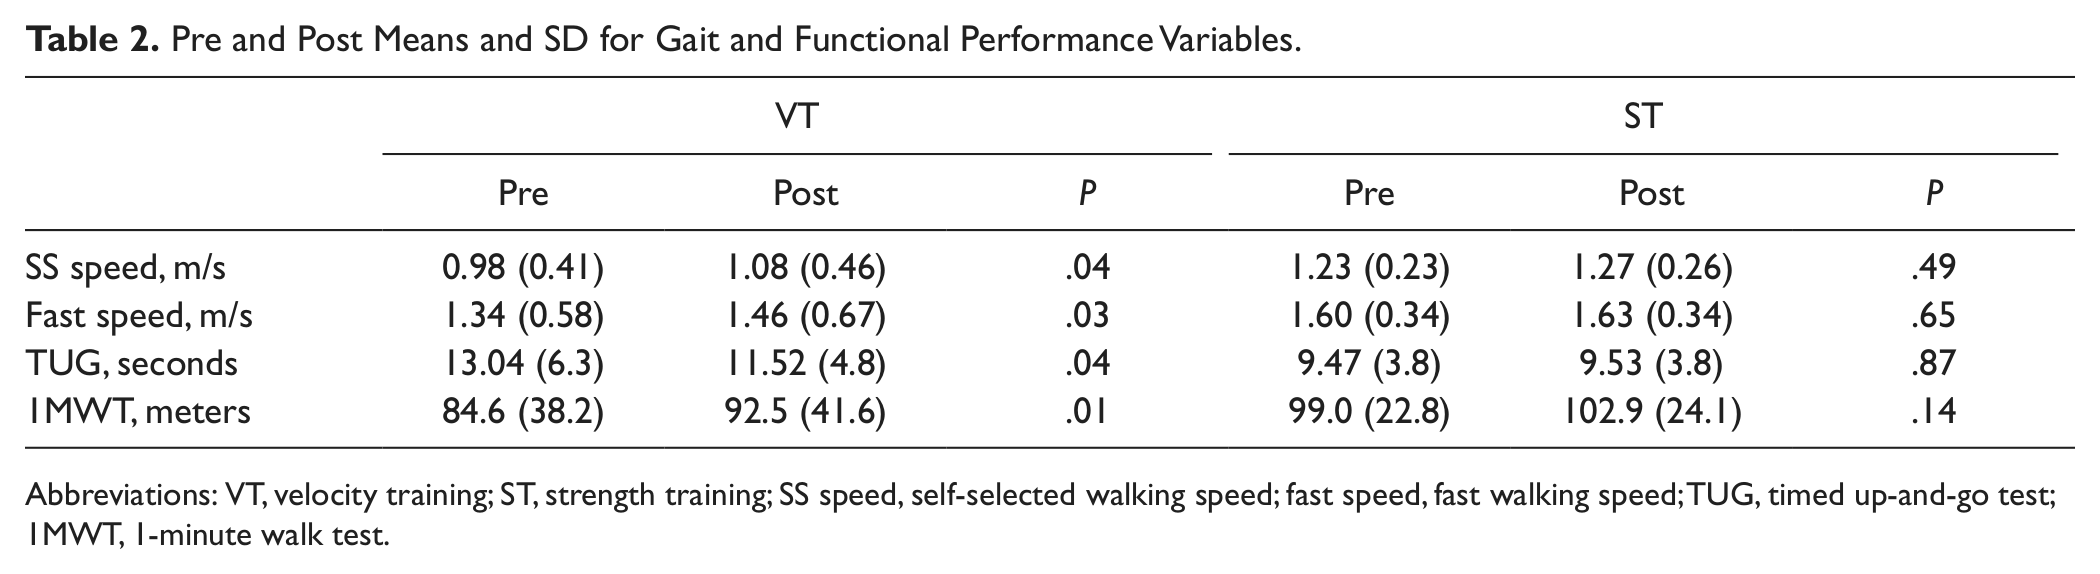
Abbreviations: VT, velocity training; ST, strength training; SS speed, self-selected walking speed; fast speed, fast walking speed; TUG, timed up-and-go test; 1MWT, 1-minute walk test.
Adverse Events
There were no serious adverse events associated with the study. One participant complained of end range knee pain during a treatment session. The range of motion was decreased, and the pain resolved.
Discussion
Differential muscle architectural and performance adaptations were observed in response to 24 sessions of ST versus VT in youth with CP. To our knowledge, this is the first study to show increases in fascicle length in CP in response to a targeted exercise intervention, such as VT. These results highlight the enormous capability of muscles in CP for muscle plasticity. Not only did muscle architectural plasticity occur in both resistance training groups, but these results support the notion that muscles in CP are capable of responding differentially to specific training stimuli.
Fascicle length is the primary determinant of muscle shortening velocity. As hypothesized, training at higher shortening velocities resulted in increases in RF fascicle length and CSA whereas ST resulted in a decrease in RF fascicle length and muscle hypertrophy. Resistance training studies between 12 and 14 weeks in duration in young and older adults have shown increases in whole quadriceps or RF CSA between 3% and 10%21,29,35 and VL muscle thickness between 7% and 12%.23,36 Our results (+4% to 6%) are in line with these studies, given that our study consisted of 24 treatment sessions, whereas the aforementioned studies reported between 33 and 42 total training sessions. The 16% increase in RF fascicle length for the VT group in this study is also comparable with other studies that used high-velocity training protocols. These studies reported increases in fascicle length between 10% and 39% for the VL and RF.23,24 We do not feel that these changes were related to a decrease in fascicle angle, as the change from pre to post for the VT group was only 1.5°, which is functionally insignificant. The ST group fascicle length decreased by 7%, which is consistent with other reports that have shown that resistance training at slow, controlled speeds results in either no change or a decrease in fascicle length.21,22 However, evidence for contraction velocity as a stimulus for increasing fascicle length requires further investigation to substantiate this claim. Other proposed stimuli for increases in fascicle length are eccentric/lengthening contractions and muscle excursion range or stretch.37-39 However, eccentric contractions were not performed in this study, and all participants exercised through their available range of motion. Therefore, the training velocity appears to be the primary factor that explains the differential adaptations between the 2 training groups.
The effect of an increase in fascicle or fiber length is an increase in the maximum contraction velocity of the muscle; and for an equivalent absolute velocity, a muscle with longer fibers will generate a higher force (see Lieber and Friden, 8 Figure 9B, for a review). These results suggest that increases in RF fascicle length and CSA after VT translated into significant improvements in peak movement velocity and peak torque. Therefore, muscle power, as the product of torque and velocity, significantly improved after VT only. Peak torque during isokinetic testing increased in both groups but only peak velocity increased after VT, suggesting that the increase in peak velocity was the primary factor responsible for the increase in muscle power after VT (Figure 4). Surprisingly, a specificity of training effect for peak torque was not observed. Rather, peak torque increased at all tested isokinetic velocities regardless of whether participants trained at slow (ST) or faster (VT) movement speeds. However, isometric torque significantly increased after ST only, highlighting the specificity of training effect of ST on muscle size.
Another effect of an increase in fascicle length is to increase the active muscle range of the length–tension relationship. 8 The increase in the angle of peak torque (ie, greater knee flexion) in the VT group and resultant shift in the torque angle curve to longer muscle lengths consistent with an increase in fascicle length. A limitation of noninvasive measures of fascicle length, such as obtained with ultrasound imaging, is the inability to measure actual sarcomere length. Therefore, an increase in fascicle length only infers that sarcomeres have increased in series.
Although muscle architectural adaptations were the subject of this investigation, we posit that the combined effect of muscle architectural and neural adaptations to resistance training contributed to the observed changes in muscle strength and power. Neural adaptations to resistance training include increases in motor unit recruitment and firing rates, among others. 40 Although it is currently believed that strength gains in prepubertal and postpubertal children are primarily because of neural changes,41,42 we show here that muscle architectural adaptations in these children with CP occur to a similar degree as young and older adults in response to resistance training.
Interestingly, there was a differential adaptation between muscle groups where only RF fascicle length was altered in response to training. A previous report showed that fascicle length was shorter in the VL as compared with the RF in TD children. 11 This is also the case in this study, where VL fascicle length is shorter than RF fascicle length. One hypothesis is that in CP, the RF is predisposed to adapt to the velocity stimulus because of its longer length and greater excursion capacity. In fact, fascicle length of the RF adapted to both resistance training interventions but in opposite directions (increased in the VT group, decreased in the ST group).
Muscle power has been shown to be a more important muscle performance indicator than strength and a better predictor of physical function and mobility, particularly in older adults.43,44 Therefore, it is currently recommended that resistance training programs designed for older adults should focus on improving muscle power, rather than muscle strength. 43 Perhaps, the lack of improvement in functional walking performance and walking speed in the ST group was because of the inability of the training stimulus to specifically target muscle power. The lack of significant improvements in walking, activity, and participation as a result of ST interventions in CP has been previously well documented in recent systematic reviews.17,45 Limitations of several studies reviewed include inadequate intensity and duration of the strength-training interventions. In our study, both groups trained at an appropriate intensity, volume, frequency, and duration according to the American Academy of Pediatrics and National Strength and Conditioning Association position statement papers for youth resistance training.46,47 The only difference between the 2 interventions was the velocity of training. Training with higher velocity, maximum-effort muscle contractions in the VT group resulted not only in statistically significant, but also clinically meaningful changes in both self-selected and fast walking speeds that met or exceeded the minimal clinically important difference of 0.1 m/s for gait speed in CP 48 (change [post − pre]: self-selected = 0.10 m/s; fast = 0.12 m/s). Furthermore, significant gains were made after VT in functional walking performance as measured by the TUG and 1-minute walk test. Similar to the results of the meta-analyses, traditional ST resulted in strength gains that did not translate into improvements in activity limitations related to walking.
Clinical Significance
Muscle power is an important component of muscle performance that is often neglected in rehabilitative interventions, despite the fact that children with CP have deficits in both strength and in the production of higher velocity movements (ie, muscle power). The results of this randomized clinical trial suggest that strengthening interventions involving higher velocity movements, such as VT or power training, of sufficient intensity and volume (max effort; 6 sets of 5 repetitions), frequency (2-3 times per week), and duration (8-10 weeks) are effective in improving muscle power and thus, functional walking performance in youth with CP. The results also suggest the importance of targeting the quadriceps, in particular, for improved walking performance and speed. Optimal dosing or training parameters for resistance training in youth with CP have not been established so the parameters used in this study may serve as an initial guideline for velocity or power training in this population. One of the most important training principles underlying velocity or power training is that the concentric portion of the movement be performed at a fast movement speed, which also increases the intent or sense of effort required. 49 Thus, the training principles underlying VT can be easily incorporated into clinical practice by following these guidelines along with an appropriate intensity, frequency, and duration.
Limitations
Limitations are that we did not measure neural adaptations in response to the training regimes, and therefore, we can only hypothesize that neural adaptations played a role in the results reported here. Second, the examiners were not blinded to group assignment. Last, muscle architecture was only examined in the midsection of both muscles. Therefore, we cannot rule out that other adaptations may have taken place along the length of the muscle.
Conclusions
Muscle architecture in CP is highly plastic and is capable of responding differentially to the type of training stimulus. As hypothesized, training at higher shortening velocities resulted in increases in fascicle length and CSA whereas ST resulted in increases in muscle size only. Furthermore, the relative magnitude of muscle architectural adaptations was similar to that in adults undergoing resistance training protocols. Collectively, these results suggest that VT is equally effective as traditional ST in improving isokinetic strength of the knee extensors but more effective in improving velocity of movement, muscle power, walking speed, and functional walking performance. Therefore, strengthening interventions involving higher velocity movements, such as VT or power training, should be incorporated into everyday clinical practice for youth with CP.
Footnotes
Acknowledgements
The authors thank Dr Diane Damiano and Dr Sharlene Teefey for their mentorship in this project.
Declaration of Conflicting Interests
The authors declared no potential conflicts of interest with respect to the research, authorship, and/or publication of this article.
Funding
The authors disclosed receipt of the following financial support for the research, authorship, and/or publication of this article: This study was funded by the Thrasher Research Fund and the Pedal-with-Pete foundation.