
Abstract
Background. Robot-assisted training may improve motor function in some hemiparetic patients after stroke, but no physiological predictor of rehabilitation progress is reliable. Resting state functional magnetic resonance imaging (RS-fMRI) may serve as a method to assess and predict changes in the motor network. Objective. The authors examined the effects of upper-extremity robot-assisted rehabilitation (MANUS) versus an electroencephalography-based brain computer interface setup with motor imagery (MI EEG-BCI) and compared pretreatment and posttreatment RS-fMRI. Methods. In all, 9 adults with upper-extremity paresis were trained for 4 weeks with a MANUS shoulder-elbow robotic rehabilitation paradigm. In 3 participants, robot-assisted movement began if no voluntary movement was initiated within 2 s. In 6 participants, MI-BCI–based movement was initiated if motor imagery was detected. RS-fMRI and Fugl-Meyer (FM) upper-extremity motor score were assessed before and after training. Results. The individual gain in FM scores over 12 weeks could be predicted from functional connectivity changes (FCCs) based on the pre-post differences in RS-fMRI measurements. Both the FM gain and FCC were numerically higher in the MI-BCI group. Increases in FC of the supplementary motor area, the contralesional and ipsilesional motor cortex, and parts of the visuospatial system with mostly association cortex regions and the cerebellum correlated with individual upper-extremity function improvement. Conclusion. FCC may predict the steepness of individual motor gains. Future training could therefore focus on directly inducing these beneficial increases in FC. Evaluation of the treatment groups suggests that MI is a potential facilitator of such neuroplasticity.
Keywords
Introduction
Electroencephalography-based brain computer interfaces (EEG-BCIs)—particularly with paradigms including motor imagery (MI)—have recently been proposed as therapeutic interventions for people with hemiparetic stroke.1,2 Such approaches target the connectivity of the brain systems involved in the execution of a movement that has been diminished by the stroke. 3
Patients using EEG-BCIs volitionally generate patterns of brain activity that are detected by the BCI and translated into movement of the paretic limb by external effectors, thereby bridging the disconnection between intention to move and execution. Neural processes are stimulated that are intended to recombine the willful intention of the patient to move a paretic limb and the perceived afferent sensory input. Sensory input is generated by a robot orthosis moving that limb. To ensure a close temporal association of the intention to move with the movement executed by a robot, EEG-BCI systems such as those used in this study adopt a 2-stage strategy.4,5 In the first stage, the system is calibrated by asking the patient to imagine the movement and by saving the associated patterns of activation. In a second step of the actual training, a patient imagines the movement of the paretic limb, the pattern of activation is recognized, and the movement is instantly executed by the robot. Although such systems are beginning to be used in clinical and research contexts, there is a lack of comprehensive evidence for their efficacy and mechanisms of action.
Using resting state functional magnetic resonance imaging (RS-fMRI), we can identify connectivity traits of the individual brain, presumably related to neural cooperation at rest. 6 This is possible by analyzing the activity, spatial extent, and integrity of common functional connectivity (FC) networks, such as the default brain mode network 7 or the sensorimotor network. Although there is ongoing discussion about the nature of RS-fMRI functional connectivity,8-10 recently published studies have demonstrated an association between RS networks and stages of brain maturation, 11 cognitive functioning, 12 dementia, 8 and reorganizational processes occurring in the brain during poststroke motor recovery.13,14 The analysis of RS-fMRI data promises to become a significant clinical diagnostic tool for tracking degenerative processes or progress in rehabilitation.
In the framework of a larger clinical study 4 investigating the effects of MI-BCI for upper-limb robotic rehabilitation compared with standard robotic rehabilitation, 2 subgroups of participants (6:3) were measured before and after training with MI-BCI and standard robotic rehabilitation, respectively, using RS-fMRI. We hypothesized that behavioral improvements across groups would reflect in changes of the RS-FC profile of the main motor networks and that treatment groups would differ in terms of the magnitude of such changes, in the sense that the MI-BCI intervention elicits stronger effects, both behaviorally and on a neural level.
Methods
Sample Group
Participants met the following criteria: first-ever ischemic or hemorrhagic stroke diagnosed by CT or MRI brain imaging and more than 1 month postonset, age 21 to 65 years, Fugl-Meyer (FM) motor assessment score of the affected upper limb from 0 to 45 at screening. We chose participants with moderate and severe arm paresis, a group that may have suboptimal results with traditional rehabilitation. Further information on inclusion criteria and all exclusion criteria can be found in the Supplementary Information S1. Each participant’s T1 image is shown in Supplementary Figure 1. Stroke location in the sample encompassed mainly subcortical sites around the basal ganglia. The study was approved by the local ethics committee.
Training
One group of participants carried out MANUS robotic rehabilitation. 15 The patients in the MI-BCI group used a rehabilitation protocol exploiting synergy effects from the combination of an EEG-based MI-BCI with a MANUS robot.4,5
In the MANUS-only group, participants moved the impaired shoulder and elbow muscles toward the goal displayed on the video screen, with their impaired limb being strapped to the robot end-effector. 15 If they were unable to perform the motor task, the robot assisted the movement after a predefined 2 s delay after the onset of the screen’s visual cue. If participants were unable to initiate the motor task, the robot did not assist movement. 16 Patients in the MANUS-only group were not instructed to imagine movements. In the MI-BCI group, the MANUS robot was connected to an EEG-based MI-BCI. Here, the training contained 2 phases, a calibration phase and a rehabilitation phase, as illustrated in Figure 1.
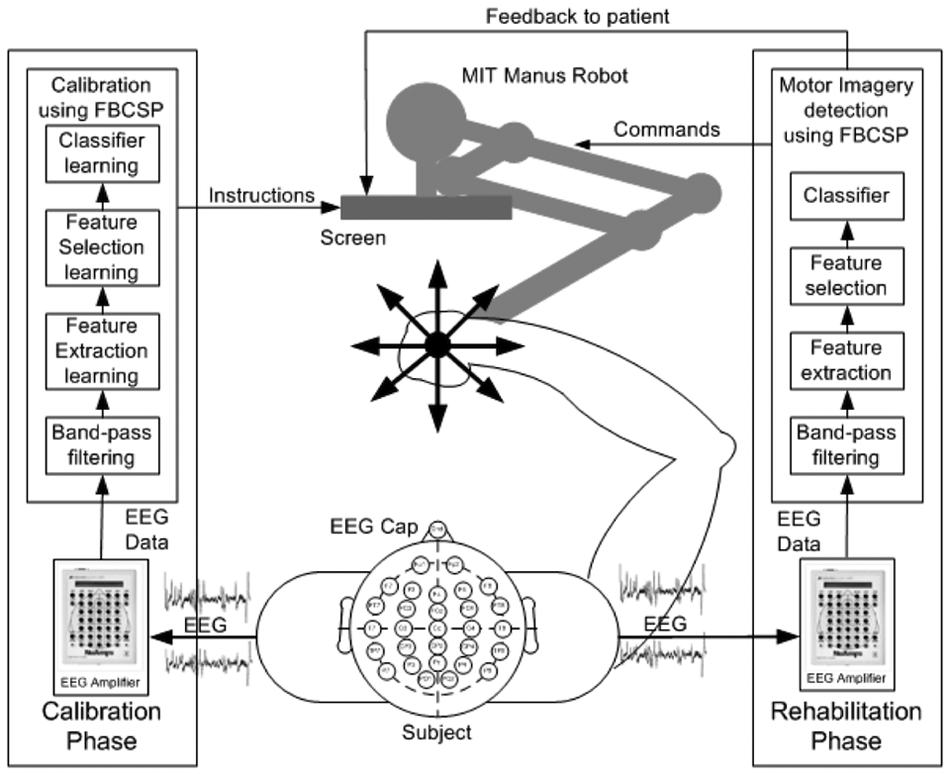
Architecture of MI-based brain-computer interface (MI-BCI) for upper-limb robotic rehabilitation. Abbreviation: FBCSP, filter bank common spatial pattern; MI, motor imagery; BCI, brain-computer interface.
In the calibration phase, the patient’s impaired upper limb was strapped to the MANUS robot. A visual cue appearing on the screen instructed the patient to perform MI or to rest. During the calibration, 160 trials (each lasting approximately 12 s) of EEG data were collected from 4 sessions that comprised 80 MI trials of the stroke-affected upper limb and 80 rest trials. The EEG data were collected using a 27-channel Nuamps acquisition system (http://www.neuroscan.com) sampled at 250 Hz. The data collected in the calibration phase were subsequently used for constructing a subject-specific MI detection model by using the filter bank common spatial pattern algorithm. 17 In the rehabilitation phase, the patient performed MI for 4 s after the onset of the visual cue. If MI was detected, a movement feedback was provided by the MANUS robot in moving the stroke-affected limb toward the goal displayed on the screen.
All patients (both MANUS-only group and MI-BCI group) completed 12 rehabilitation sessions in approximately 1 month. In the MANUS group, patients performed 960 fixed movements of the impaired limb, whereas the number of movements were variable in the MI-BCI group because of the different protocols used. The main difference between the MANUS robotic rehabilitation protocol and the MI-BCI–based robotic rehabilitation was that the former initiated robot-assisted movement if no movement was detected after a predefined period of 2 s, whereas the latter only initiated robot-assisted movement if actual voluntary motor intent was detected.
RS-fMRI Data Acquisition
RS-fMRI data of each participant was collected at 6.33 (average, M) ± 6.98 (standard deviation, SD) days before start of training (pre–time point, TP1) and 12.33 ± 6.10 days after the end of training (post–time point, TP2). For each measurement, participants were instructed to remain relaxed and awake with their eyes closed and not to engage in any specific activity. Each RS-fMRI session consisted of a 10-minute block (400 volumes, 28 slices, 3 × 3 × 4 mm3 voxels, 0.4 mm slice gap, TR = 1.5 s, TE = 30 ms, interleaved-ascending acquisition) and was performed in a Siemens Magnetom Trio Tim syngo MR B15 scanner.
Functional Motor Gain
FM scores were recorded for each participant at 0, 2, 4, and 12 weeks after beginning of training by an occupational therapist (Table 1). By fitting a line to the FM data of each participant, an indicator of individual gain steepness was derived. The steepness of each fitted line represented the relative decrease in impairment (Figure 2). Because of the incorporation of an 8-week, posttraining follow-up measurement (12 weeks after beginning), out-of-lab effects were included in the behavioral assessment, thus reflecting the steepness of general recovery during and after treatment. The individual gain values were used as criteria in the subsequent regressions.
Participant Data, Including Oxford Classification of Stroke a
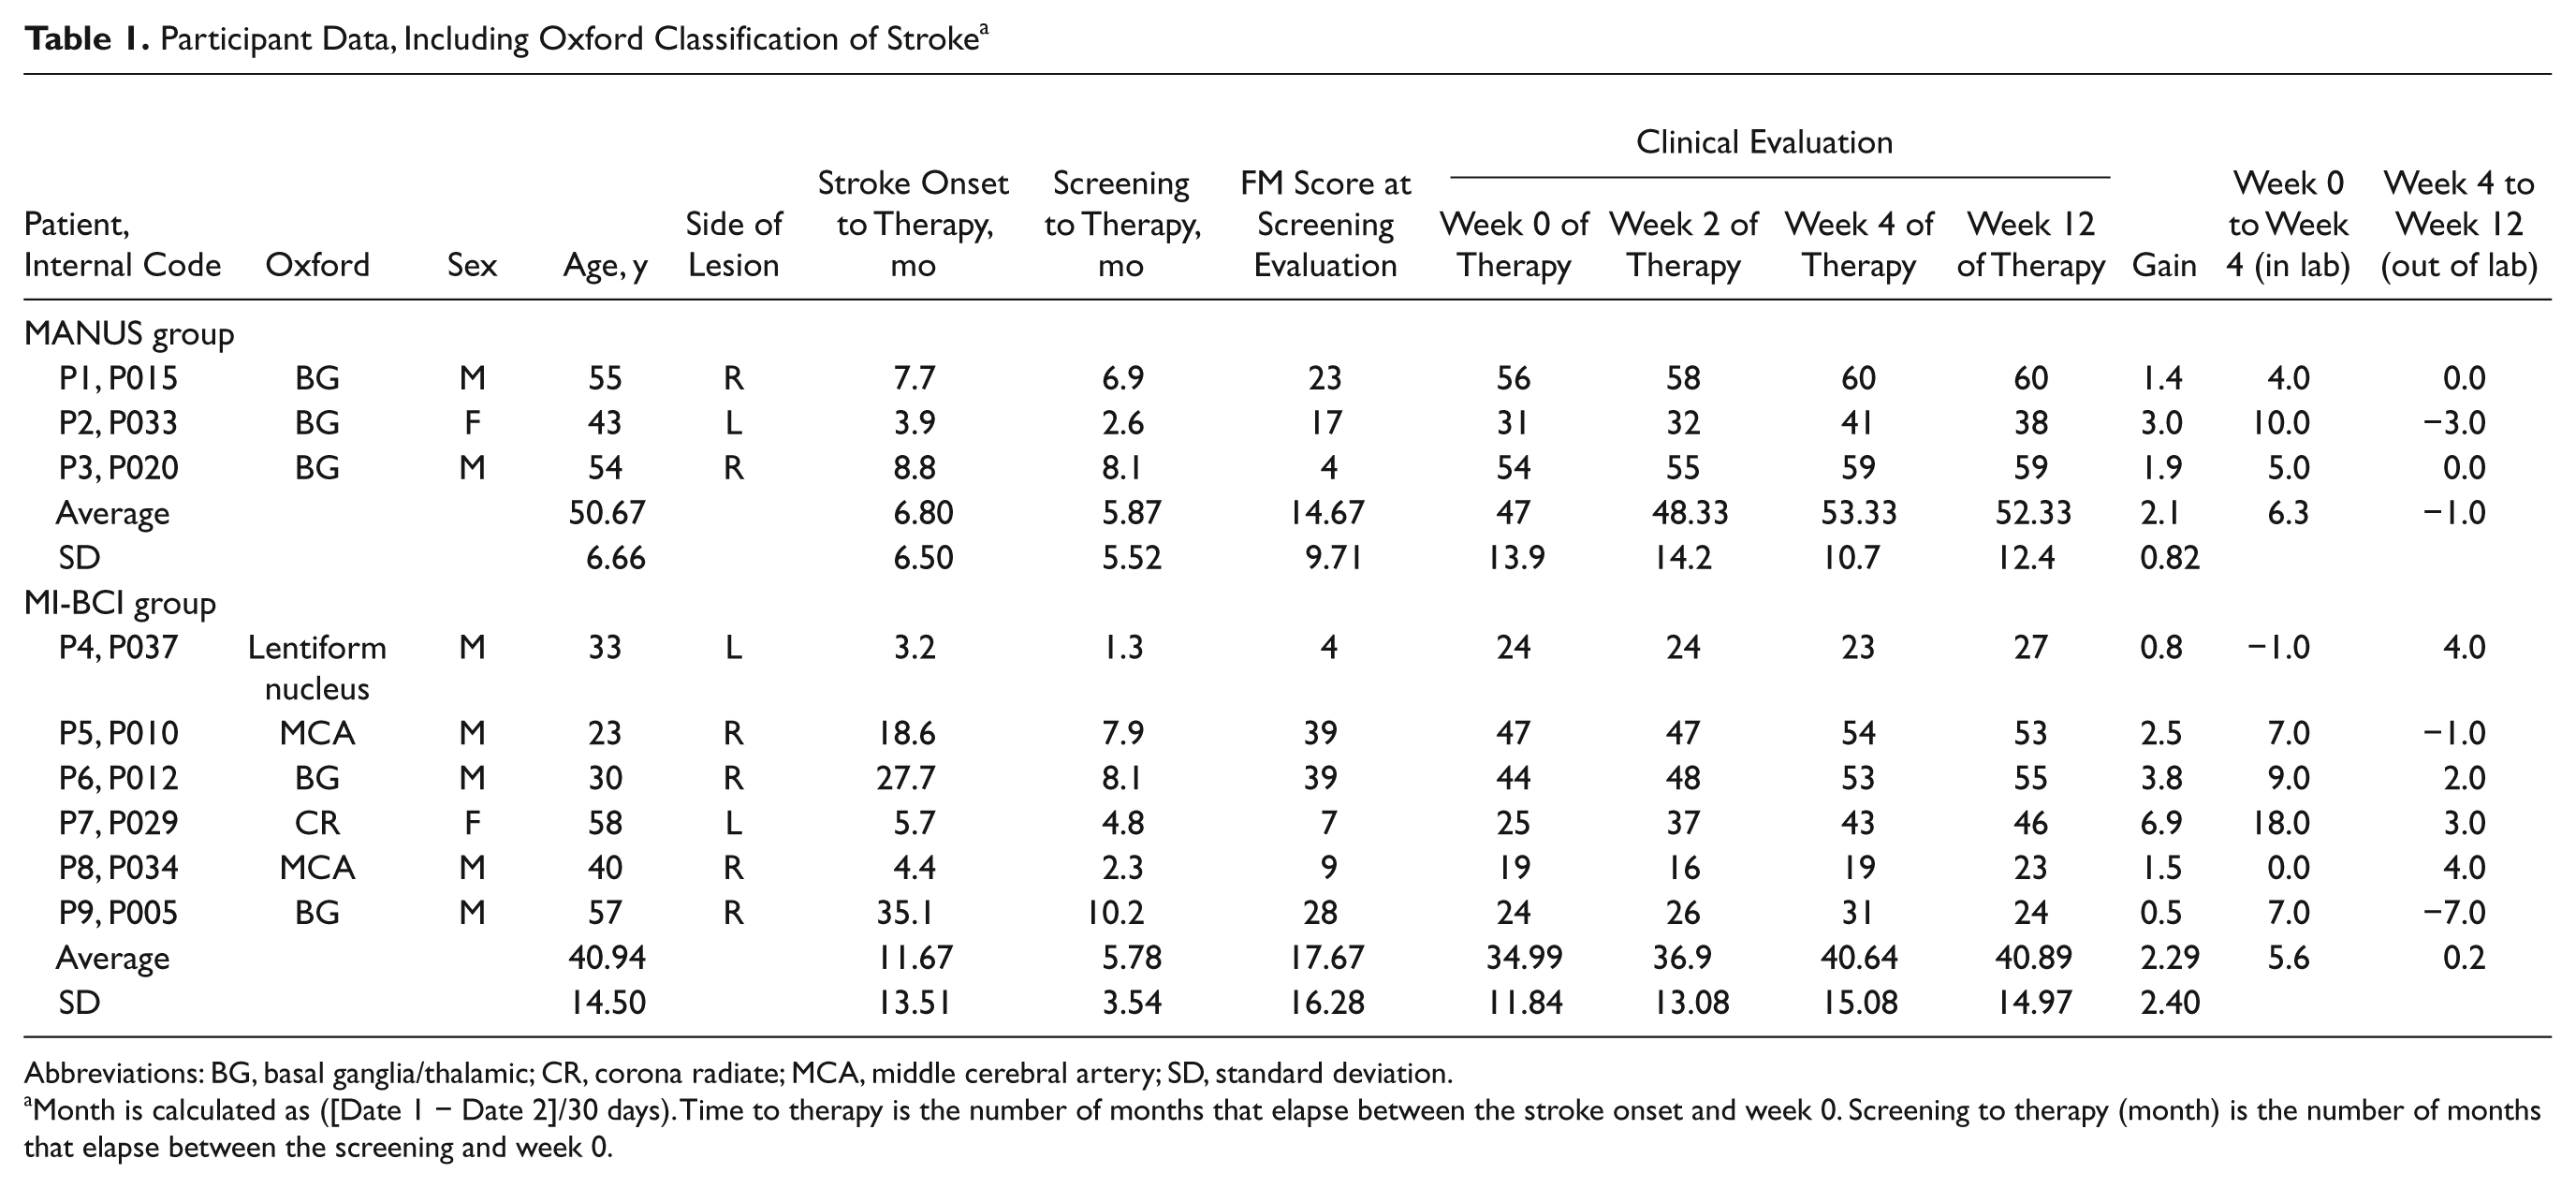
Abbreviations: BG, basal ganglia/thalamic; CR, corona radiate; MCA, middle cerebral artery; SD, standard deviation.
Month is calculated as ([Date 1 − Date 2]/30 days). Time to therapy is the number of months that elapse between the stroke onset and week 0. Screening to therapy (month) is the number of months that elapse between the screening and week 0.
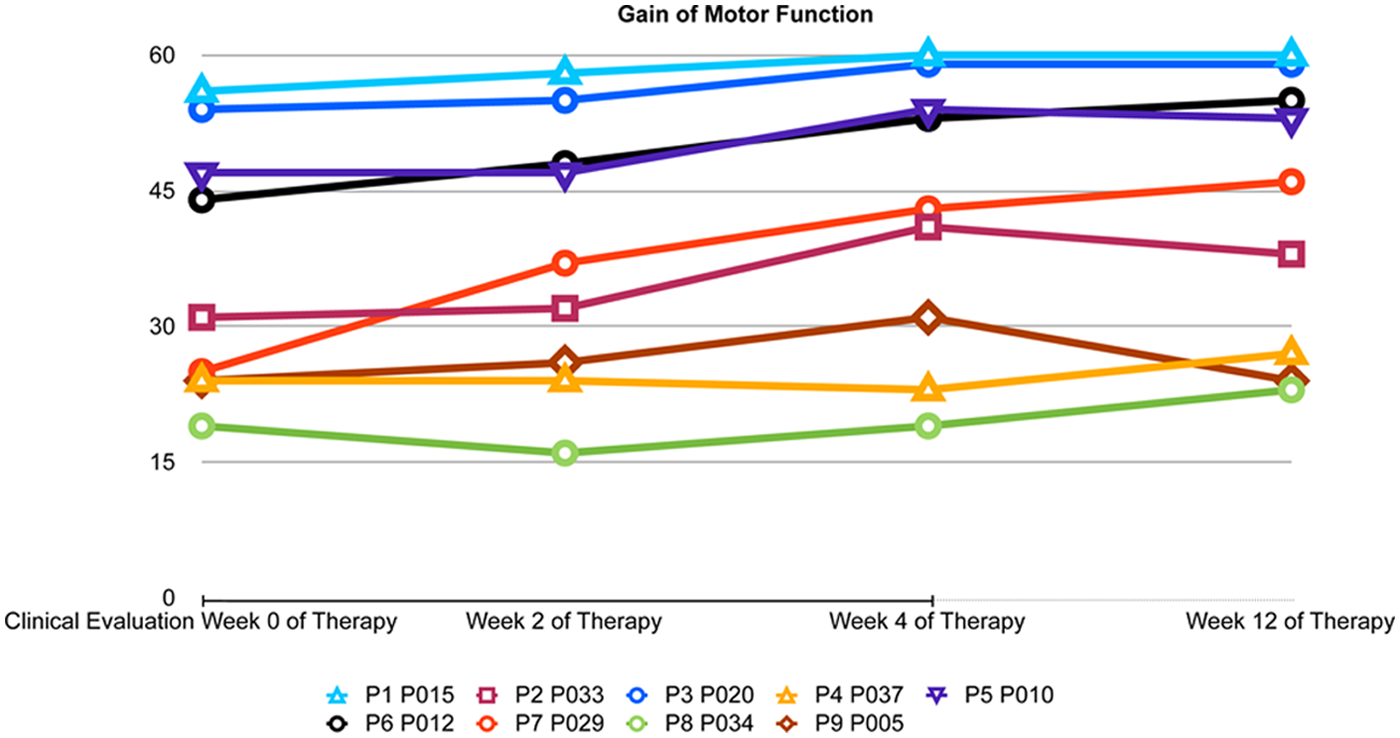
Gain of motor function in all participants over the 4 measurement time points.
Data Preprocessing
Functional images were preprocessed using SPM8 (Wellcome Trust Centre for Neuroimaging, London). Slice time correction was performed to middle slice, realignment with fourth-degree B-spline interpolation, normalization to Montreal Neurological Institute space, and smoothing with an 8-mm fixed width half-maximum kernel. For participants (3 out of 9) with left-hemispheric damage, all functional images were L/R (left/right) flipped before performing independent component analysis (ICA).
The RS-fMRI time series (9 participants, 2 sessions per participant), recorded before (TP1) and after the training (TP2), were included into one group ICA step using the 1.3d version GIFT-ICA toolbox (main developer Calhoun & Adali, supported by NIH grant 1RO1EB000840, USA). 18 The number of independent components (ICs) was calculated using the minimum description length criterion and was found to be 19. For estimation, the ICASSO approach19,20 was selected to ensure the validity and stability of the derived components (run 10 times, with both “randinit” and “bootstrap”) and component stability ranged above 0.9 for all used ICs. More information on group ICA details can be found in the Supplementary Information S2. After completion of the group ICA calculation, the derived z-scored FC (IC) maps were used to form FC change (FCC) images by using the image-calc function of SPM8 and substracting for each participant and component the IC images of TP1 from the IC images of TP2. Thus, positive values denoted increases of FC with the component functional centers (eg, in a default brain mode–DMN–component, these are the posterior cingulate, medial prefrontal cortex, etc) in a given voxel, and negative values indicated decreases of FC. Depending on the IC and the center(s) of the component, these maps represented changes in FC in a region (the center of the component, for example, the supplementary motor area–SMA) or network (eg, DMN) of the brain. Although such maps might be similar to a correlation map acquired by correlating the activations at every voxel of the brain with the activations at a given seed region, IC maps show general covariation over the brain within a particular functional network. FCCs might reflect reorganizational processes that have occurred in between the measurements or minor fluctuations in measurement or estimation accuracy. All FCC images were thresholded (FCCs that did not exceed 0.5 in absolute value were set to zero) to ensure that only substantial FCCs beyond minor fluctuations were used. The resulting FCC images of these components were used as predictors in the subsequent regressions. From the 19 identified components, we selected 4 components that corresponded to FC networks of the motor system by comparing them with FC templates and inspecting them for spatial and spectral noise characteristics. The component centers were located in the contralesional motor cortex, ipsilesional motor cortex, SMA and the visuospatial system–which includes the bilateral parietal cortex and posterior midline region (Figure 3).
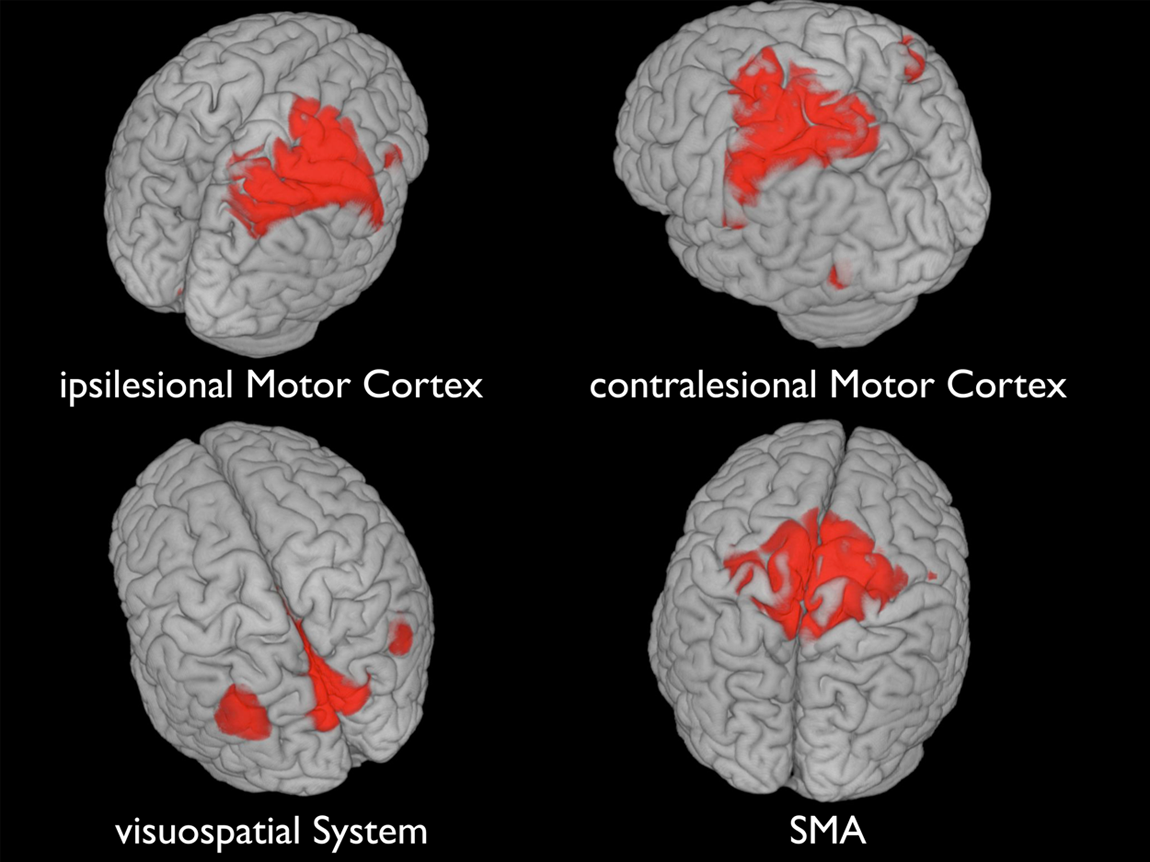
The 4 main components of the motor systems, as derived with ICA; red coloring indicates the IC centers. Abbreviations: IC, independent component; SMA, supplementary motor area; FCC, functional connectivity change.
Linear Regression
We used an in-house Matlab script to perform linear regression with leave-one-out cross-validation. In this approach, the values of each observation (in our case, each participant’s FCC map) in each voxel were used to predict the corresponding criteria values (Figure 4). Prior to this step, predictor and criteria values were z-scored for normalization.
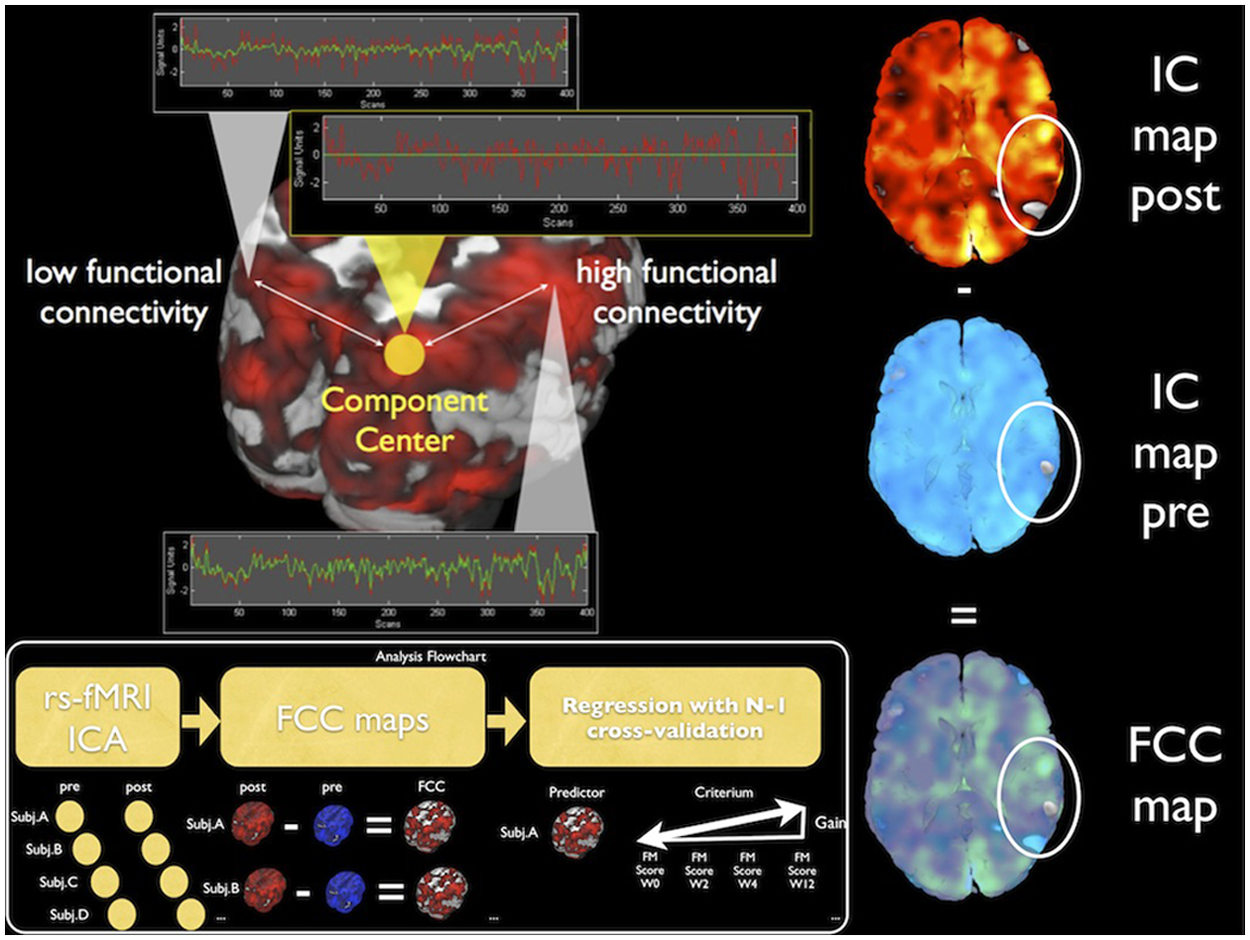
Illustration of the method: generation of FC change (FCC) maps from subtraction of 2 IC maps, each representing the magnitude of FC to a component center by image intensity. Abbreviations: IC, independent component; FC, functional connectivity.
Predictor and criteria values were drawn from a training set corresponding to the entire set of observations minus one (N − 1) observation, which was withheld for subsequent testing. This was repeated N times, until each part of the set was used as a test set once, resulting in a leave-one-out cross-validation. For each cross-validation fold, the squared error from predicting the criteria value using the predictor values of the withheld test set was recorded, giving N error values, from which the root mean squared error (RMSE) was calculated for each voxel. A voxel was considered as a significant predictor, thus indicating a plausible statistical link between the FCC in that voxel and the functional outcome gain, only if it fulfilled the following conservative criteria: (1) the RMSE was below 1, so that the deviation of the predicted value from the real value was generally below 1 SD; (2) the average of the linear regressions p values was below .05; (3) the correlation of the predictor values (FCC) with the criteria values (FM gain) exceeded r = 0.1; (4) the correlation of the predictor values (FCC) with the criteria values (FM gain) was significant (uncorrected) on a p = .005 level, and (5) the voxel was part of a cluster that surpasses an SPM-style cluster extent threshold (cubic) of 6 adjacent voxels. More information on the thresholding process is available in the Supplementary Information S3. The procedure was repeated 3 times, first using all 9 participants, second using only participants of the BCI group, and third using only participants of the MANUS group.
Results
Independent Component Analysis
Based on earlier RS-fMRI findings, 21 the classical sensorimotor network, comprising the bilateral motor cortices and SMA, 22 could not be found in our sample. Decreased interhemispheric FC in the somatomotor system as a result of corticospinal tract (CST) damage has been described earlier. 23 The observations of a disconnection of the functional network into 3 distinct parts but with bilaterally distinct intrahemispheric FC between the primary somatosensory and motor cortex, is supported by the present findings using data-driven methods (ICA). The visuospatial system was intact. A comparison of pretraining and posttraining ICs reveals FCCs in both directions (FC increases and FC decreases) in all components.
Motor Gain Prediction
No significant voxels could be found to predict functional gains in motor function from FCC maps if groups were considered separately. When using all participants across groups, significant predictors were identified.
FCC of the ipsilesional inferior parietal lobe (IPL, 12 voxels, FCC to motor gain correlation, r = 0.87, RMSE 0.65) and contralesional anterior cingulate cortex (ACC, 7 voxels, FCC motor gain r = 0.88, RMSE = 0.64) with the SMA were significant predictors of rehabilitation gain. So were FCCs of the ipsilesional middle temporal gyrus (MTG, 8 voxels, FCC motor gain r = 0.89, RMSE = 0.6) and the ipsilesional superior medial gyrus (SMG, 28 voxels, FCC motor gain r = 0.88, RMSE = 0.65) with the visuospatial system. Another predictor was the FCC of the ipsilesional precuneus (17 voxels, FCC to motor gain correlation r = 0.87, RMSE = 0.64), contralesional precuneus (11 voxels, FCC to motor gain correlation r = 0.87, RMSE = 0.63), contralesional middle orbital gyrus (7 voxels, FCC motor gain r = 0.88, RMSE = 0.64), contralesional MTG (9 voxels, FCC motor gain r = 0.86, RMSE = 0.66), and ipsilesional cerebellum (6 voxels, FCC motor gain r = 0.9, RMSE = 0.57) with the contralesional motor cortex. The FCC of the contralesional MTG (12 voxels, FCC motor gain r = 0.88, RMSE = 0.66), contralesional superior temporal gyrus (STG, 35 voxels, FCC motor gain r = 0.9, RMSE = 0.55), and contralesional cerebellum (6 voxels, FCC motor gain r = 0.9, RMSE = 0.52) also correlated with the ipsilesional motor cortex (Figure 5).
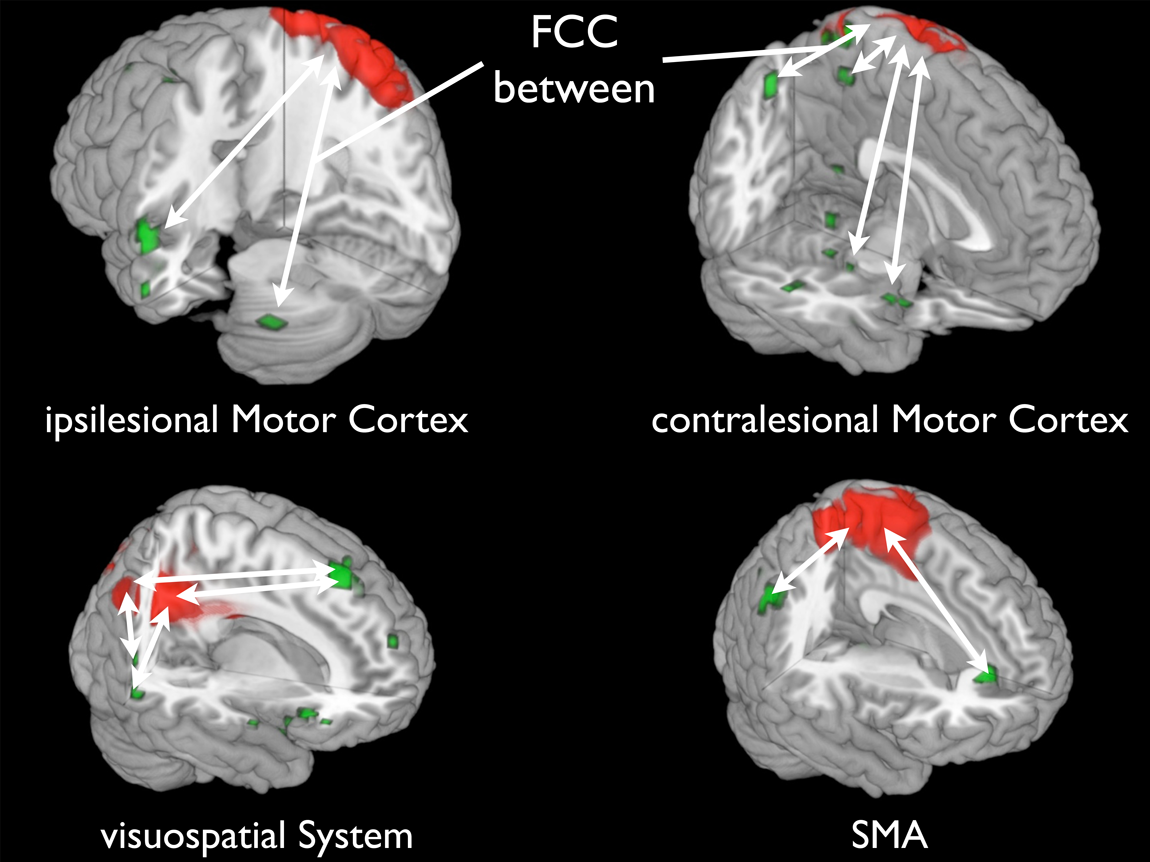
FC between green and red areas has changed (indicated by white arrows); FCC in green regions predicted individual motor gain. Abbreviations: SMA, supplementary motor area; FCC, functional connectivity change.
The FCC in these regions were all positively correlated with the functional motor gain values. When reviewing the correlations of individual FCC values and the motor gain values, strikingly, no negative correlations could be identified. This indicates that in the present sample, FC decreases were not positively correlated with individual motor gain; higher FC increases on the other hand predicted better motor recovery. All results are provided in greater detail in the Supplementary Material, including those FCCs that did not pass the cluster-extent threshold criterion but were observed in earlier studies as well, such as the beneficial FCC between the middle frontal gyrus and ipsilesional motor cortex. 24
Exploratory Group Comparison
When further examining the group-specific differences in terms of FCC, some functional connections seem to differ between the groups in terms of average FCC. The within-treatment-group FCC averages are different beyond 1 SD from the within-group averages for 3 functional connections (see Supplementary Material): first, the FCC between the ipsilesional precuneus and the contralesional motor cortex; second, the FCC between the contralesional cerebellum and the ipsilesional motor cortex; and third, between the STG and the ipsilesional motor cortex. The FCC values are consistently higher (equaling a relatively stronger FC increase) for the MI-BCI treatment group. When comparing the gain steepness values from individuals of both groups, the average gain steepness was numerically higher in the MI-BCI treatment group (M = 2.29 vs MANUS M = 2.1) but was more variable as well (MI-BCI SD = 2.4 vs MANUS SD = 0.82), indicating a possibly beneficial effect of BCI training on brain plasticity. 25
Discussion
For all participants, an increase of FC at rest, between the IPL and the SMA as well as between the ACC and the SMA, was associated with better motor score outcome. As reported, 26 the ACC can play a key role in attentional processes related to self-monitored movement in right hemispheric stroke, whereas the IPL—especially the posterior part—has been implicated27,28 in processes related to coding the intention to move and spatial processing in general. A strengthened association of these three systems—namely, the IPL, ACC, and the SMA—in a functional network could be beneficial for motor recovery because it might constitute an adapted functional network for processing motor attention, cueing, and movement initiation.
The visuospatial system has been associated with representing the world around us as well as with processing visuospatial cues. 22 The FC increases with the ipsilesional MTG, and SMG might indicate a strengthening of connectivity within systems related to spatial awareness and spatial processing, both of which have been associated with the medial gyrus and temporal lobe. 29 The MTG especially has been associated with spatial mental imagery, 30 which is a function that is targeted in MI-BCI treatment. The observed strengthening of functional connections between frontoparietal regions, which play a key role in top-down processes and the visuospatial system and SMA, might be adaptations that are counteracting the deficits in the connectivity of these systems following stroke. 31 Such reorganizational processes in the vicinity of the premotor cortex and, specifically, changes in connectivity between this system, the visuospatial system, and the parietal cortex have been described as crucial for motor recovery after stroke and are specifically involved in the integration of spatial information on a grasping target and the hand. 32
FC increases between the contralesional MTG, precuneus, middle orbital gyrus, and ipsilesional cerebellum with the contralesional motor cortex as well as the FCC between the contralesional MTG, STG, cerebellum, and the ipsilesional motor cortex might reflect adaptive processes that occur during the reorganization of motor control and increased recruitment of regions disconnected by the stroke. 33 Diametrically opposed to poststroke diaschisis, such FCCs between pairs of regions remote to the lesion might mark beneficial adaptive processes. These phenomena have been described 34 and might counteract the documented 23 disruption of FC upstream of subcortical and CST lesions. Although diffusion tensor imaging–based quantification of CST damage 23 was not available in the present study, future studies of treatment-induced FCCs should integrate CST lesion magnitude as a control variable.
It has long been argued whether control from the ipsilesional or contralesional motor cortex should be targeted as a means of functional rehabilitation, especially in subcortical stroke.35-44 Our results indicate that the process might be more complex than a role change for one single motor system and the silencing of another. It is possible that the contralesional motor cortex assumes only a temporary role in adaptive motor control, predominantly in the early stages of stroke recovery. 45
We recognize the limitations of our study, such as the small group size and the short time between the 2 RS-fMRI sessions. It is possible that these results represent only a snapshot of the adaptive processes occurring in the recovering brain. Specifically, in light of recent findings on the link between perfusion, white matter connectivity, 46 and FC, future longitudinal studies need to evaluate the role of poststroke changes in cerebral perfusion and tissue integrity in perilesional white matter bundles and gray matter structure 47 as potential mediators of FCCs.
Treatment Group Comparison
In an exploratory analysis, we compared average FCCs between the two treatment groups for all identified sites where the relation of FCC and motor recovery was significant. As the connections that change in a treatment-specific manner are known to be involved in MI performance, it might be hypothesized that the value of the MI-BCI treatment is a higher gain in upper-limb motor function and strengthening of those functional networks that contribute to neural processing of MI. MI-BCI training presumably strengthens the reassociation of neural representations of the paretic limb and the experienced afference, which could lead to better recovery.
Conclusions
Increases in RS-fMRI FC within parts of the motor system and between motor regions and higher-order association cortices significantly predicted better functional motor recovery in our pilot study. The increased FC at rest may represent an after effect of strengthened neural connections. The fact that the extent of this FC increase is directly correlated with functional motor gain suggests a facilitatory effect, possibly implicating an increase in interregional neural cooperation. Studies on larger populations and with sham BCI treatment or control groups have to be conducted to clarify the reproducibility and stability of these results for BCI and other interventions that may make use of Hebbian plasticity.48,49
Footnotes
Acknowledgements
The authors thank the participants and the entire Singapore research team, recruiters, trainers, testers, and nurses at the Tan Tock Seng Hospital rehabilitation center, as well as everybody involved in the data acquisition process. We would also like to thank Professor Chee for his help with the revision process and scanning and Dr Surjo Soekadar for help with generation of the manuscript and revisions.
Declaration of Conflicting Interests
The author(s) declared no potential conflicts of interest with respect to the research, authorship, and/or publication of this article.
Funding
The author(s) disclosed receipt of the following financial support for the research, authorship, and/or publication of this article: Author BV and this project were partially funded by the European Union (HUMOUR 231724) and the Bundesministerium für Bildung und Forschung (BMBF, 01GQ0831). We are thankful to the The Enterprise Challenge Grant, Singapore, and Agency for Science, Technology and Research, Singapore, for their funding support.