
Abstract
Background. With progressive abnormalities in leg strength, tone, and sensation, adrenomyeloneuropathy (AMN) is a differential diagnosis for multiple sclerosis and hereditary spastic paraparesis. AMN pathology has been linked to weakness, making it a relevant model to evaluate the relationship between neurodegeneration and disability. Quantifying symptom severity in AMN is essential for treatment development in rehabilitative management. Objective. To identify deficits in body functions, activity, and participation of people with AMN and provide a practical framework for evaluating the severity of disability. Methods. Cohort analysis of 142 participants with AMN. Measures of body functions (leg strength, vibration sensation, range of motion, and spasticity), activity (walk velocity, standing balance, Timed Up and Go, and Sit-to-Stand Time), and participation (6-Minute Walk) are evaluated. Regression analyses identify relationships between the measures. A staging framework (mild, moderate, and severe) reflects the continuum of disability. Finally, an analysis of variance/Kruskal-Wallis was used for between-stage and sex differences among the variables. Results. Strength is the strongest correlate for the 5 measures of activity and participation. Staging based on weakness distinguishes 3 levels of severity along a continuum of disability. Differences between the sexes are more prevalent earlier in the continuum but show equally severe deficits in the last stage. Conclusions. In AMN, staging based on degrees of weakness provides a practical means to characterize the severity of common deficits in body functions as well as activity and participation at each stage, to direct the evaluation. Such information could help clinicians develop more effective rehabilitative techniques.
Introduction
Identifying and quantifying symptom severity as well as activity limitations and participation restrictions in persons with neurodegenerative disorders are essential to their rehabilitation management.1-3 A good model for understanding the association between the disease severity and the specific symptoms leading to disability would be a disease that has a well-defined pathology. Adrenomyeloneuropathy (AMN), a subtype of X-linked adrenoleukodystrophy (X-ALD), is characterized by noninflammatory dying back demyelination of the dorsal column and corticospinal tracts.4-7 The specificity of this pathology means that AMN provides a well-defined model to evaluate the relationship between pathology and symptoms. Though X-ALD is relatively rare—approximately 1:17 000—AMN is the most common neurological manifestation of this genetic disorder, affecting approximately 65% of at-risk individuals. 8 Symptomatically, AMN affects both men and women carriers, resulting in lower extremity abnormalities in strength, tone, and sensation that progress over 5 to 20 years but does not limit life span. However, studies evaluating the AMN phenotype have predominantly focused on men, with little mention of female characteristics.9,10 A previous study linked corticospinal tract abnormalities to lower extremity weakness and gait deviations in a small group of AMN men. 11 As has been proposed for amyotrophic lateral sclerosis and Parkinson disease, using a systematic framework to group or stage individuals based on quantitatively assessing key symptoms and their severity is critical to the effectiveness of rehabilitation.2,12 A staging framework provides a strong basis for applying intervention strategies that would focus on the level of functioning relative to stage severity. Therefore, it is hypothesized that the severity of weakness can serve as an appropriate framework from which to stage individuals with AMN.
A practical framework for evaluating the functioning of individuals with AMN is needed so that intervention planning can be best optimized. The aims of this large-scale observational study are to (1) examine the relationship among body functions, activity, and participation; (2) use a staging framework to identify the most meaningful measurement tools within each stage to guide their neurorehabilitative clinical care; and (3) highlight differences in clinical presentation for women.2,12
Methods
Participants
This study is a cross-sectional analysis of baseline data obtained from the first 142 participants (60 men and 82 women) enrolled in a parent study: A Phase III Placebo Controlled, Double Blind Trial to Evaluate the Effect of Glyceryl Trioleate and Glyceryl Trierucate (Lorenzo’s Oil) in Adults with X-ALD. As part of the parent study, measures of body function, activity, or participation that could be used as secondary markers of disability progression in adults with AMN were collected. Participants met the larger study criteria of >18 years old; X-ALD, confirmed by using the very-long-chain fatty acid assay and/or mutation analysis; no brain MRI demyelination; and Kurtzke Expanded Disability Status Scale (EDSS) score of 1 to 6.5. Because symptoms of AMN are typically noted in retrospect, 10 information regarding the initial onset of symptoms in the participants was not used. Participants were interviewed to determine the use of mobility aids. For descriptive purposes, the locomotor walk/chair score of the Functional Independence Measure (FIM) was assessed. With the large number of participants and extensive testing paradigm of the parent study, some measures could not be obtained on all individuals because of scheduling conflicts and time limitations. Figure 1 indicates the number of participants tested for each measure and those participants that were unable to complete the test for each measure. Two participants had coexisting medical complications that would interfere with testing and were excluded.
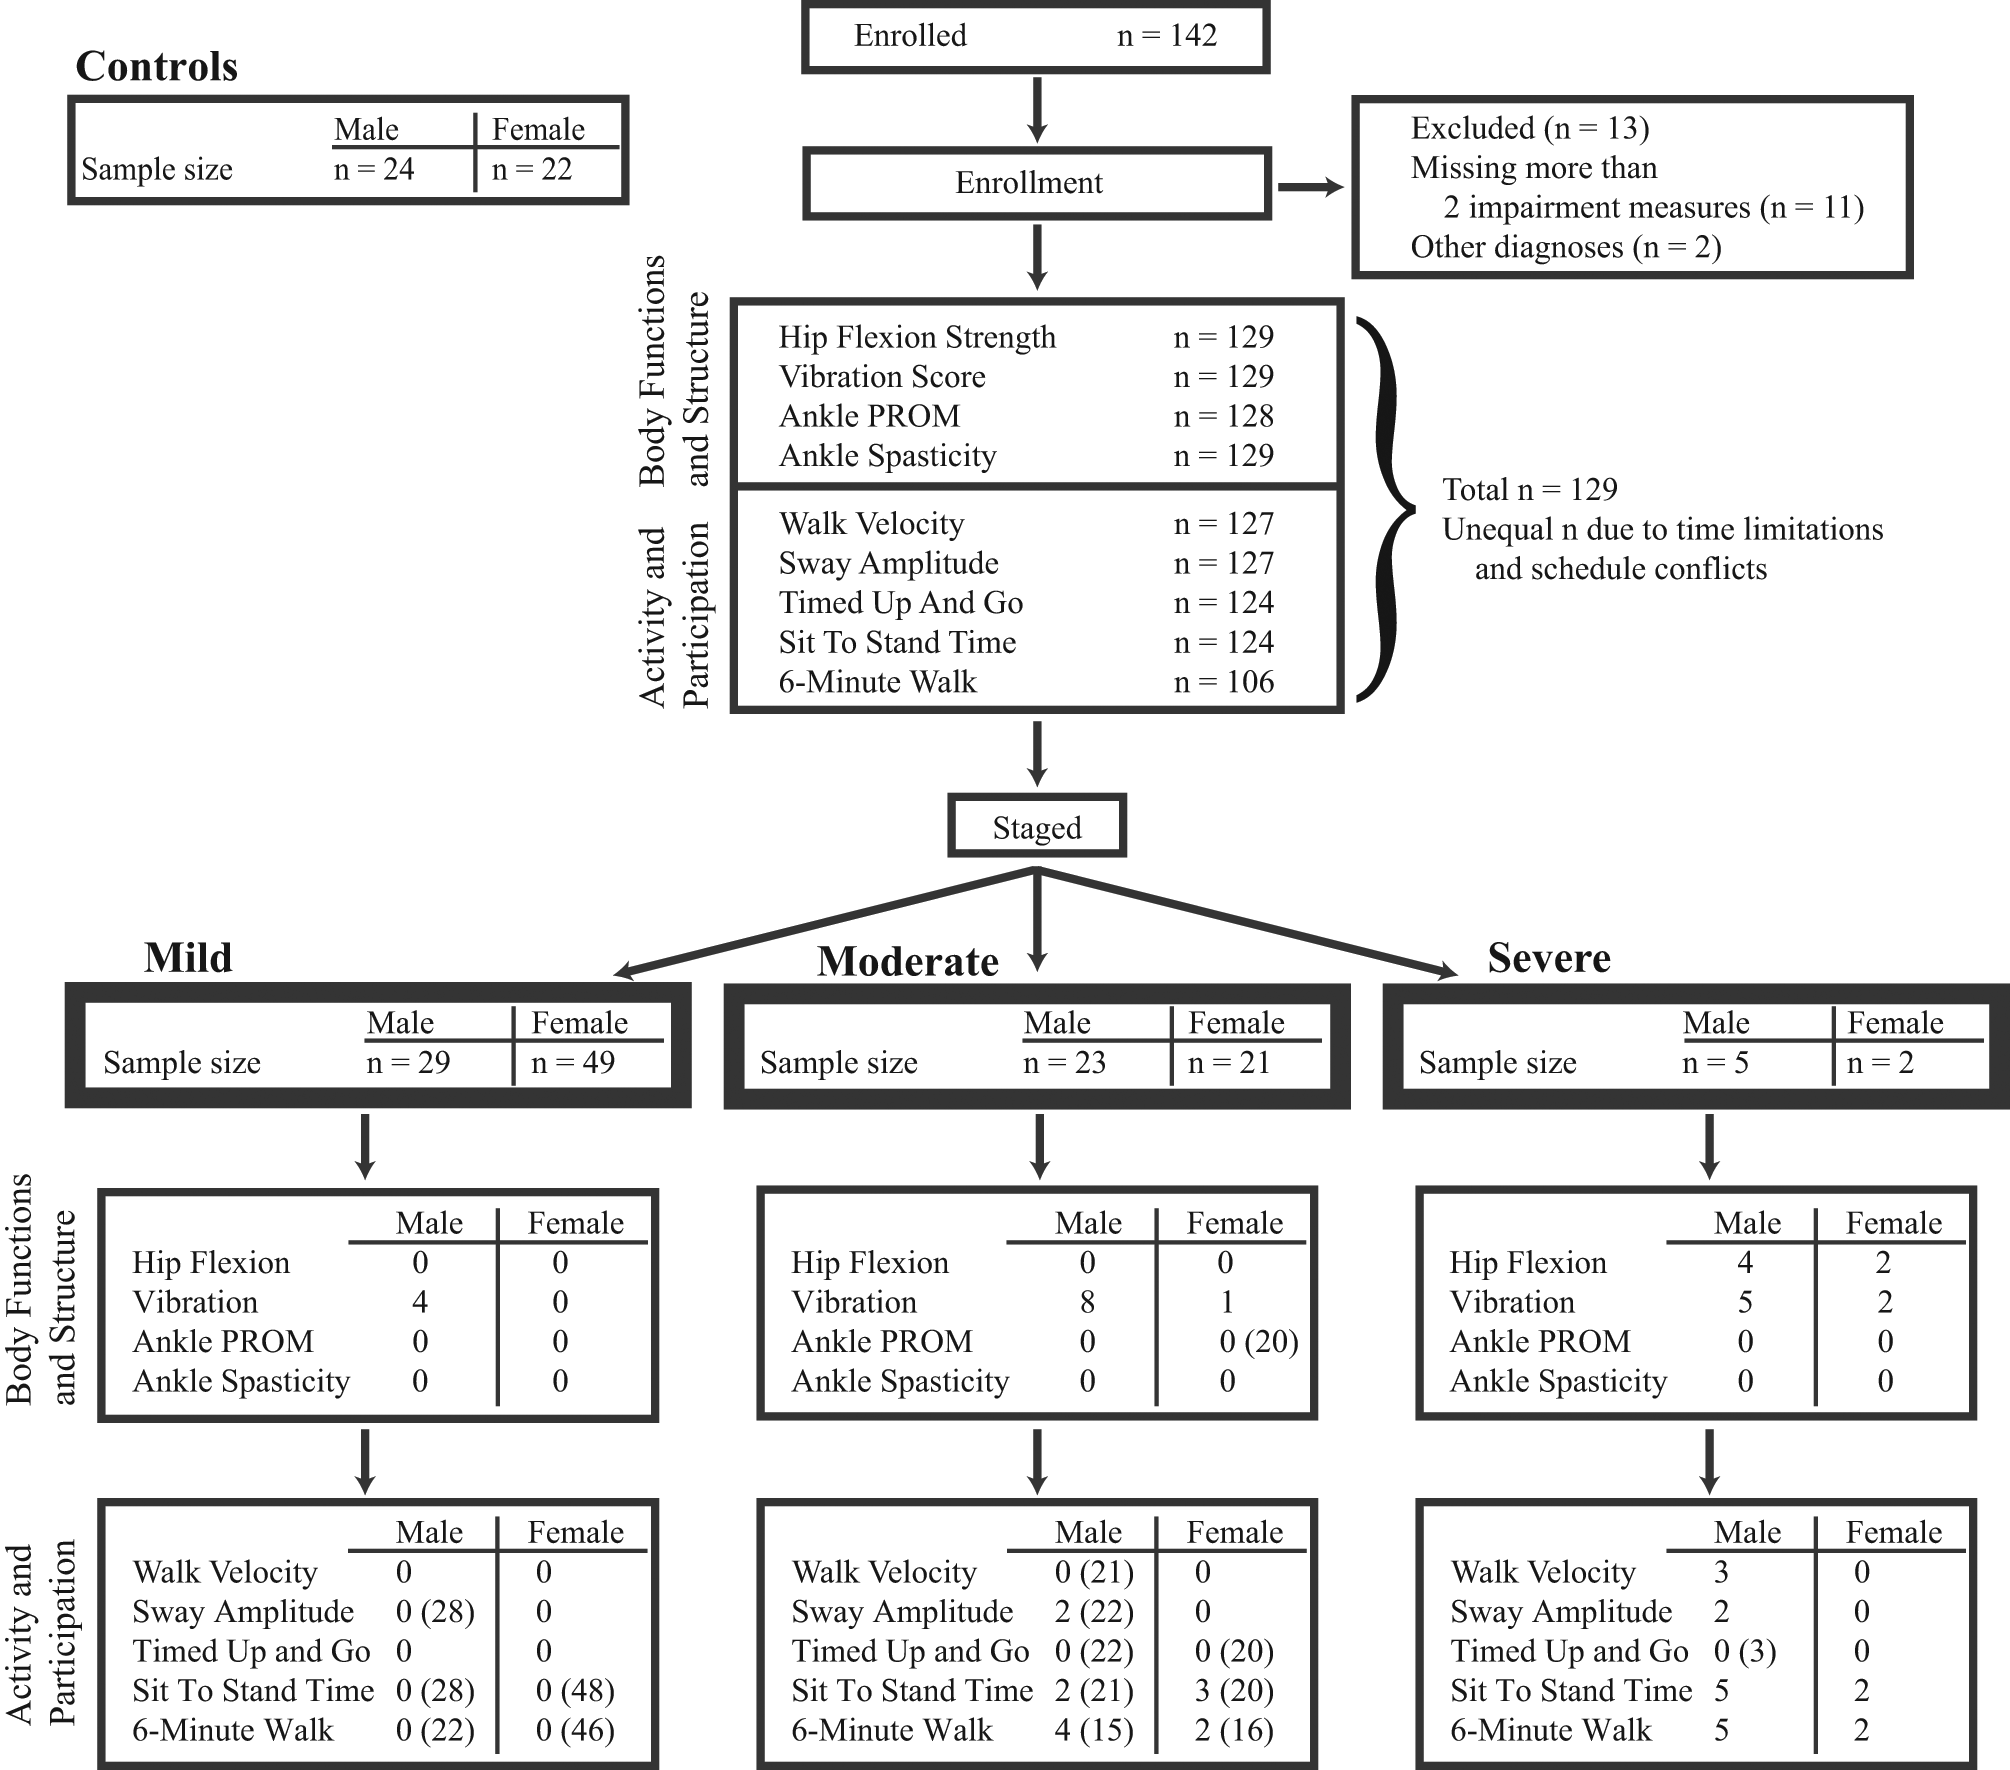
Flow chart showing the number of participants enrolled and tested for each measure. The bolded boxes show the total sample size for each staged group. Staged values below the bolded boxes indicate the number of participants who were unable to complete each measure as a result of severity of symptoms. Numbers in parentheses indicate the total number of participants tested for each measure per stage if different from the initially staged sample size. Overall, this figure specifies both those participants who are unable to complete the test and those participants who were not tested because of time limitations and schedule conflicts. For example, in the moderate stage, male (n = 23), for the 6-Minute Walk test, 4 men were not tested because of time limitations and schedule conflicts (top half of flow chart) and 4 men were unable to complete the test, resulting in a total sample size of (n = 15). Abbreviation: PROM, passive ankle dorsiflexion range of motion.
For comparison, a group of healthy control participants (24 men and 22 women) who were age and sex matched to the mean age of the men and women in the study were tested. All participants gave informed consent as required by the institutional review board.
Measures
All measures were quantified by the study physical therapist or occupational therapist; the EDSS was determined by a study physician. The therapists all had extensive training in testing the measures. The measures have been shown to be reliable in AMN. 11 Reliability of the measures between the study therapists was not formally assessed; however, the measures were taken by the primary physical therapist with few exceptions. Because control participants were only tested for hip flexion strength, reference values are provided after the description of other measurements for comparison.
The study is presented using the language of the International Classification of Functioning, Disability, and Health framework of the World Health Organization. For clarification, the main terms used relate to the Nagi disablement model as follows: body functions and structure impairments (similar to Nagi impairment), activity limitation and participation restriction (similar to Nagi functional limitations). Contextual factor is the term used in the ICF model for environment and personal factors. Further explanation can be found in the ICF beginner’s guide. 13
Body functions
For strength of the iliopsoas, gluteus maximus, gluteus medius, and quadriceps femoris muscles, participants were evaluated by both hand-held dynamometry (HHD) and manual muscle testing (MMT). For the HHD, the average of 2 maximal hip flexion efforts is reported, on the weakest side, using a Microfet2 handheld dynamometer (Hoggan Industries, West Jordan, Utah). 14 Participants unable to hold the initial test position were assigned 0 N. Hip flexion was chosen as the measure of strength because (1) a previous study showed that hip flexion is a primary area of weakness that can be reliably obtained in participants with AMN,2,11 (2) Bohannon 15 has proposed that 1 muscle group could be representative of limb strength, (3) hip flexion measures were obtained for all participants, and (4) spasticity was the least in the iliopsoas muscles. HHD hip flexion strength measures were obtained from control participants for comparison.
End-range passive ankle dorsiflexion range of motion (ankle PROM) was assessed goniometrically with the patient in a prone position. 16 End range in degrees of the more limited side is reported. The reference value for adult end-range ankle PROM is approximately 20°. 17
Vibration thresholds were determined (in vibration units, VU) at the great toe using the Vibratron II (Physitemp Instruments, Inc, Clifton, New Jersey). 18 For this test, an A and a B rod on the Vibratron II were used; the experimenter had control of the amplitude and sequence of intensities used for the rods. For each trial, vibration stimulation was present for 1 rod, and the participant was required to determine which of the 2 rods was actually vibrating using a 2-alternative forced choice procedure. 17 Vibration thresholds for the most impaired toe are reported, and reliability has been reported for individuals with AMN. 11 For participants who could not sense the maximum amplitude of vibration (19.9 VU), that value was assigned. Reported reference values taken from the packet insert are as follows: within normal limits for 36- to 50-year-olds is 2.56 VU and 51- to 65-year-olds is 2.89 VU. Severe dysfunction for 36- to 50-year-olds is 4.64 VU and 51- to 65-year-olds is 5.25 VU. 19
Spasticity was quantified using the Modified Ashworth Scale (MAS) in the ankle plantar flexors in all participants. 20 Whole number intervals of 0 to 5 (eg, 1+ = 2) were assigned, and the score for the side with higher spasticity was reported.
Activity
For walking velocity, participants walked across a 9-m walkway at their fastest speed; the results of 3 to 6 trials were averaged. Marker position data were collected at 100 Hz using a 3-dimensional Optotrak motion measurement system (Northern Digital, Inc, ON, Canada); custom Matlab (TheMathWorks, Inc, Natick, Massachusetts) software was used to calculate joint position and velocity (stride length/time). Maximal gait velocity reference values were as follows: men, 30- to 49-year-olds =2.46 m/s; women 40- to 49-year-olds =2.12 m/s and 50- to 59-year-olds =2.01 m/s. 21
Static standing balance was assessed by measuring the successful completion and the extent of the postural sway over two 20-s trials while the participants stood under 4 conditions: (1) eyes open, feet shoulder-width apart; (2) eyes open, feet together; (3) eyes closed, feet shoulder-width apart; and (4) eyes closed, feet together. Data were collected at 1000 Hz using a Kistler 9281 force plate (Kistler Instrumente AG, Winterthur, Switzerland). Balance deficits were calculated as the magnitude of postural sway (sway amplitude) using custom Matlab software (TheMathWorks Inc, Natick, Massachusetts). Data for sway amplitude in condition 1 are shown because the majority of participants were able to do this task independently.
Sit-to-Stand Time (STS) was recorded as the time taken to rise from a seated position (ie, hips and knees at 90 degrees) to upright with no manual support. The mean of 3 out of 5 median trials was calculated.
The Timed Up and Go (TUG) was the value recorded on the second trial of the time taken to rise from a 46-cm arm chair, walk 3 m, turn, walk back to the chair, and sit down again. 22 The TUG reference value was 4.98 ± 0.9 s mean for men aged 40 to 49 years. 23
Participation
To estimate community endurance, the maximum distance that participants walked over 6 minutes is recorded (6-Minute Walk Distance [6MWD]). 24 A stop watch was used for all timed tests (ie, STS, TUG, and 6MWD). Reference values for 6MWD were 630 m for women and 640 m for men aged 40 to 49 years, 50th percentile. 25
Contextual factors
To account for differences in body size and physiological changes with aging, age, weight, and sex were recorded for our participants.
Data Analysis
To determine the extent to which specific body functions and structure explain the variance in activity or participation variables, forward stepwise regression models were calculated on the entire cohort (ie, not divided by sex or groups). For this regression, we used the following 6 variables: strength, vibration sensation, ankle PROM, ankle spasticity, age, and sex.
The MMT scores were used for staging the severity of the cohort (Figure 2). A therapist placed participants into 1 of 3 stages based on the severity of weakness, using the MMT scores for the iliopsoas, gluteus maximus, gluteus medius, and quadriceps femoris muscles. 26 The strongest group scored at least a 4 in 3 muscles; this was mildly affected, termed mild stage. Those moderately affected scored at least a 3 in 3 muscles (ie, moderate stage). Those severely affected scored less than a 3 in at least 3 muscles tested (ie, severe stage). The resulting sample size of each stage by sex after evaluation is indicated in Figure 1. MMT scores are chosen over HHD for staging because this is the standard in clinical practice for categorizing strength and is used across clinical disciplines. In contrast, HHD is chosen over MMT for statistical analysis because it provides a quantitative means for evaluating strength and its relationship to the functional measures. The HHD strength data are assessed in 2 ways: normalized to weight and raw to account for possible differences in body size.
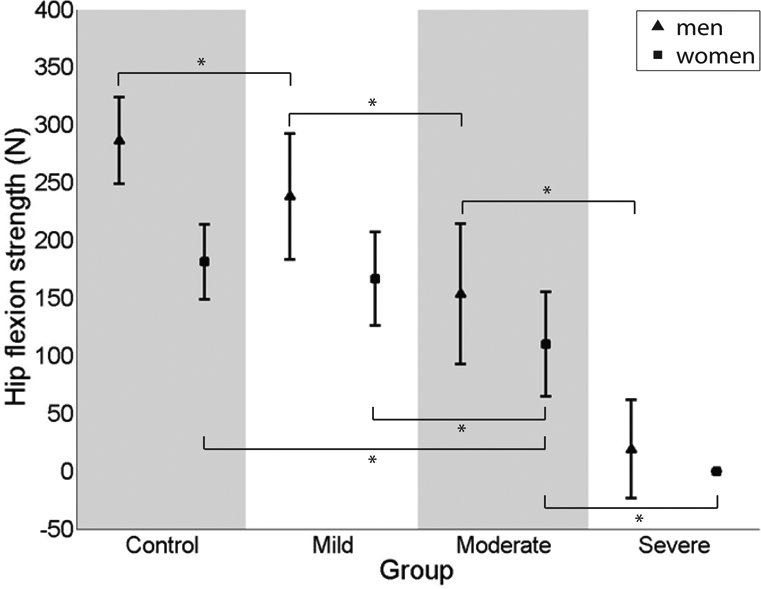
Hip flexion strength data plotted for 4 groups, control participants (far left column) and for the men and women with AMN, divided by stage. Filled squares indicate mean female values; filled triangles indicate mean male values. The asterisk (*) indicates post hoc P < .05. Data are given as mean ± standard error.
In addition to the division into 3 stages by strength measures, the cohort is separated by sex in the analysis because it has been suggested in the literature that certain differences may be present between healthy men and women in measures of strength, walking velocity, TUG, and 6MWD.14,27 We first discuss each of the stages with the whole cohort because there are enough similarities in AMN presentation between the sexes. We then highlight the differences between the sexes.
After dividing individuals into stages, differences for the men and women from the early through the late stages were each determined using 1-way analysis of variance (ANOVA; HHD, vibration sensation, ankle PROM, walk velocity, static standing, and TUG) and the Kruskall-Wallis ANOVA rank sum test (spasticity). For variables with P < .05, post hoc analyses were performed using unequal N honest significant difference. In instances when the severe group dropped out (ie, participants unable to complete the test), unpaired (independent) t tests were calculated for comparison between the mild and moderate groups (STS and 6MWD). The P values reported are not adjusted for multiple comparisons because many of the variables are correlated with one another. With respect to the small size of the severe group, discussion of statistical significance is limited. All data analyses were performed with Statistica (StatSoft, Inc, Tulsa, Oklahoma).
Results
Regression Models
Strength is the primary factor contributing to the performance of the AMN participants in the activity and participation measures compared with the impact of the other body functions (eg, vibration sensation, ankle PROM, and spasticity) and contextual factors (ie, age and sex). To specify the unique contribution of each variable to the measures of activity and participation, we show R2 and partial correlation coefficients from the regression analysis (Table 1). The analysis indicates that strength is the strongest correlate for the 4 measures of activity and participation (partial correlation coefficients ranged from 0.34 to 0.52, P < .001). Vibration sensation is also a significant correlate but to a lesser degree compared with the partial correlation values for strength. In contrast, ankle spasticity is a strong and significant correlate for the 2 tests that involve walking (ie, walk velocity and TUG) but not for balance or STS measures. Ankle range of motion contributes significantly only in STS. The influence of age and sex are also significant with select variables in the model. With strength as the strongest factor, the model explained at least 59% of the variance (for STS) and up to 77% of the variance for sway amplitude (R2 ranged from 0.59 to 0.77, P < .001 for all).
Multiple Regression Models of Disability for AMN Cohort a
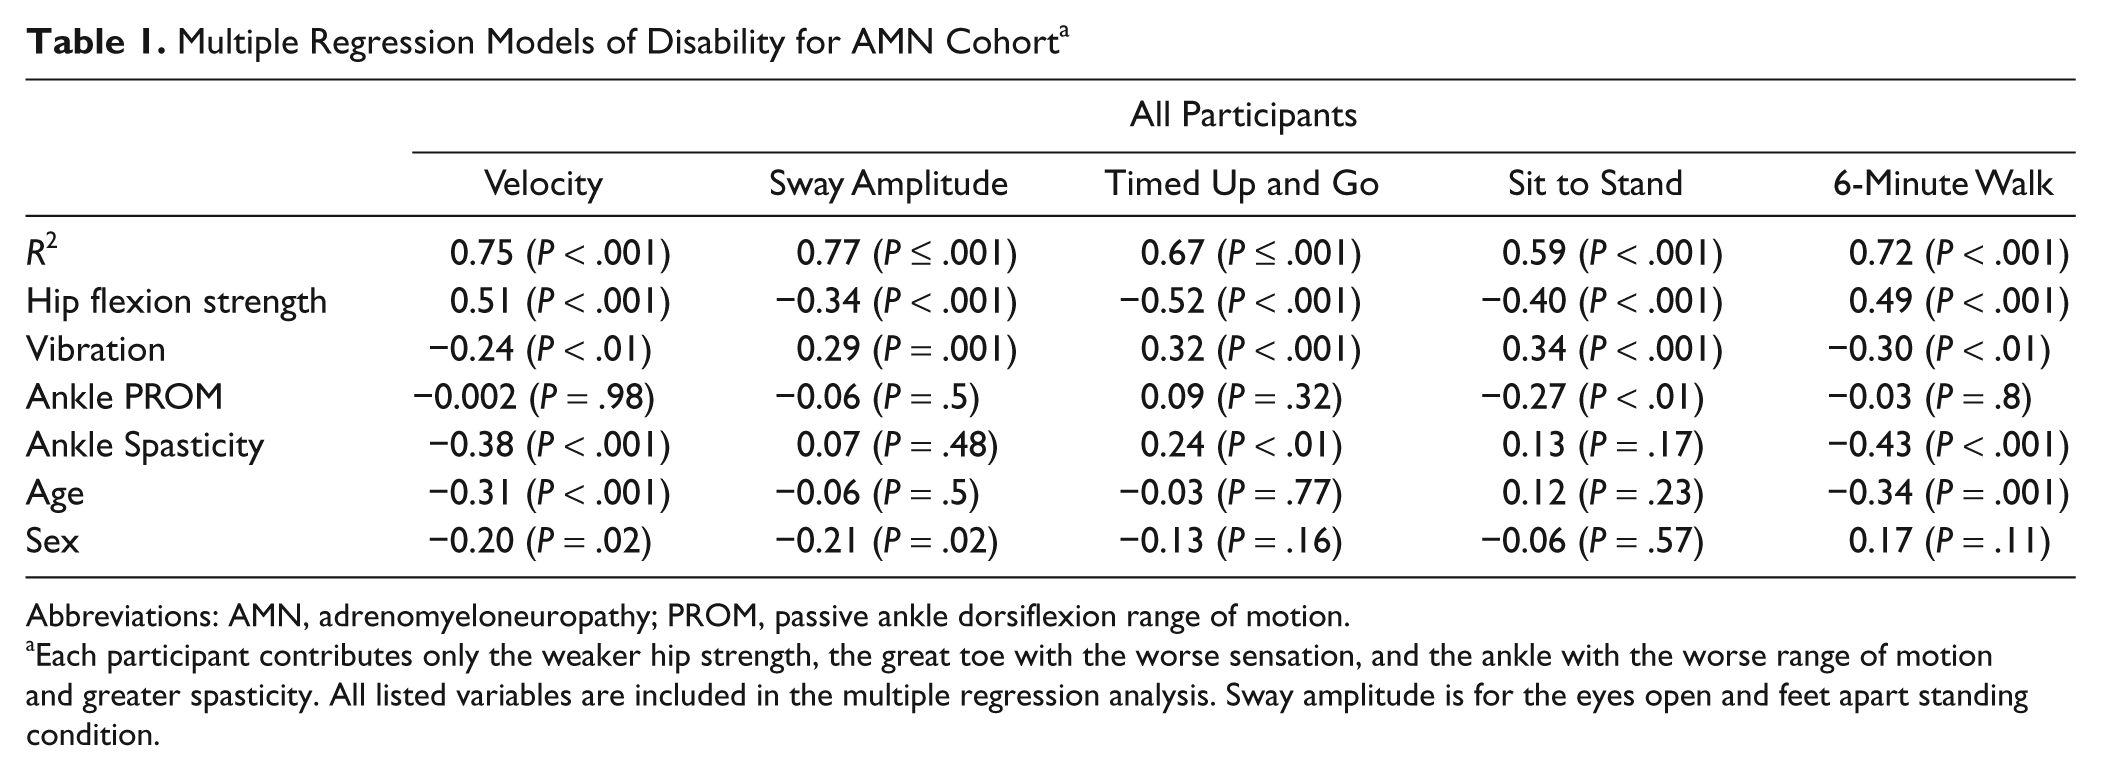
Abbreviations: AMN, adrenomyeloneuropathy; PROM, passive ankle dorsiflexion range of motion.
Each participant contributes only the weaker hip strength, the great toe with the worse sensation, and the ankle with the worse range of motion and greater spasticity. All listed variables are included in the multiple regression analysis. Sway amplitude is for the eyes open and feet apart standing condition.
Mild, Moderate, and Severe Stages
The division into stages based on MMT is verified in the mild, moderate, and severe stages by HHD hip flexion strength measures (P < .001; Table 2, Figure 2). Strength declines from the mild to the severe stages (Table 2, section B). Note that all the participants in the severe stage (ie, 5 men and 2 women) were so weak they were unable to complete the test (Figure 1). To assess the impact of weight on the staging groups, across the cohort when strength measures are normalized, the significant differences across groups does not change (raw strength and weight are shown in Table 2). In the mild stage, vibration thresholds for 69 participants out of the 78 participants show severe vibratory dysfunction compared with referenced control values. Mean ankle PROM for all stages fell below the established reference value of 20°. 17 Ankle PROM is significantly (P < .01) smaller and more abnormal as the stage severity increases (ie, mild to severe) in the cohort. Spasticity is increasingly impaired from mild to severe stages. Measures of activity and participation demonstrate mild, moderate, and severe abnormalities in a pattern similar to that for body functions (P < .01; Table 2, section C). Note that all individuals in the severe stage are so impaired that they are unable to complete the 6MWD and STS; in contrast, 2 of the 7 individuals were successful in completing the TUG (Figure 1).
Stages of AMN a
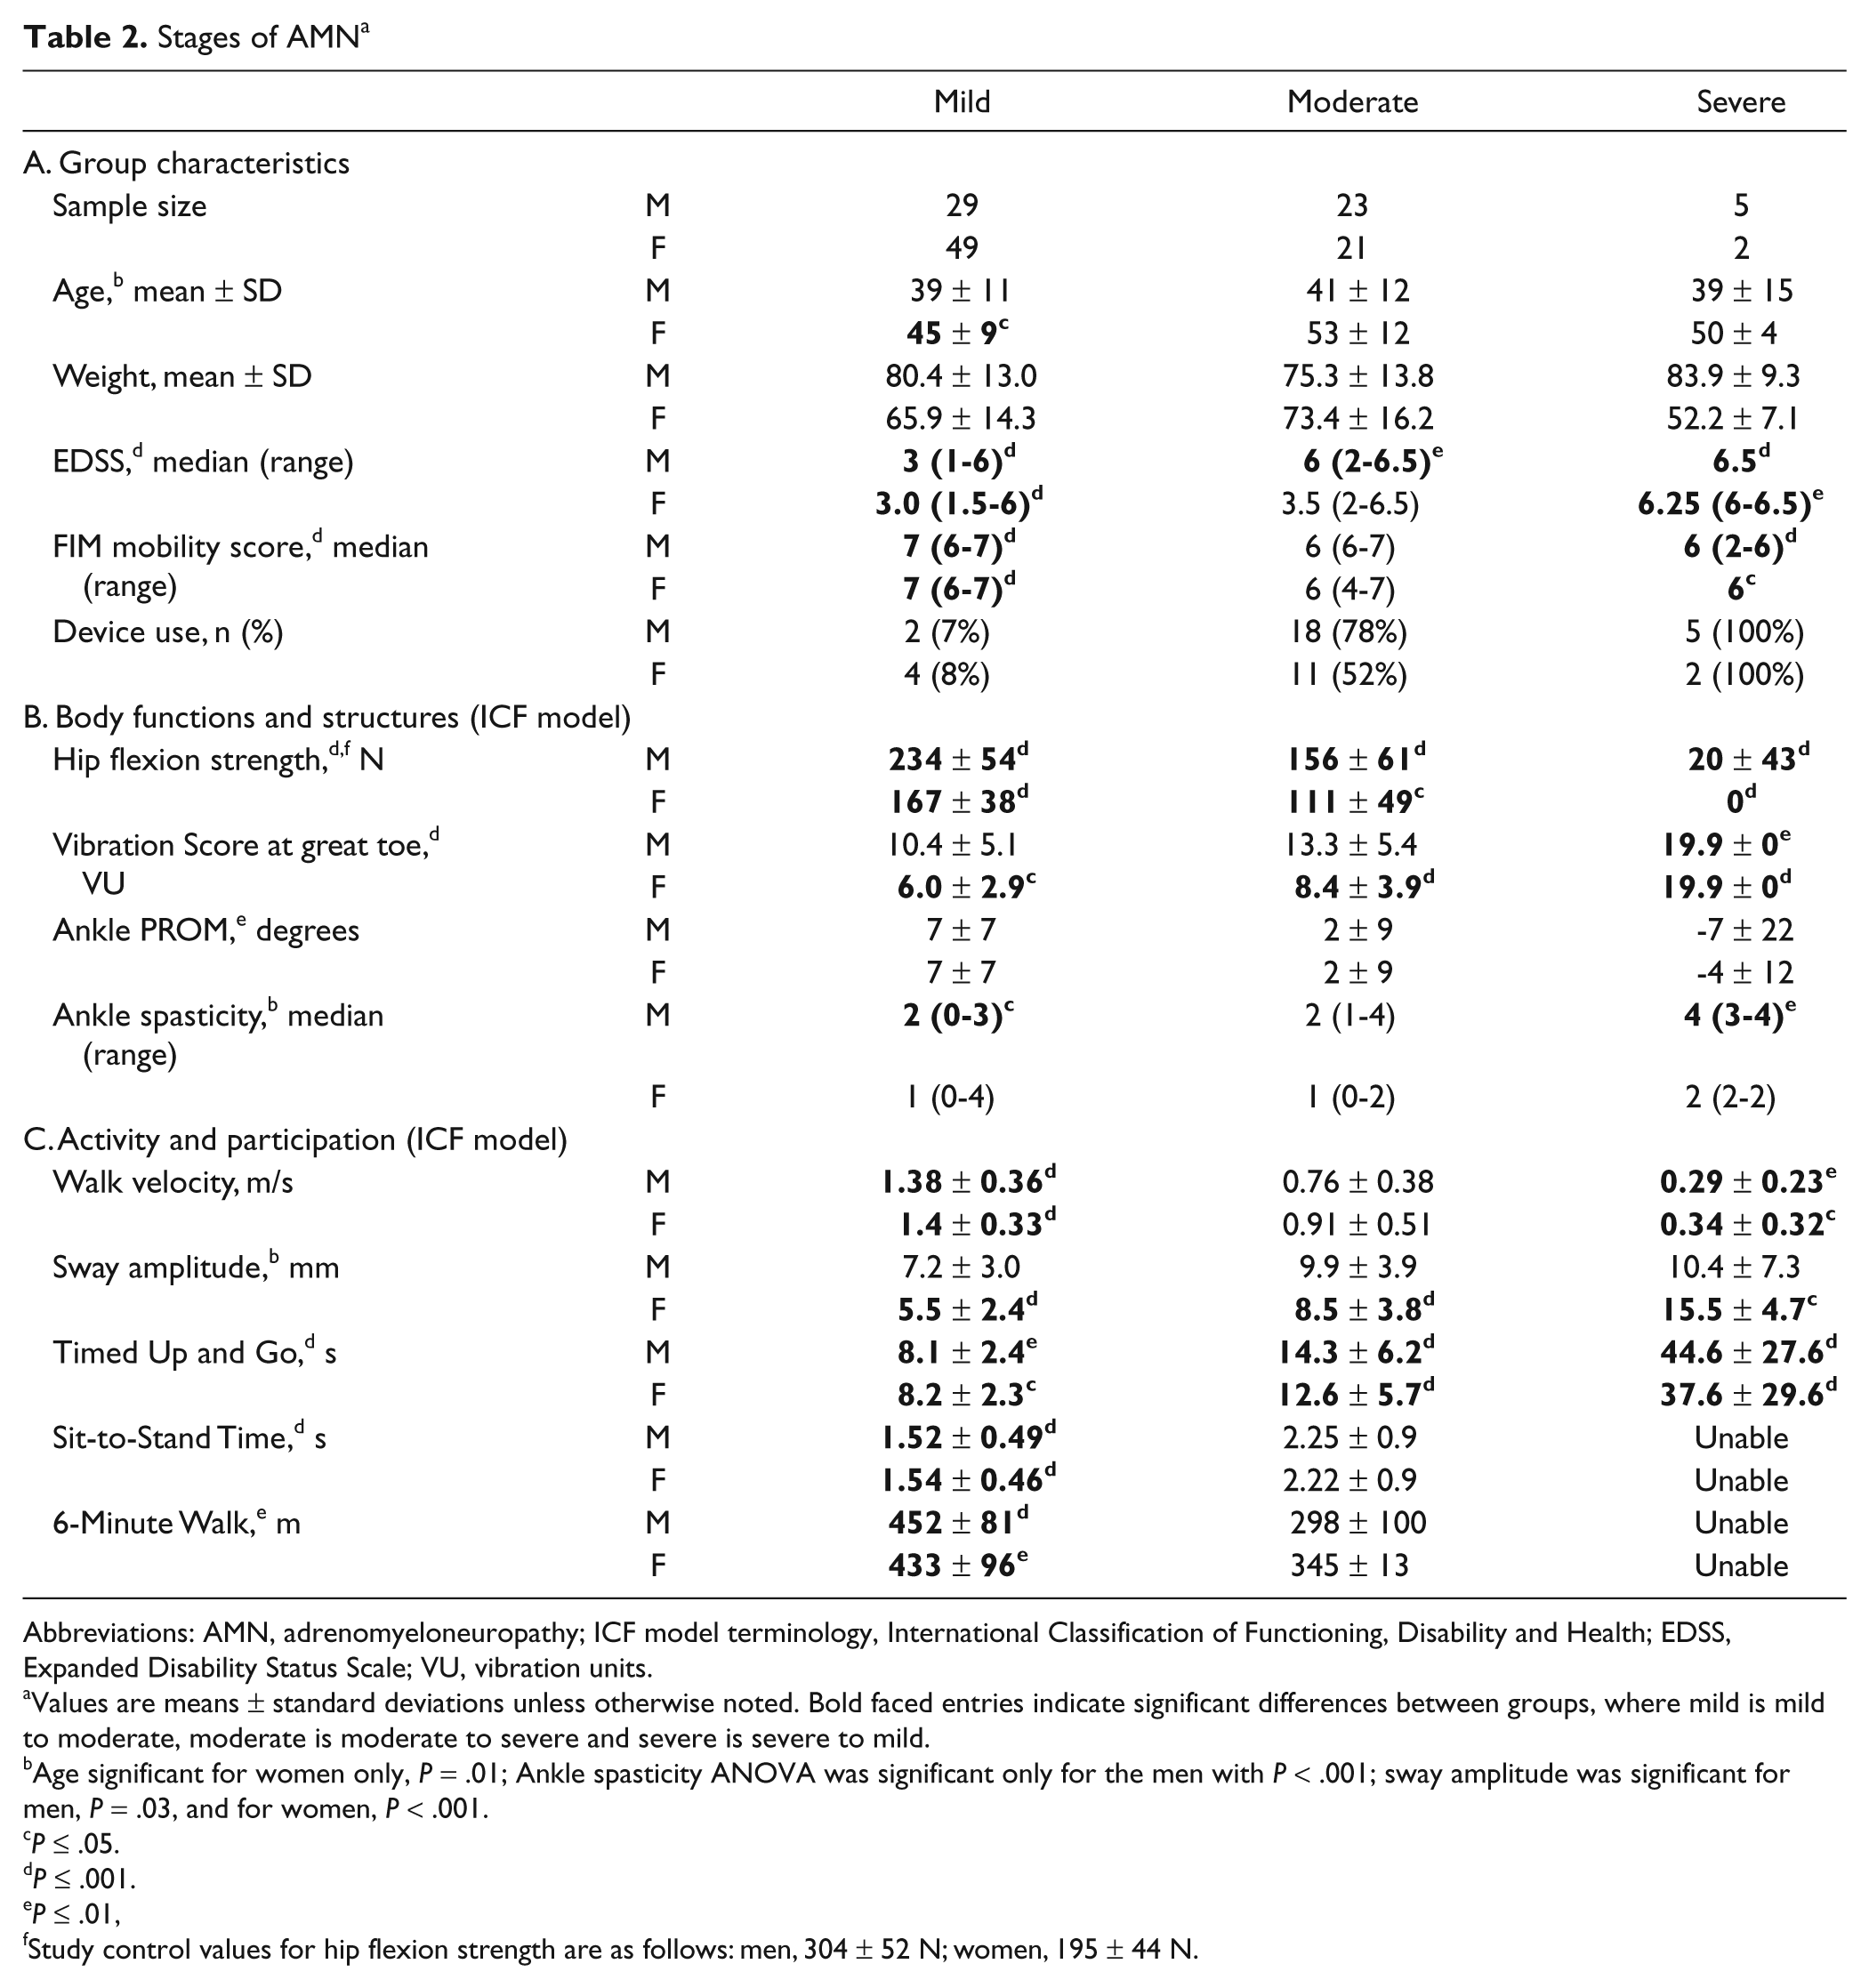
Abbreviations: AMN, adrenomyeloneuropathy; ICF model terminology, International Classification of Functioning, Disability and Health; EDSS, Expanded Disability Status Scale; VU, vibration units.
Values are means ± standard deviations unless otherwise noted. Bold faced entries indicate significant differences between groups, where mild is mild to moderate, moderate is moderate to severe and severe is severe to mild.
Age significant for women only, P = .01; Ankle spasticity ANOVA was significant only for the men with P < .001; sway amplitude was significant for men, P = .03, and for women, P < .001.
P ≤ .05.
P ≤ .001.
P ≤ .01,
Study control values for hip flexion strength are as follows: men, 304 ± 52 N; women, 195 ± 44 N.
Evaluation Tools
The measures that significantly distinguish between stages (Table 2, bolded values) provide guidance in selecting appropriate tests for evaluating function. For body functions, hip flexion strength by HHD is 1 tool that distinguishes across all stages uniquely. In contrast, vibration sensation is already dramatically impaired in the mild stage; therefore, this tool is less effective at distinguishing among the stages. For activity, TUG distinguishes significant differences in performance across all stages (Table 2, section C). Walk velocity, STS, and 6MWD distinguish significant differences between the mild and moderate stages. As impairments in body functions increased, activity and participation declined; the participants of the severe stage could not successfully complete either 6MWD or STS.
Differences in Men and Women
The women were older than the men (women, 47 ± 11 years; men, 40 ± 12 years) and showed a significant 10-year average age increase from the mild to moderate stages (P < .05). Nearly twice as many men (44%) used a device for mobility compared with the women (24%; Table 2). Strength for women was not significantly lower than that of controls until the moderate stage (P < .05; Figure 2). The magnitude of vibratory sensory impairment in women in the mild stage was less than that of men; this difference in sex dissipates in the severe stage. For spasticity, less than half (41%) of women had muscle tone greater than 1 on the MAS, with no differences noted between stages. In contrast, 72% of men scored a 2 or greater on the MAS, and showed significantly higher spasticity scores across stages (ie, mild to severe stages; P < .001). Overall, measurement tools of vibration sensation and static standing balance showed significant differences in scores among the 3 stages for women (bolded values Table 2, sections B and C), which is not seen in men.
Discussion
Effective rehabilitation evaluation for participants with neurodegenerative disorders is challenging. One primary issue is that symptoms change with time, affecting the activity and participation of each person uniquely. Another problem is that there are a wide variety of assessment measures to choose from, many of which are ordinal in nature and, consequently, are broad and not adequately defined for detection of subtle deficits. A third problem is that assessment measures are typically sensitive within a particular window of impairment. To address these issues, this study uses a body function (ie, strength) to stage individuals as a guide for evaluating individuals with AMN.
Rehabilitation is the primary treatment option identified for people with AMN.10,28 The clinical basis for determining an appropriate treatment plan in rehabilitation is the identification and distribution of body functions, activity, and participation measures. Until now, this clinical information has been severely lacking for men with AMN and barely recognized in women. The data presented here encompass a large cohort, including women, and use a variety of measures for evaluating individuals with this relatively rare disorder. The cohort represents a wide range of performance abnormalities in body functions, activity, and participation measures.
Relationship Between Body Functions, Activity, and Participation
The regression model that incorporates body functions, activity, and participation measures of the cohort is used to reveal key aspects of the clinical presentation of individuals with AMN. Strength is the primary body function contributing to the performance of the participants in all the activity and participation measures (Table 1). This result confirms and expands on the previously reported findings presented by Zackowski et al 11 to a larger population and includes women. Similarly, vibration sensation is strongly correlated with the activity and participation measures; however, it is important to note that the majority of individuals had significant sensory loss. Our other body functions (ie, ankle PROM and spasticity) show more selective influence in activities and participation (eg, walk velocity). As with control and other disease populations, age-related changes and sex differences also influence the performance of the individual with AMN. The regression model highlights key aspects of the clinical presentation of AMN where strength is related to disability. Similarly, previous findings have shown that weakness is related to tract-specific pathological changes. 11 Therefore, AMN is a good model for understanding the relationships of pathology with disability. This supports the hypothesis that strength loss, because of its link to pathology and disability, is useful for staging.
Staging by Primary Body Function: Strength
Staging into 3 groups of affectedness (mild, moderate, and severe) based on a primary symptom has been proposed as an optimal means for managing a neurodegenerative disease. 12 Strength was selected as the measure for staging for a number of reasons. Of the body functions and contextual factors in the regression model, strength is the strongest correlate. The division into 3 unique stages is not affected by strength that is normalized to weight or maintained raw. Strength training is typically the focus of many rehabilitative treatment programs. One limitation to our strategy of using MMT for the strength measure is that it is a rating scale. Nevertheless, MMT provides a well-accepted and understood method for categorizing strength: in particular, gravity eliminated, against gravity, and resisted. The more quantitative continuous scales of HHD, vibration sensation, walk velocity, or sway amplitude, could have been used; however, the criteria for division into 3 degrees of affectedness are not clearly defined. Using sensation to stage would have heavily weighted the cohort on the severe end, which would not be representative of the range seen in strength, walk velocity, or TUG. Strength was chosen over more functional measures such as TUG or walking velocity because data from a previous study showed that corticospinal tract integrity is associated with strength loss in AMN. 2 Finally, given the strong correlation between strength and walk velocity in this study, the staging results are similar if either measure is used. The staging provides a framework that can be used as a guide to evaluate the functional status of an individual with AMN.
Stages of AMN
This study identifies a continuum of decline in capacity and performance by stages: mild, moderate, and severe. Compared with reference values, in the mild stage, AMN participants show greater abnormalities in body functions (ie, strength and sensation) than in activity and participation. 12 Table 2 suggests that the mild stage occurs in the 40s, with body function impairments of lower-extremity weakness, impaired vibration sensation, and mild spasticity. In this stage, individuals with AMN show reduced walking velocity and endurance (6MWD); however, differences from referenced data are not as evident by the TUG.14,29,30 HHD, walk velocity, TUG, STS time, and 6 MWD distinguish the mild stage presentation from the moderate stage presentation, making each an appropriate quantitative clinical measure for evaluating a person with AMN in the mild stage.
Compared with the mild stage, the moderate-stage participants show both worse body function impairments (ie, strength and sensation) and decreased performance in activity and participation. The EDSS and FIM mobility scores indicate that more than half of the participants in this stage use an assistive device for ambulation (Table 2, section A). Additionally, FIM mobility scores show that speed of walking has decreased, and safety concerns are present (Table 2). Participants with AMN in the moderate stage show increased activity limitations and participation restriction in TUG, STS, and 6MWD. The data show that the tests that best reflect functioning for participants who have strength equivalent to the mild to moderate stages are the TUG, the STS, and 6MWD. In contrast, because there are fewer options for participants whose strength is at the lower end of the moderate stage, their status would be evaluated best using only HHD and the TUG (Table 2, sections B and C).
In the severe stage, body functions as well as activity and participation show greater deficits than in either of the previous stages, affecting performance profoundly. The size of the severe group was limited, with only 7 individuals (5 men and 2 women). Body functions, activity, and participation are all severely affected in this group. Strength is significantly worse compared with the moderate stage, and vibration sensation is severely abnormal (all participants reached the limit of measurability). Regarding balance, 5 of the 7 participants could stand independently with their feet apart and their eyes open; none could maintain their balance with their eyes closed (data not shown). The severe stage demonstrates the significant disability that individuals can reach, and because they have a normal life span, they must adapt to achieve an optimal quality of life. For individuals whose strength is equivalent to that of the severe groups, the TUG measure is the primary quantitative measure for evaluating their functional mobility status (Table 2C.).
Differences Between Women and Men
Among the 3 stages, there are distinct differences in the presentation between women and men. In the mild stage, women are less affected in strength and vibration and have little to no spasticity. Between the mild and moderate stages, the differences in clinical signs for men and women are more pronounced. There is an age difference of 10 years, which is consistent with reports of later onset of symptoms in women with AMN. 31 Vibration sensation for the men remains severely impaired between these stages. In contrast, vibration sensation for women in the moderate stage is significantly worse compared with the mild stage. These differences are notably fewer in the severe stage for age, body function, activity, and participation measures. This indicates a new finding that women may be as severely affected as men. These differences among the stages raise interesting questions to be addressed in future longitudinal studies related to the reports of later onset and slower progression in women.
Limitations
The participants in the severe group represent those people who have severe body function impairments but are still able to walk a minimal distance. Though this is a small group, it is representative of the progression of AMN and provides valuable information to the clinician. Because this disease is often recognized long after symptom onset, the participants in the study were diagnosed at variable times in their disease progression. Although the range and degree of functional deficits are quantified here, the data are only cross-sectional. Another consideration is that we did not formally determine reliability between the 2 testers, but 1 tester completed at least 95% of the measures. Despite extensive 1-on-1 training, this could contribute to variability in the measures. Longitudinal studies must be pursued to investigate the sensitivity of these measures. The extent that disease progression parallels biological expression of the disease and functional decline would be an important next step to evaluate in future studies.
Conclusion
The study shows that staging based on severity of weakness can characterize common deficits in body functions as well as activity and participation at each of 3 stages of AMN and can be used to direct evaluations. This staging strategy provides a practical framework for evaluating the severity of disability in individuals with AMN and could help clinicians develop more effective rehabilitative techniques. Because of the similarities in symptoms to other diseases such as MS and hereditary spastic paraparesis, the framework presented may apply to other neurodegenerative disorders as well.32,33,34
Footnotes
Declaration of Conflicting Interests
The authors declared no potential conflicts of interest with respect to the research, authorship, and/or publication of this article.
Funding
The authors received no financial support for the research, authorship, and/or publication of this article.