
Abstract
Background. The description of the natural course of recovery from a spinal cord injury (SCI) with spontaneous improvement of neurological, neurophysiological, and functional measures is an important prerequisite in appraising effects of upcoming interventional therapies. Objective. To describe the spontaneous evolution of motor-evoked potentials of the anterior tibial muscle (TA-MEP) and their relation to outcomes of lower extremity motor scores (LEMS) and walking function in patients recovering from an acute SCI. Methods. TA-MEPs were assessed in 255 SCI subjects within 5 time intervals throughout the first year after SCI with combined neurological and functional measures. Tibial nerve conduction studies were performed to screen for peripheral nerve damage. Results. TA-MEP allowed stratification of SCI according to lesion severity and outcome. As MEP amplitudes increased over 12 months after SCI, this was paralleled by a significant improvement of LEMS and walking function. TA-MEP latencies remained usually stable. Conclusion. Clinical outcome and walking function after SCI can be predicted independent of clinical measures by assessment of TA-MEP reflecting corticospinal tract integrity.
Introduction
Electrophysiological testing, for example, by motor-evoked potentials (MEPs) induced with transcranial magnetic stimulation (TMS) allows an objective assessment of the integrity of human motor circuitry comprising both the corticospinal tract (CST) and peripheral motor nerves. It allows noninvasive assessment of the severity and the level of a spinal cord injury (SCI) and helps predict the long-term outcome.1,2 The amplitude of the MEP not only reflects the integrity of the CST but also depends on excitability of motor cortex, spinal motoneurons, and on axonal damage of nerve roots or peripheral motor nerves. 3 Latencies of the MEPs mainly reflect conduction of the fastest descending motor fibers. In earlier cross-sectional studies, no significant change of MEP measures has been shown during the course of rehabilitation. 1 A recent analysis from a small subset of the data acquired for the EM-SCI (European Multicenter Study about Spinal Cord Injury) database showed a significant increase of MEP amplitudes after injury in tetraplegic AIS D subjects (motor–sensory incomplete SCI subjects according to the American Spinal Injury Association Impairment Scale) but failed to relate this increase to changes in clinical or functional scores. 4 The latencies in incomplete SCI during a 1-year follow-up remained unchanged indicating that no obvious tract remyelination occurred. From these and other earlier studies it was concluded that there is basically no regeneration or repair of spinal nerve tissue after SCI in humans. 1 MEP testing was assumed to reflect only changes within the remaining intact central and peripheral motor system, which may be because of adaptive mechanisms such as increase of synaptic efficacy and transmission.
MEP might be used to quantify changes due to recovery from an SCI or therapies directed at spinal cord repair. 5 MEPs need to be validated since only a few studies with small case numbers have been performed. The main goal of this study was to describe the spontaneous recovery of MEP from the leg muscles and to correlate MEP to clinical scores to evaluate their potential as an objective, independent assessment of motor function. We included a large patient sample that allows representative statistical testing and differentiation between subgroups of the patient population. MEPs were related with clinical and functional outcome within the first year after SCI. If the natural course of MEP recovery was known for a particular subgroup of SCI, then MEP changes exceeding this known range could be of special value to objectively track treatment-induced effects in the corticospinal and peripheral motor system in clinical trials.
Methods
Database and Subject Selection
This prospective study included 255 subjects enrolled in 8 centers within the framework of the “European Multicenter Study about Spinal Cord Injury” (EM-SCI; www.emsci.org) between December 2001 and July 2008. Subjects had suffered an acute traumatic (n = 242), hemorrhagic (n = 3), or ischemic (n = 10) SCI. The study was performed in accordance with the Declaration of Helsinki and approved by the local ethics committee of each participating center. All subjects were instructed about the aim of the study and gave their informed consent.
Data on neurological, neurophysiological, and functional status were prospectively collected within the first 15 days (“15D”) and successively at 1 month (16-40 days, termed “1M”), 3 months (70-98 days, termed “3M”), 6 months (150-186 days, termed “6M”), and 12 months (300-400 days SCI, termed “12M”) after injury. Only SCI subjects with repeated assessments were included (2-3 measures 49%, 4-5 measures 51%). Neurological examinations were performed by clinicians trained in SCI rehabilitation according to the ASIA classification standards. The functional assessments were scored by physical and occupational therapists and/or nurses experienced in the field of SCI. According to the severity of the neurological deficit as assessed according to the International Standards for Neurologic Classification in Spinal Cord Injury (ISNCSCI), 6 the subjects were grouped as AIS A (motor–sensory complete), AIS B (motor complete, sensory incomplete), AIS C (motor–sensory incomplete), and AIS D (motor–sensory incomplete, average of key muscles below the lesion show movement against gravity) according to AIS standards. 7
Neurophysiological recordings were performed by independent neurologists. To exclude lumbar radicular or cauda lesions, SCI subjects were only included if their neurological level of lesion was between the segments C2 and T11 according to the ISNCSCI impairment scale. Lesion level was determined at first AIS classification. Nerve conduction studies (NCS) of tibial nerves of both legs were performed in all subjects using a conventional electromyography machine to minimize by exclusion the likelihood of conus/cauda lesions, accompanying peripheral nerve injury, and preexisting neuropathy, which would have influenced the parameters of MEPs. Exclusion criteria were (a) a compound motor action potential (cMAP, derived from abductor digiti minimi and abductor hallucis muscles) <1 mV (Figure 1) or (b) a loss of amplitude over time greater than 50% as could be expected to result from Wallerian degeneration if motor neuron or nerve root damage had occurred.
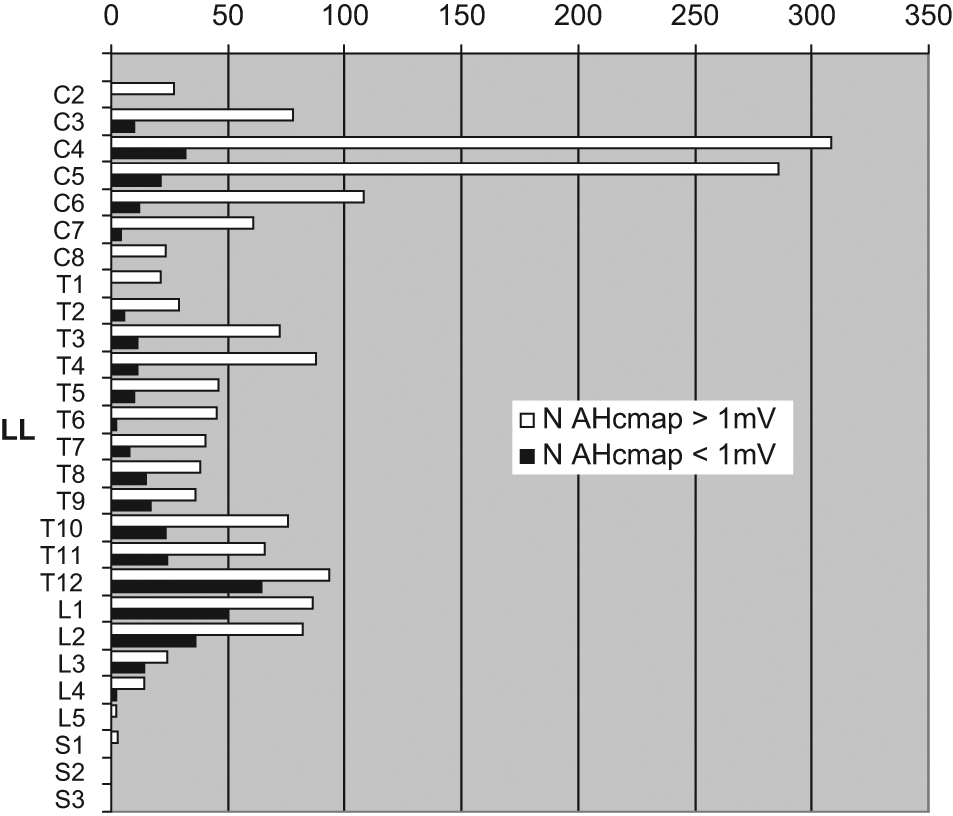
Number of posterior tibial nerve conduction studies (all stages). A relative increase of occurrence of AHcmap < 1 mV can be observed below Th11, probably because of conus and/or cauda lesions. Abbreviations: LL, level of lesion; AHcmap, abductor hallucis compound muscle action potential.
Subjects suffering from an acute accompanying head trauma and/or other neurological disorders were also excluded.
Assessment of Lower Extremity Motor Score
The examination was performed according to the standards of the ISNCSCI protocol 7 to determine the level of lesion, the motor deficit and the completeness of injury. In the lower extremities, 5 key muscles of each leg were manually tested, individually scored (0 = total paralysis, 1 = palpable or visible contraction, 2 = active movement with gravity eliminated, 3 = active movement, against gravity, 4 = active movement, against some resistance, 5 = active movement, against full resistance), and the sum of the 10 muscles expressed as lower extremities motor score with a total maximum of 50 (LEMS X/50). Each muscle group represents a spinal segment (hip flexors, L2; knee extensors, L3; ankle dorsiflexors, L4; long toe extensors, L5; ankle plantar flexors, S1). 8
Assessment of Walking Function
The 10 meters walking test (10MWT; time in seconds required to walk 10 m) was applied as a functional outcome measure. 4 The patients performed this test with their most often used assistive device and/or brace. The achieved walking capacity at the final assessment was related to the recovery of LEMS and ISNCSCI impairment scale (AIS).
Electrophysiological Recordings
Motor evoked potentials were recorded by applying single-pulse TMS using a routine circular coil magnetic stimulator. For recording MEP from the tibialis anterior (TA) muscle, the stimulation hot spot was determined starting about 4 cm rostral of Cz (vertex). 9 Optimal scalp position was determined at each examination stage by first stimulating the scalp at Cz and then stepwise optimizing coil position to obtain a maximum TA MEP following standard published procedures. 10 Motor threshold was determined and MEPs were recorded at 1.2 times motor threshold while all subjects with sufficient muscle force slightly activated their TA muscles (about 10% of maximum force). Patients who were not able to produce force were asked to exert as much volitional innervation as possible. The duration of the monophasic transcranial single-pulse stimuli was 100 µs. The sample frequency was 2000 Hz, and a band-pass filter was set at 30 Hz to 1 kHz. TMS was delivered every 5 to 6 seconds. Three 11 to 5 representative TA-MEPs at the desired stimulus intensity were applied if there was a well-defined response and up to 10 stimuli were delivered if there was a visible but poorly defined muscle response to optimize 3 responses stored offline for further analysis. 12 The onset of the fastest response from 4 repeated MEP trials was determined as the onset latency. The MEP amplitude was calculated from baseline to the negative peak (ie, the highest negative peak in polyphasic potentials) for the largest response out of 4 trials. TA-MEP latencies and amplitudes from both sides were analyzed. Acquisition of NCS and TMS data from all participating centers were performed as described by Rossini et al 9 and DeLisa et al, 13 and the data were centrally read by a blinded neurophysiologist at the lead center (Zurich) to ensure compliance with these standards and to reduce interrater variability. Normal values of TA-MEP had previously been recorded from healthy subjects and were used as a reference. 10
Statistics
Descriptive statistics
Data were analyzed descriptively and divided into different groups (Figure 2) of MEP impairment as retrieved during follow up and termed as follows: abolished MEP (aMEP) where MEP remained abolished in all assessment stages (very acute to chronic); reappearing MEP (rMEP) where at the initial recordings MEP were abolished but reappeared consistently in at least 1 out of 4 possible follow-up examinations until stage “chronic” (see the Results section); inconsistent MEP (iMEP) where patients occasionally (ie, in at least 1 out of 5 possible measurements) showed MEP responses that, however, were rather inconsistently retrievable throughout the follow-up; mildly or severely deteriorated MEP (mdMEP, sdMEP) with either normal (mdMEP) or delayed latencies (sdMEP). A similar approach was used previously to describe the evolution of tibial nerve somatosensory evoked potentials (tSSEP) after SCI. 14 The cutoff value for the presence/absence of an MEP was a reproducible potential with an amplitude of at least 100 µV above background electromyographic activity.9,15,16 MEP latencies were classified as having a normal or delayed corticomuscular latency according to the body height–dependent normative values of the University Hospital Balgrist. MEPs were considered delayed if their latency was prolonged by more than 2 standard deviations above normal (MEP normal latency = 0.199 × height − 6.966). All data are given as means and standard deviations (SD), unless specified otherwise.
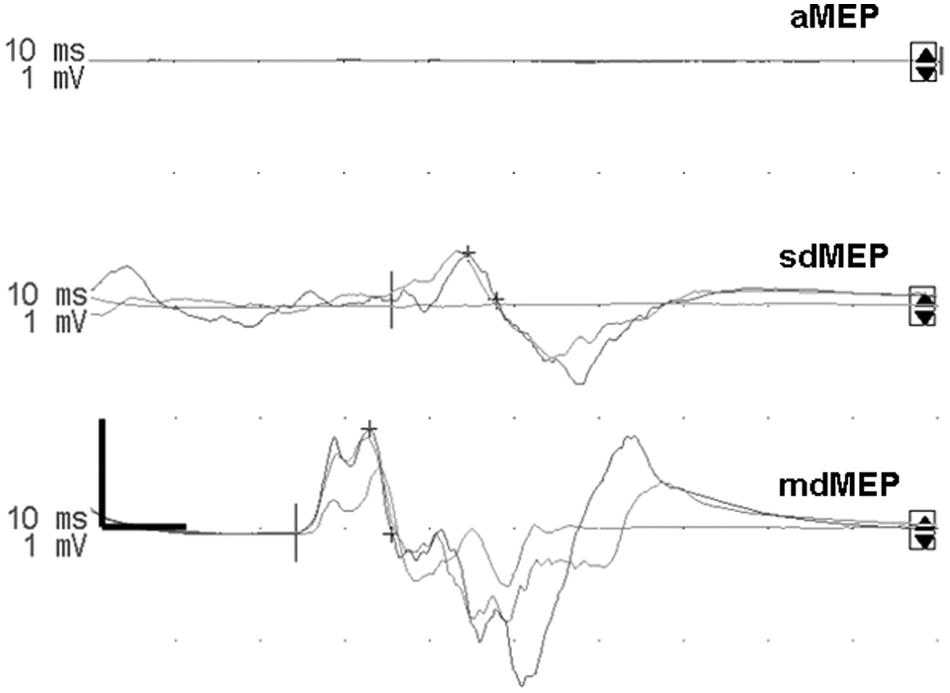
Tibialis anterior motor-evoked potential (TA-MEP) waveforms. Abbreviations: aMEP, abolished MEP; sdMEP, severely deteriorated MEP; mdMEP, mildly deteriorated MEP.
Linear mixed models (LMMs): Assessing change over time
LMM procedure was applied to adequately treat the problem of missing values. Different parameters such as MEP amplitude, latency, motor scores, LEMS and 10MWT were investigated for effects of time after SCI (15D, 1M, 3M, 6M, 12M, termed “stage”), group distribution (aMEP, sdMEP, mdMEP, rMEP and iMEP, termed “group”) as well as for the interaction of both (“group by stage interaction”). A value of P < .05 was regarded significant whereas P < .1 was regarded as trend. Post hoc tests were performed whenever the analyses of “stage,” “group,” or “group by stage” revealed significant overall effects. All analyses were performed with SPSS 14.0 for Windows.
The statistical approach was chosen analogous to a similar evaluation done in this group of SCI subjects. 14 Electrophysiological, functional, and neurological data from the left and the right leg was combined for LMM analyses since in the paired-samples t test, no significant differences between the right and the left leg were found. Independent samples Kruskal–Wallis test was performed to analyze composition/distribution of AIS according to stratification by MEP criteria.
For the evaluation of the changes over time (stage intervals) and correlation of changes between LEMS and MEP amplitudes, we subtracted data from earlier stages from corresponding data in later stages. Pearson correlations between LEMS stage intervals and MEP stage intervals were calculated.
Prognosis
To evaluate the prognostic value of MEP assessment, a Pearson χ2 test and crosstabulations (amplitude > 0 mV/amplitude = 0 mV; AIS at last examination “D”/AIS at last examination “A-C”) were performed.
Results
Patients’ demographics are shown in Table 1. The distribution of axonal nerve damage by means of reduced abductor hallucis cMAP was predominant at levels of lesion T12–L2 (Figure 1) and therefore, these were excluded.
SCI Subjects Demographics and Outcome of ASIA Impairment Scale (AIS) Within the Different Groups of Spinal Cord Damage as Defined by MEP Recordings at 1-Year Follow-up
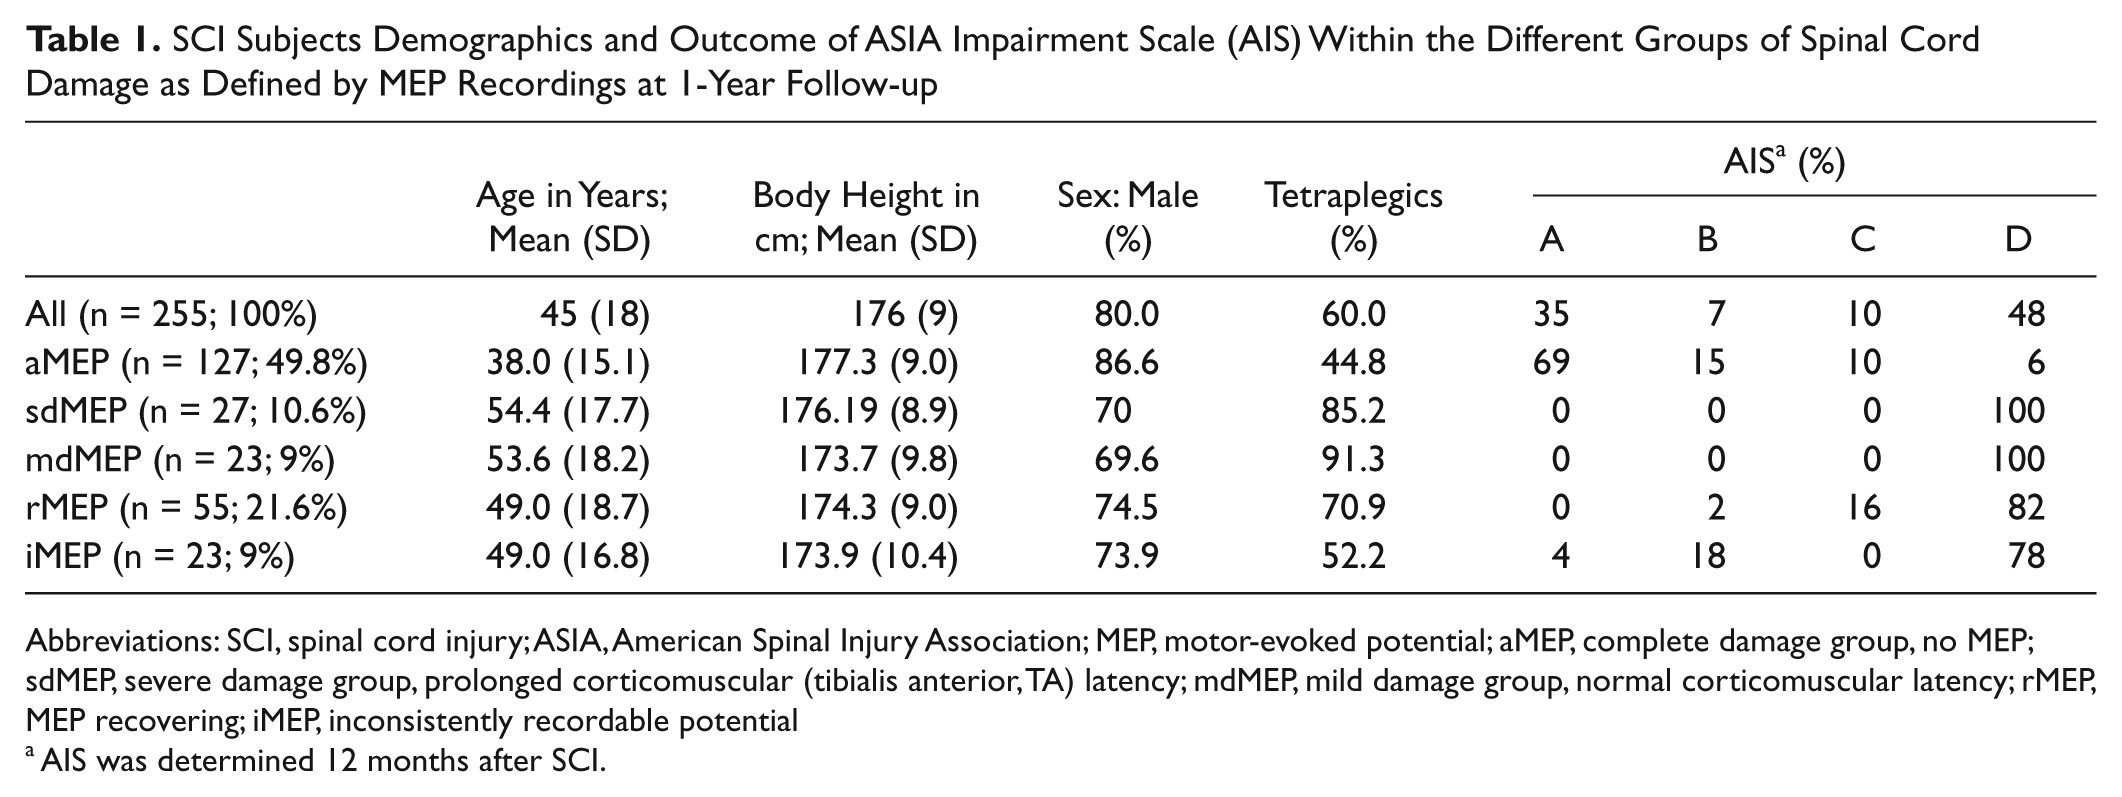
Abbreviations: SCI, spinal cord injury; ASIA, American Spinal Injury Association; MEP, motor-evoked potential; aMEP, complete damage group, no MEP; sdMEP, severe damage group, prolonged corticomuscular (tibialis anterior, TA) latency; mdMEP, mild damage group, normal corticomuscular latency; rMEP, MEP recovering; iMEP, inconsistently recordable potential
AIS was determined 12 months after SCI.
Group Allocation
Data were divided into 5 different groups according to the severity of MEP impairment as retrieved during follow-up (Figure 3 and Table 1). In 127 SCI subjects TA-MEPs were completely abolished (aMEP). In 23 cases, an MEP was recordable at all assessments and data were classified as “mildly deteriorated” as the latency of TA-MEP was normal at the first assessment (mdMEP). In 27 cases, the latency of TA-MEP was initially delayed (“severely deteriorated,” sdMEP). Initially abolished but consistently “reappearing” MEP in the follow-up examinations were found for 55 cases (rMEP), 16 of which had a normal latency by the last completed assessment. In the rMEP group, 38.2 % of the potentials reoccurred at 1M, 27.3% at 3M, 18.2% at 6M, and 16.4% at 12M. For 23 cases, ”inconsistently” recordable potentials (iMEP) were found throughout the follow-up, of which only 7 showed normal latencies. In the iMEP group, the first MEP could be recorded at 15D in 21.7% of cases, at 1M in 52.2% of cases, at 3M in 17.4% of cases, and at 6M in 8.7% of cases.
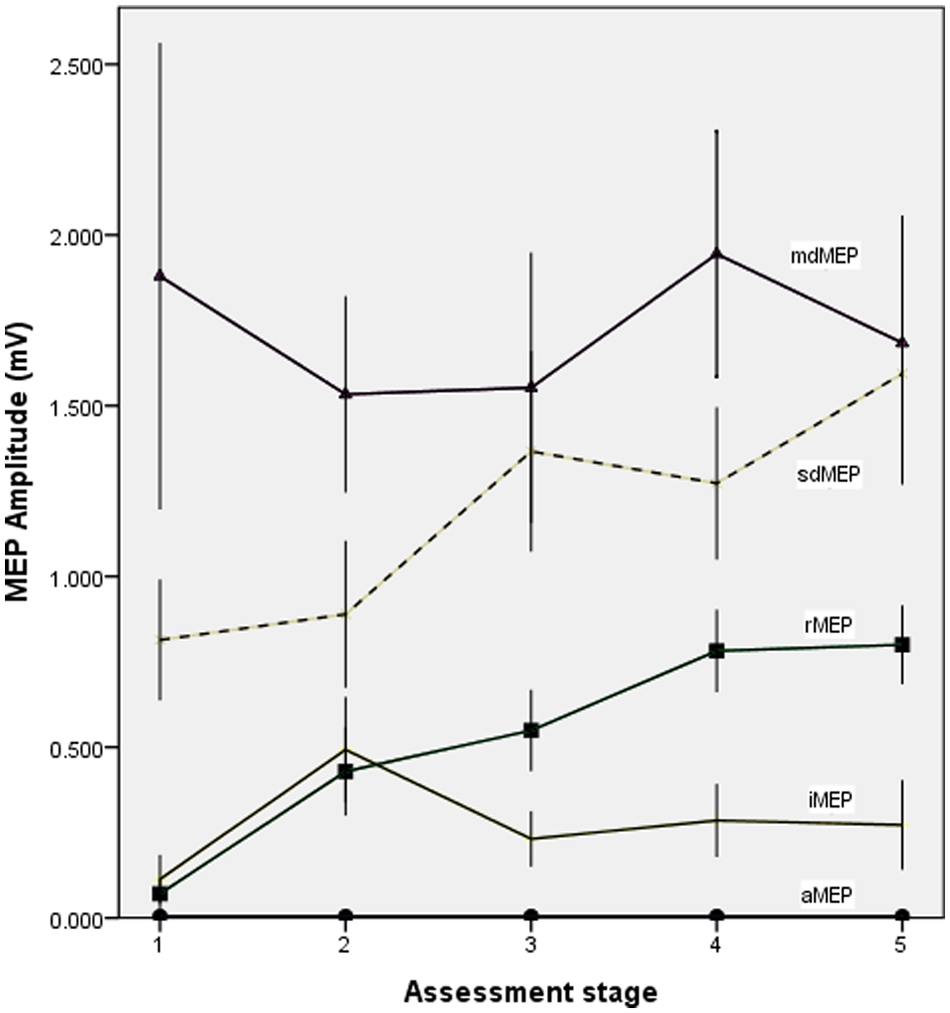
Evolution of mean tibial motor-evoked potential (MEP) amplitudes of spinal cord injury (SCI) subjects with mildly deteriorated (md), severely deteriorated (sd), reappearing (r), inconsistent (i), and abolished (a) MEP, indicating a distinction between SCI subjects with prolonged and normal MEP latencies; error bars represent standard error.
Means and Standard Deviations of LMM Analyses Listed for Stages
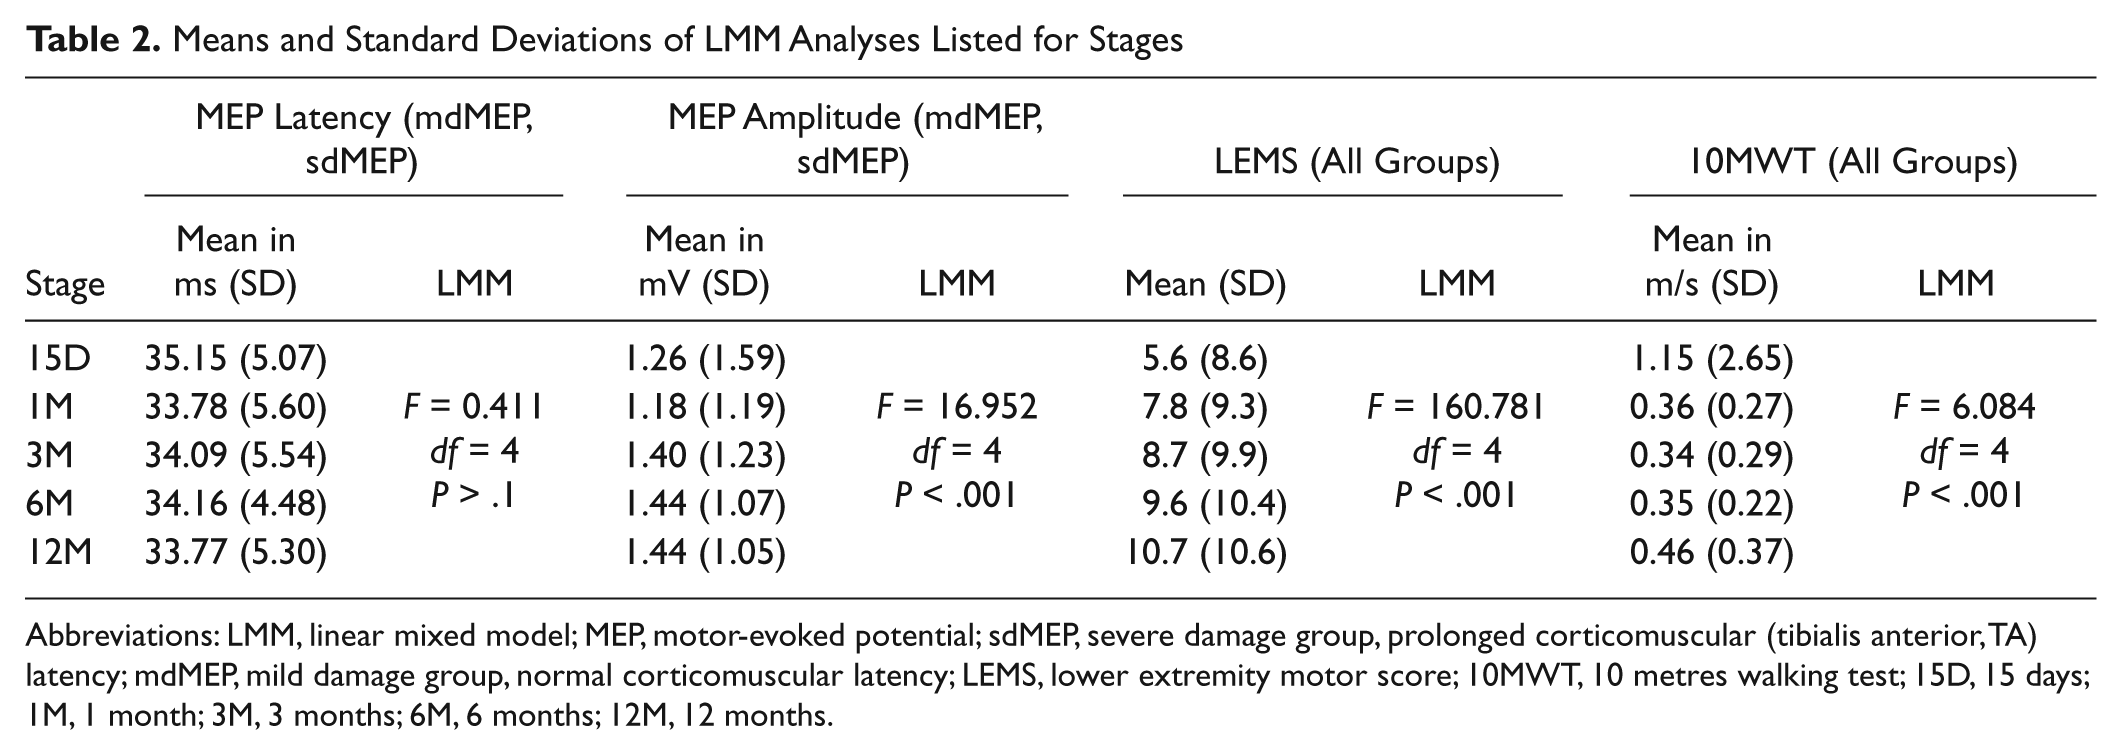
Abbreviations: LMM, linear mixed model; MEP, motor-evoked potential; sdMEP, severe damage group, prolonged corticomuscular (tibialis anterior, TA) latency; mdMEP, mild damage group, normal corticomuscular latency; LEMS, lower extremity motor score; 10MWT, 10 metres walking test; 15D, 15 days; 1M, 1 month; 3M, 3 months; 6M, 6 months; 12M, 12 months.
Means and Standard Deviations of LMM Analyses Listed for Group by Stage Interaction a
Abbreviations: LMM, linear mixed model; MEP, motor-evoked potential; LEMS, lower extremity motor score; 10MWT, 10 metres walking test; aMEP, complete damage group, no MEP; sdMEP, severe damage group, prolonged corticomuscular (tibialis anterior, TA) latency; mdMEP, mild damage group, normal corticomuscular latency; rMEP, MEP recovering; iMEP, inconsistently recordable potential; 15D, 15 days; 1M, 1 month; 3M, 3 months; 6M, 6 months; 12M, 12 months.
Statistical significant differences indicated by brackets.
Evolution of Motor-Evoked Potential Latencies and Amplitudes
Because of the definition of group criteria, effects of stage (time since SCI) could only be evaluated for 2 of the 5 subject groups (mdMEP and sdMEP). LMM analysis of MEP latencies revealed no overall effect of stage (F = 0.411, df = 4, P > .1; Table 2) but significant shorter latencies for the mdMEP group as compared with sdMEP (main effect of group mdMEP vs sdMEP: F = 45.666, df = 1, P < .001) as well as a significant group by stage interaction (F = 6.098, df = 1, P < .05, Table 3). When analyzing each group in a separate model, there was a significant shortening of latencies over time for the sdMEP (effect of stage: F = 3.271, df = 4, P < .05) but not for the mdMEP group. A significant decrease of latency in the sdMEP group was observed between 12M and all earlier stages (Table 3).
For amplitudes, we found a significant main effect of stage (F = 16.952, df = 4, P < .001; Table 2) with larger amplitudes in later stages, as well as a trend of group allocation (mdMEP vs sdMEP), with greater amplitudes in the mdMEP group (F = 3.024, df = 1, P < .1), and a significant group by stage interaction (F = 16.888, df = 4, P < .001; Figure 3, Table 3). Corresponding to the latencies, subgroup analysis revealed a significant increase of MEP amplitudes in the sdMEP group (F = 4.053, df = 4, P < .01) but not in the mdMEP group. A significant increase of MEP amplitude in the sdMEP group was shown by post hoc analysis between 15D and 3M, 15D and 6M, 15D and 12M, 1M and 6M, and 1M and 12M (Table 3).
Evolution of Lower Extremity Motor Scores
Significant main effects of stage (F = 160.781, df = 4, P < .001) and group (F = 54.534, df = 4, P < .001) as well as a significant group by stage interaction (F = 142.433, df = 1, P < .001) were found for the LMM for LEMS of all 5 groups (see Tables 2 and 3). LEMS of aMEP SCI subjects were significantly and considerably lower than those of all other groups (P < .001). LEMS of rMEP group were significantly lower than those of the sdMEP (P < .005) and the mdMEP group (P < .001). There was a trend toward lower LEMS in the sdMEP than in the mdMEP group (P < .1). iMEP subjects showed significantly lower LEMS than mdMEP subjects (P < .01) but not significantly lower than sdMEP subjects. A separate analysis for each subgroup revealed a significant increase of LEMS in all groups. In aMEP (F = 15.836, df = 4, P < .001) and rMEP subjects (F = 89.883, df = 4, P < .001), LEMS significantly increased between 15D and all later stages, 1M and all later stages, and 3M and all later stages (Table 3). In rMEP subjects, there was also a trend toward an increase of LEMS between 6M and 12M. In sdMEP subjects (F = 44.422, df = 4, P < .001), the LEMS increase was significant between 15D and all later stages, 1M and all later stages and between 3M and 12M. In mdMEP subjects (F = 14.933, df = 4, P < .001), the increase of LEMS was significant between 15D and all later stages and 1M and all later stages. In iMEP subjects, the increase was significant between 15D and all later stages, 1M and all later stages, 3M and 12M with a trend toward increase between 3M and 6M.
Motors scores of the legs were significantly correlated with MEP amplitudes (right leg, r = .619, P < .001; left leg, r = .601, P < .001) and TA-MEP groups were indicative of the extent of motor and functional recovery. For the evaluation of the changes over time (stage intervals) and correlation of changes between LEMS and MEP amplitudes, we subtracted data from earlier stages from corresponding data in later stages. Significant correlations for stage interval changes were found in (15D toward 1M, r = .365, P = .001; 15D toward 6M, r = .364, P < .005; 15D toward 12M, r = .608, P < .001; 1M toward 3M, r = .200, P < .05; 1M toward 6M, r = .216, P < .05; 1M toward 12M, r = .298, P = .001; 6M toward 12M, r = .251, P < .01).
Evolution of the 10MWT
The LMM including all 5 groups exhibited a significant effect of stage (F = 6.084, df = 4, P < .001; Table 2) as well as group (F = 7.193, df = 4, P < .001) and a trend toward group by stage interaction (F = 3.411, df = 1, P < .1; Table 3). Time needed to walk 10 m was significantly longer in the aMEP group than in all other groups (P < .05); it was significantly longer in rMEP than in sdMEP and mdMEP groups (P < .05), but significantly differed neither between the rMEP and the iMEP group nor between subjects with normal (mdMEP) or those with delayed MEP latencies (sdMEP). Subgroup analysis showed a significant decrease of time needed to walk 10 m in the rMEP group (F = 2.935, df = 4, P < .05) between 1M and 6M and 3M and 12M as well as in the sdMEP group (F = 3.134, df = 4, P < .05) between 1M and 12M and 3M and all later stages and in the iMEP group between 3M and 12M (Table 3).
AIS Score Distribution
For MEP group distribution among AIS scores (as determined 12 months after SCI) see Table 1. In the group with inconsistently recordable MEP (iMEP), 1 patient (4%) was classified as AIS A because of a missing anal sensation while the MS in both legs was comparable to that of other AIS D subjects. Kruskal–Wallis test revealed significant differences in AIS distribution according to stratification of MEP criteria (P < .001).
Prognosis
When assessed at stage “very acute” (15 days), all SCI subjects who eventually became AIS A-C presented without TA-MEP (amplitude = 0 mV). Overall, 61.2% of SCI subjects who became AIS D had no TA-MEP initially whereas 38.8% of them had a TA-MEP (amplitude >0 mV) at this earliest assessment. The positive predictive value (PPV) was 62%. The negative predictive value (NPV) was 100% (Pearson χ2: P < .001).
A missing TA-MEP at stage “acute 1” (1 month) was found in 98.2% of SCI subjects who eventually became AIS A-C whereas only 1.8% of these SCI subjects had a TA-MEP amplitude >0 mV. Of AIS D patients, 44.2% were missing TA-MEP amplitude whereas 55.8% of them had a TA-MEP. The PPV was 71.8%. The NPV was 96.4% (Pearson χ2 test: P < .001).
Discussion
This study examined the evolution of TA-MEP in relation to clinical and functional outcomes over the first year after traumatic SCI. The findings might be representative as the demographics of the patient sample of 255 SCI patients followed over a 1-year time period are in accordance with previous epidemiological studies regarding completeness and level of injury, ratio between men and women, and distribution of paraplegic and tetraplegic SCI subjects.17-20
To date, there have been extensive analyses pertaining to neurological and functional improvement following an SCI.4,21,22 However, these measures are not objective and allow no insight in the underlying mechanisms of recovery. A major incentive of this study was to provide insight in the physiologic properties of spinal motor pathways subserving volitional movement caudal to the injury site and how they change over time. 2
Limitations
Transcranial magnetic stimulation stimulus strengths may not activate all corticospinal neurons that are capable of conducting activity through a region of SCI. 23 For effectively stimulating lower limb cortical representations that originate deep within the central sulcus, the use of dual-cone coil 24 would have been more appropriate.
Since this is a multicenter study, conductivity measures might be influenced by different examiners and different stimulators at the different study centers.
Root damage and peroneal compression at the fibular head might have contributed to TMS amplitude findings. According to the distribution of pathological AHcmap a direct conus medullaris and cauda equina damage as is witnessed by the sharp increment of the number of pathological AHcmaps (Figure 1) is more likely below the level T11. Therefore, all cases below level T11 were excluded. By additional peroneal nerve assessment through M-waves of the TA muscle, a more precise assessment of the segmental excitability or motor neuron damage might have been obtained and a better normalization of the data with respect to interindividual amplitude variability may have been achieved. However, since significant differences were obtained for MEP amplitudes with a consistent increase over time mainly because of the sdMEP and rMEP groups (Tables 2 and 3, Figure 3), we believe that this rather underscores the robustness of results.
The clinical outcome of the rMEP subjects was worse than that of subjects with recordable MEP present from the beginning on, indicating more severe spinal cord damage in the former. Likewise, the phenomenon of inconsistent MEPs (iMEP) probably reflects a limitation of the method. MEP amplitude strongly depends on voluntary contraction of the target muscles 25 and they are highly variable when repeatedly assessed. Controlling for torque generation and motor task might establish a reliability of TA-MEP amplitudes that is more sufficient for longitudinal assessments in motor incomplete SCI. 10 Again, a stronger magnetic stimulator and use of a dual-cone coil could have helped overcome these problems.
Voluntary contraction of the target muscles was not possible in AIS A patients. Therefore, it is likely that the instruction to slightly activate TA muscle about 10% of maximum force and the alternative instruction that patients who were not able to produce force should exert as much volitional innervation as possible lead to relevant differences in motor neuron facilitation. Furthermore, in the group of patients with absent MEPs, the damaged CST could have a threshold too high to be activated even with a maximal TMS pulse. If this was the case, a lowering of the threshold (even if still higher than 100% of magnetic stimulator output) could be associated to some neurological improvement, which in this case would have evaded detection. Threshold monitorings should be performed in future longitudinal studies.
Specific Changes of MEP Parameters During 1-Year Evolution After SCI
An increase in amplitude but no shortening of latencies were described previously both in acute4,26 and in chronic incomplete SCI patients undergoing intensive rehabilitation by treadmill training. 27 Underlying mechanisms may be changes in spinal impulse conductivity such as synaptic transmission efficiency or increasing corticospinal or spinal excitability. A gradual strengthening of synaptic interconnections between distant spinal segments was described after several months following SCI. 28 Also, some fiber remyelination of damaged spinal tract fibers could be responsible. 4 A minor decrease of MEP latency was found limited to the sdMEP subgroub, which probably was not described in earlier publications because of smaller sample sizes and a different stratification. Moreover, latencies of the MEPs mainly reflect conduction in fast descending motor fibers. Oligosynaptic pathways that were shown to arise by collateral sprouting in rats 29 are likely not assessed as they may not contribute to the highly synchronized impulse transmission giving rise to the MEP. On the other hand, latency shifts result in chronodispersion of transmission in motor tracts and may contribute to MEP amplitude reduction. These specifics need to be taken into account when attempting to track treatment-induced effects in the corticospinal system by MEP amplitude changes.
In longitudinal studies of tSSEP in SCI, increased permeability of blood vessels, inflammatory mechanisms, edema, and swelling have been suggested to influence both amplitudes and latencies of evoked potentials 14 and similar mechanisms were assumed for the motor tracts.2,30 Cessation of spinal shock with resulting increase of spinal excitability as well as resolution of neuroapraxia could explain the small decrease of latencies and the recovery of amplitude between assessment 15D and 3M. It could also be argued that the effects observed over time are caused by some spontaneous remyelination, 31 collateral sprouting, 32 or reorganization/plasticity 33 of existing pathways. Since all SCI subjects received rehabilitation training, use-dependent plasticity cannot be excluded. However, in this case, it remains open why conduction velocity and amplitude improved only in certain subgroups (Figure 3). Age is unlikely to be an explanatory factor since the average age of the sdMEP and mdMEP SCI subjects did not differ.
MEP Parameters for Objective Early Classification in SCI
In earlier studies, case numbers were small 34 or the classification of subjects was primarily based on the neurological definition (AIS A-D) and not related to the integrity/ impairment and/or reoccurrence of MEP. 1 MEP amplitudes seem to allow an objective assessment of the severity of corticospinal damage and thus a prediction about the recovery of function mediated by the CSTs. This is supported by the correlation of LEMS changes with MEP amplitude changes after a SCI. Furthermore, the walking function was highly related to MEP recovery (see Figure 4). In contrast, SCI subjects with an initially absent MEP had a poor outcome in about two thirds of cases. The classification based on the presence, impairment, and absence of TA-MEP allows distinguishing different levels of recovery rates, LEMS, and walking ability and is independent of patients’ compliance. Since some aMEP SCI subjects with no improvement of impulse conductivity in the CST may nevertheless exhibit some neurological improvement, the temporal coincidence of improvements in LEMS, 10MWT, and TA-MEP does not imply a causal relationship.
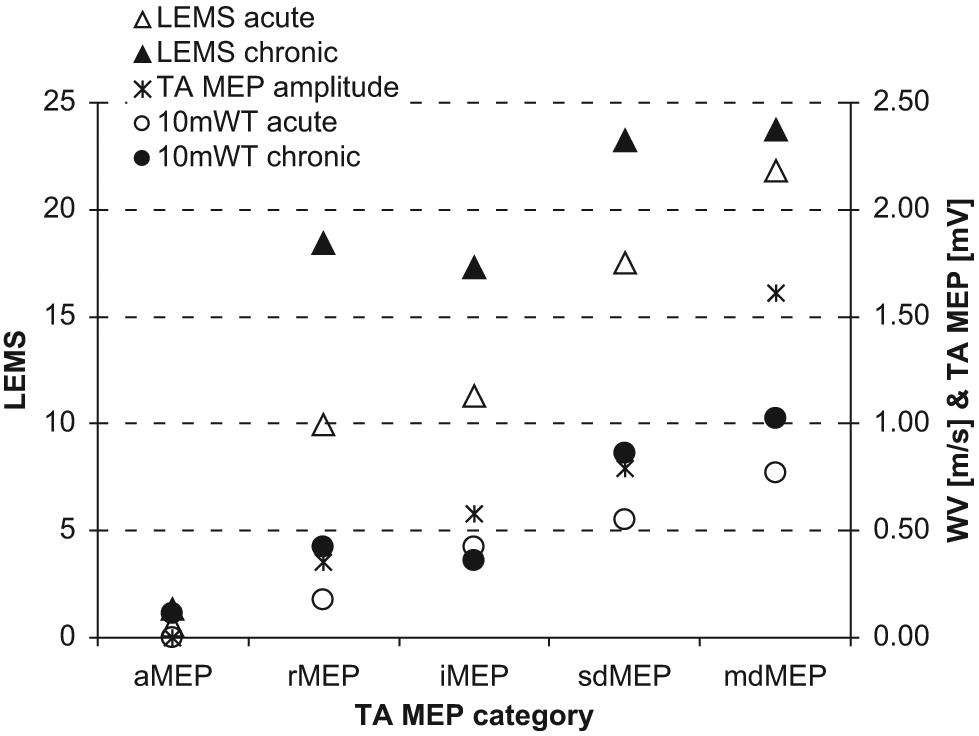
Functional outcome according to TA-MEP classification: Distribution of grand mean LEMS (triangles, left ordinate) and walking velocity (circles, right ordinate) as stratified by TA-MEP categories. For comparison, the TA-MEP amplitude (asterisks, right ordinate) is also included. Open symbols represent the acute state whereas filled symbols show the corresponding data from the chronic state. Similar improvement of clinical status and function can be observed for the groups with defective TA-MEP whereas recovery is smaller for the mdMEP group. This stratification indicates the predictive value of TA-MEP. Abbreviations: TA-MEP, tibialis anterior–motor-evoked potential; LEMS, lower extremity motor scores; 10MWT, 10 meters walking test; aMEP, abolished MEP; rMEP, reappearing MEP; iMEP, inconsistent MEP; mdMEP, mildly deteriorated MEP; sdMEP, severely deteriorated MEP.
Conclusion
The validation of neurophysiological measures is an important prerequisite in appraising effects of interventional therapies. In this study, TA-MEPs, neurological measures, and functional measures in a large group of SCI subjects were assessed throughout the first year after SCI. MEP amplitudes increased over 12 months after SCI and this was paralleled by a significant improvement of LEMS and walking function. Independent of clinical measures, clinical outcome and walking function after a SCI can be predicted by the assessment of TA-MEPs. Although this description of a large cohort of SCI could show that neurophysiological and clinical recovery over time are related, the underlying mechanisms of recovery following incomplete human SCI remain elusive. Thus, further analysis must be aimed at understanding the restorative mechanisms in the human spinal cord. Such refined analysis should use refined noninvasive neurophysiological methods to eventually provide evidence on how central conduction through the injured segments of the spinal cord is improved following spontaneous or treatment-induced recovery.
Footnotes
Acknowledgements
We would like to express our thanks to all SCI centers who participate in the European Multicenter Spinal Cord Injury (EM-SCI) project, especially the following clinics, including staff: Stiftung Orthopädische Universitätsklinik Heidelberg; Krankenhaus Hohe Warte Bayreuth, Sint Maartenskliniek, Nijmegen; Raymond Poincaré University Hospital, Garches; SRH Klinikum, Karlsbad-Langensteinbach; Trauma Center Murnau, Berufsgenossenschaftliche Kliniken Bergmannstrost, Halle; University and Rehabilitation Clinics, Ulm; Berufsgenossenschaftliche Unfallklinik, Frankfurt am Main; Spinal Cord Injury Center, University Hospital Balgrist, Zurich.
Declaration of Conflicting Interests
The author(s) declared no potential conflicts of interest with respect to the research, authorship, and/or publication of this article.
Funding
The author(s) disclosed receipt of the following financial support for the research, authorship, and/or publication of this article:
This study was supported by the International Institute for Research in Paraplegia (IFP) Zurich.