
Abstract
Background. Given that traumatic brain injury (TBI) results in chronic alteration of baseline cerebral perfusion, a perfusion functional MRI (fMRI) method that dissociates resting- and task-related cerebral blood flow (CBF) changes can be useful in noninvasively investigating the neural correlates of cognitive dysfunction and recovery in TBI. Objective. The authors used continuous arterial spin-labeled (ASL) perfusion fMRI to characterize CBF at rest and during sustained-attention and working-memory tasks. Methods. A total of 18 to 21 individuals with moderate to severe TBI and 14 to 18 demographically matched healthy controls completed 3 continuous 6-minute perfusion fMRI scans (resting, visual sustained attention, and 2-back working memory). Results. For both tasks, TBI participants showed worse behavioral performance than controls. Voxelwise neuroimaging analysis of the 2-back task found that group differences in task-induced CBF changes were localized to bilateral superior occipital cortices and the left superior temporal cortex. Whereas controls deactivated these areas during task performance, TBI participants tended to activate these same areas. These regions were among those found to be disproportionately hypoperfused at rest after TBI. For both tasks, the control and TBI groups showed different patterns of correlation between performance and task-related CBF changes. Conclusions. ASL perfusion fMRI demonstrated differences between individuals with TBI and healthy controls in resting perfusion and in task-evoked CBF changes as well as different patterns of performance-activation correlation. These results are consistent with the notion that sensory/attentional modulation deficits contribute to higher cognitive dysfunction in TBI.
Keywords
Introduction
Traumatic brain injury (TBI) affects 1.5 million people each year in the United States alone and frequently results in debilitating and persistent cognitive impairment. 1 Functional neuroimaging may provide insight into the nature of the initial dysfunction of neural networks subserving specific cognitive functions, the adaptive neurocognitive processes associated with behavioral recovery, and, ultimately, mechanistically distinct patient subgroups who may benefit from different treatment interventions.2,3
Functional neuroimaging research has been conducted to understand the neural mechanisms underlying cognitive and motor dysfunction and recovery in TBI.4-7 The most frequent finding is that individuals show altered activation patterns while performing higher cognition tasks, particularly in the prefrontal areas.8-14 Because of the complex neuropathological consequences of TBI, however, researchers have experienced difficulties in accurately measuring and interpreting brain activity in this population. One such challenge comes from the fact that TBI results in chronic alterations of baseline cerebrovascular parameters.15-18 For example, subtraction-based hemodynamic contrasts are not always clear regarding whether group differences or condition differences are caused by differences in baseline activity and the magnitude of task-evoked activation. In fact, neuroimaging researchers have increasingly emphasized the importance of measuring an absolute baseline to better interpret task-related activation of blood oxygenation level–dependent (BOLD) functional MRI (fMRI).19,20
Arterial spin-labeled (ASL) fMRI21,22 quantifies cerebral blood flow (CBF), allowing one to explicitly incorporate a resting baseline in the experimental design. In the chronic stage of TBI, measures of CBF can serve as indirect indicators of neuronal integrity and function. 16 Despite its potential usefulness, ASL fMRI has not been used to study higher cognitive dysfunction in TBI. Limited spatial resolution, relative difficulty in implementation, and the frequent presence of ferromagnetic implants in TBI patients may have prevented this method from being used more widely. In the current study, we aimed to use ASL perfusion fMRI methods to study the neural correlates of impaired performance in chronic survivors of moderate to severe TBI. Based on the results from previous studies, we initially hypothesized that the neural correlates of cognitive dysfunction in TBI may involve more extensive brain activity in the prefrontal regions associated with task performance. In addition, we hypothesized that the hypoperfused areas during the resting state may also show alterations in task-evoked CBF changes, potentially reflecting decreased neuronal reactivity caused by deafferentation.23,24
Methods
Participants
The data were collected as part of a larger study investigating the neural correlates of attention deficits and treatment responses to various psychoactive drugs after TBI (principal investigator: JW). In all, 30 participants with TBI were recruited from clinical databases of current and former patients at MossRehab 25 as well as through community advertisement. To be included, participants had to be between the ages of 16 and 60 years and had to have a history of nonpenetrating TBI of at least moderate severity at least 3 months prior to enrollment. Severity level was defined by significant and well-documented loss or alteration of consciousness following injury (ie, lowest Glasgow Coma Scale score of less than 12 or prospectively documented posttraumatic amnesia of greater than 1 day) or focal abnormality on a neuroimaging study that was attributable to traumatic injury. Self- or clinician-reported attention complaints were also required. Potential participants were excluded if they had a history of premorbid neurological disease, psychosis, major affective disorder, developmental disability, or attention deficit hyperactivity disorder or if they were currently abusing alcohol or recreational drugs. Persons who were taking psychoactive medications other than anticonvulsants were also excluded. Individuals who had extensive focal lesions in the brain areas known to be involved in either sustained-attention or working-memory task were also excluded. Participants and/or their involved caregivers (depending on the participant’s cognitive capacity) provided informed consent. The study protocol was approved by the Albert Einstein Healthcare Network and the University of Pennsylvania institutional review boards.
Cognitive Tasks
Visual sustained-attention task (VSAT)
A simple go/no-go visual reaction time (RT) task was used to examine the neural network involved in maintaining visual sustained attention.26,27 Stimuli consisted of pairs of vertical lines presented for a brief period in the center of the screen. They were also explicitly told that only 20% of the stimuli were targets. A total of 60 stimuli were presented during an uninterrupted 6-minute task block with an average interstimulus interval of 6 s (range, 4 to 8 s).
Two-back task
A letter version of the 2-back task28,29 was used to examine the neural network involved in continuous performance of a working-memory task. In this task, participants were presented with a series of letters in the center of the screen. A total of 180 letters was presented with an exposure duration of 1 s and an interstimulus interval of 2 s. The target rate for this task was 12%.
Data Acquisition
All participants were trained on the study tasks outside the scanner prior to data collection to ensure comprehension of the instructions, ensure adequate performance, and, in the case of the VSAT task, select a participant-specific stimulus duration that resulted in approximately 75% accuracy. Details of the calibration procedure are available elsewhere. 27 The order of task blocks was always resting first, the sustained-attention task second, and the 2-back task last. Each task block was approximately 6 minutes in duration, and the intervals between task blocks were approximately 30 s. During the resting condition, which was used as the baseline control, participants was instructed to close their eyes but stay awake. For both tasks, responses and RTs were recorded for further analysis.
Imaging was conducted on a Siemens 3.0-T Trio whole-body scanner (Siemens AG, Erlangen, Germany) using a standard transmit/receive head coil. An amplitude-modulated CASL (continuous arterial spin-labeled) technique was used for perfusion fMRI scans. 30 Interleaved images with and without labeling were acquired using a gradient echo, echo-planar imaging sequence with the following acquisition parameters: Field of view (FOV) = 22 cm, matrix = 64 × 64, repetition time (TR) = 4 s, echo time (TE) = 17 ms, flip angle = 90°. A total of 14 slices (6-mm thickness with 1.5-mm gap) were acquired from inferior to superior in a sequential order to cover the whole brain supratentorially. A delay time of 1 s was inserted between the end of labeling pulses and image acquisition to reduce transit-related effects. Each participant performed 3 CASL scans each with 92 acquisitions (approximately 6 minutes). Before the functional scans, high-resolution T1-weighted anatomical images were obtained using 3D MPRAGE: TR = 1620 ms, TI = 950 ms, TE = 3 ms, flip angle = 15°, 160 contiguous slices of 1.0-mm thickness, FOV = 192 × 256 mm2, matrix = 192 × 256, 1NEX with a scan time of 6 minutes.
Data Analysis
Behavioral data
The performance of the participants was characterized with respect to 2 dimensions: discrimination and speed. Discrimination was measured as d′. Speed was operationalized as median RT on hits (correct button presses to targets). To ensure that the scanning results reflected performance of the cognitive tasks as instructed, accuracy thresholds were set for inclusion in the final analysis. For both tasks, we required that accuracy was significantly above chance as measured by the binomial test. Behavioral performance between the 2 groups was compared with the Mann-Whitney U Test for each task. Statistical analyses were performed using PASW Statistics software version 18 (SPSS Inc, Chicago, Illinois).
Imaging data
The location and extent of focal lesions was quantified by a trained observer under supervision of a neurologist (HBC) with extensive experience in lesion assessment. Focal lesions included any cystic cavities and other focal regions of abnormal signal in the white or gray matter. For more technical details, see our previous study. 31
Functional image preprocessing and individual-level analysis were carried out using VoxBo software (Center for Functional Neuroimaging, Philadelphia, Pennsylvania, http://www.voxbo.org). The group-level analysis was performed with Statistical Parametric Mapping software (SPM5, Wellcome Department of Cognitive Neurology, London, UK, http://www.fil.ion.ucl.ac.uk/spm). For each participant, functional images were realigned to correct the head motion using a 6-parameter rigid-body least-squares realignment routine. If the average of maximal translational displacements along 3 axes (x, y, and z) during a session exceeded the average of voxel dimensions along 3 axes, it was regarded as excessive motion. Perfusion-weighted image series were generated by pairwise subtraction of the label and control images, followed by conversion to absolute CBF image series based on a single-compartment CASL perfusion model. 30 The resulting CBF data sets contained 46 images for each 6-minute task block with an effective TR of 8 s. The CBF images were then normalized to a custom template using symmetric normalization32,33 as implemented in the Advanced Normalization Tools (ANTS; http://sourceforge.net/projects/advants). Normalized images were resampled to 3-mm isotropic cubic voxels. For detailed procedures for template building and spatial normalization, see our previous studies.16,31
For each cognitive task, the following statistical analyses were conducted. First, for each participant, voxelwise individual GLMs (general linear model) were built to quantify CBF values for each task condition. The global signal covariate was included in the GLM to reduce spatially coherent noise in the data. 34 Perfusion MRI data are known to be free from any substantial temporal autocorrelation.35,36 Therefore, no filtering, autocorrelation modeling, or smoothing was done for the time series. The resulting parameter estimates were then fed into a random-effects model to allow population-level inferences. 37 A gray-matter mask was applied to each image before the group analysis. For multiple comparison correction for our voxelwise analysis, we first applied a peak height threshold of uncorrected P < .005 for the voxel level and then only reported voxel clusters satisfying a family-wise error corrected cluster-level threshold of P < .05. A cluster size threshold of 15 voxels or greater was also used. The peak coordinates were mapped to MNI space by registering the custom template to the Colin brain 38 using ANTS. The anatomical labels of the peaks were manually obtained using the Anatomical Automatic Labeling (AAL) atlas 39 and an atlas by Mai and colleagues. 40
All group analyses were conducted using SPM5. For the resting baseline difference, an independent 2-sample t test was run for each task separately using the resting CBF images. For the task effects, the resting condition map was first subtracted from the task condition for each participant. Then, a 1-sample t test was run using these subtraction images. These images were then compared across the 2 groups using an independent 2-sample t test to obtain the Group (control, TBI) × Task Condition (task, rest) interaction. Simple regression analyses were performed to estimate the correlations between performance (d′ and RT) and task-evoked CBF changes for each task.
The mean CBF for functional regions of interest were calculated to correlate them with performance. In doing so, the CBF time series for each voxel from each participant was averaged across all the voxels in each significant voxel cluster and then averaged across participants.
Results
Participant Characteristics
Originally, 23 control participants and 30 individuals with TBI were enrolled in this study. Data from 1 control and 2 TBI participants were excluded because of data corruption. Also, 2 TBI participants were excluded because of brain coverage issues after spatial normalization. One participant had extensive focal lesions in the frontal and parietal cortices, the areas known to be involved in the tasks to be performed. Motion during 1 or more task sessions resulted in the exclusion of 2 controls and 2 TBI participants from the VSAT task and 2 control and 4 TBI participants from the 2-back task. In addition, 6 control and 5 TBI participants were excluded from the analysis of the VSAT task because their behavioral performance did not meet the necessary cutoff (see the Data Analysis section). Two controls were excluded from the 2-back task because of chance-level performance. Because the participants with accuracy or motion exclusions differed between the 2 tasks, we chose to analyze slightly different participant samples for the 2 tasks. Consequently, the final analysis was conducted on 14 controls and 18 participants with TBI for the VSAT task and 18 controls and 21 TBI participants for the 2-back task. Table 1 summarizes selected demographic and clinical characteristics of the participants who enter into either or both analyses. The resting state data from these participants have been published in one of our previous reports. The reader is advised to refer to Table 2 of the study 16 for more detailed clinical characteristics. The IDs of the 23 TBI participants who were included in the current study are 1, 3, 5, 7, 8, 9, 10, 11, 12, 14, 15, 17, 18, 19, 21, 22, 23, 24, 26, 28, 29, 31, and 34. Measures of the functional status of each participant at the time of testing were not obtained prospectively. However, patients were retrospectively assigned Glasgow Outcome Scores 41 based on review of referral records and observation of the participant at testing. Because we lacked information about current employment status in some cases, these ratings remain somewhat imprecise, indicating the lowest possible level of function compatible with the available data at the time of testing. Out of 23 patients, 9 were rated as level 3 (severely disabled) or better; 9 were rated as level 4 or better (moderate disability), and 5 were rated as level 5 (good recovery).
Selected Demographic and Clinical Characteristics of Participants a
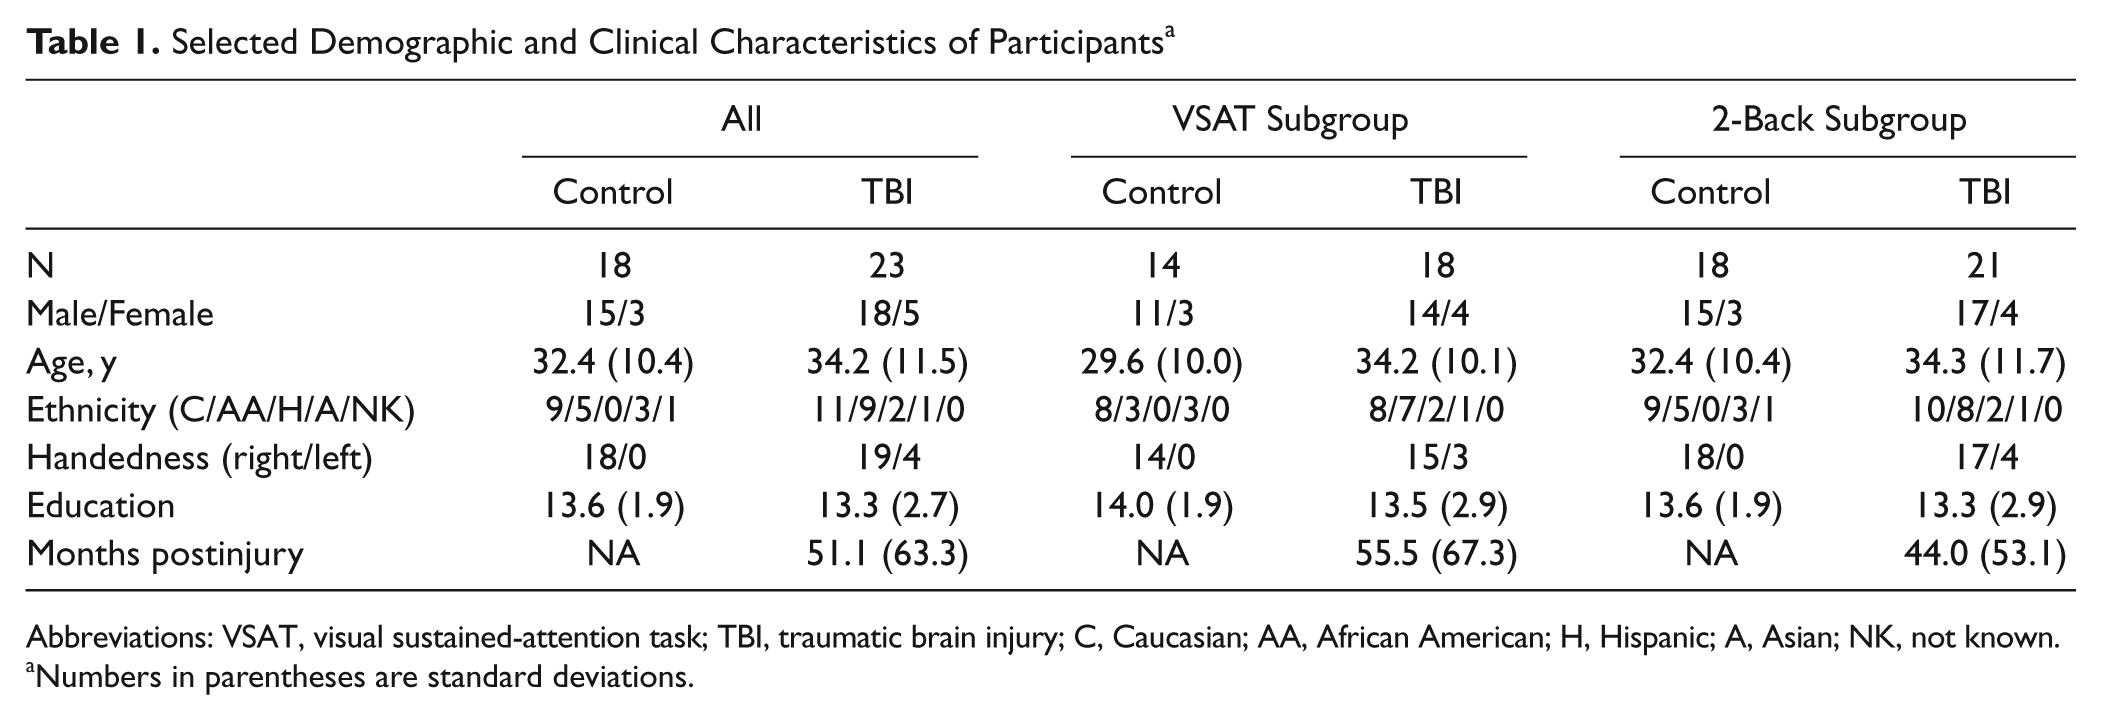
Abbreviations: VSAT, visual sustained-attention task; TBI, traumatic brain injury; C, Caucasian; AA, African American; H, Hispanic; A, Asian; NK, not known.
Numbers in parentheses are standard deviations.
Group Differences in Performance During the Sustained-Attention and 2-Back Tasks a
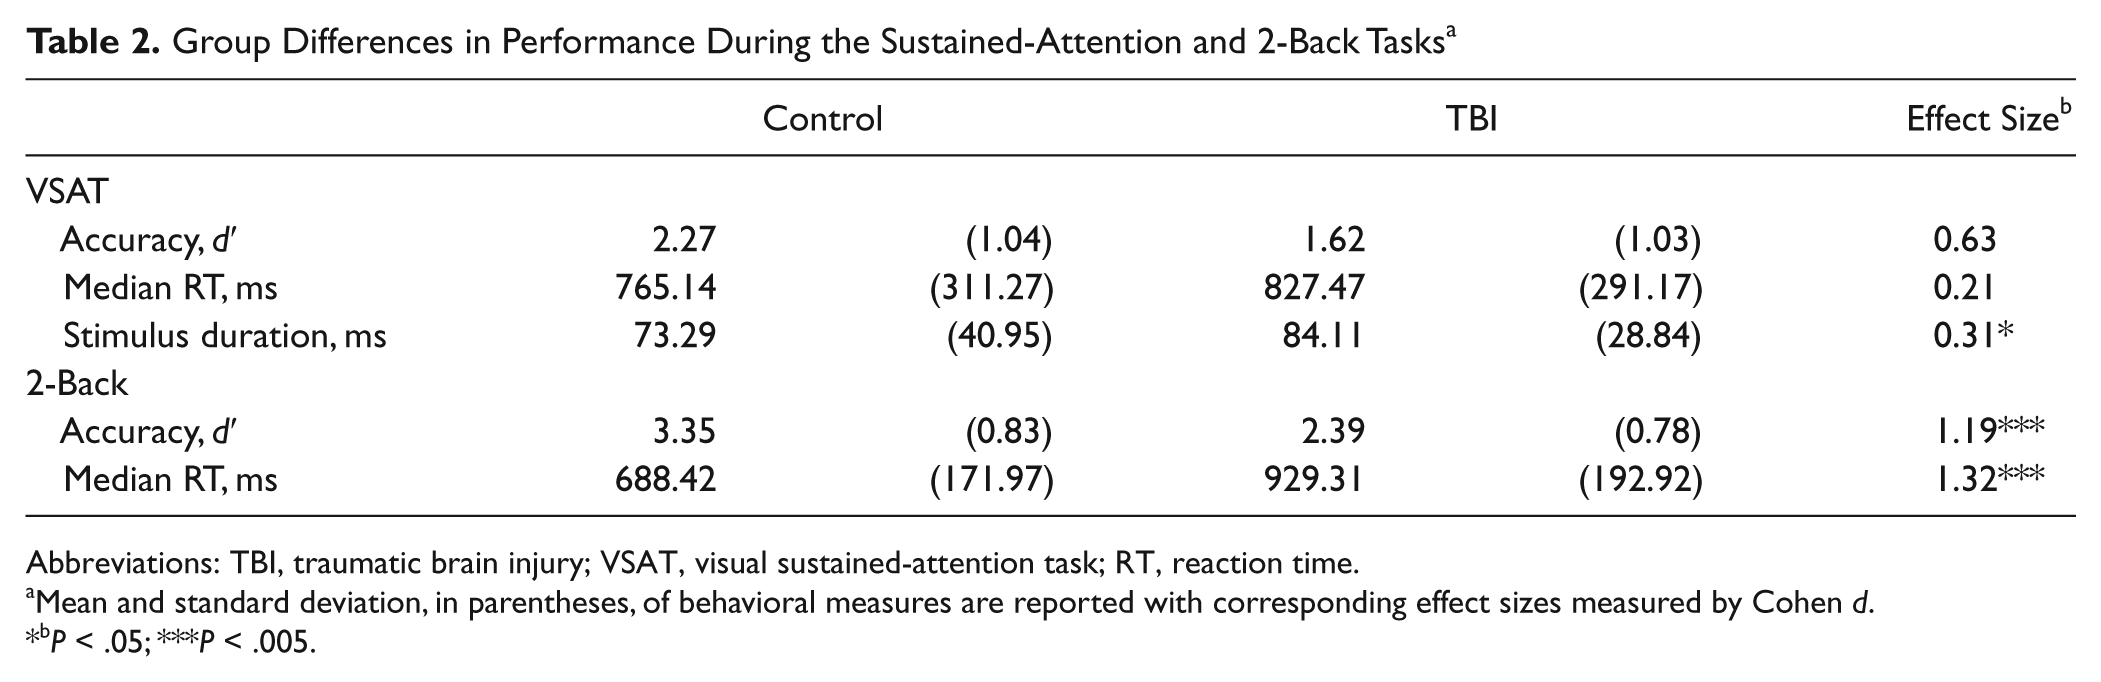
Abbreviations: TBI, traumatic brain injury; VSAT, visual sustained-attention task; RT, reaction time.
Mean and standard deviation, in parentheses, of behavioral measures are reported with corresponding effect sizes measured by Cohen d.
P < .05; ***P < .005.
Group Differences in Task Performance
For the VSAT, the stimulus duration selected during pretesting to ensure adequate accuracy of performance was slightly but significantly longer for participants with TBI, replicating the robust finding of slowing of cognitive processing following TBI (see Table 2). The trend was toward lower accuracy and longer RT among participants with TBI as compared with control participants, although this did not reach statistical significance. For the 2-back task, individuals with TBI showed significantly lower accuracy (d′) and response speed (RT) compared with controls (see Table 2).
Group Differences in CBF
Lesion distribution
Figure 1A shows a lesion frequency map of the 4 TBI participants with focal lesions who were included in the analysis of the sustained-attention task. Figure 2A illustrates a lesion frequency map of the 2-back task consisting of focal lesions from 9 TBI participants. As expected, the lesion extent was largely confined to the frontotemporal cortices, a typical pattern in moderate to severe TBI.
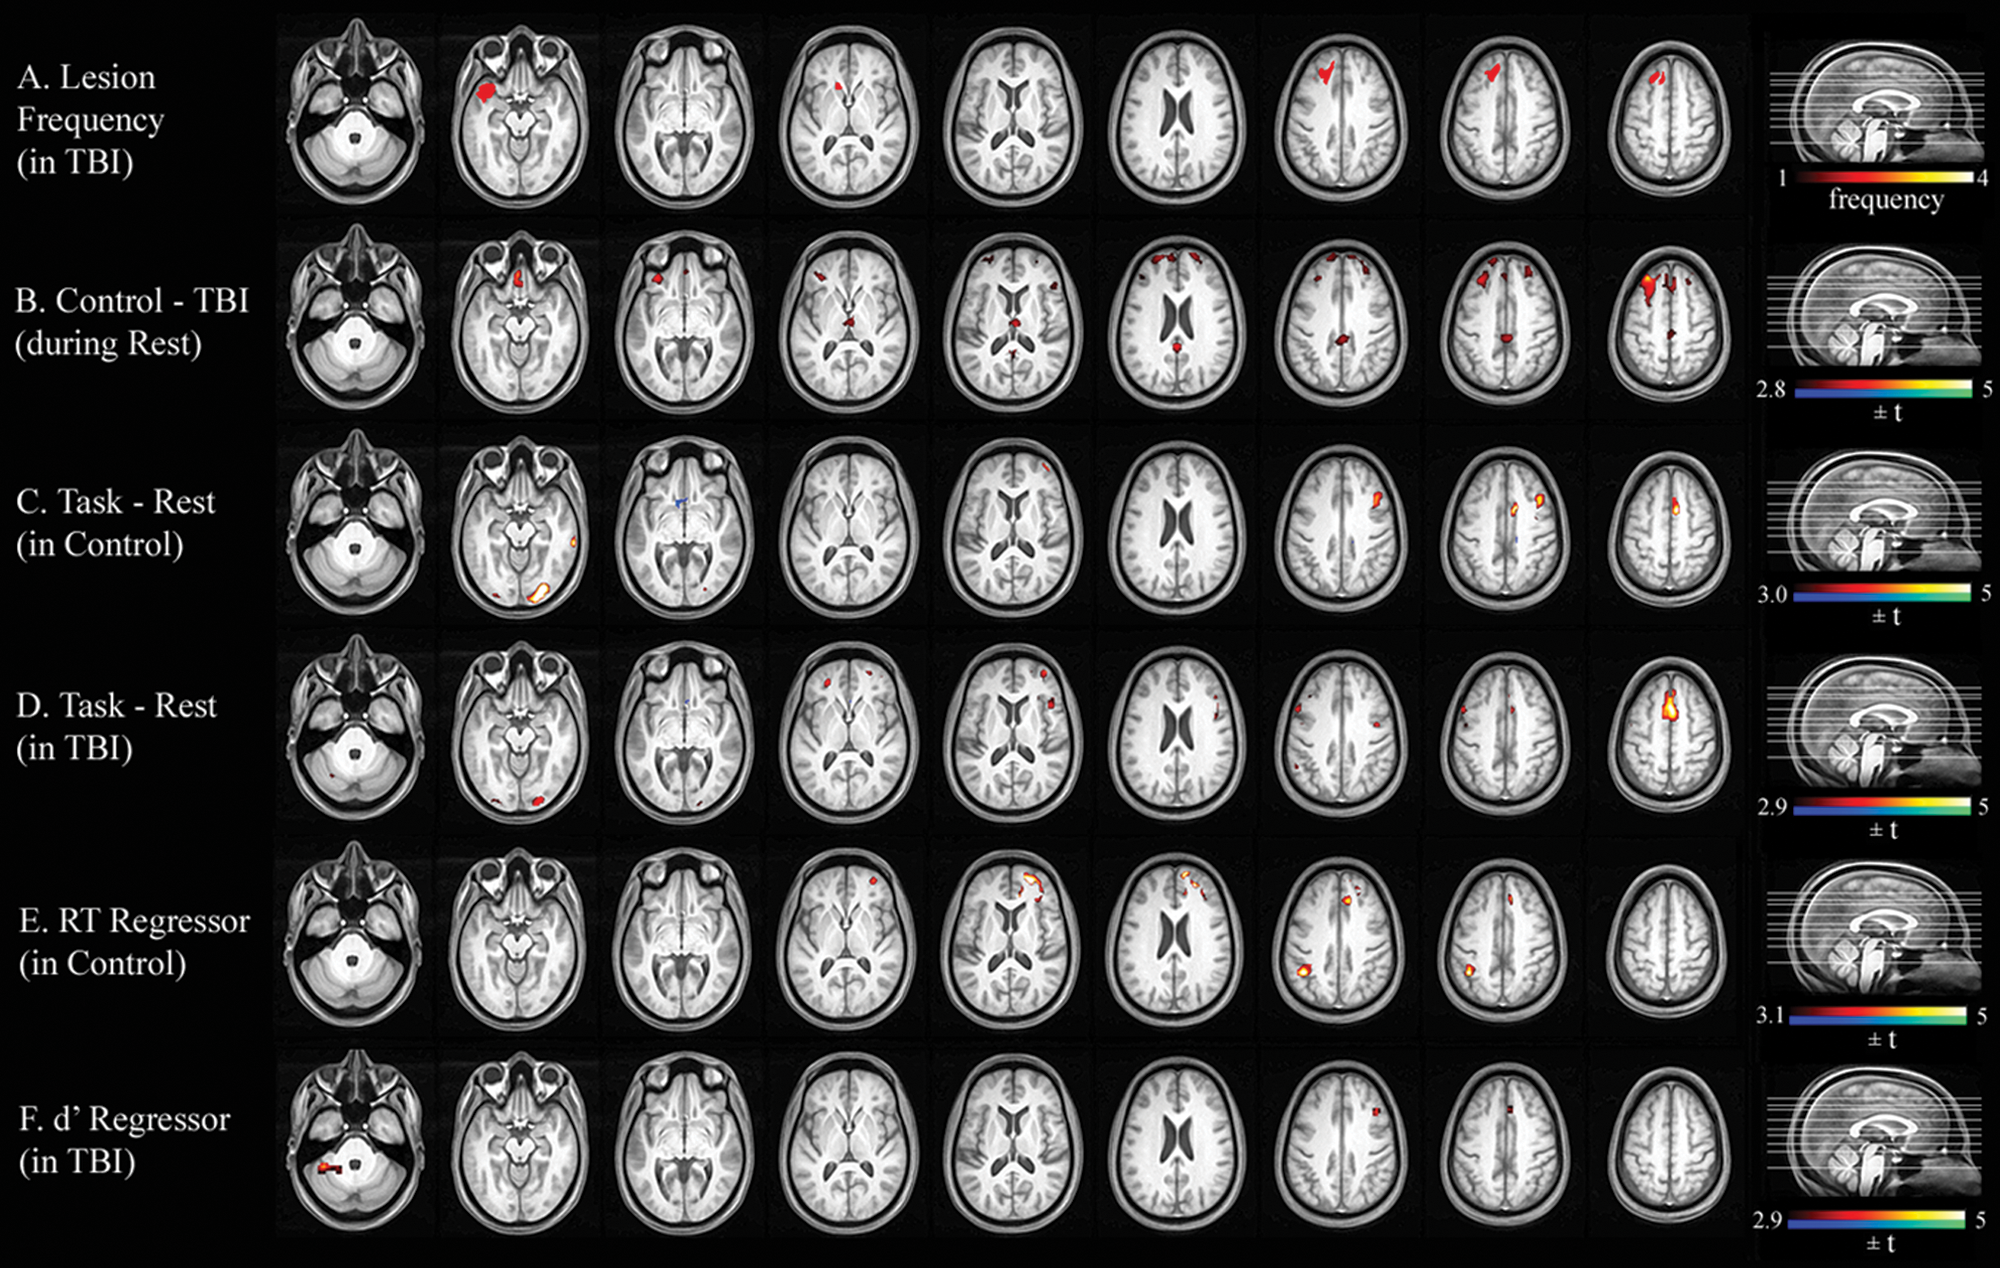
Lesion frequency and statistical parametric maps for the VSAT task. A. Lesion frequency map of 4 TBI participants with focal lesions. B. Significant group difference in resting-state CBF. C. Areas associated with the VSAT task in controls. D. Areas associated with the VSAT task in TBI. E. Simple regression of RT on task-evoked CBF change in controls. F. Simple regression of RT on task-evoked CBF change in TBI. Abbreviations: VSAT, visual sustained-attention task; TBI, traumatic brain injury; CBF, cerebral blood flow; RT, reaction time.
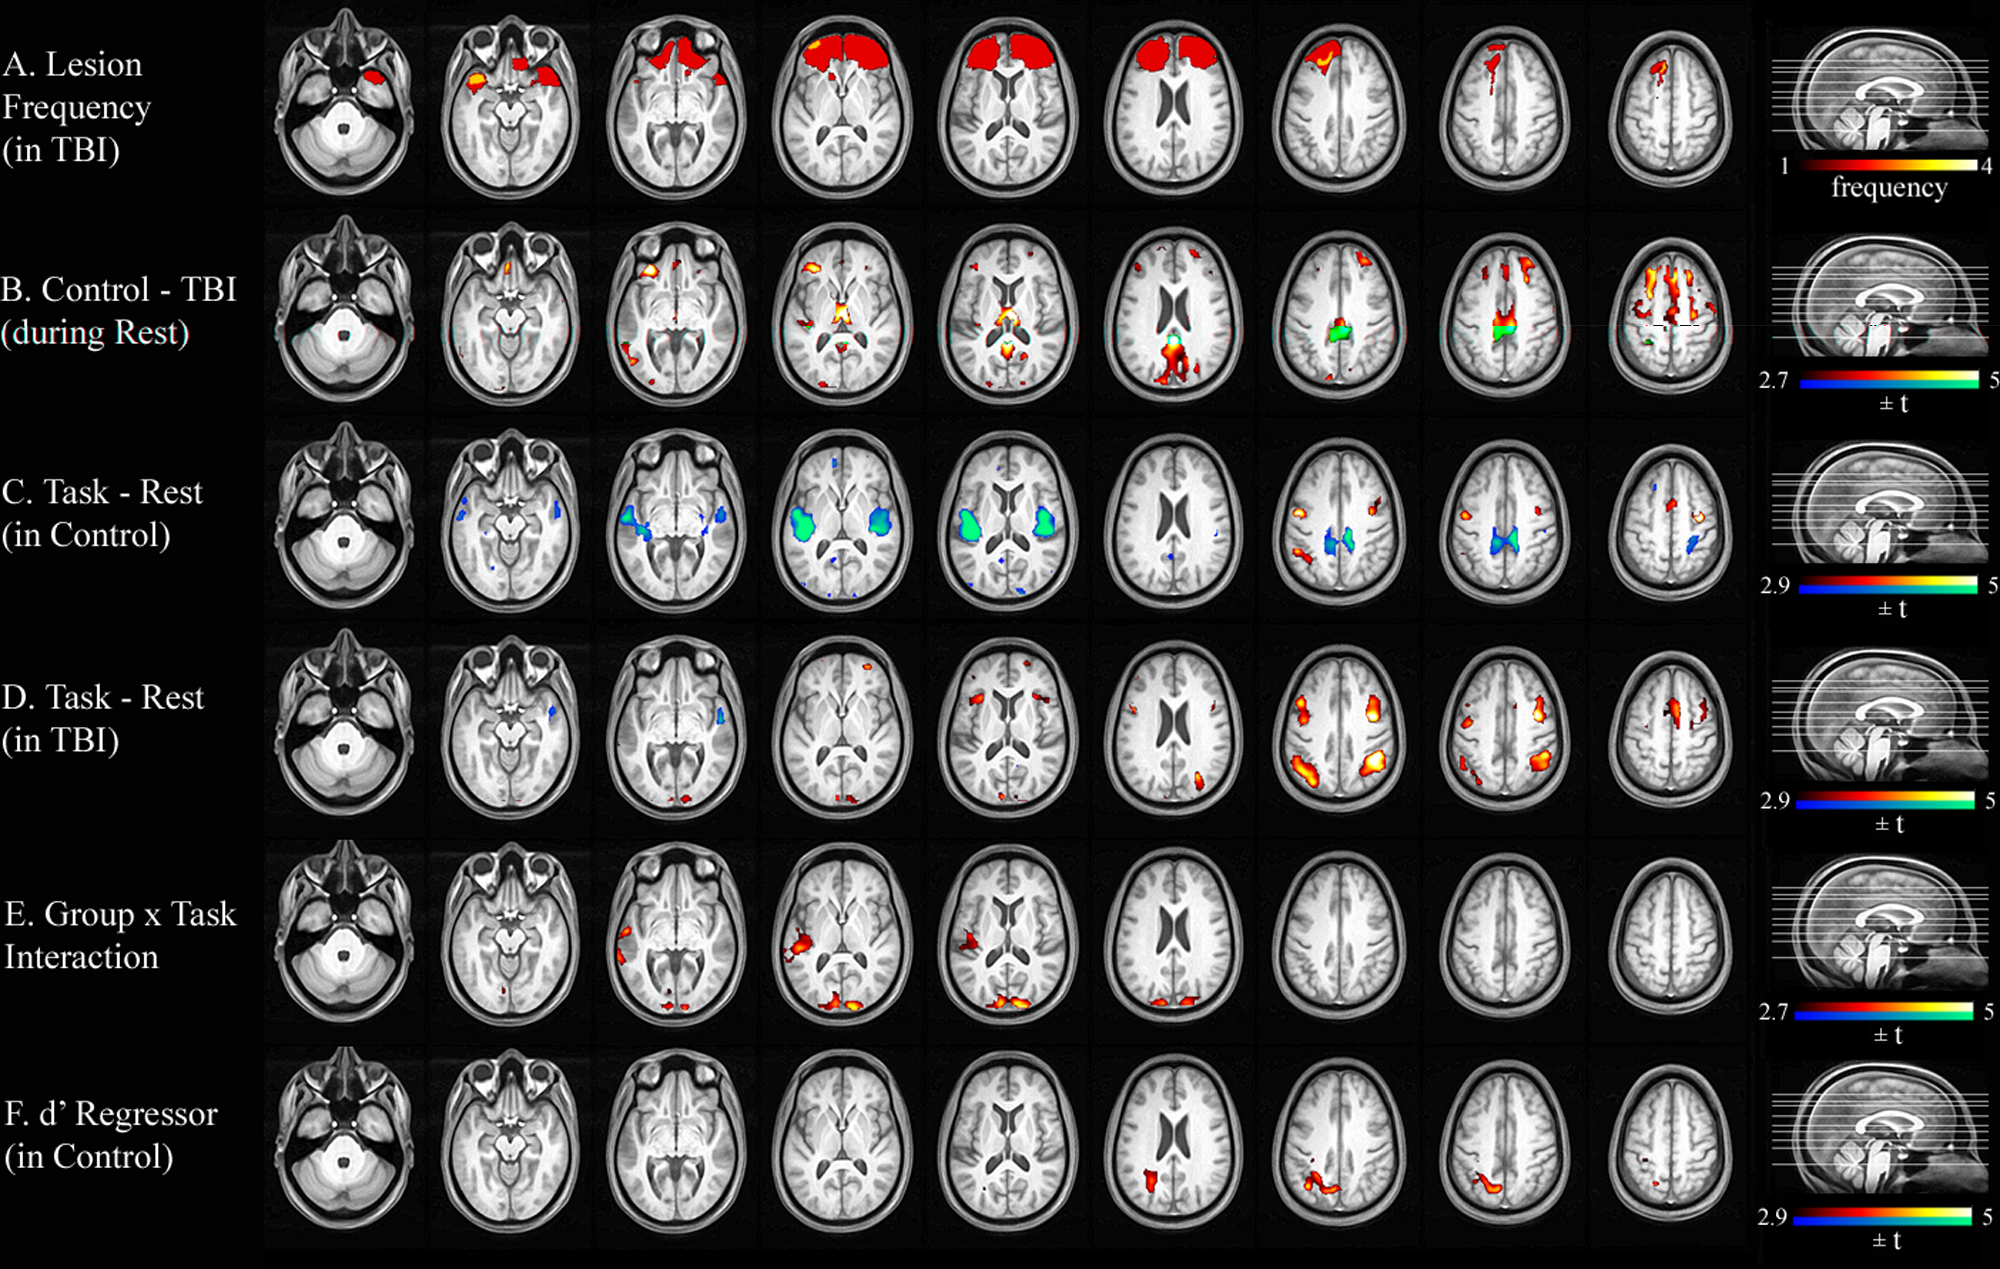
Lesion frequency and statistical parametric maps for the 2-back task. A. Lesion frequency map of 9 TBI participants with focal lesions. B. Significant group difference in resting-state CBF. C. Areas associated with the 2-back task in controls. D. Areas associated with the 2-back task in TBI. E. An interaction effect of Group (control, TBI) × Task Condition (2-back, rest). F. Relationship between the magnitude of the task-evoked CBF change and performance accuracy (d′). Abbreviations: TBI, traumatic brain injury; CBF, cerebral blood flow.
Resting CBF
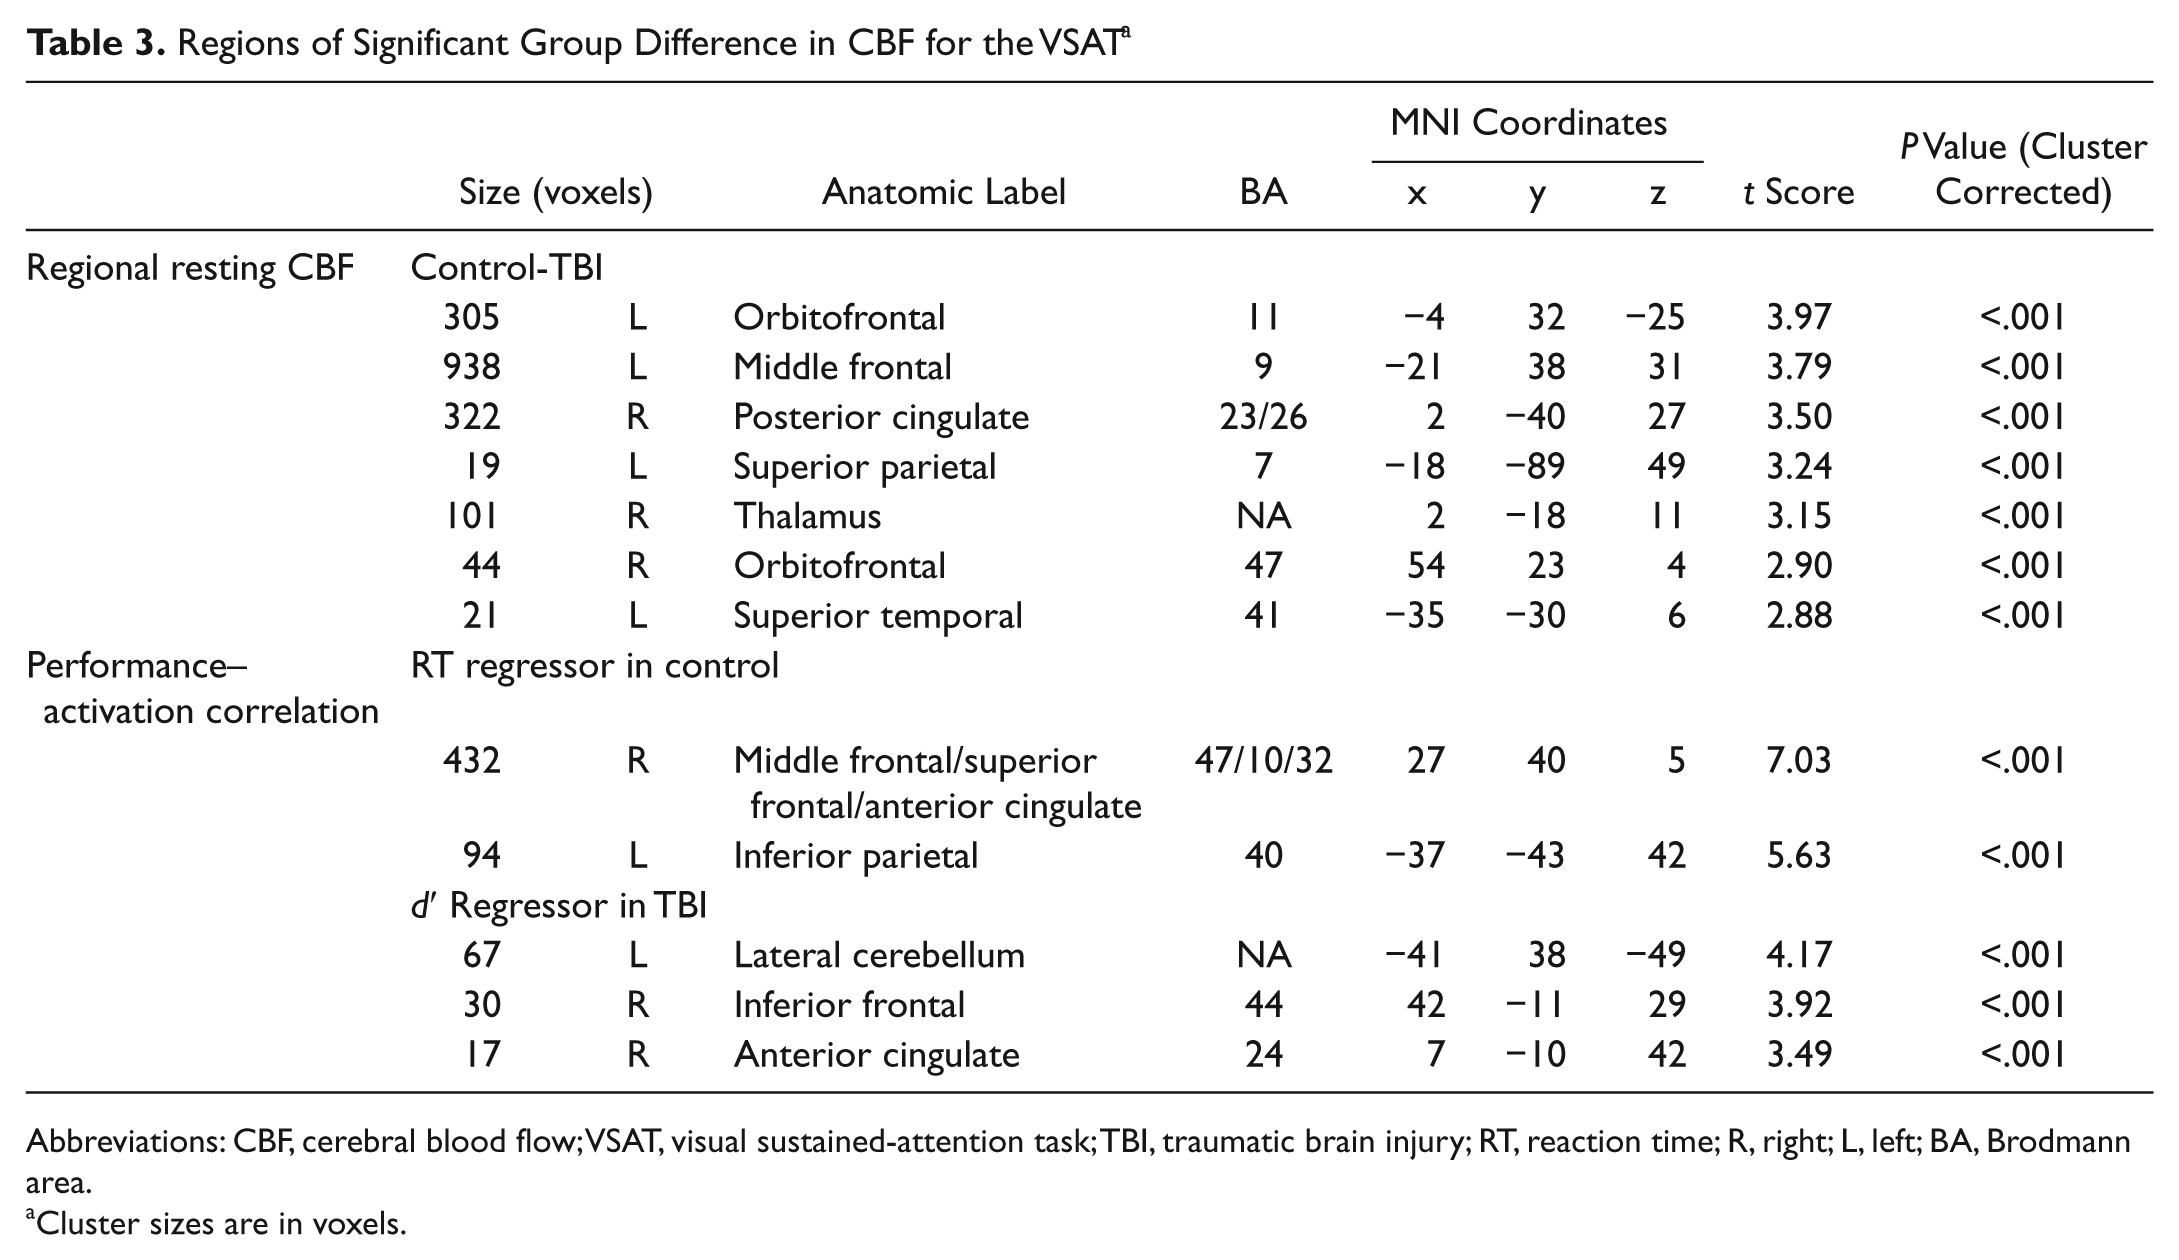
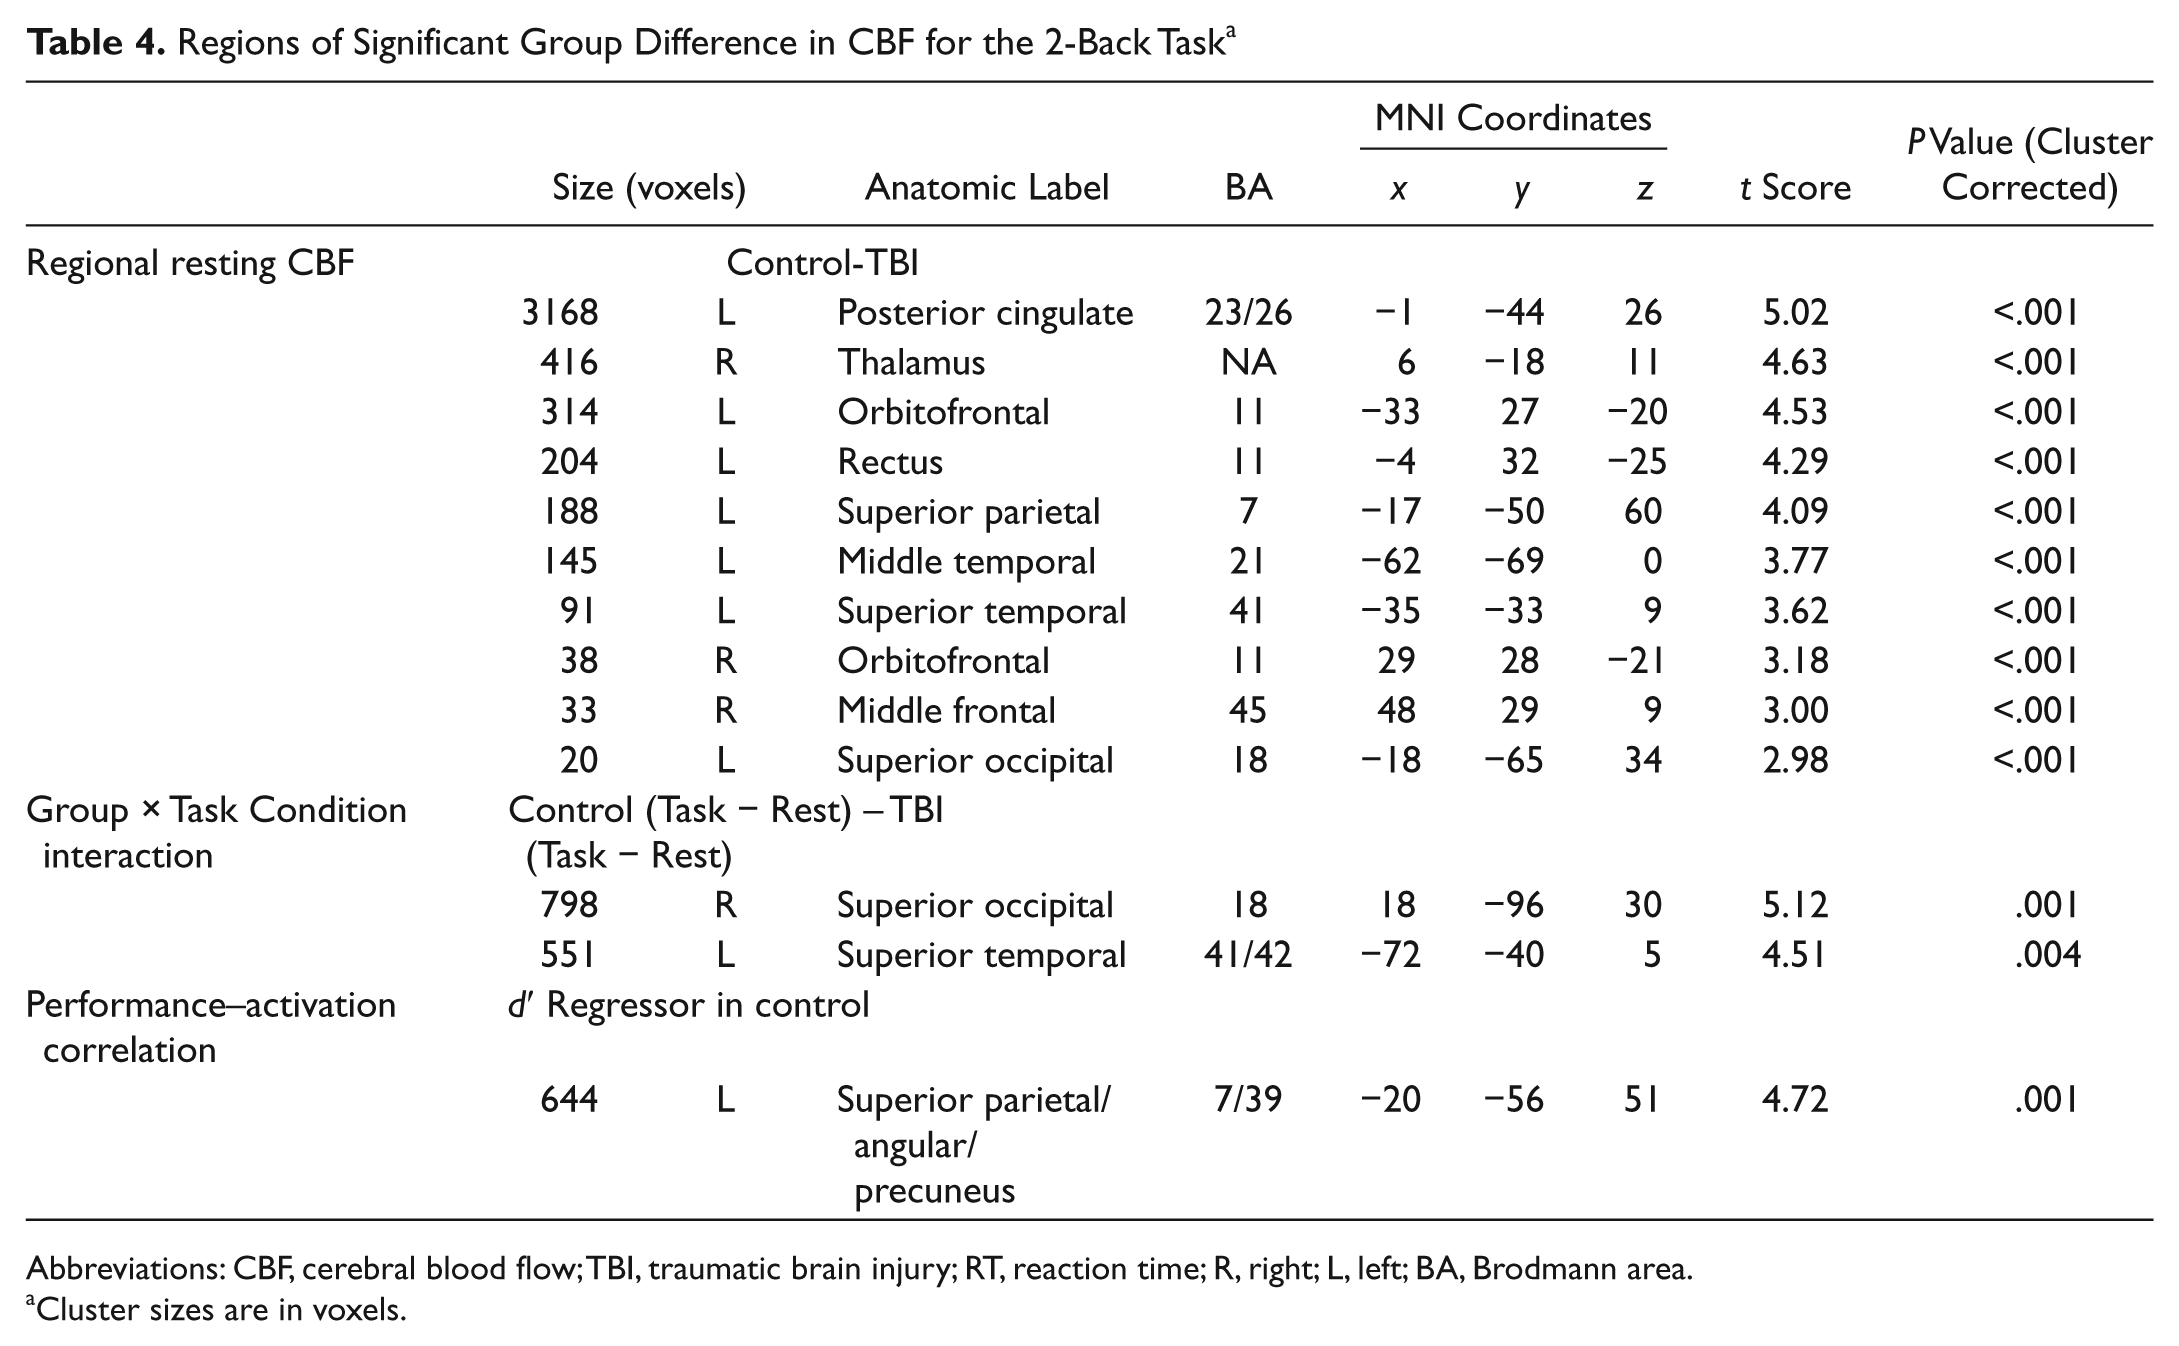
For the VSAT subgroup, TBI participants showed hypoperfusion compared with controls in the thalamus and many areas of the cortex (see Figure 1B and Table 3). A similar pattern of hypoperfusion was seen for the 2-back subgroup (see Figure 2B and Table 4).
Regions of Significant Group Difference in CBF for the VSAT a
Abbreviations: CBF, cerebral blood flow; VSAT, visual sustained-attention task; TBI, traumatic brain injury; RT, reaction time; R, right; L, left; BA, Brodmann area.
Cluster sizes are in voxels.
Regions of Significant Group Difference in CBF for the 2-Back Task a
Abbreviations: CBF, cerebral blood flow; TBI, traumatic brain injury; RT, reaction time; R, right; L, left; BA, Brodmann area.
Cluster sizes are in voxels.
Task-induced CBF changes
Figures 1C, 1D, 2C, and 2D illustrate task-induced CBF changes in the 2 groups. The loci of activation and deactivation for each task are generally in agreement with previous studies using similar tasks involving sustained attention and 2-back tasks in healthy controls.42-46
During the VSAT task, even though the 2 groups activated and deactivated similar areas, visual inspection indicated a slightly different pattern between the 2 groups. That is, TBI participants showed a trend toward a more bilateral activation pattern for the middle frontal and supplementary motor cortices. In contrast, controls activated the right inferior temporal cortex, an area known to be involved in visual shape processing. 47 However, this trend identified by visual inspection did not yield statistically significant results in a direct quantitative comparison of the 2 groups’ task-induced CBF changes: no voxel clusters survived in a voxelwise whole brain search for a Group × Task Condition interaction ([Task-rest in control] − [Task-rest in patient]).
For the 2-back task, although TBI participants activated all areas where controls showed CBF increases, their activations tended to be more bilateral and extensive compared with controls. TBI participants also activated the bilateral anterior insula areas. In contrast, deactivated regions appeared to be less extensive than for controls. Only the right superior temporal and the right posterior cingulate cortices were deactivated. However, most of these qualitative observations did not result in statistically significant voxel clusters in a voxelwise search for a Group × Task Condition interaction. The only 2 areas with a significant Group × Task Condition interaction were the bilateral superior occipital (BA 18) and the left superior temporal (BA 22) cortices (see Table 4). Comparison of Figures 2C and 2D reveals that the 2 groups showed different directions of CBF changes in these areas. That is, whereas these areas were deactivated during the task performance in controls, the same areas tended to be activated in TBI. We extracted the CBF values from these regions and correlated them with performance measures within each group. However, neither d′ nor RT was significantly correlated with the magnitude of task-evoked CBF values (Spearman’s ρ < 0.2 and P > .4 for all comparisons).
Performance–activation relationship
Simple regression analyses using the accuracy score (d′) and median RT as regressors were conducted for each group to examine the correlation between task performance and task-induced CBF changes. For the VSAT, the control group showed significant correlations between RT and task activation in the left inferior parietal (BA 40) and the right middle frontal/superior frontal/anterior cingulate (BA 47/10) cortices (Figure 1E and Table 3). No clusters with a significant relationship between d′ and activation were identified. In contrast, TBI participants showed no clusters with significant correlation between RT and activation. However, a significant relationship was found between d′ and task activation in the left lateral cerebellar, the right inferior frontal (BA 44), and the right anterior cingulate (BA 24) cortices (Figure 1F and Table 3). For the 2-back task, the activity in the left parietal area (BA 7/39) was correlated with d′ in controls (Table 4). No voxel showed such a relationship in individuals with TBI.
Discussion
Numerous animal and human studies have indicated that TBI significantly alters baseline cerebrovascular parameters, including CBF and cerebral rate of oxygen consumption.19,48 Thus, obtaining a baseline is important when researchers compare task-induced activation across different groups or occasions. Although ASL perfusion fMRI can quantify CBF noninvasively and reliably, this method has rarely been used to investigate the neural correlates of impaired cognitive performance in TBI. Our study used this method to investigate the neural correlates of chronic TBI participants’ impaired performance during sustained attention and working memory.
Participants with TBI showed worse behavioral performance than controls in both tasks, but the group difference was more prominent in working-memory task compared with the sustained-attention task. Mirroring the small behavioral difference, no significant Group × Task Condition interaction was found for the sustained-attention task in the voxelwise analysis of CBF data. For the 2-back task, the results suggested a trend toward more extensive task-evoked frontoparietal activity in TBI compared with controls, which is in line with the majority of previous studies and our initial hypothesis. However, this trend was not confirmed in the subsequent statistical parametric mapping analysis, possibly because of our small sample size. Instead, we found a significant Group × Task Condition in several sensory areas—that is, the bilateral superior occipital (BA 18) and the left superior temporal (BA 22) cortices. This interaction effect was driven by the opposite direction of task-evoked CBF changes between the 2 groups; whereas controls deactivated these areas during the task, TBI participants activated the same areas. We speculate that this pattern might underlie TBI participants’ decreased capacity to inhibit irrelevant sensory information.49,50
In line with our initial hypothesis that resting hypoperfusion in an area may be associated with task-evoked CBF alterations in the same region, the sensory areas with altered task-induced CBF changes during the 2-back task were found to be hypoperfused even during the resting state. This fact strongly suggests that the observed group differences in task-evoked CBF changes do not simply reflect impaired behavior or altered behavioral strategies in TBI. An interesting fact is that not all areas that were hypoperfused during resting showed altered task-induced activation. For example, the supplementary motor and the posterior cingulate areas did not show significant task-related CBF alterations in TBI. This indicates that the most severe alterations might be within the sensory cortices listed above. Considering the fact that visual and auditory sensory cortices are modulated by attention in healthy individuals,51-53 we speculate that attentional modulation deficits, detectable even during the resting state, may contribute to higher cognitive dysfunction in TBI. In fact, several studies reported resting-state glucose hypometabolism or hypoperfusion in visual and auditory cortices in chronic TBI participants.23,54,55 Nakashima and colleagues 23 hypothesized that these alterations to decreased neuronal activity may be a result of deafferentation and related them to deficits in visual function in TBI patients. Our previous study 16 partially supports this interpretation by demonstrating that structural atrophy did not completely account for reduced CBF in the thalamus, an area that provides input to these sensory cortices. A future study investigating the structural and functional connectivity between the thalamus and sensory cortices may further support this interpretation.
We found altered performance-activation correlations in TBI, even though the specific pattern of disruption was different from previous studies.11,13 For the working-memory task, our controls showed a significant relationship between performance accuracy (d′) and activation in the left parietal cortices, an area known to support the task performance. TBI participants did not show this relationship, which may indicate that there was more individual variation in the neural networks supporting task performance among TBI participants than in controls. For the VSAT, the 2 groups showed common locations of performance–activation correlation in the right prefrontal and anterior cingulate cortices. However, whereas controls had an additional area with a significant performance correlation in the left parietal cortex, TBI participants showed such a correlation with the left lateral cerebellum instead. Given relatively similar accuracy and speed between groups in the VSAT, the group difference in performance–activation correlation is not likely to be a result of performance confound.
Several limitations of the present study should be noted. First, a large number of participants were excluded from the analysis for various reasons, which may reduce the representativeness of the sample. Second, we provided only 1 additional measure (ie, reconstructed Glasgow Outcome Score) of cognitive and functional status of our patient sample. Third, the group analysis approach we took might have overlooked individual differences in patterns of brain reorganization after injury. Fourth, the order of task blocks was not counterbalanced. The sustained-attention task was always administered before the 2-back task, making it difficult to rule out task order effects. Thus, the results from the 2 tasks should not be directly compared. The fifth limitation of the study is the relatively noisy nature of ASL time series. Despite using rather lenient thresholding for examining perfusion fMRI results, a low signal-to-noise ratio (SNR) could have prevented identification of additional brain regions with group differences. In addition, a relatively small sample size could have further reduced the statistical power to detect the effects of interest, consequently limiting generalizability of the conclusions. Sixth, one should be reminded that the present study used a blocked design with a very long task period, so that brain activation likely reflected primarily enduring aspects of “task set” rather than transient neural events associated with signal processing. Thus, the effects of TBI on these more transient cognitive processes may have been missed.
Despite these limitations, we believe that efforts to reveal the mechanisms of impaired cognitive processing in TBI may eventually allow us to locate the critical areas needed for performance, to distinguish various forms of neuroplasticity (eg, restorative vs compensatory) manifested in this population, and help us adopt a more targeted approach to treatment. 3 In the future, a study implementing both BOLD and perfusion fMRI is warranted to investigate both tonic and transient components of higher cognition. To address the issue of a low SNR, we plan to use a pseudocontinuous ASL sequence with an improved SNR 56 in our next study. Using a study sample with multiple cognitive and functional measures would facilitate comparisons with other studies, increasing the generalizability of the results. Cognitive tests with a parametric design would yield additional methods of identifying group differences in task-modulated CBF changes.
Footnotes
Acknowledgements
The authors wish to thank Jiongjiong Wang, PhD, Kathy Z. Tang, BA, Geoffrey K. Aguirre, MD, PhD, Daniel Kimberg, PhD, John Pluta, BS, and Allen Osman, PhD, for their help with participant recruitment, data analysis, and manuscript review. The assistance of MRI technicians Doris Cain, Patricia O’Donnell, and Norman Butler is also gratefully acknowledged.
Declaration of Conflicting Interests
The author(s) declared the following potential conflict of interest with respect to the research, authorship, and/or publication of this article:
JAD is an inventor on the University of Pennsylvania’s patent for ASL MRI and is entitled to institutional royalty sharing for its licensure.