
Abstract
Background and Purpose. Compensatory and restorative treatments have been developed to improve visual field defects after stroke. However, no controlled trials have compared these interventions with standard occupational therapy (OT). Methods. A total of 45 stroke participants with visual field defect admitted for inpatient rehabilitation were randomized to restorative computerized training (RT) using computer-based stimulation of border areas of their visual field defects or to a computer-based compensatory therapy (CT) teaching a visual search strategy. OT, in which different compensation strategies were used to train for activities of daily living, served as standard treatment for the active control group. Each treatment group received 15 single sessions of 30 minutes distributed over 3 weeks. The primary outcome measures were visual field expansion for RT, visual search performance for CT, and reading performance for both treatments. Visual conjunction search, alertness, and the Barthel Index were secondary outcomes. Results. Compared with OT, CT resulted in a better visual search performance, and RT did not result in a larger expansion of the visual field. Intragroup pre–post comparisons demonstrated that CT improved all defined outcome parameters and RT several, whereas OT only improved one. Conclusions. CT improved functional deficits after visual field loss compared with standard OT and may be the intervention of choice during inpatient rehabilitation. A larger trial that includes lesion location in the analysis is recommended.
Introduction
Visual field deficits affect approximately 8% to 25% of all stroke survivors.1-3 These deficits may have debilitating effects on mobility, visuospatial orientation, higher perceptual or attentional functions, and reading. Although visual rehabilitative interventions suggest that homonymous hemianopia can be treated to some extent, complete restitution is rarely observed.3-5
Two main methods of rehabilitation have been proposed. Restorative computerized training (RT) is based on visual detection tasks without execution of saccades, aiming for direct restoration of a portion of the visual field by stimulating preserved neuronal representations of the visual system. Compensatory therapy (CT) trains strategies to make more efficient and systematic saccades into the hemianopic field to indirectly expand the usable field of view. Several investigations found that RT may mildly reduce visual field deficits, on average, by less than 2°.6-11 One study did not find any reduction. 12 CT also may enhance compensation for visual field defects to improve functional outcome.13-21 To date, only 1 study has directly compared RT with CT. In 2 groups of chronic brain-damaged patients with unilateral field defects, Roth et al 16 showed that CT was superior to RT by decreasing search time at the follow-up investigation and by improving eye movement strategies.
A recent systematic Cochrane review argues for further studies to compare compensatory and restitutive interventions with a placebo control or usual care. 22 According to this review, there is only limited evidence for compensatory treatment and no evidence that restitutive training improves outcomes for hemianopic patients. In addition, almost all studies focused on chronic patients and included patients with hemianopia that was a consequence of various organic causes. A systematic treatment offered early in the recovery process may be more effective than in the late phase, and results may differ for patients with stroke and traumatic brain injury. Therefore, the aim of this prospective, randomized controlled trial was to compare the efficacies of CT and RT with that of standard occupational therapy (OT) on visual field defects and on visual search during inpatient stroke rehabilitation.
Methods
Patients
A total of 45 consecutive admitted rehabilitation inpatients with homonymous hemianopia with a posterior cerebral artery stroke participated in this prospective randomized controlled, single-blind, single-center treatment study. Patients with visual neglect, eye-movement disorders, neuropsychological disorders like aphasia, dysexecutive syndromes, memory deficits, or higher order motor impairments like apraxia were excluded. All patients gave written informed consent. The study was approved by the ethics committee of the Carl von Ossietzky University of Oldenburg.
Study Design
Patients were randomly assigned to receive either CT, RT, or OT. Randomization by throwing dice and allocation took place before starting with the initial assessment of neuropsychological tests (Figure 1). All patients were recruited and assigned to treatment groups by a neuropsychologist. The same neuropsychologist also tested the patients before (time point t1) and after (time point t2) the treatment and was not blinded to the type of training. The training itself was performed by a psychological assistant or by the occupational therapists not involved in the study, and they provided the test results at t1 and t2. All participants moreover got inpatient standard rehabilitation treatment encompassing physiotherapy, speech therapy, and health education.
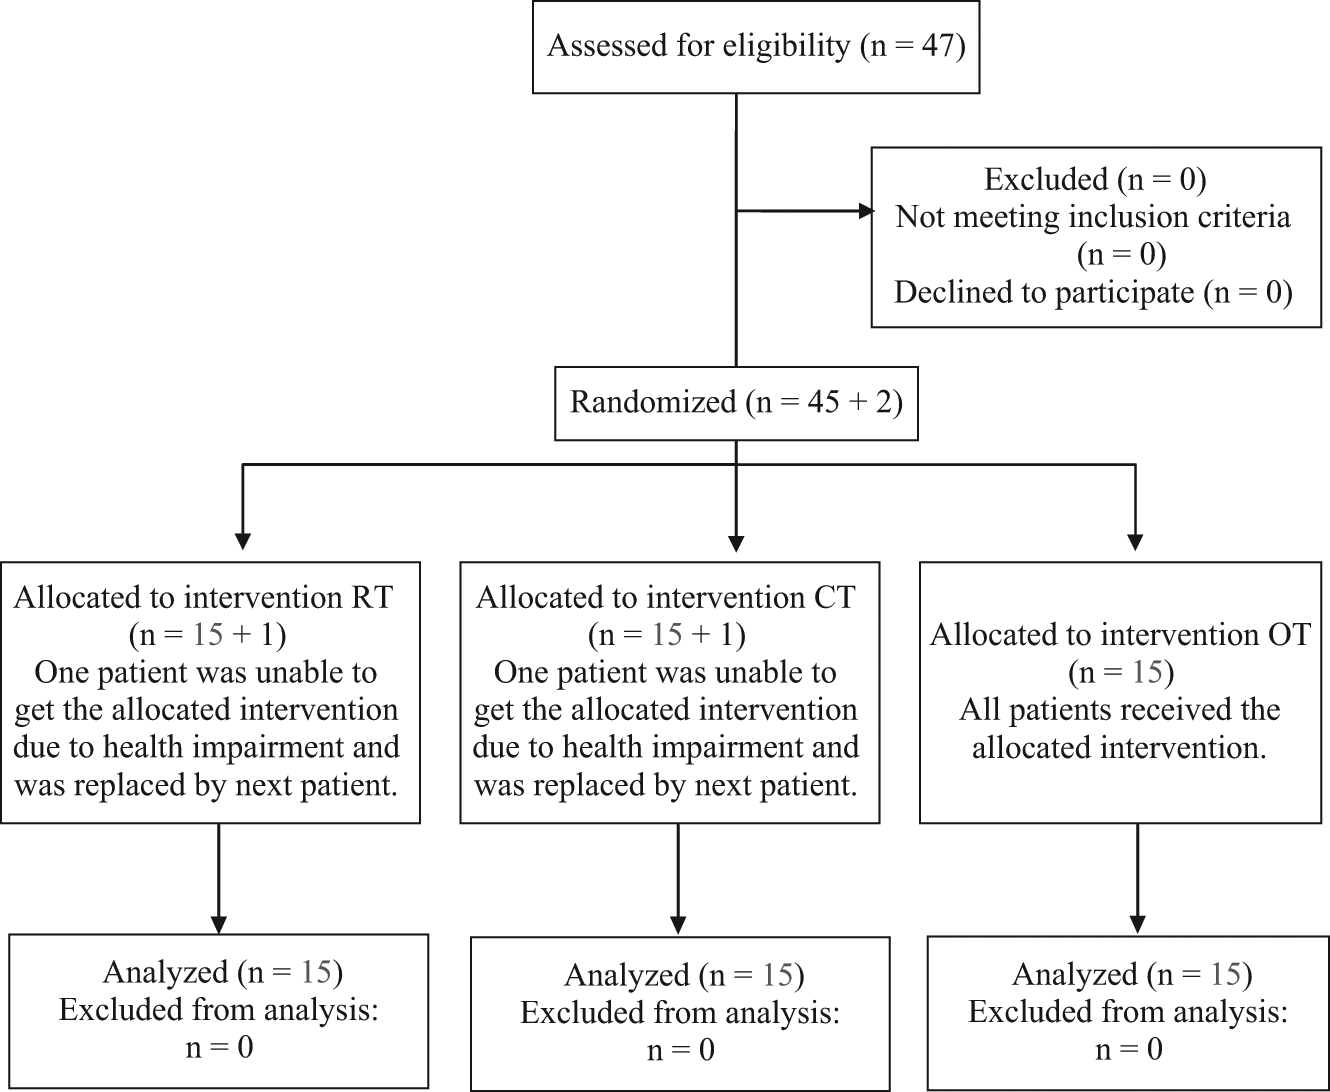
Flow chart of recruitment and retention. Abbreviations: RT, restorative computerized training; CT, compensatory therapy; OT, occupational therapy.
Clinical Investigations
At t1 and t2, all patients underwent neuropsychological tests, including visual scanning, an attention test, and a perimetry test from the Test Battery of Attentional Performance, 23 the latter having a sensitivity and specificity for visual field defects similar to the Goldmann perimetry. 24 For these tests, head movements were prevented by a chin rest in front of the monitor. Participants were instructed not to move their eyes and were monitored by the examiner. For assessment of visual exploration, we used the search tasks of the Behavioural Inattention Test, which include line, stars, and letter cancellation tests. 25 Reading ability was assessed by the standardized texts of the Wechsler Memory Test. 26 Independence in activities of daily living was scored by nurses with the German Extended Barthel Index (EBI). 27
Procedures
The daily duration of each session for all groups was 30 minutes (also OT was standardized on 30-minute sessions), and each participant received a total of 15 sessions. The participants in both PC-based therapy groups were seated 60 cm away from the screen (19-in. monitor) and had to perform the tasks binocularly. As during testing, the head was fixed by a chin rest. The sessions were always controlled by the assistant to make sure that the instructions were followed.
Restitution therapy
A therapy-integrated perimeter program (provided by Teltra company) created the exact measurement of the individual visual field border. Using that measurement, a series of colored targets appeared on a blue screen anywhere at 1 of 10 positions on the border line. A randomly presented first fixation target (a rotating arrow) announced the second stimulus target in the hemianopic border zone (basic principle of covert attention shift). The patients were instructed to respond (by pressing a key) to each stimulus target (colored and flickering frames, beams, and spots) as soon it was perceived. The program contained no adaptive difficulty levels. Eye movements were not allowed, and this was controlled by the assistant.
Compensatory therapy
The “Exploration” task (from RehaCom, provided by HASOMED GmbH, Magdeburg, Germany) was adapted individually according to the side of the hemianopia. On a dark background, different bright stimuli arranged in rows and columns were presented. A ring (diameter of 2 cm) moved line by line (interlaced) on a matrix unit over the field. The participant was instructed to follow the ring (starting point to an outmost fixation in the blind side) by eye movements and to identify a critical targeted icon. The targets were not always distributed homogeneously but were clustered in the blind side. Thus, the exploration in the hemianopic field was further promoted. The patients had to respond (by pressing a key) when the targeted icon was perceived in the circle. The program contained several difficulty levels. In levels 1 to 20, all lines were completely filled with symbols, whereas there were omissions in the rows of symbols in levels 21 to 30 to increase the difficulty.
Occupational therapy
After a standardized assessment of daily living activities, the therapy consisted of individually adapted stimulation of daily activity tasks to compensate via eye-, head-, and body movements. These compensation strategies included aspects of spatial and body perception, searching or arranging objects, pen and paper searching task, reading maps or newspapers, and self-care activities. The participant was instructed to perform systematic eye movements toward the lost visual field. The interventions were carried out in the treatment rooms, on the wards, in a kitchen or a bathroom, outside in the park, or in a supermarket. Patients receiving RT and CT did not receive OT in the context of their standard rehabilitation treatment.
Statistical Analysis
Based on the distribution of the visual field test of the TAP, we defined a minimum reduction of 3 omissions, which corresponds to an expansion of 1° over the whole visual field (upper and lower quadrant) as a meaningful effect. Previous work has shown that the standard deviation of visual field testing after posterior brain artery stroke is about 5.9.28,29 For a given α and β error of .05, this leads to 15 patients per group. Based on the results of the same studies, we know that the standard deviation for omissions in the visual scanning test of TAP is 9.97.28,29 Because the search array of the scanning test is symmetrically organized in 5 lines and 5 columns, we defined a reduction of 5 omissions (ie, of 1 contralesional column) as a clinically meaningful end point. For the already mentioned error level, this also leads to a value of 15 patients per group. We were not aware of previous relevant studies for the Behavioural Inattention Test. 25 We therefore decided that 15 patients per group should be included in our study. To compare the effects of the treatments, we subtracted the performance of the patients before and after the treatment. To analyze the group differences, we performed Mann-Whitney U tests for these difference scores comparing RT/OT, CT/OT, and RT/CT. For the secondary outcome parameters, the significance level was set to P < .0166 (P < .05/3 domains: attention, conjunction search, and activities of daily living) because of multiple testing. Intragroup comparisons of treatment effects were done using the Friedman test.
Results
Patients were recruited on average about 4 weeks after their stroke. At baseline, the 3 groups did not differ in demographic and neuropsychological measures. Demographic data are summarized in Table 1.
Summary of Demographic, Lesion, and Impairment Data of the 3 Treatment Groups a
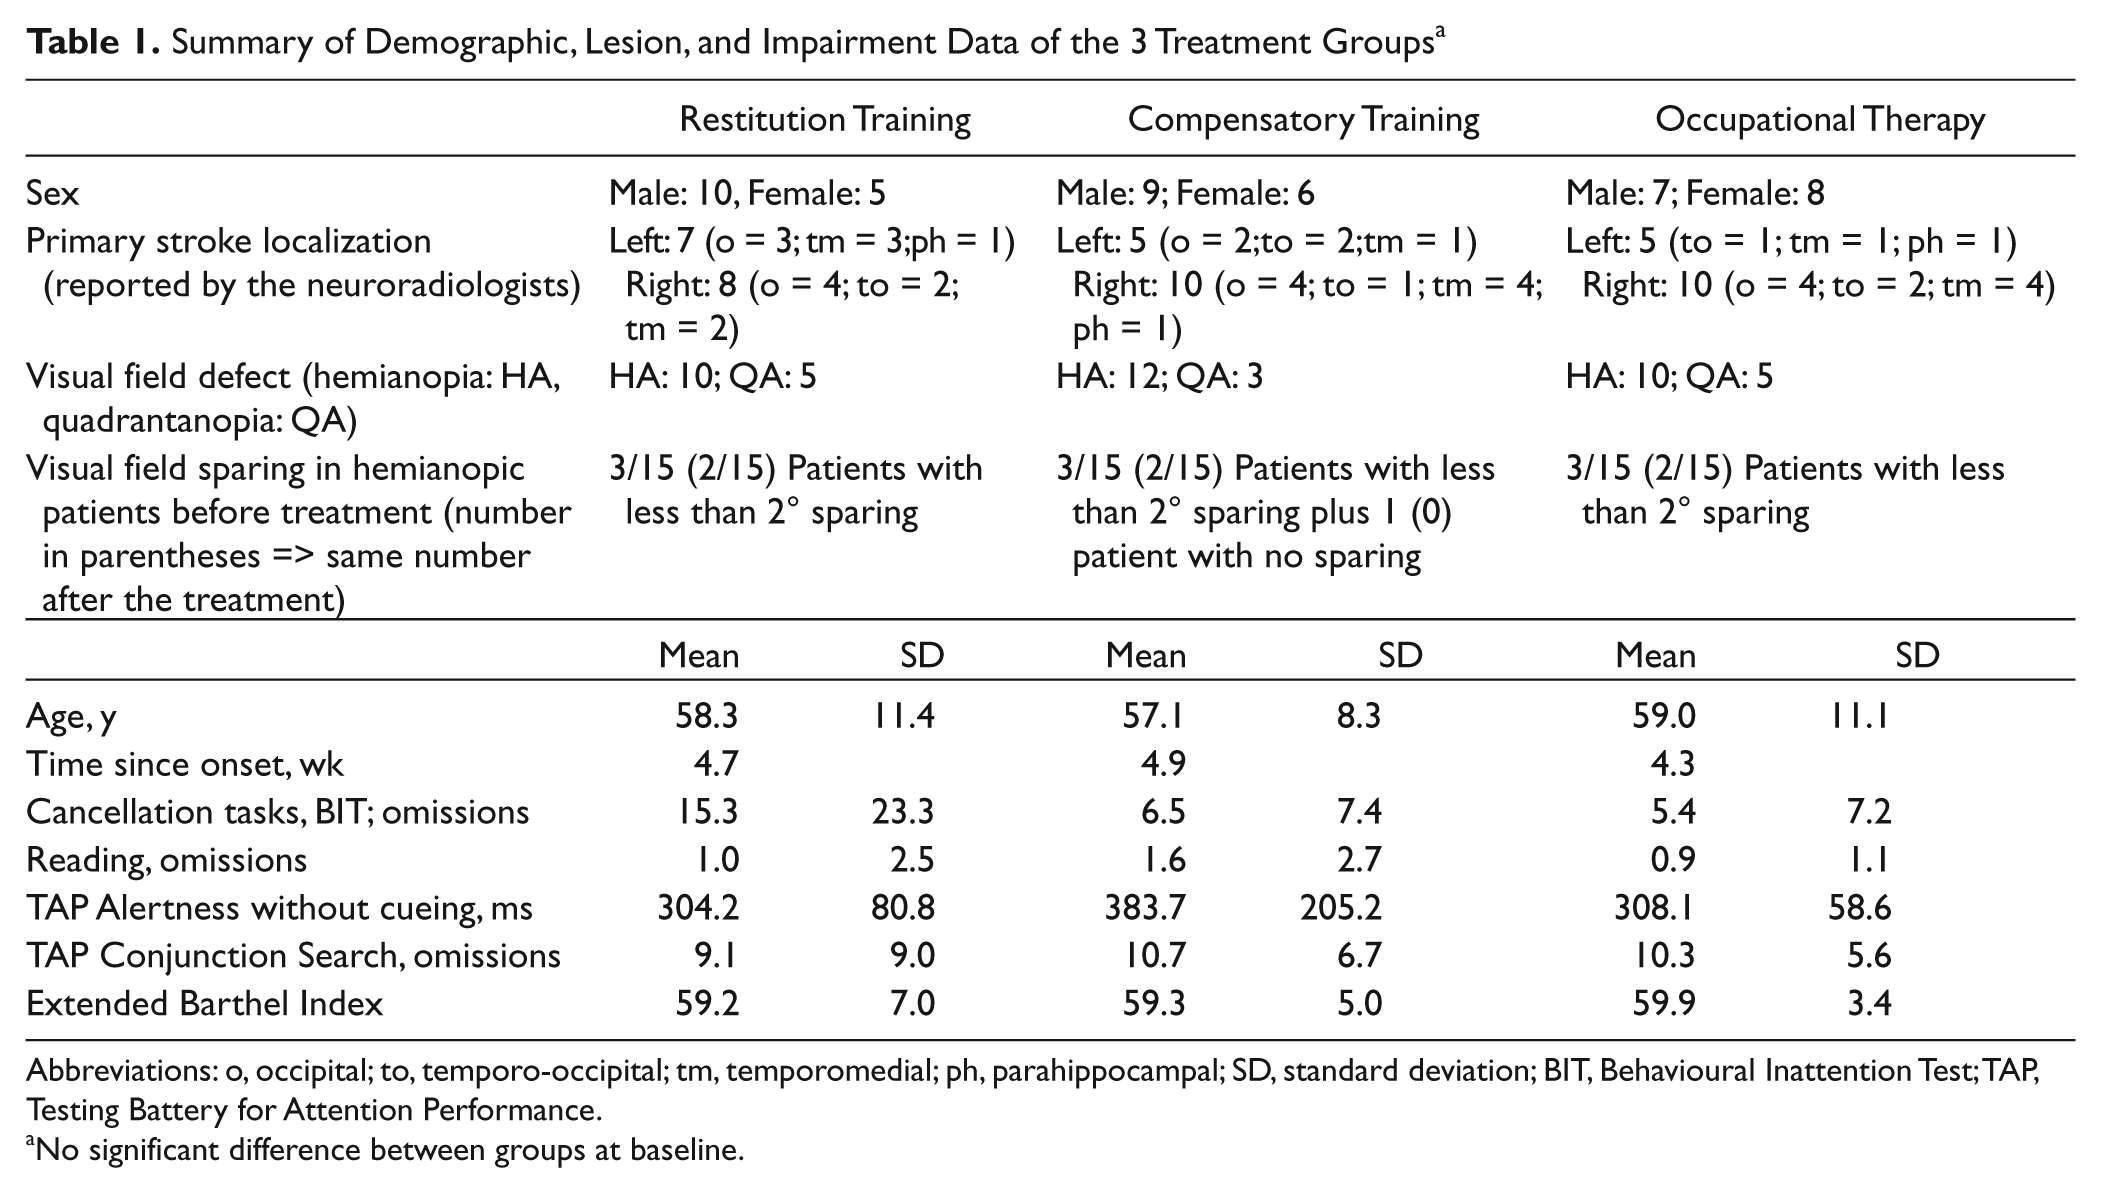
Abbreviations: o, occipital; to, temporo-occipital; tm, temporomedial; ph, parahippocampal; SD, standard deviation; BIT, Behavioural Inattention Test; TAP, Testing Battery for Attention Performance.
No significant difference between groups at baseline.
All patients were highly motivated to improve the visual performance, and no one dropped out because of problems in compliance, but some patients complained that RT was exhausting and led to sensitive eyes.
Primary End Points
Visual field expansion
The mean visual field size (TAP visual field—omissions) at t1 did not differ between the groups (RT/OT, P = .852; CT/OT, P = .506; RT/CT, P = .589), and there was no significant group difference for the increase of the visual field after treatment. However, the intragroup comparisons (Table 2) showed a significant field expansion after both RT (P = .003) and CT (P = .013) but not after OT (P = .316).
Significant Improvement per Training Group (Only Intragroup Pre/Post Comparisons)
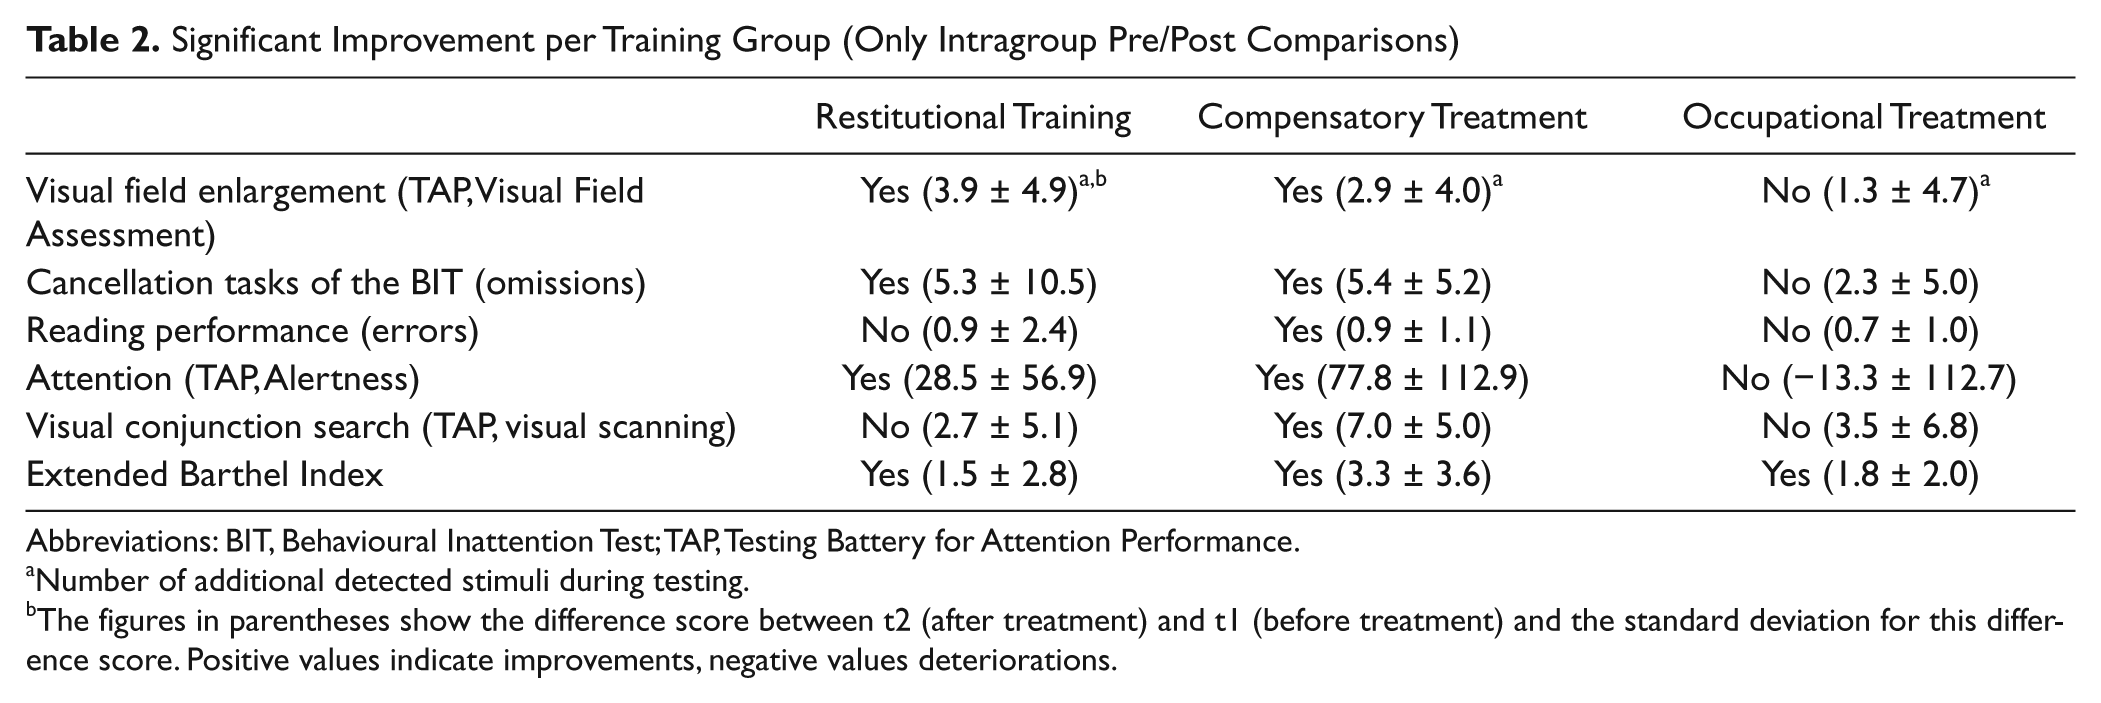
Abbreviations: BIT, Behavioural Inattention Test; TAP, Testing Battery for Attention Performance.
Number of additional detected stimuli during testing.
The figures in parentheses show the difference score between t2 (after treatment) and t1 (before treatment) and the standard deviation for this difference score. Positive values indicate improvements, negative values deteriorations.
Visual search performance
At t1, omissions in search (BIT, cancellation tasks) did not differ between the groups (RT/OT, P = .444; CT/OT, P = .554; RT/CT, P = .752). There was a significant improvement of performance in visual search for CT and OT (P = .048), but no significant benefit for RT could be found in comparison with OT. There were also no significant differences in improvement comparing RT with CT. Significant intragroup changes comparing t1 and t2 were only observed for RT (P = .005) and CT (P = .003) but not for OT (Table 2).
Reading performance
At t1, errors in reading did not differ between the groups: RT/OT, P = .437; CT/OT, P = .781; RT/CT, P = .257. Compared with OT, neither RT nor CT significantly reduced reading errors. There were also no differences between RT and CT. In contrast, the intragroup comparisons comparing t1 and t2 showed a significant reduction in reading errors after CT (P = .016) but not after RT or OT (Table 2).
There were no significant differences of the treatment effects in reading speed (measurement in words per second). The intragroup comparisons comparing t1 and t2 showed a significant improvement of reading performance after CT: from 64.2 to 51.8 s (P = .006) but not after RT or OT (RT from 86.6 to 101.5 s and OT from 58.8 to 49.4 s).
Secondary End Points
Attention
At t1, the alertness test (TAP Phasic Alertness) did not differ between the groups: RT/OT, P = .443; CT/OT, P = .547; RT/CT, P = .330. After Bonferroni correction, neither CT nor RT led to an improvement in attention performance compared with OT, although the comparison between CT and OT was almost significant (P = .020). Intragroup comparisons comparing t1 and t2 showed that only RT (P = .033) and CT (P = .001) significantly improved alertness (Table 2).
Conjunction search
Omissions in the exploration task (TAP visual scanning) at t1 did not differ between the groups: RT/OT, P = .454; CT/OT, P = .868; RT/CT, P = .289. Compared with OT, both the neuropsychological treatments did not result in superior improvements, and the improvement of the CT compared with the RT group did not meet the defined significance level after Bonferroni correction (P = .023). For intragroup comparisons only CT (P = .001) led to a significant improvement (Table 2).
Activities of daily living
The EBI score at t1 did not differ between groups: RT/OT, P = .495; CT/OT, P = .916; RT/CT, P = .649. Although no significant treatment effects were found when comparing RT/OT, CT/OT, and RT/CT, the intragroup comparisons (Table 2) demonstrated significant improvements after RT (P = .027), CT (P = .005), and OT (P = .003).
To analyze the association between treatment effects and ADL on a more global level, we divided the total group of patients into those who improved in ADL performance (n = 27) and those who did not (n = 18). We then analyzed whether these groups differed in our primary and secondary outcome parameters and found that improved visual search was the only parameter that differed significantly between the groups (Z = −3.001; P = .003). Patients with an improvement in ADL also showed significantly improved search performance and vice versa (Figure 2).
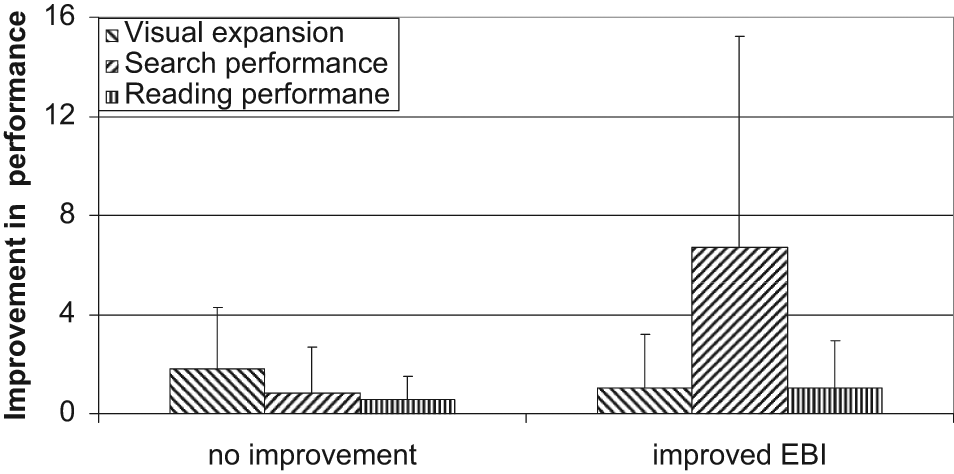
Patients with improvement in the EBI also improved in visual search performance significantly but not in field expansion. Abbreviation: EBI, extended Barthel Index.
Intercorrelation of improvements in primary outcome parameter with secondary outcome parameter
The nonparametric correlational analysis of improvement in the different tasks for all patients showed that visual field expansion was not significantly correlated with any other improvement, but visual search performance correlated with improvement in the Barthel Index (P = .004), in attention performance (P = .016), and in conjunction search (P = .046).
Discussion
We compared the efficacy of RT and CT for visual field loss in stroke patients in a placebo-controlled randomized trial. Whereas previous studies have shown that both treatment strategies can principally improve lost visual functions at least to a small extent, our results demonstrate that CT appears to be superior to RT and thus should be the treatment modality of choice in this patient group.
To date, several studies have reported an enlargement of the visual field in hemianopic patients after RT.6-11,30 Yet none of these studies used an active control group. We also found a small increase of the visual field of about 1° to 1.5° after CT and RT in this study, but such a small enlargement of the visual field is unlikely to improve functional outcome of the patient groups. In addition, the improvement was only found in the intragroup comparisons of RT and CT.
Because of the nature of our study design, the reason for the visual field enlargement cannot be explained adequately. It might be attributable to the responsiveness of neurons adjacent to the lesioned visual cortex, a phenomenon that has been shown in human and animal studies.8,31 On the other hand, patients might also have learned to focus their attention toward the hemifield and thereby improve the size of their visual field conceptualized as “an unspecific increase of alertness in unattended areas.”11,17 In this respect it seems noteworthy that a small but significant enlargement of the visual field was found in this and other studies using compensatory training strategies. 14 Moreover, our RT and CT groups improved significantly in alertness.
With respect to visual search, CT was superior to RT and also to OT in visual conjunction search. Roth et al 16 also found that CT led to a higher improvement in visual conjunction search than RT. The study of Roth et al involved patients in a chronic stage of hemianopia caused by various diseases. Our study results, therefore, extend their findings to a homogeneous group of first-ever stroke patients treated relatively early in their recovery process.
The specific PC program we used for CT (“Exploration” task from RehaCom, HASOMED) forces the patients to use a particular search strategy associated with improved eye movement patterns. 16 Hence the reduction of omissions in visual search in our CT group may be interpreted as a result of an improved top-down compensation strategy. 19
Whereas some previous studies reported increased reading abilities after RT,7,32 we and others did not observe such an effect. 30 In our study, only CT had a small but significant effect on reading. Generalization of CT to reading performance has not been documented.16,17 Our result might be attributable to the structure of CT used in this study. As already mentioned, the Exploration task of the RehaCom forces the patients to fix on an outermost starting point on the left, where a circular cursor starts moving rightward, item by item, until it reaches the outermost item on the right and then jumps back to the next outermost item on the left in the next line. This is highly similar to the eye movements during reading and this similarity in top-down control might be the reason our CT group also improved in reading.
We used the EBI to analyze the impact of our treatments on the activities of daily living because the Barthel Index focuses exclusively on basic skills like transfer, dressing, and eating among others. The EBI includes some cognitive and perceptual items, so we anticipated that it might be more sensitive for the functional problems of our patient group. The pretreatment EBI scores for all groups were high, however, which may have created a ceiling effect. In a post hoc evaluation only improvements in visual search were associated with increases in the EBI scores, whereas the visual field enlargements were not associated with ADL improvements. The association between the increase in ADL score and improvement in visual search underscores the impact of compensation of visual field defects for functional outcome.
Limitations of our study design include the relatively small sample size of each group and no follow-up data beyond the inpatient stay to test for stability of the treatment effects. Although the number of treatment sessions was realistic for postacute inpatient treatment, more sessions might be needed to achieve a restitutive effect. Finally, the location of the lesions (cortical vs white matter) was not obtained in this study. At least theoretically, the chances for restitution might be greater in patients with cortical lesions not extending deeply into the optic radiation.
Summary
In conclusion, visual field deficits improve mildly after both RT and CT compared with usual OT training. However, for most of the outcome parameters analyzed in this study, CT was superior to RT and thus should be further evaluated as the modality of choice in the early phase of treatment for stroke.
Footnotes
Acknowledgements
We thank all patients for participating. The authors thank TELTRA (Neurological Department, University of Bochum, Bochum, Germany) and HASOMED (GmbH, Magdeburg, Germany) for support in providing their programs.
The author(s) declared no potential conflicts of interest with respect to the research, authorship, and/or publication of this article.
The author(s) received no financial support for the research, authorship, and/or publication of this article.