
Abstract
Objective. To assess the reliability of the electrical perception threshold (EPT) in healthy participants and its responsiveness in patients for 6 months after traumatic spinal cord injury (SCI). Methods. The reliability of EPT measures was assessed in 15 healthy volunteers (from C3 to S2). EPT measures were assessed in 37 patients at 1, 3, and 6 months after SCI. EPT was determined in dermatomes at, above, and below the neurological level of lesion. Reliability was quantified with an intraclass correlation coefficient (ICC) and responsiveness with the standardized response mean (SRM). Dermatomes were classified as having normal or pathological sensory perception, based on both light touch (LT) and EPT testing. The percentage of agreement between LT and EPT classifications was determined. Results. The ICCs varied considerably between dermatomes (0.00 ≤ ICC ≤ 0.86). Overall, EPTs changed little within the first 6 months after SCI, resulting in small SRM values. Agreement between classifications according to EPT or LT testing varied from 30% to 100%. The least agreement was observed in the first segment below the lesion. Conclusion. Future studies must note that the reliability of EPT differs between dermatomes in healthy participants. Furthermore, at and below the level of the lesion, spontaneous recovery of sensory perception is poor within the first 6 months after SCI. Based on subgroup analyses, if a translational trial aims to improve sensory perception around the level of the lesion, sensory-incomplete tetraplegic patients could be included. These patients show poor spontaneous recovery, and the EPT may detect subtle changes in perception.
Introduction
New approaches to repair or regenerate the damaged spinal cord are in the process of being translated from bench to bedside or have actually been applied to humans, albeit under some controversy.1,2 Promising approaches, such as the human anti-Nogo-A antibody, for which currently a phase II trial is being prepared, 3 could potentially improve recovery of function. Initially, most translational trials that aim to restore or repair the damaged spinal cord will include patients with a thoracic sensorimotor complete spinal cord injury (SCI). In these patients, it is expected that regenerative interventions may restore function in 1 or 2 segments caudal to the lesion. 4 However, clinical sensory assessments such as the light touch (LT) and pin prick (PP) tests, performed according to the International Standards for the Neurological and Functional Classification of Spinal Cord Injury (hereafter, International Standards), 5 may not be sufficiently sensitive to monitor safety and/or detect a subtle therapeutic benefit. 6 Moreover, it may not be able to elucidate potential mechanisms of recovery. 7
To overcome these shortcomings of LT testing, the electrical perception threshold (EPT) test was introduced. 8 The EPT can be defined as the lowest electrical stimulus intensity at which the participant reports sensation. Reference values have been obtained for each dermatome between cervical 3 (C3) and sacral 2 (S2), 9 and a recent study reports age- and gender-specific normograms. 10 The EPT seems to add sensitivity and resolution to the standard clinical testing, 9 and its interrater and intrarater reliability appear to be moderate to good. 11 It is likely that the EPT assesses dorsal column function because pathological EPT values have been shown to predict pathological or absent dermatomal somatosensory-evoked potential (dSSEP) recordings in >80% of assessed dermatomes. 12
Two reports have documented the sensitivity of EPT in detecting changes in segmental sensory perception secondary to SCI. In the first, a reduction in EPT was observed at and below the level of the lesion over time in 11 sensory-incomplete patients (ASIA Impairment Scale [AIS] B, C, and D). 13 However, in this study, the baseline assessment was performed from 1 to 72 months after SCI, and the follow-up assessment was performed 9 to 25 months later. These methodological aspects make it difficult to use these data for sample size calculations in clinical trials. Another report indicated that the EPT’s sensitivity might be less compared with that of dSSEPs, by showing that changes in dSSEP latencies were not always accompanied by a change in EPT. 14
Therefore, the aims of our study were to determine the reliability of the EPT for each individual dermatome in healthy participants and the sensitivity of the EPT to detect changes over time (ie, responsiveness). Furthermore, we classified dermatomes as having pathological or normal sensation according to LT and EPT testing and determined the agreement between these classifications. To our knowledge, this is the first multicenter study that has prospectively investigated the responsiveness of EPT at fixed time points following traumatic SCI.
Methods
Healthy Participants and Patients
Although some EPT test-retest reliability results have been reported,11,15 reliability values for each dermatome between C3 and S2 are yet to be determined. Therefore, we assessed the EPT twice (with at least a week between each assessment) in a convenience sample of 15 healthy volunteers at the Balgrist University Hospital. The average (±standard deviation [SD]) age of the participants (8 female) was 30 ± 8 years (range, 23-45 years). Their mean bodyweight was 67 ± 11 kg, and the height was 1.74 ± 0.11 m.
This EPT responsiveness study was conducted within the European Multicenter Study for Human Spinal Cord Injury (EM-SCI, www.emsci.org). The assessments were performed at 1 month (time window 16-40 days), 3 months (70-98 days), and 6 months (150-186 days) postinjury. We included patients with either a sensorimotor-complete or -incomplete injury following traumatic SCI and a neurological level of lesion (as defined by the International Standards) 5 above thoracic 10 (T10). The International Standards provide, in addition, information about the completeness of the lesion and the sensory (LT and PP) and motor level of the lesion. Furthermore, the AIS categories A to E can be determined.
Within the EM-SCI, the investigators participated in regular training sessions to standardize the examination procedures, thereby ensuring high-quality examinations. The AIS classifications are performed by a bespoke computer algorithm, according to the definitions of the International Standards. 5 The algorithm uses both a logic approach check and a brute force technique to handle missing values or nontestable segments. 16
The patients were recruited after they provided written informed consent. This study was approved by the local ethics committee of each participating center. Only patients with data records assessed at 1, 3, and 6 months postinjury were included in the analyses. Patients who were unable to cooperate during assessments or give informed consent (eg, those with dementia, psychological disorders, and language barriers) and patients with peripheral nerve lesions above the level of injury or severe brain injuries were not included in this study.
In all, 37 SCI patients with a traumatic etiology (7 female patients) participated. The SCI patients were on average 42 ± 16 years old (range, 18-66 years). At 1 month postinjury, patients were classified as follows: 16, AIS A; 5, AIS B; 6, AIS C; and 10, AIS D. Among them, 11 patients had a paraplegia (10 sensory complete and 1 sensory incomplete), and 26 patients had a tetraplegia (6 sensory complete and 20 sensory incomplete). The SCI patients were recruited in several centers within the EM-SCI: Barcelona (Spain), 13 patients; Bayreuth (Germany), 1; Glasgow (UK), 9; Halle (Germany), 5; Karlsbad-Langensteinbach (Germany), 1; Nijmegen (Netherlands), 2; and Zurich (Switzerland), 6.
Assessment of the EPT
Prior to the start of this study, the recording techniques and materials were standardized across all testing centers. In addition, all assessors received a manual that gave detailed instructions on performing the tests.
When investigating the EPT’s reliability in healthy participants, we assumed a symmetrical distribution of EPTs 10 and therefore tested only dermatomes on the right side of the body between C3 and S2. When investigating the responsiveness in patients with SCI, a maximum of 14 dermatomes were tested bilaterally: at the neurological level (according to the International Standards), 5 and at the first, second, and fifth dermatomes rostral and caudal to the neurological level.
The participants were comfortably positioned in a supine position, lying on a bed in a quiet room throughout the test. The skin was cleaned with alcohol, and pediatric ECG electrodes (cathode) with a diameter of 18 mm (3M Red DotTM, type 2248) were attached over the ASIA sensory key points. A large (50 × 90 mm2) inactive electrode (anode; Synapse Electrodes, Ambu, Denmark) was attached to the wrist or ankle joint. The fifth dermatome rostral to the lesion was tested first, so that the patient was able to experience the stimulation in a dermatome with intact sensation. If this was not possible, the first stimulation was applied to another unaffected dermatome. Then, each of the subsequent lower dermatomes was tested, one at a time.
For every dermatome tested, the stimulus intensity was manually increased and decreased slowly, with changes applied not more frequently than once per second, until the participant first reported the sensation (ascending) under the cathode. This was repeated 3 times, and the lowest EPT (expressed in mA) out of the 3 trials was included in the analyses. A square-shaped stimulus of 0.5 ms duration delivered at 3 Hz was used.
Most centers used their standard electrophysiological stimulator and increased the current in steps of 0.1 mA, whereas the maximum stimulation applied was 40 mA. 12 Three centers (Halle and Bayreuth, Germany, and Zurich, Switzerland) used a modified mobile Compex 2 stimulator. The maximal stimulator output was reduced from 120 mA to 26.9 mA, whereas the smallest increment was improved from 1.0 mA to 0.21 mA. The EPT was considered absent if the maximum current (40 mA or 26.9 mA) was not perceived.
Data Analysis
The lowest EPT value for each dermatome was analyzed. Because EPT values in healthy participants differed between segments and because we intended to show changes in EPT over time at segments relative to the lesion level in SCI patients, we proposed a normalization: EPTnorm was set equal to the recorded EPT value in SCI patients divided by the EPT value corresponding to the upper limit of the 95% confidence interval (CI) of the recorded EPT value in healthy participants in the dermatome being tested (see Table 1). EPTnorm values above 1 indicated a pathologically increased threshold, and values below 1 were considered normal. For example, an EPT value of 2.5 mA could indicate pathological sensation (when recorded at the C5 dermatome) or normal sensation (when recorded at C6) because the corresponding EPTnorm values would be 1.23 (C5) or 0.85 (C6).
Norm Values and Reliability of the EPT in Healthy Participants a
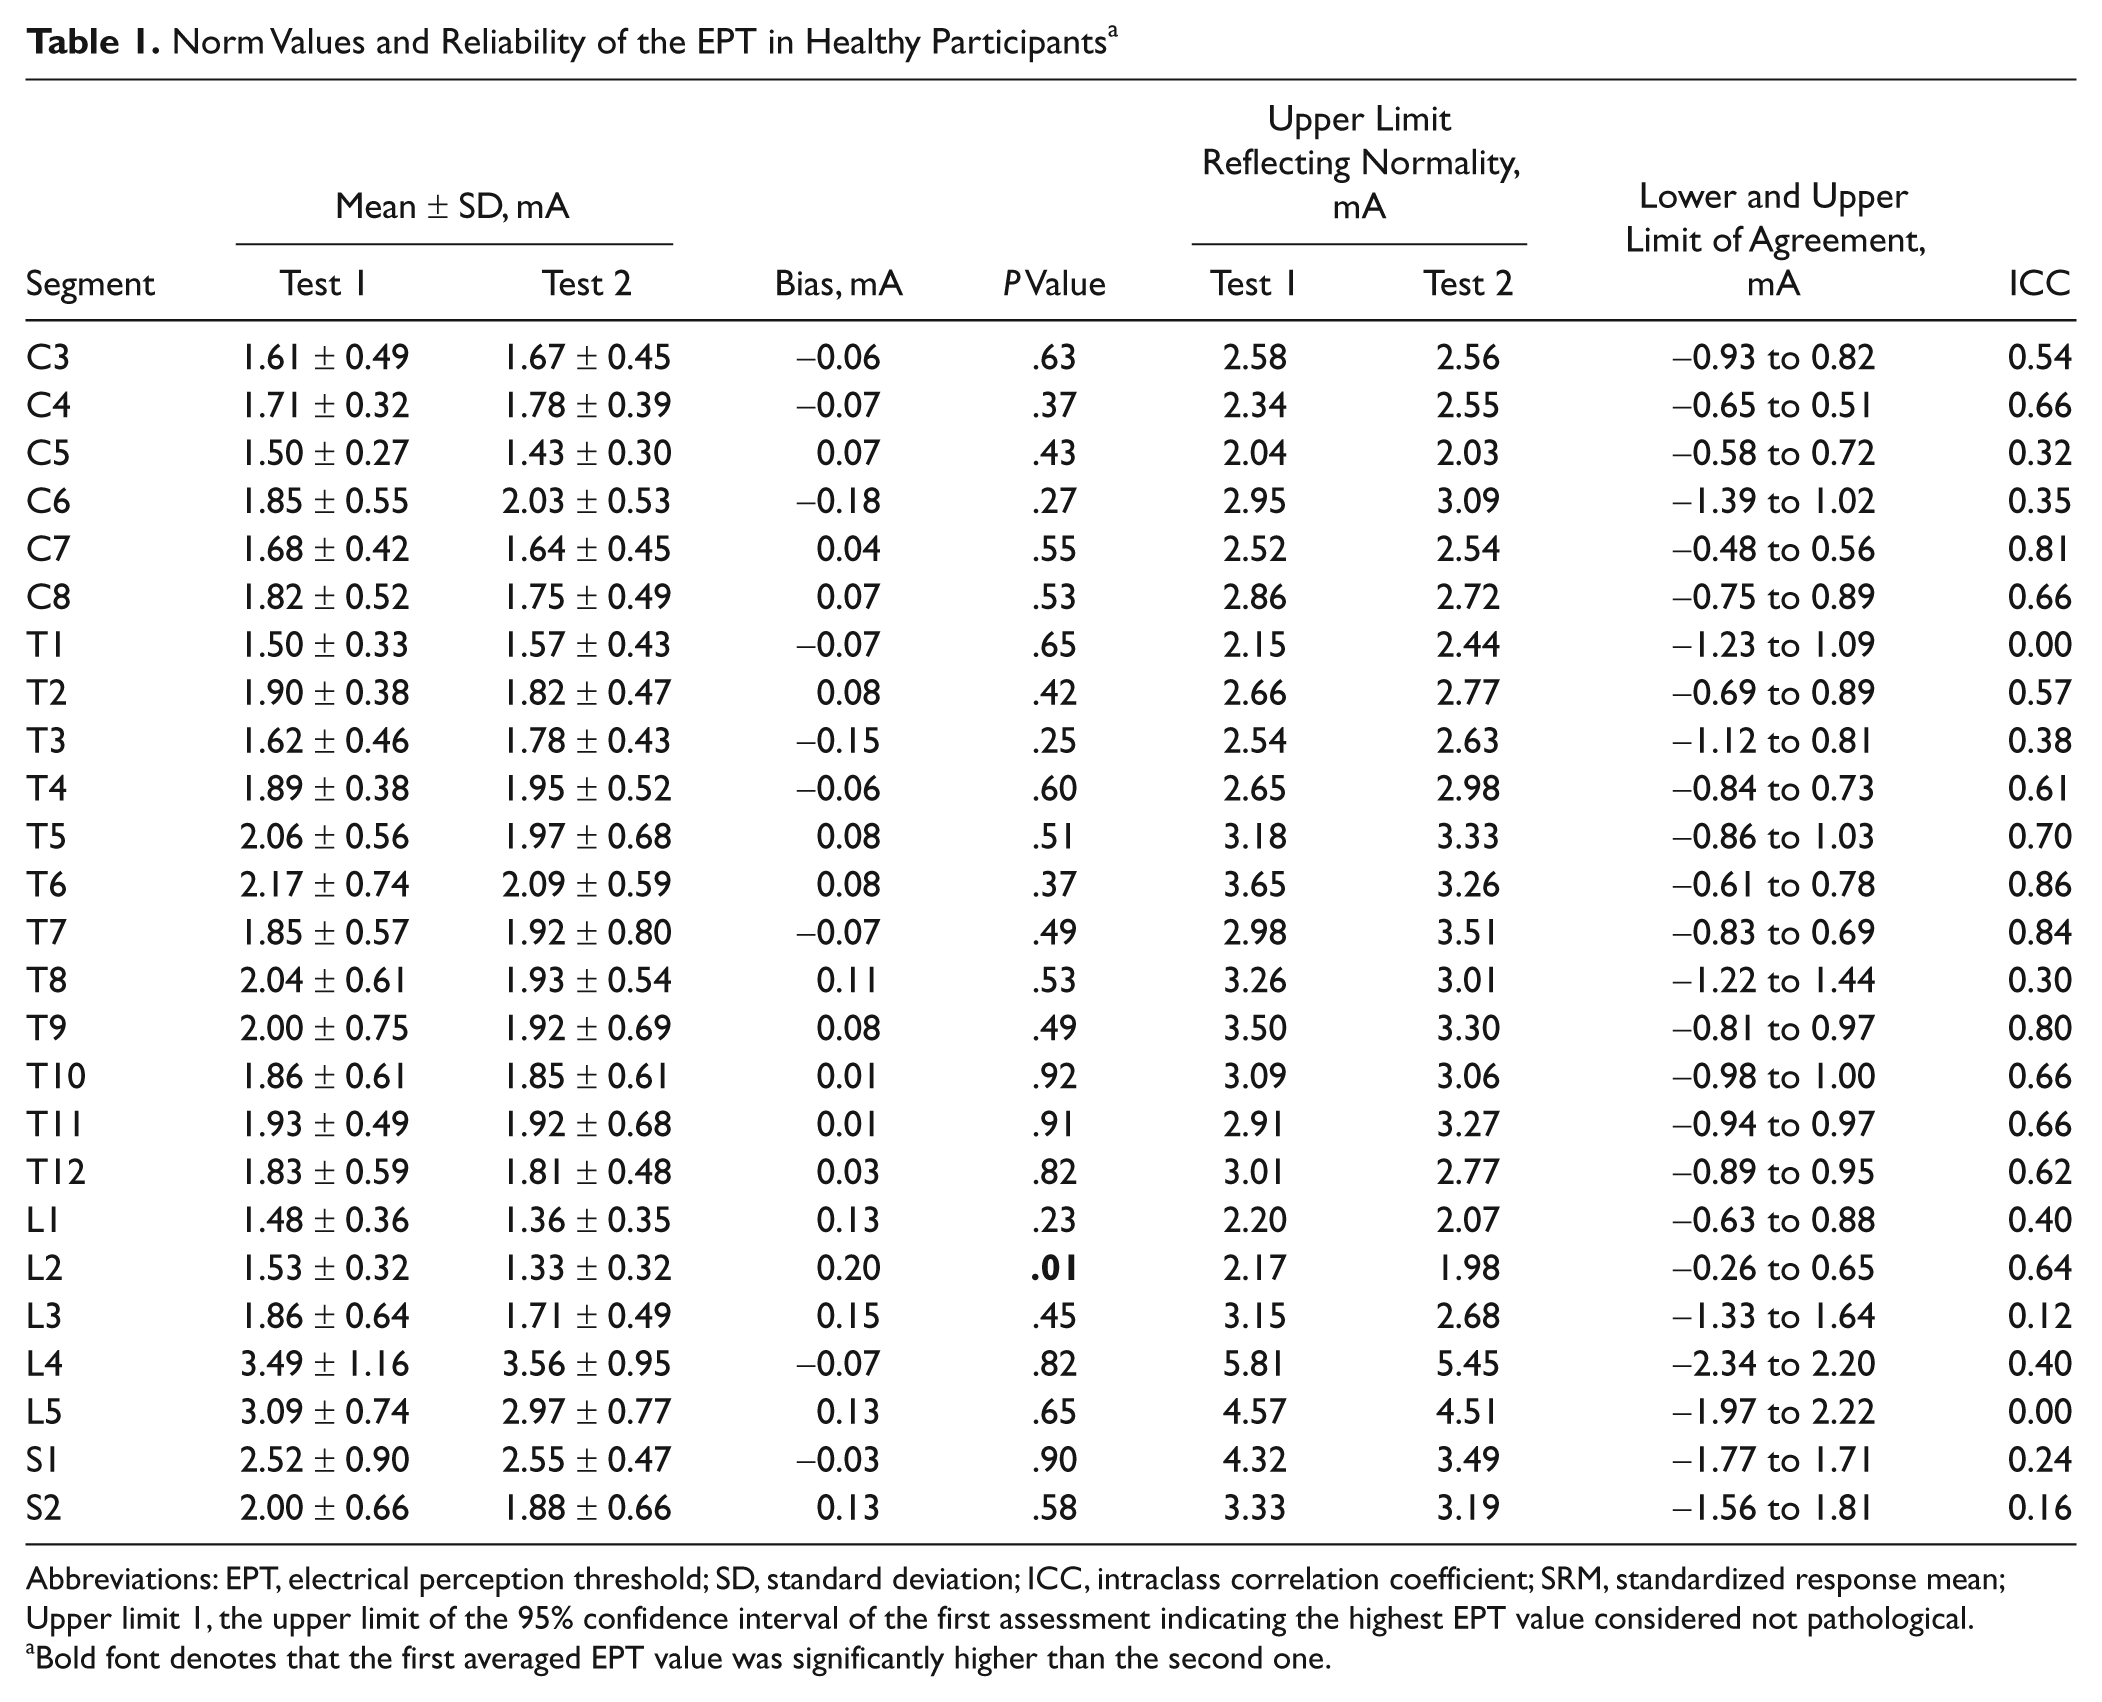
Abbreviations: EPT, electrical perception threshold; SD, standard deviation; ICC, intraclass correlation coefficient; SRM, standardized response mean; Upper limit 1, the upper limit of the 95% confidence interval of the first assessment indicating the highest EPT value considered not pathological.
Bold font denotes that the first averaged EPT value was significantly higher than the second one.
Finally, we determined the percentage of agreement between the classifications “pathological” and “normal” sensation based on the EPT and ASIA LT testing (LT “absent” and “impaired” were classified as “pathological”).
Statistical Analysis
Reliability and responsiveness are closely related concepts, and several statistical analyses were used to quantify stability (or change) of the EPT. Bland-Altman analyses were performed to determine the absolute reliability. We calculated the bias (ie, the average difference between the first and second assessment) and the upper and lower limits of agreement (ie, bias ± [1.96 × SD] of the differences). 17 Relative reliability was quantified by an intraclass correlation coefficient (ICC) as advocated by Rousson et al. 18 A general linear model (random factors) was performed, in which the ICC could be interpreted as the percentage of variability in measurements explained by the subject effect or σs2/(σs2+ σr2 + σe2). Here, σs2 reflects the subject effect, σr2 the amount of systematic error, and σe2 the amount of measurement error. 18 In healthy participants, reliability was determined for each dermatome, whereas in those with SCI, the ICC was calculated only for the dermatomes 5 and 2 segments rostral to the lesion.
In patients with SCI, differences in EPT values between the 3 time points were tested using the nonparametric Friedman test (α = .05). In case of significance, we performed consecutive Wilcoxon signed rank tests, which were corrected for multiple pairwise comparisons (α = .025). Responsiveness was quantified by the standardized response mean (SRM). The SRM is the preferred method of quantifying internal responsiveness when a clinically relevant difference is unknown. 19 SRM values of 0.20 indicate small responsiveness; 0.50, medium responsiveness; and above 0.80, large responsiveness.
Finally, the smallest real difference (SRD) was calculated to determine the change in EPT that should be considered the smallest measurement change that can be interpreted as a real change—that is, beyond zero. The SRD is defined as 1.96 × √2 × standard error of the measurements (SEM), 20 where SEM = √(within-subject variance). With respect to translational trials, this measure should indicate the change in EPT that should be achieved to be detected beyond any potential spontaneous recovery within the corresponding time frame.
Because differences in sensory recovery depending on completeness and the level of lesion can be expected, we performed additional subgroup analyses.
Results
Reliability
In the healthy participants, the second assessment was performed 44 ± 37 days (range, 8-129 days) after the first assessment. The mean EPT values for the first and second assessments were quite comparable (Table 1). Only for segment L2, did we find a smaller EPT during the second test. The upper limits of the 95% CIs reflecting normal EPT were comparable between the first and second assessments (Table 1). Some segments showed small limits of agreement and high ICCs (>0.80) and were therefore considered reliable (eg, C7, T6, T7, and T9). Between L3 and S2, and also at T1 and T8, the small ICCs and the relatively large limits of agreement indicated poor reliability. Other segments showed discrepancies between the ICC and the limits of agreement: For example, at C5, the limits of agreement were smaller (−0.58 to 0.72 mA), but nevertheless, the ICC was poor (0.32), whereas for T5, we found rather large limits of agreement (−0.86 to 1.03 mA) but a moderate ICC (0.70).
In the SCI patients, reliability was determined in 2 and 5 levels rostral to the neurological level of lesion (absolute EPT values; see Table 2). At 5 levels above the lesion, the ICC values were estimated to be 0.76 (left side) and 0.57 (right side; n = 13 patients, because the other 24 patients had a lesion above C8). These values were 0.66 (left) and 0.73 (right) at 2 levels above the lesion (n = 19 patients).
EPT at 1, 3, and 6 Months in 37 Patients With SCI a
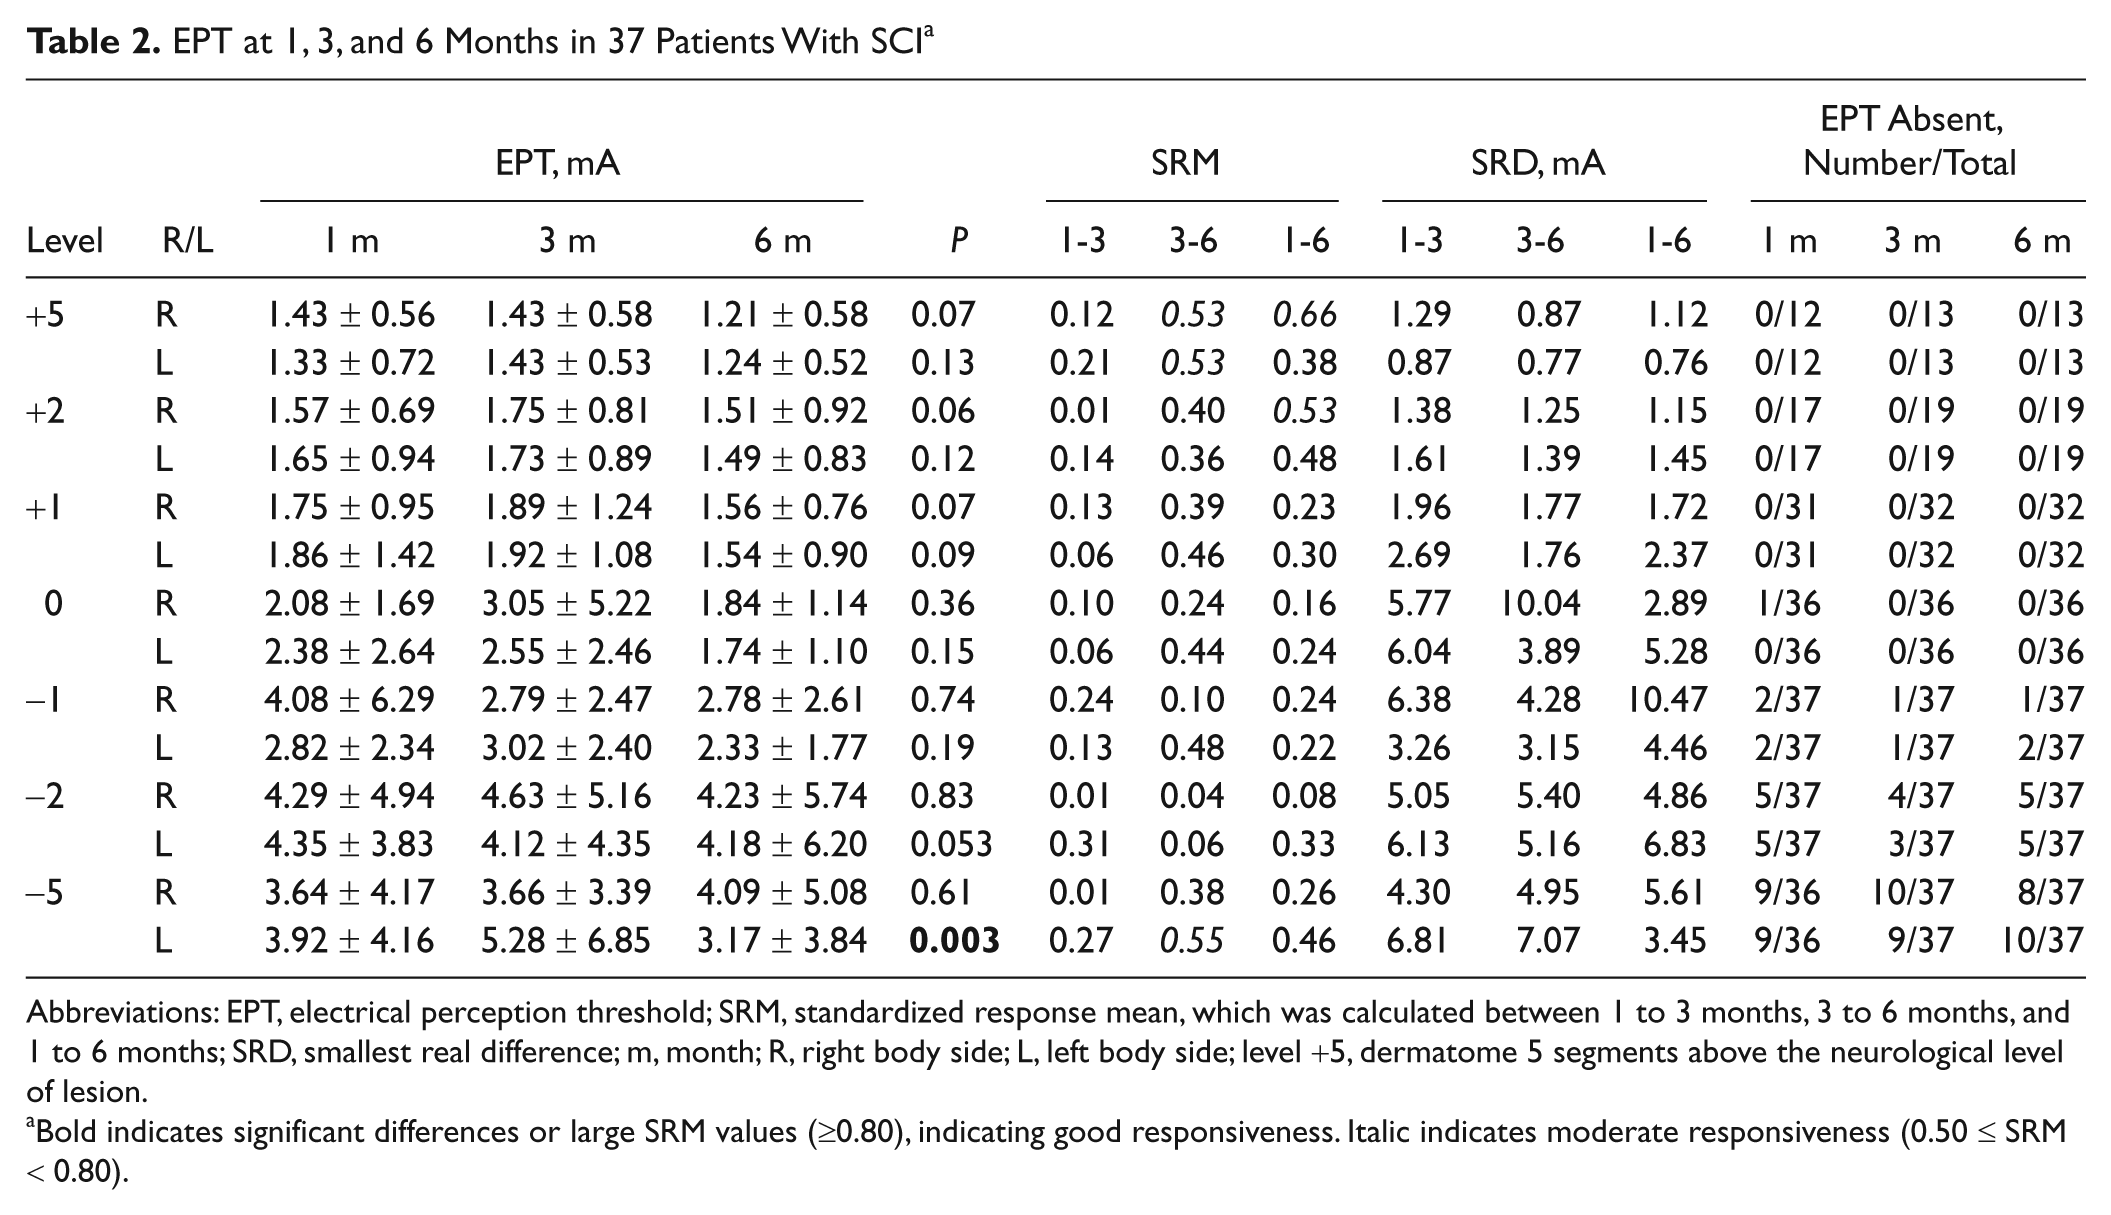
Abbreviations: EPT, electrical perception threshold; SRM, standardized response mean, which was calculated between 1 to 3 months, 3 to 6 months, and 1 to 6 months; SRD, smallest real difference; m, month; R, right body side; L, left body side; level +5, dermatome 5 segments above the neurological level of lesion.
Bold indicates significant differences or large SRM values (≥0.80), indicating good responsiveness. Italic indicates moderate responsiveness (0.50 ≤ SRM < 0.80).
Changes in EPT Over Time
The EPT remained relatively stable within the first 6 months after SCI (Table 2), and Friedman test showed only a significant difference in EPT at 5 levels below the lesion (left side). Here, the EPT at 6 months was significantly smaller compared with the EPT at 1 (P = .05) and 3 months (P = .002). The relatively stable EPT values resulted in a poor responsiveness (reflected in small SRM values). Only at some levels and for certain time intervals could the responsiveness be considered moderate (Table 2). In segments rostral to the lesion, the SRD values, which quantified the change in EPT that could be considered a true difference, varied between 0.76 and 2.69 mA. The SRD values caudal to the lesion were considerably larger. Finally, the number of dermatomes with absent EPT increased from segment to segment below the level of the lesion.
Agreement Between LT and EPT
With respect to classifying dermatomes as normal or pathological, the overall agreement between classifications based on LT and EPT testing amounted to 71.5% (1 month; n = 410 dermatomes), 73.8% (3 months; n = 408) and 77.4% (6 months; n = 420). It is interesting to note that in about 17 dermatomes with absent LT, EPTs could be perceived (Figures 1A and 1B). Furthermore, in dermatomes that deteriorated from having impaired perception to absence of perception between 1 and 3 months, the EPT increased (Figure 1A). Between 3 and 6 months, EPTs became smaller in segments that remained impaired or normal or improved from impaired to normal (Figure 1B).
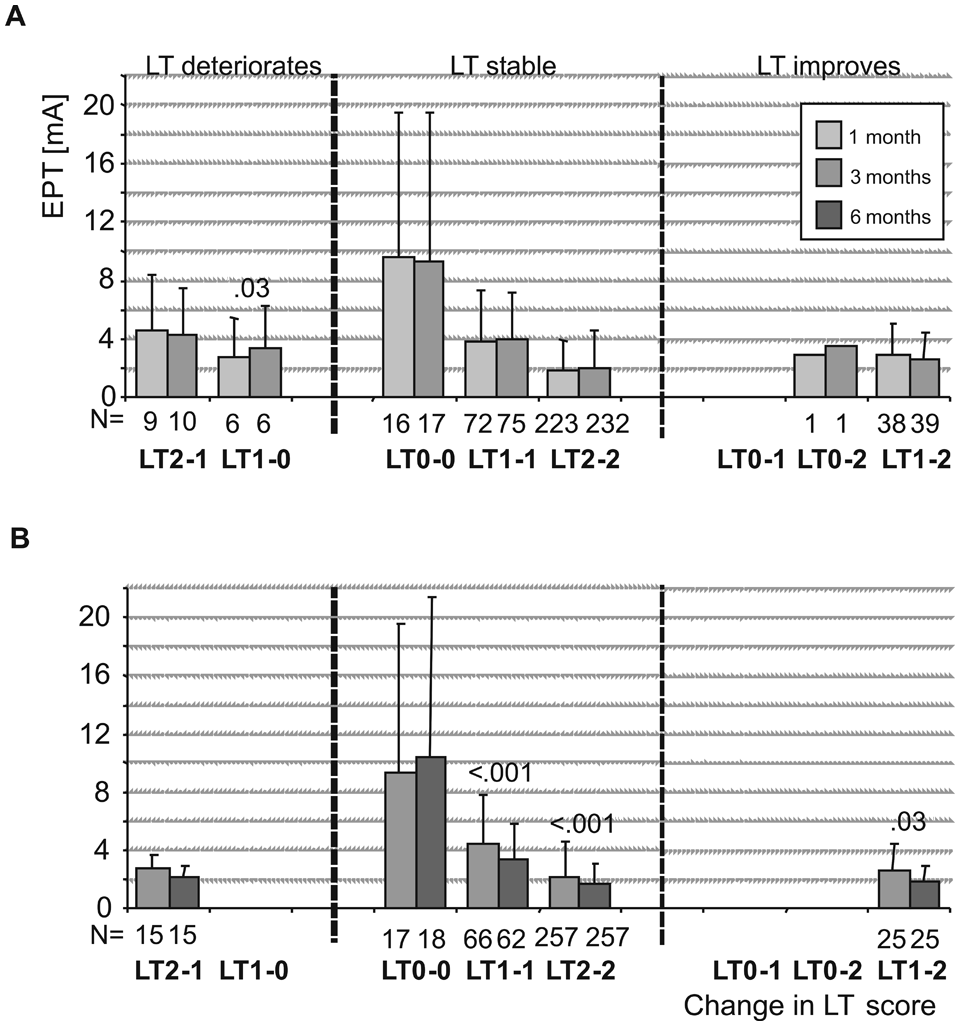
Changes in EPT within LT categories: changes in EPT in dermatomes that deteriorated, for example, from normal to impaired (LT2-1); remained equal, for example, remained absent (LT0-0) or improved from impaired to normal (LT1-2) between (A) 1 and 3 months and (B) 3 and 6 months. Significant P values as well as the number of observations (n) are provided. Abbreviations: EPT, electrical perception threshold; LT, light touch.
Subgroup Analyses
More detailed analyses were performed for 2 subgroups: paraplegic, sensory-complete group (n = 10) and tetraplegic, sensory-incomplete group (n = 20).
Sensory-complete paraplegia
Especially at and above the lesion, absolute EPT values changed in patients with a sensory-complete paraplegia (Table 3). Reductions in EPT at 6 months were observed at 5 segments rostral to the lesion (+5), on the right side, at 6 months versus 1 month (P = .018); right side, between 6 and 3 months (P = .025, +2 segments, and P = .007, +1 segment); and +1 segment, right side, between 6 and 1 months (P = .02). Furthermore, this was also observed at lesion level, on the left side, between 6 and 3 months (P = .009) and 6 months and 1 month (P = .047). This was in agreement with high responsiveness values (SRM > 0.80) at the corresponding segments and time intervals. Nevertheless, the corresponding absolute changes in EPT were small and did not exceed about 0.5 mA (except at lesion level, left side). Furthermore, at 5 segments caudal to the lesion, right body side, high SRM values indicating large responsiveness were observed (Table 3). However, these values were based on only 2 observations because most patients did not perceive an EPT. In segments rostral to the lesion, the smallest EPT measurement change that could be considered a real difference (SRD) varied between 0.69 and 2.28 mA (Table 3). In segments at and caudal to the lesion, large SRD values were observed.
EPT at 1, 3, and 6 Months in 10 Patients With Sensory-Complete Paraplegia a
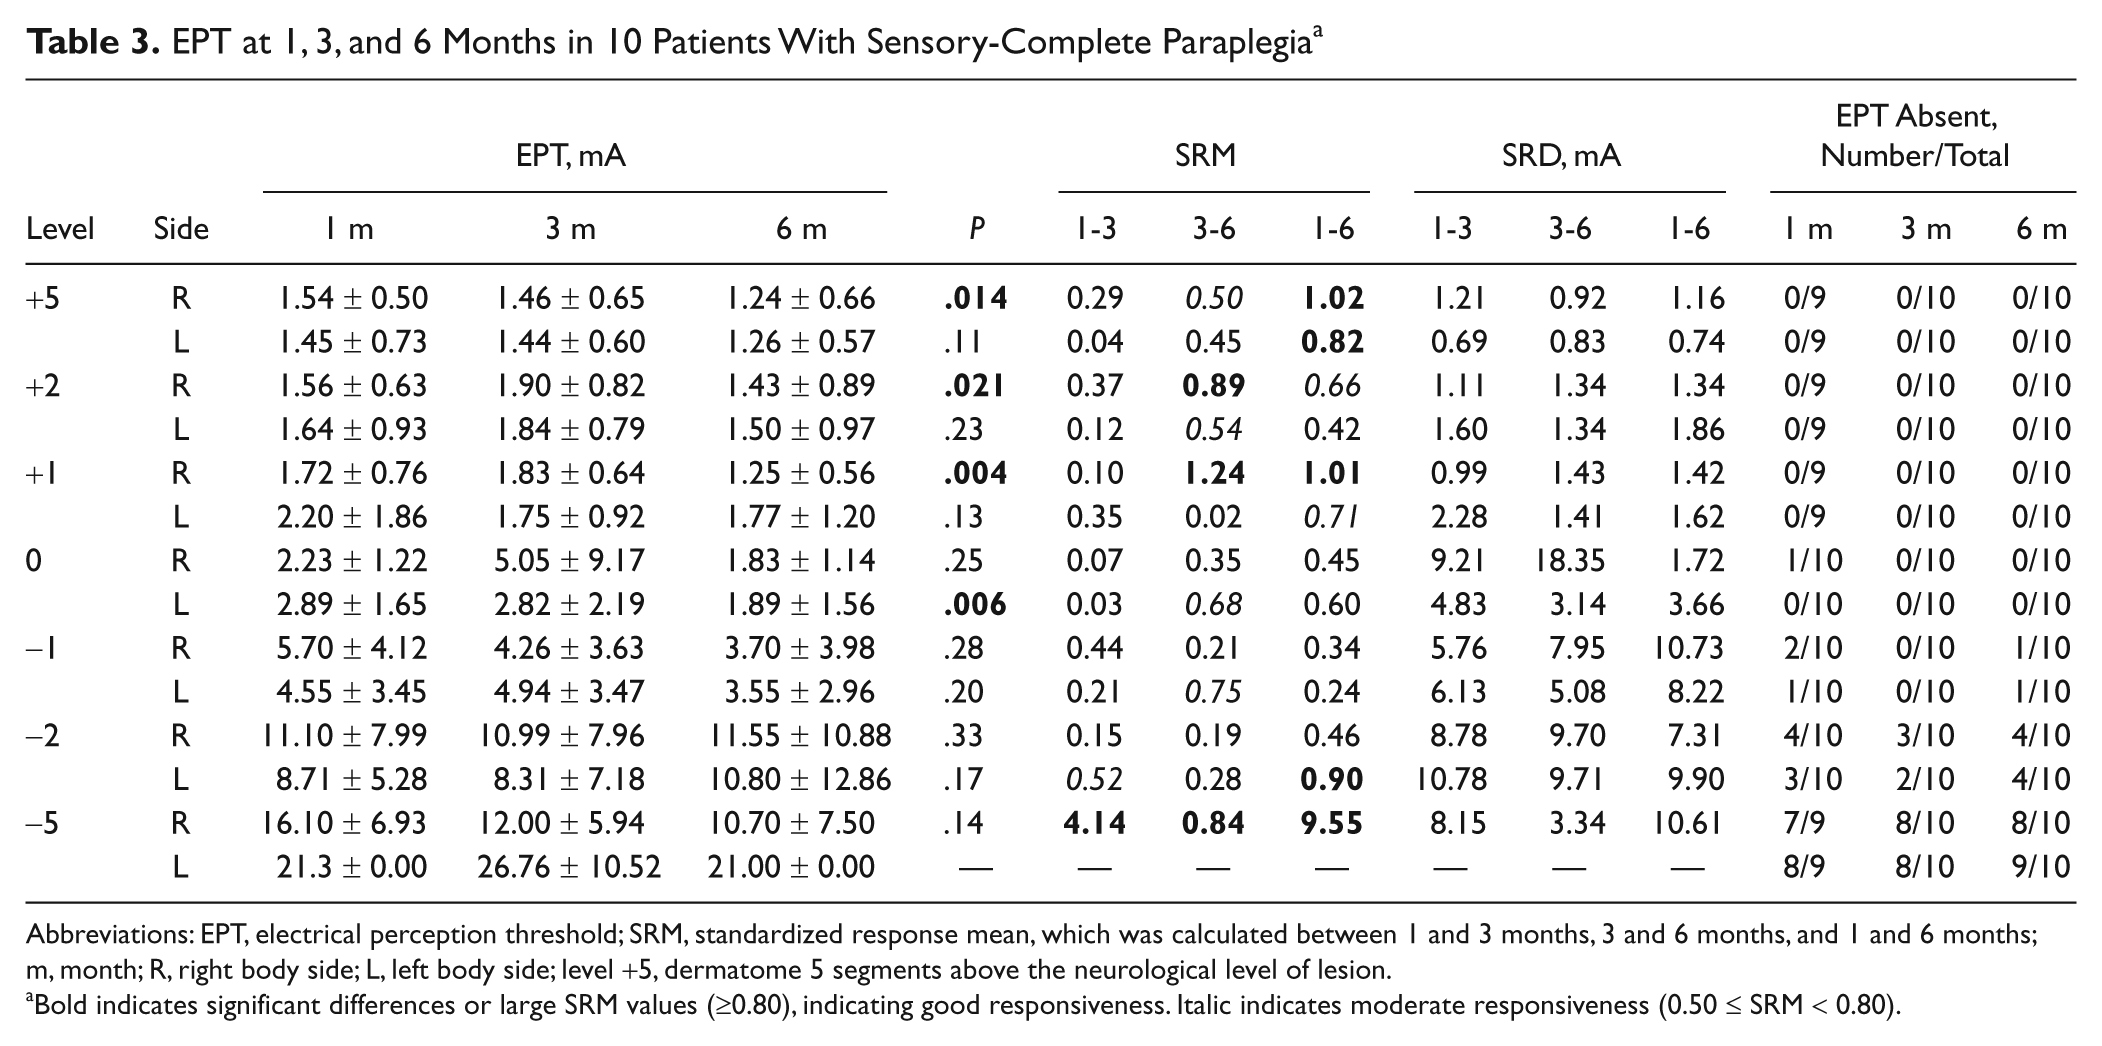
Abbreviations: EPT, electrical perception threshold; SRM, standardized response mean, which was calculated between 1 and 3 months, 3 and 6 months, and 1 and 6 months; m, month; R, right body side; L, left body side; level +5, dermatome 5 segments above the neurological level of lesion.
Bold indicates significant differences or large SRM values (≥0.80), indicating good responsiveness. Italic indicates moderate responsiveness (0.50 ≤ SRM < 0.80).
Longitudinal changes in EPTnorm values were similar to the nonnormalized data; however, it was much easier to distinguish between normal or pathological EPT values across the various dermatomes from the figure (Figure 2A).
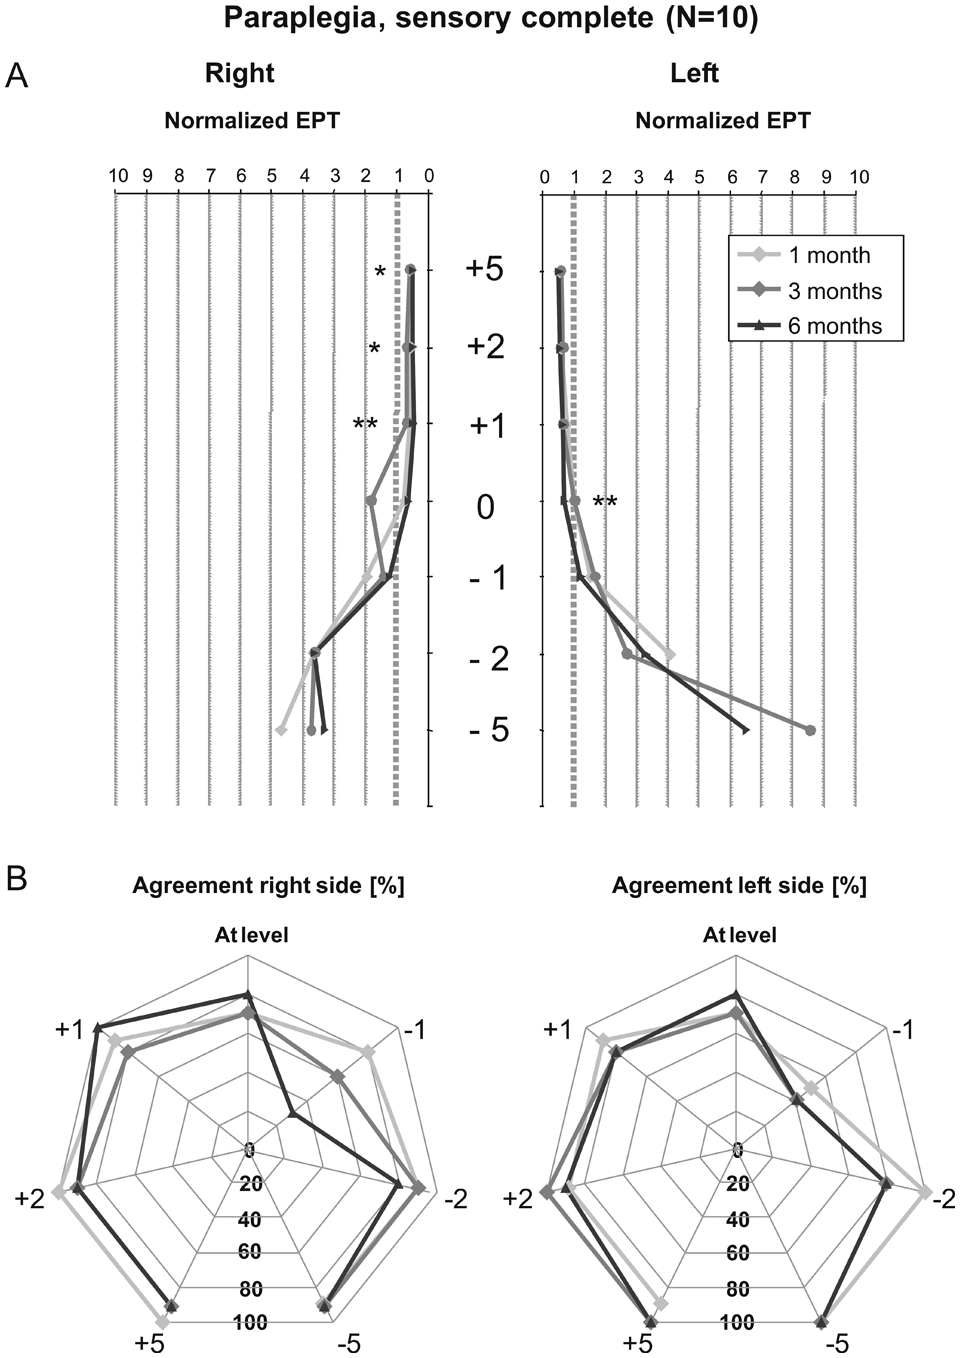
Course of normalized EPT and agreement with LT scores within the first 6 months in sensory-complete paraplegia: (A) Average normalized electrical perception threshold (EPT) values at 5, 2, and 1 levels above the neurological lesion; at level; and at 1, 2, and 5 levels below the neurological level of lesion. The averages are presented for 1, 3, and 6 months after initially sensory-complete paraplegia. EPTnorm values above 1 indicate pathological EPT values. (B) Each dermatome was classified as having pathological or normal perception based on LT or EPT scores. The percentage of agreement between these classifications is shown for the investigated segments. Abbreviations: N, number of participants; EPT, electrical perception threshold; LT, light touch; EPTnorm, the recorded EPT value in spinal cord injury patients divided by the EPT value corresponding to the upper limit of the 95% confidence interval of the recorded EPT value in healthy participants in the dermatome being tested; +5, 5 segments above the neurological level of lesion; 0, at level of lesion; −1, 1 segment below the level of lesion. *P ≤ .05, **P ≤ .01.
Overall, the percentage of agreement between classifications based on LT and EPT testing amounted to 85.6% (1 month; n = 132 dermatomes), 81.4% (3 months; n = 140), and 80.7% (6 months; n = 140). However, when evaluated for individual segments, the agreement varied widely, and especially at 1 level caudal to the lesion, agreement was poor and varied between 30% and 60% (Figure 2B).
Sensory-incomplete tetraplegia
In patients with a sensory-incomplete tetraplegia, longitudinal changes were more reduced when compared with the previous subgroup (Table 4). At 5 segments caudal to the lesion (left side), a smaller EPT value at 6 months compared with 3 months (P = .02) was observed. The lack of change was confirmed by the poor/moderate responsiveness observed because the SRM values remained below 0.80. The changes that could be considered a true change (SRD) in the segments rostral to the lesion showed few differences compared with the values observed for the paraplegic, sensory-complete patients. However, at and caudal to the lesion, the SRD values were considerably smaller compared with the paraplegic, sensory-complete patients (Table 3). It should be noted, however, that the number of included rostral segments was small.
EPT at 1, 3, and 6 Months in 20 Patients With Sensory-Incomplete Tetraplegia a
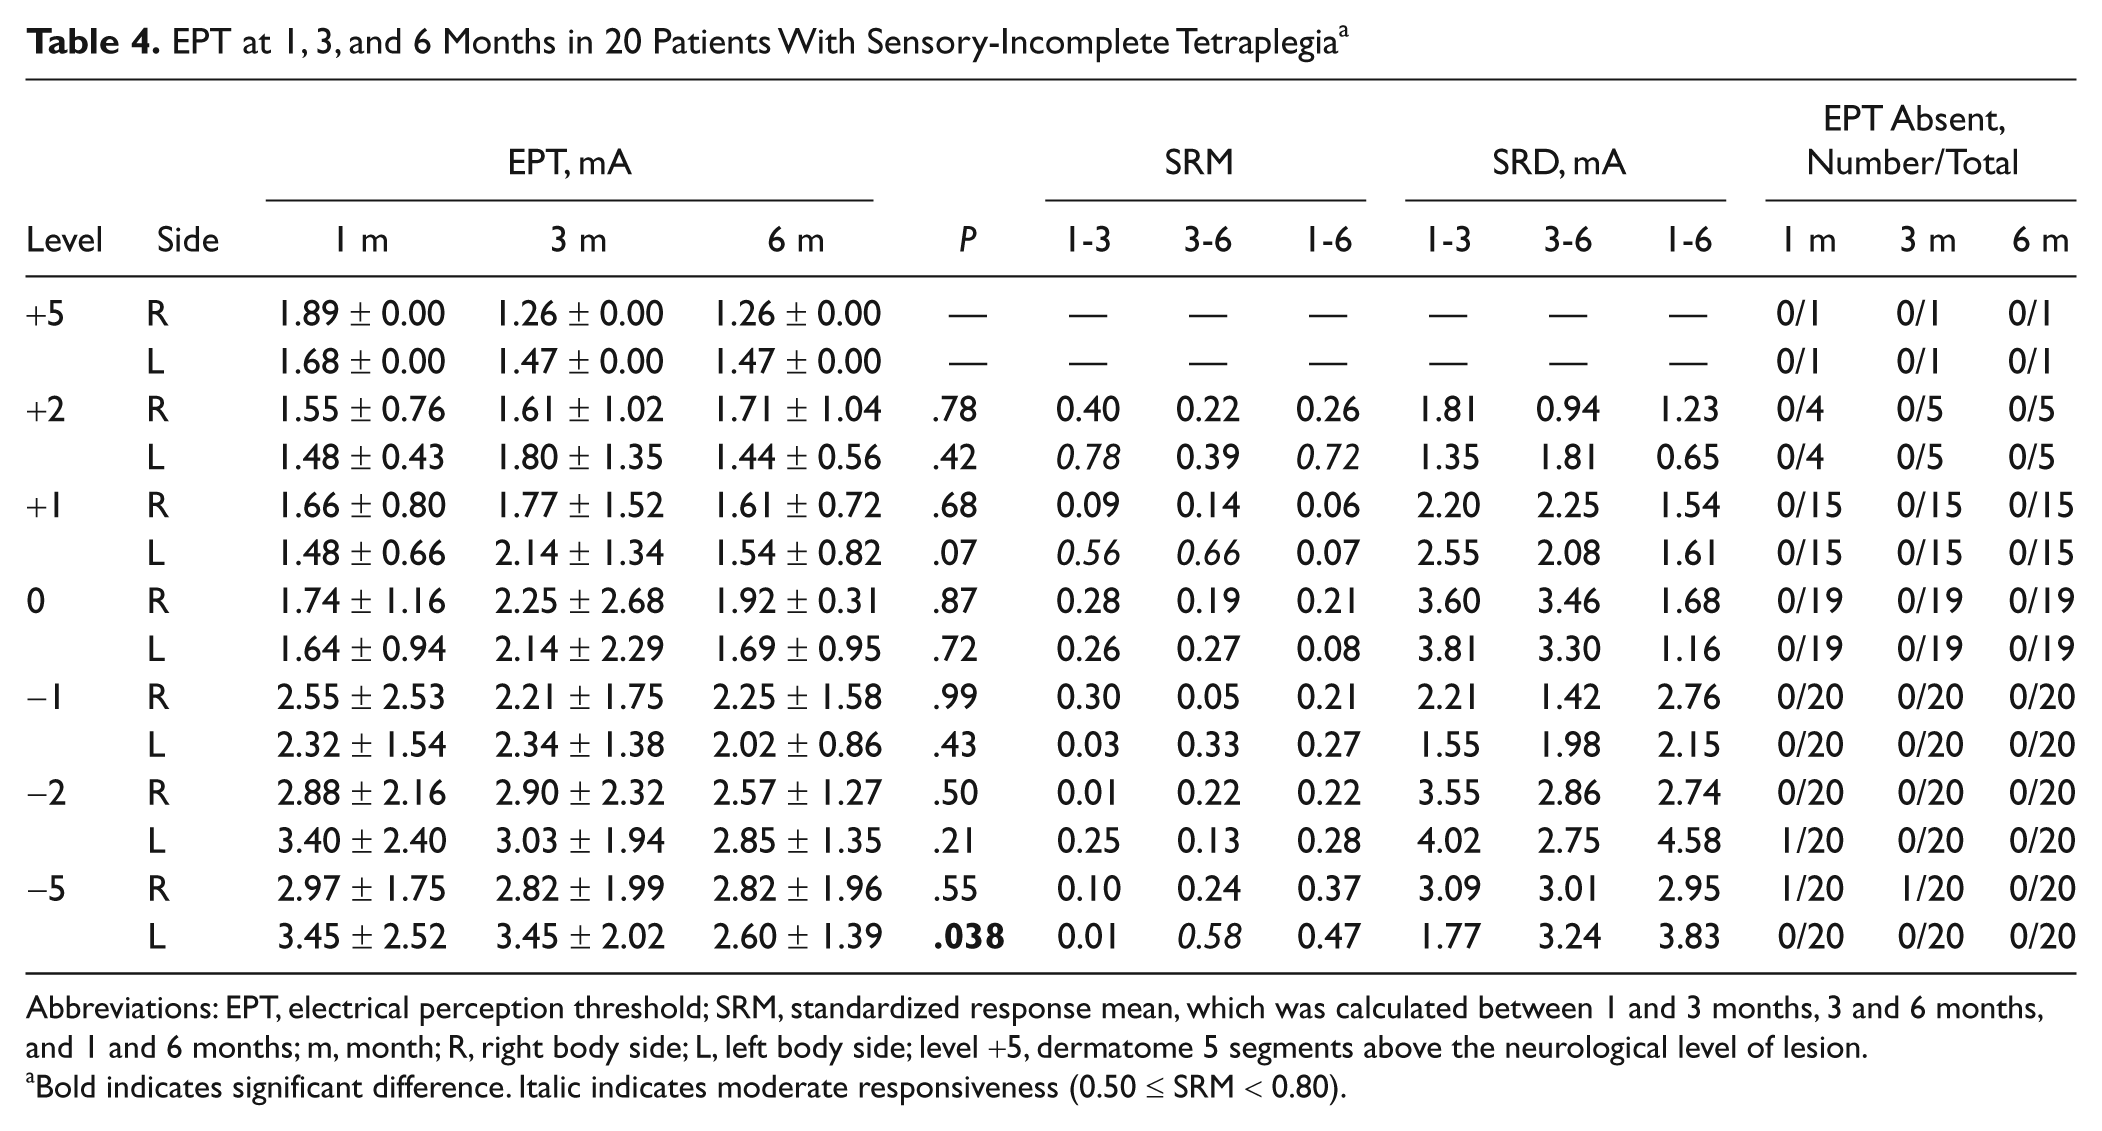
Abbreviations: EPT, electrical perception threshold; SRM, standardized response mean, which was calculated between 1 and 3 months, 3 and 6 months, and 1 and 6 months; m, month; R, right body side; L, left body side; level +5, dermatome 5 segments above the neurological level of lesion.
Bold indicates significant difference. Italic indicates moderate responsiveness (0.50 ≤ SRM < 0.80).
The average EPTnorm values were considerably smaller compared with those of the other subgroup and did not exceed 1.5 times the upper threshold, which is considered normal (Figure 3A). Similar to the nonnormalized data, no large changes in EPTnorm values were observed over time. The overall agreement between classifications based on LT and EPT testing amounted to 71.2% (1 month; n = 198 dermatomes), 71.5% (3 months; n = 200), and 77.0% (6 months; n = 200). However, in the tetraplegic incomplete patients, agreement could differ largely between segments and remained between 50% and 100% (Figure 3B).
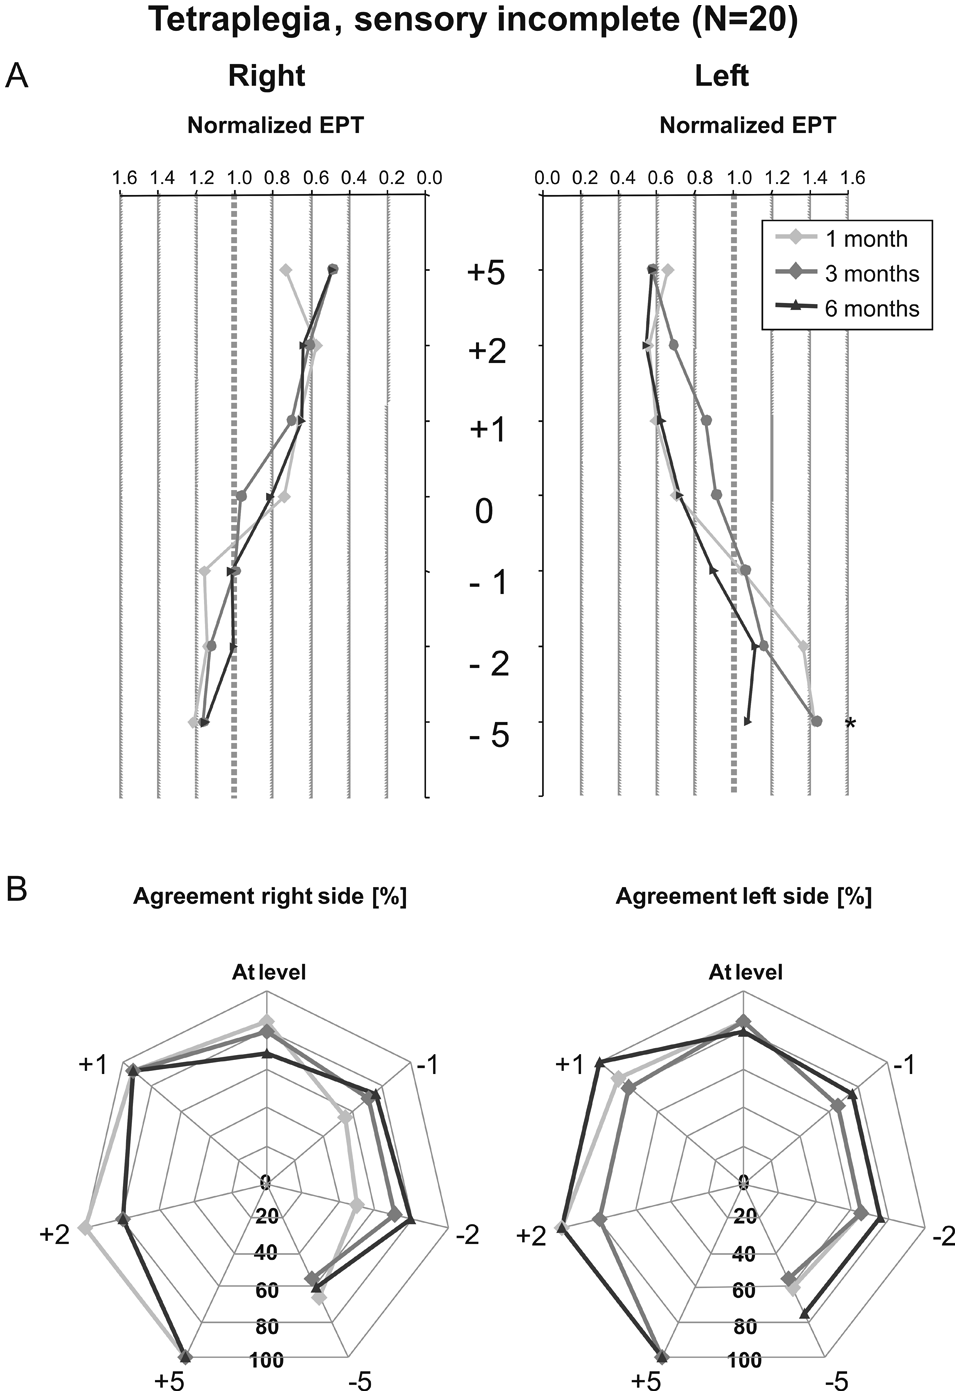
Course of normalized EPT and agreement with LT scores within the first 6 months in sensory-incomplete tetraplegia: (A) Average normalized electrical perception threshold (EPT) values at 5, 2, and 1 levels above the neurological lesion; at level; and at 1, 2, and 5 levels below the neurological level of lesion. The averages are presented for 1, 3, and 6 months after initially sensory-incomplete tetraplegia. EPTnorm values above 1 indicate pathological EPT values. (B) Each dermatome was classified as having pathological or normal perception based on LT or EPT scores. The percentage of agreement between these classifications is shown for the investigated segments. Abbreviations: N, number of participants; EPT, electrical perception threshold; LT, light touch; EPTnorm, the recorded EPT value in spinal cord injury patients divided by the EPT value corresponding to the upper limit of the 95% confidence interval of the recorded EPT value in healthy participants in the dermatome being tested; +5, 5 segments above the neurological level of lesion; 0, at level of lesion; −1, 1 segment below the level of lesion. *P ≤ .05.
Discussion
The EPT has been recommended by previous reviews as a valid outcome measure to document segmental changes in sensory perception in translational trials.6,21,22 However, as stated in the introduction, several aspects of evidence on the EPT’s reliability and responsiveness were yet to be investigated.
Our first main finding was that the reliability of the EPT varied considerably between segments in healthy participants. Kramer et al 14 reported an ICC of 0.5 when repeatedly assessing cervical dermatomes of 5 healthy participants at varying time intervals. However, EPTs from all dermatomes were included in 1 analysis, making it difficult to compare the studies. King et al 11 investigated the reliability in healthy participants and SCI patients but not for each dermatome. In the present study, a significant lower threshold was observed at the second test occasion only in the L2 dermatome. This difference might have been caused by chance because we tested 25 dermatomes and set α at .05 without correcting for multiple testing. We recommend focusing rather on the limits of agreement (absolute reliability) compared with ICC (relative reliability) because the limits may be more informative about the “noise” in EPT assessments, whereas low ICCs could also be caused by small interparticipant variability.
Our second main finding was that the responsiveness was in general poor in patients within the first 6 months after SCI. This study may actually indicate that within this time frame, little spontaneous recovery of sensory perception occurs caudal to the lesion. This finding holds true even when analyzing relatively homogeneous subgroups of SCI patients. This is in line with results from Kramer et al, 14 who reported changes in dSSEPs without corresponding changes in EPT. They suggested that a change in function of the sensory pathways does not necessarily correspond to a change in sensory perception. However, the poor responsiveness stands in contrast to another recent publication, which reported substantial improvement in EPTs at and caudal to the lesion (and not rostral). 13 These different observations might be a result of the shorter test-retest time window in our study, which might have influenced the results because spontaneous recovery of sensory perception (LT) appears limited within the first year after SCI. 23
Unexpectedly, responsiveness was largest in paraplegic sensory-complete patients above the neurological level, despite small absolute changes in EPT. We assume that this highlights the high sensitivity of the EPT compared with standard LT testing—a finding that was also confirmed by changed EPTs in segments that remained stable according to LT testing. The mechanism behind improved perception above the lesion remains speculative. We suggest that it may be underpinned by a reorganization of the primary somatosensory cortex. Indeed, Pons et al 24 reported a considerable expansion of the face representation in adult macaque monkeys after (unilateral) cervical dorsal rhizotomies. Similar cortical reorganizations have also been found in humans. 25 We assume that an increased somatosensory representation of unaffected body parts might have resulted in increased sensory perception.
Our third finding was that overall agreement between classifying a dermatome as pathological or normal based on LT or EPT testing was relatively high. However, agreement at lesion level and 1 segment caudal to the lesion was poor, although these 2 segments play an important role in determining the exact (sensory) level of lesion. Our norm values were derived from only 15 healthy individuals, and we did not correct for age and gender, as reported in a recent publication. 10 Nevertheless, our numbers appear comparable with those in other data sets.10,22 Moreover, compared with the EPT thresholds from more than 40 healthy participants, 22 our pathological thresholds could be considered conservative because only 3 of 25 segments (T11, T12, and L3) had reduced upper limits of the 95% CI. We suggest that the poor agreement found for some segments might have been caused by (1) improved sensitivity of the EPT compared with LT scoring or (2) poor LT scoring, because LT scoring is often not reliable. 26
Methodological Considerations
Despite previous reports that state that the EPT is reliable and easy to apply, we noted that a reliable EPT test requires a quiet environment and a high level of concentration from the participant. In our study, we found 1 patient with pathological EPTs at 5 segments above the lesion (which explains the 90% classification agreement in Figure 2B). This might reflect the EPT’s superior ability to assess sensory dysfunction compared with standard clinical sensory testing.9 However, it could also reflect the difficulty of the patient to report exact threshold levels. In such cases, we suggest the use of a measure that can assess sensory function without requiring the patient’s attention, such as (dermatomal) SSEPs. 27
The neurological level of lesion is defined as the lowest level where all motor function, light touch, and PP perception are intact. 5 In this study, the dermatomes tested were consistently defined in relation to the neurological level and not the last intact sensory level as indicated by the LT testing. This resulted in some SCI patients having an intact light touch perception below the neurological level because of the fact that either the motor function (n = 3) or the PP perception (n = 6) ceased to be intact at a higher level. This might have slightly influenced our responsiveness analyses but not our analyses of changes in EPT per changes in LT score (Figure 1).
What should be considered the maximal stimulation level of EPT? Three centers (6/37 patients) used the Compex device with a maximal stimulation output of about 27 mA, whereas other devices could stimulate to 40 mA. Although values above 27 mA are clearly pathological, it could make a difference if one would like to use the EPT to classify dermatomes as “impaired” or “absent,” comparable with the International Standards. 5 In 31 patients who were stimulated up to 40 mA, only 5 of 600 EPTs (0.83%) performed at and below the lesion level varied between 26.9 and 40 mA. Whereas the maximal stimulation was set at 10 mA in other studies,9,10,13,15,22 our study showed that 4.2% of the EPTs performed in dermatomes at and caudal to the lesion varied between 10 and 40 mA. Nevertheless, it remains questionable what pathways besides the dorsal column are tested by such strong intensities because our 15 healthy participants reported a painful sensation at 14.1 ± 2.4 mA (average for all dermatomes with the same stimulation parameters).
An important assumption that is made while performing segmental sensory testing is the accuracy of the dermatome map as provided by the International Standards. 5 It has been criticized that current dermatome maps appear inaccurate and are based on flawed studies. 28 A novel evidence-based dermatome map was presented, 28 and it is unclear how these findings might have influenced our current results.
In conclusion, the reliability of the EPT differed considerably between segments in healthy participants. Spontaneous recovery of sensory perception within the first 6 months after SCI appears to be limited because the responsiveness of the EPT values was generally poor. Agreement between dermatomes classified as normal or pathological based on LT or EPT criteria amounted to about 70%. However, in individual segments, agreement could be worse, especially at 1 segment caudal to the lesion. We suggest that translational trials that aim to lower the (sensory) level of the lesion by 1 or 2 segments might consider including sensory-incomplete tetraplegic participants. As these patients show limited spontaneous recovery within the first 6 months, and EPT testing could detect subtle changes in perception, a relatively small sample size might prove sufficient.
Footnotes
Acknowledgements
We acknowledge our collaborators Monica Stüssi (Balgrist University Hospital, Zurich, Switzerland), Henny Janssen and Henk van de Meent (UMC St. Radboud, Nijmegen, the Netherlands), Uli Wackenhut (SRH Klinikum Langensteinbach, Karlsbad-Langensteinbach, Germany), Michaela Maier (Klinik Hohe Warte, Bayreuth, Germany), Dr David Allan (Queen Elizabeth National Spinal Injuries Unit, Southern General Hospital, Glasgow, UK), and Prof Bernard Conway (Bioengineering Unit, University of Strathclyde, Glasgow, UK). We thank all patients and healthy volunteers for their participation.
The author(s) declared no potential conflicts of interest with respect to the research, authorship, and/or publication of this article.
The author(s) disclosed receipt of the following financial support for the research, authorship, and/or publication of this article: This study was sponsored by grants from the International Spinal Research Trust (Clinical Initiative Stage II, CLI06), London, and the International Institute for Research in Paraplegia Zurich (IFP).