
Abstract
Background. Repetitive transcranial magnetic stimulation (rTMS) modulates central neuropathic pain in some patients after stroke, but the mechanisms of action are uncertain. Objective. The authors used diffusion tensor imaging (DTI) and functional MRI (fMRI) to evaluate the integrity of the thalamocortical tract (TCT) and the activation pattern of the pain network in 22 patients with poststroke central pain. Methods. Each patient underwent daily 10-Hz rTMS sessions for 1000 pulses on 5 consecutive days over the hotspot for the first dorsal interosseus muscle. Pain severity was monitored using the Visual Analogue Scale (VAS). Mood was assessed by the Hamilton Depression Rating Scale. Results. Clinical data from all participants along with the DTI and fMRI findings from 10 patients were analyzed. VAS scores decreased significantly, if modestly, following administration of rTMS in 14 responders, which lasted for 2 weeks after the intervention. Regression analysis showed a significant correlation between less initial depression and higher antalgic effect of rTMS. Integrity of the superior TCT in the ipsilesional hemisphere showed significant correlation with change of VAS score after rTMS. fMRI showed significantly decreased activity in the secondary somatosensory cortex, insula, prefrontal cortex, and putamen in rTMS responders, whereas no change was noted in nonresponders. Conclusion. Mood may affect the modest antinociceptive effects of rTMS that we found, which may be mediated by the superior TCT through modulation of a distributed pain network.
Keywords
Introduction
The incidence of poststroke central pain is about 10% within the first year. 1 The pain is associated with injury to the spinothalamic tract, thalamus, or thalamocortical tract (TCT), linked to the resulting alteration of afferent input and dysregulation of cortical excitability. 2 However, poststroke central pain does not occur in all patients with these lesions, so additional factors must be involved. 3
When medication fails, brain stimulation for modulation of the nervous system can be considered. Surgical epidural stimulation over the motor cortex has been reported to be effective for pain relief in patients with central pain after stroke. 4 The electrical stimulus applied to the motor cortex may modify abnormal thalamocortical excitation of the sensory system. However, complications resulting from the invasive nature of the intervention, long-term implantation of electrodes, and concerns about cost-effectiveness have limited expansion of these approaches.
Migita et al 5 first reported on the antinociceptive effect of noninvasive TMS over the primary motor cortex (M1). A number of follow-up studies have supported the therapeutic potential of repetitive transcranial magnetic stimulation (rTMS) in patients with central neuropathic pain,6-8 but the mechanisms of action remain unclear and results vary.6,7,9-12 A recent study suggested the importance of thalamocortical connectivity to the effect of rTMS on pain modulation. 13
We assessed clinical factors, the role of TCT integrity as indexed by diffusion tensor imaging (DTI), and the modulatory effect of rTMS on sensory neural network activity by functional MRI (fMRI). We hypothesized that the antalgic effects of high-frequency rTMS applied over the M1 would depend on changes in activity across sensory-related pain neural networks that are dependent on the integrity of the TCT.
Methods
Participants
In all, 22 patients with poststroke central pain were enrolled. Symptoms of central pain reported by participants were allodynia, hyperalgesia, and paresthesia. Of the patients, 13 were male and 9 were female. The average age was 54.9 ± 9.0 years, and the duration of pain was 21.9 ± 17.2 months. Inclusion criteria were (1) poststroke central pain of the involved extremity without other causes of pain, (2) duration over 6 months, (3) uncontrolled pain despite use of 2 or more medications, (4) pain level >5 degrees by the Visual Analogue Scale (VAS), and (5) written informed consent. Exclusion criteria were (1) history of seizures, (2) uncontrolled hypertension or hypotension, (3) unstable heart disease or presence of cardiac pacemaker, (4) complete occlusion of the ipsilateral internal carotid artery, (5) contraindication for MRI, and (6) pregnancy. We recommended that participants maintain their current medications during the study period.
Clinical Evaluation
Subjective perception of pain was measured by the VAS before and after rTMS, and for 2 weeks following the rTMS course (Figure 1). Sensory function was checked by 2-point discrimination. We measured the minimum distance of separation that the patient reported feeling when the 2 points of the instrument touched the skin of the thumb pad of the affected hand. Cases in which participants could not detect 2 points more than 100 mm apart were regarded as not checkable. Mood was measured before and after rTMS using the Hamilton Depression Rating Scale (HDRS).
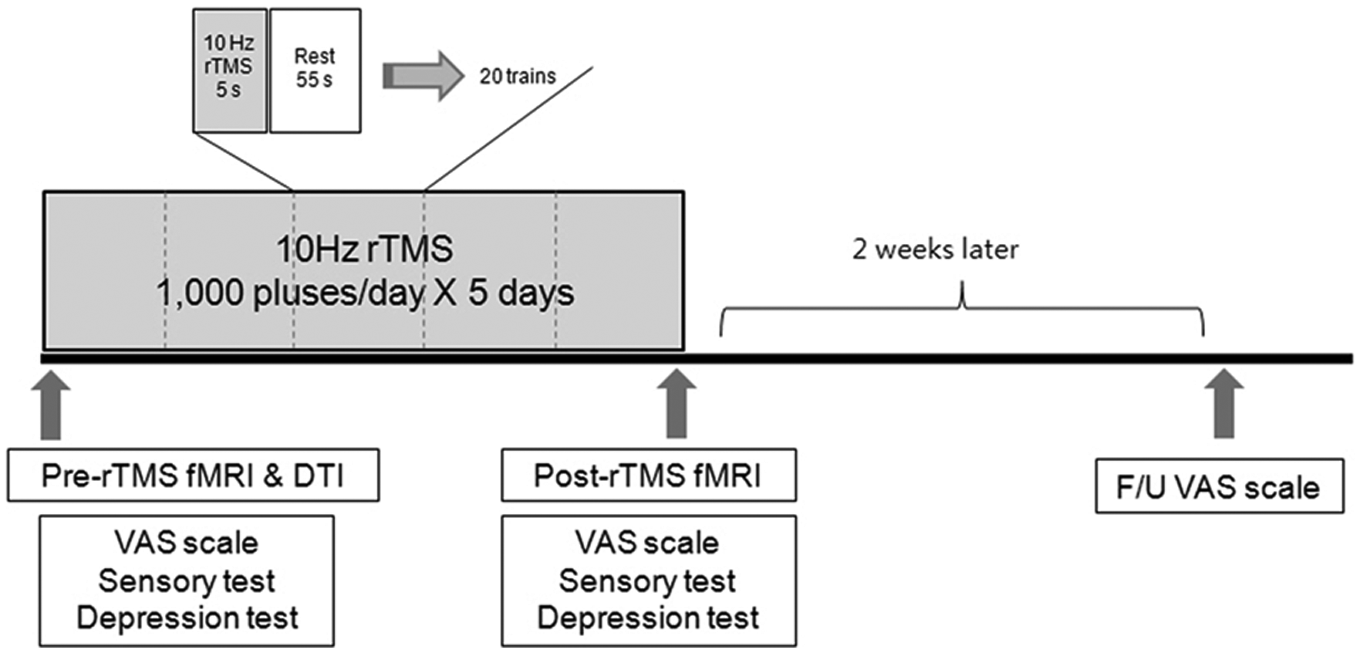
Experimental design: all patients received 5 daily sessions of 10 Hz rTMS (1000 pulses) over the M1 of the affected hemisphere. Severity of pain was assessed using the VAS scores before, immediately after, and 2 weeks after rTMS; sensory function and depression scores were also assessed before and immediately after rTMS in all patients; 10 patients underwent functional imaging studies before and after rTMS. Abbreviations: rTMS, repetitive transcranial magnetic stimulation; fMRI, functional MRI; DTI, diffusion tensor imaging; F/U, follow up; VAS, Visual Analogue Scale.
DTI Acquisition and Tractography
DTI data were obtained prior to rTMS using the 3T Achieva MRI scanner (Philips Healthcare, Andover, Massachusetts). A total of 28 slices were acquired using a single-shot echo-planar imaging sequence (TR/TE = 6616/60 ms, field of view 220 mm, matrix = 112 × 112). Diffusion gradient encoding in 45 directions with b = 1000 s/mm2 was performed.
The diffusion tensor was calculated and 3-dimensional tractography of the anterior and superior TCT was performed using MedINRIA software (INRIA Sophia Antipolis, France). For tractography of the TCT, 2-dimensional regions of interest (ROIs) were manually placed on a 3-dimensional anisotropy contrast image. The ROI was placed according to Mori’s method. 14 For the anterior TCT, 1 ROI defined the frontal lobe, and the other ROI defined the anterior part of the thalamus. For the superior TCT, 1 ROI defined the entire hemisphere within a transverse section above the corpus callosum, and the other ROI defined the superior part of the thalamus. The threshold of tracking termination was set at 2.0 for the fractional anisotropy (FA) value and 30° for the angle between 2 contiguous eigen vectors. FA, the apparent diffusion coefficient (ADC), and the delineation ratio of each TCT were calculated (delineation ratio = volume of the anterior [superior] TCT of the ipsilesional hemisphere/volume of the anterior [superior] TCT of the contralesional hemisphere).
Functional MRI Data Acquisition
fMRI data were obtained before and after rTMS using the 3T Achieva MRI scanner (Philips Healthcare, Andover, Massachusetts). Functional images were collected using a single-shot echo-planar imaging (EPI) sequence (TR/TE = 3000/35 ms, 30 slices, slice thickness = 4 mm, flip angle = 90°, field of view = 220 mm, and matrix size = 128 × 128). In all functional runs, the MR signal was allowed to achieve equilibrium over 5 scans that were excluded from analysis. Each EPI run included 4 alternating rest and task (painful sensory) blocks. For activation of the pain network, noxious tactile stimulation of sand paper scratching at approximately 1 Hz was applied to the dorsum of the participant’s involved hand by a skilled investigator who was guided by a visual signal presented on a screen. 15 Anatomic images were acquired using a 3D MPGR sequence. All anatomic and functional slices were obtained in transaxial planes parallel to the anterior commissure/posterior commissure line.
Defining the Motor Cortex and Resting Motor Threshold (RMT)
Participants were seated comfortably in a reclining armchair with both hands pronated on a pillow. Electromyography (EMG) data were collected from the contralateral first dorsal interosseus muscle via surface electrodes placed over the muscle in a belly-tendon montage. EMG activity was amplified using the Synergy EMG/EP system (Medelec, UK), and data were band-pass filtered at 10 to 2000 kHz. The optimal scalp location (“hot spot”) was determined using a TMS system (Magstim Rapid2 stimulator, Magstim Ltd, UK) and a 70-mm figure-of-eight coil. The handle of the coil was oriented at 45° posterior to the midline, so that electromagnetic current would flow perpendicular to the central sulcus; the stimulator was moved over the scalp in 1-cm increments. Once a hot spot was identified, single-pulse TMS was delivered to the location for determination of the RMT, defined as the lowest stimulus intensity necessary to produce motor-evoked potentials of a ≥50-µV peak-to-peak amplitude in 5 of 10 subsequent trials. 16
rTMS Intervention
Patients received 5 daily sessions of rTMS over the motor hotspot of the affected hemisphere corresponding to the first dorsal interosseus muscle of the painful hand using a Magstim Rapid2 stimulator with 2 booster modules and a flat figure-of-eight coil (Magstim Co Ltd, UK). The coil was placed anteromedially at a 45° angle from the midline. This orientation was chosen based on the finding that the motor threshold of M1 is the lowest when the Magstim stimulator is in this orientation. 17 rTMS included 50 trains of 5-s duration and an intertrain interval of 55 s. Stimulations were applied at 10 Hz and 90% RMT intensity through the coil, which was held tangentially over the scalp. A total of 1000 pulses were delivered (Figure 1). The rTMS protocol used in the present study is in accordance with safety guidelines for rTMS application.18,19
Analysis of Data
After rTMS for 5 days, participants were divided into 2 groups according to their VAS score changes. Participants whose VAS score decreased after rTMS were classified as responders, and participants whose VAS score did not change, or showed an increase, were classified as nonresponders.
For the analysis of changes in VAS before, immediately after, and 2 weeks after rTMS, we used repeated-measures analysis of variance (ANOVA). Changes of HDRS and 2-point discrimination after rTMS were analyzed using a paired t test. Between responders and nonresponders, clinical factors, including age, duration of illness, initial VAS and HDRS score, and the distance of 2-point discrimination, were analyzed using the nonparametric Mann-Whitney test. For investigation of the effect by lesion location, stroke lesions were divided into the thalamus, the brainstem, and other locations, and VAS changes by lesion location were analyzed using the Kruskal-Wallis test. For investigation of independent factors affecting the antalgic effect of rTMS, we performed multiple linear regression analysis for clinical characteristics that differ between responders and nonresponders. Power calculations for the multiple regression test were presented using a computer program named G*Power 3 software.DTI data analysis. Pearson correlation coefficient was used for assessment of correlations between tractography data and VAS score change (VAS before rTMS − VAS immediately after rTMS). The FA, ADC, and delineation ratio were used as quantitative data of tractography.
The SPM5 software package (Wellcome Department of Imaging Neuroscience, University of London, UK) was used for analysis of fMRI data. All functional images were realigned to the first image, coregistered with the T1-weighted structural image, spatially normalized to the Montreal Neurological Institute space, and spatially smoothed using an 8-mm Gaussian kernel. If any motion-related artifact was greater than 1-voxel translation (<3.44 mm) in any direction, the participant’s imaging data were discarded. Individually preprocessed images were entered into a fixed-effects model for assessment of group effects. We searched for activations during noxious tactile stimulation before and after rTMS as well as changes in activation after rTMS, compared with before rTMS, in responders and nonresponders, respectively. We determined any statistical significance at the height threshold of an uncorrected P value less than .001.
Results
Of the 22 participants, 10 completed DTI and fMRI before rTMS. After rTMS for 5 days, clinical assessments were repeated in all 22 participants, leading to classification of 14 participants into the responder group and 8 participants into the nonresponder group. Of the 10 participants who completed DTI and pre-rTMS fMRI, 6 were responders and 4 were nonresponders. One responder refused follow-up fMRI. Consequently, clinical data from all 22 participants, DTIs of 10 participants (6 responders and 4 nonresponders), and pre-fMRIs and post-fMRIs of 9 participants (5 responders and 4 nonresponders) were analyzed.
Clinical Results
Before rTMS, the VAS score was significantly higher in the responder group, compared with the nonresponder group. In all patients, the VAS score was significantly decreased after rTMS, from 6.6 to 5.7 (P < .05), and then remained at 5.7 at 2 weeks after rTMS. Repeated-measure ANOVA revealed that these measures did not reach statistical significance for the main effect of rTMS. However, in a second-level analysis, the responder group (n = 14) showed a significant main effect of rTMS within subjects (F = 20.05; P < .01). Their mean VAS scores were 7.4 at initial assessment and decreased to 5.8 immediately after rTMS and then slightly decreased to 5.5 at 2 weeks after rTMS. All participants in the responder group reported an antalgic effect immediately following rTMS, which was not related to continuing medications. On the other hand, in the nonresponder group (n = 8), mean VAS scores were 5.1 at initial assessment and increased slightly after rTMS to 5.5, and then further to 6.0 at 2 weeks after rTMS. Overall, these changes showed no significant difference between measures (Table 1).
Patient Characteristics and Response to rTMS a
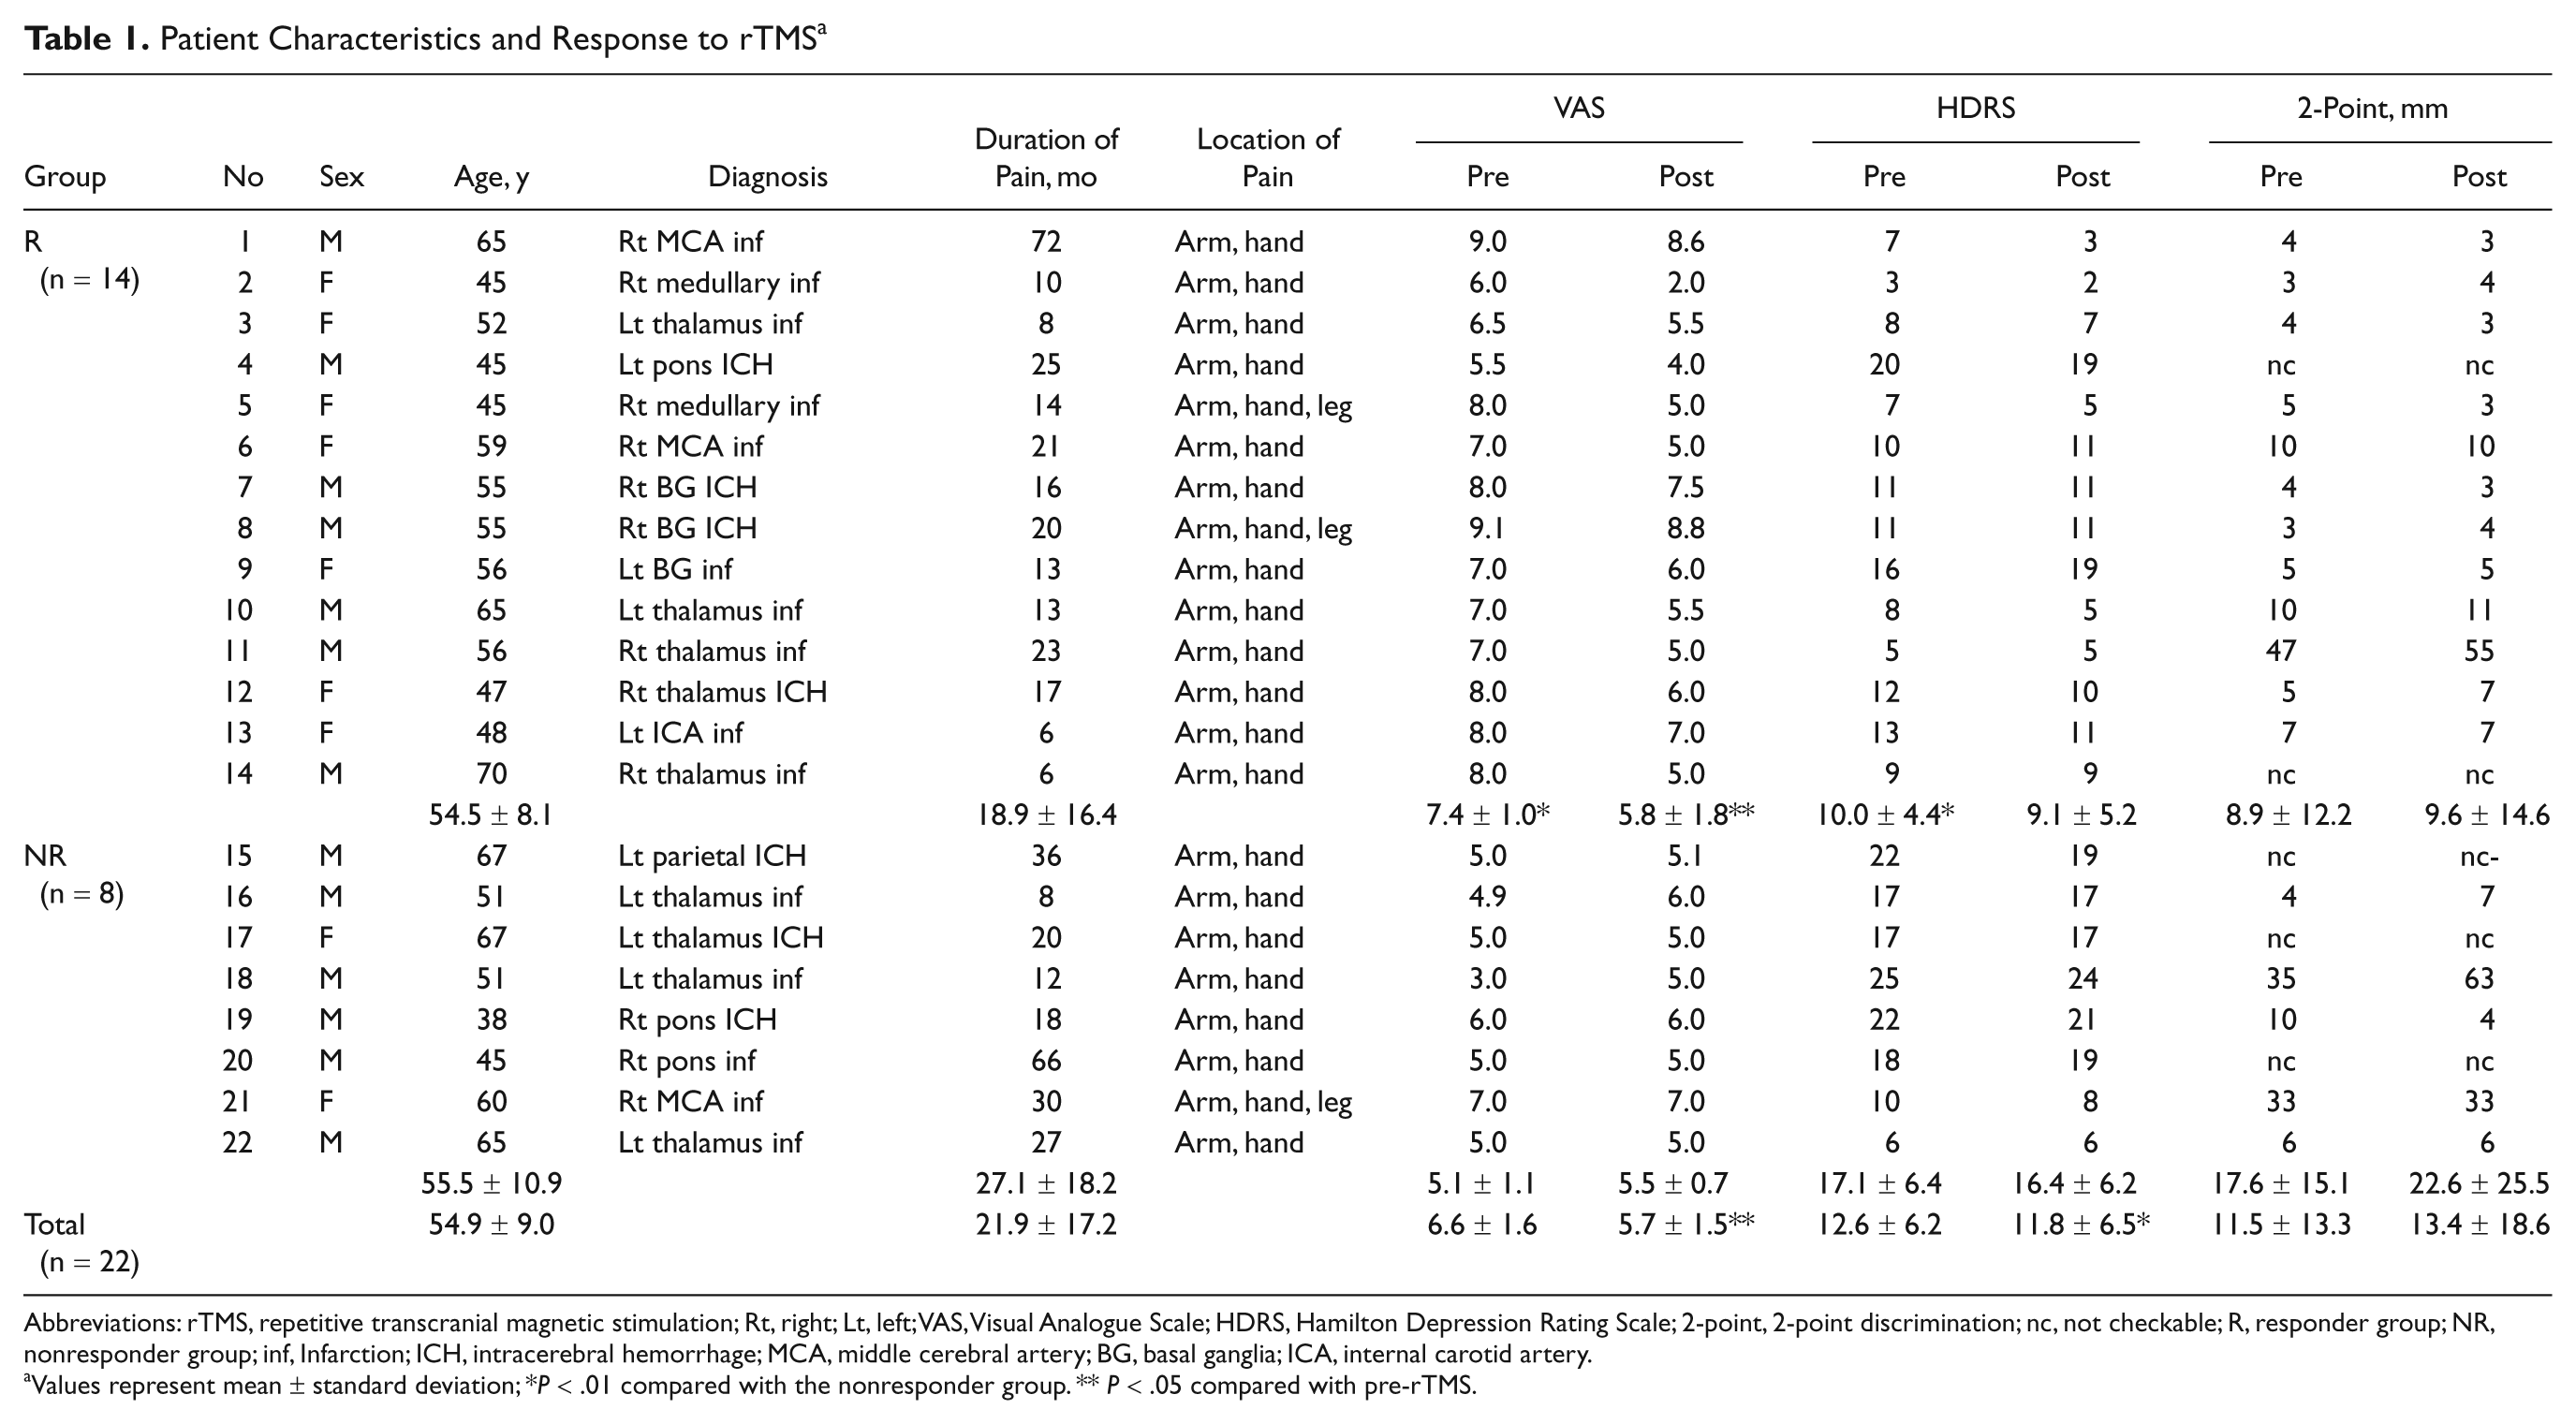
Abbreviations: rTMS, repetitive transcranial magnetic stimulation; Rt, right; Lt, left; VAS, Visual Analogue Scale; HDRS, Hamilton Depression Rating Scale; 2-point, 2-point discrimination; nc, not checkable; R, responder group; NR, nonresponder group; inf, Infarction; ICH, intracerebral hemorrhage; MCA, middle cerebral artery; BG, basal ganglia; ICA, internal carotid artery.
Values represent mean ± standard deviation; *P < .01 compared with the nonresponder group. ** P < .05 compared with pre-rTMS.
In all patients, the HDRS score decreased significantly from 12.6 to 11.8 after rTMS (P < .05). The responder group showed a significantly lower HDRS than the nonresponder group (P < .01; Table 1).
The distance of 2-point discrimination changed from 11.5 to 13.4 mm in all patients. Two patients among 14 responders (14.3%) and 3 patients among 8 nonresponders (37.5%) could not perform the 2-point discrimination as a result of severe sensory dysfunction. However, there was no statistical difference in 2-point discrimination between the responder and nonresponder groups (Table 1).
Stroke Lesion
In the responder group, stroke lesions were located in the thalamus in 5 cases, brain stem in 3 cases, and other areas in 6 cases. In the nonresponder group, stroke lesions were located in the thalamus in 4 cases, brain stem in 2 cases, and other areas in 2 cases. Distribution of stroke lesions did not differ between the 2 groups and was not associated with VAS change after rTMS.
Before rTMS, the VAS and HDRS scores were different between the 2 groups, and age, duration of illness, distance of 2-point discrimination, and stroke lesion location were not different. To investigate independent factors affecting the antalgic effect of rTMS, we performed multiple linear regression analysis with initial VAS score and initial HDRS score, which revealed initial HDRS to be a significant factor affecting VAS change after rTMS (P = .018; Table 2). The power of the multiple regression test was 53.2%. Residuals were not autocorrelated with each other, as proved by the Durbin-Watson test (d = 1.832).
Clinical Factors Affecting the Antalgic Effect of rTMS, by Multiple Linear Regression Analysis
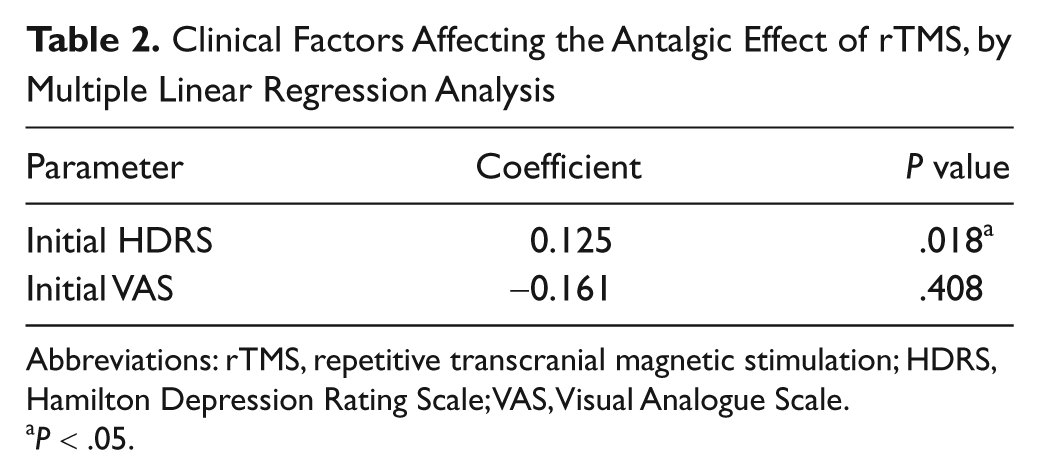
Abbreviations: rTMS, repetitive transcranial magnetic stimulation; HDRS, Hamilton Depression Rating Scale; VAS, Visual Analogue Scale.
P < .05.
Anterior and superior TCTs were obtained from the ipsilesional and contralesional hemispheres of all 10 participants who completed the DTI study (Figure 2). The numbers in Figure 2A indicate participants’ individual numbers in Table 1. Participants 1, 2, 4, 7, 9, and 10 were responders, and their anterior and superior TCTs of the infarcted hemisphere were well delineated. Participants 15, 17, 21, and 22 were nonresponders, and their anterior and superior TCTs of the damaged hemisphere showed extreme deterioration compared with their intact hemisphere.
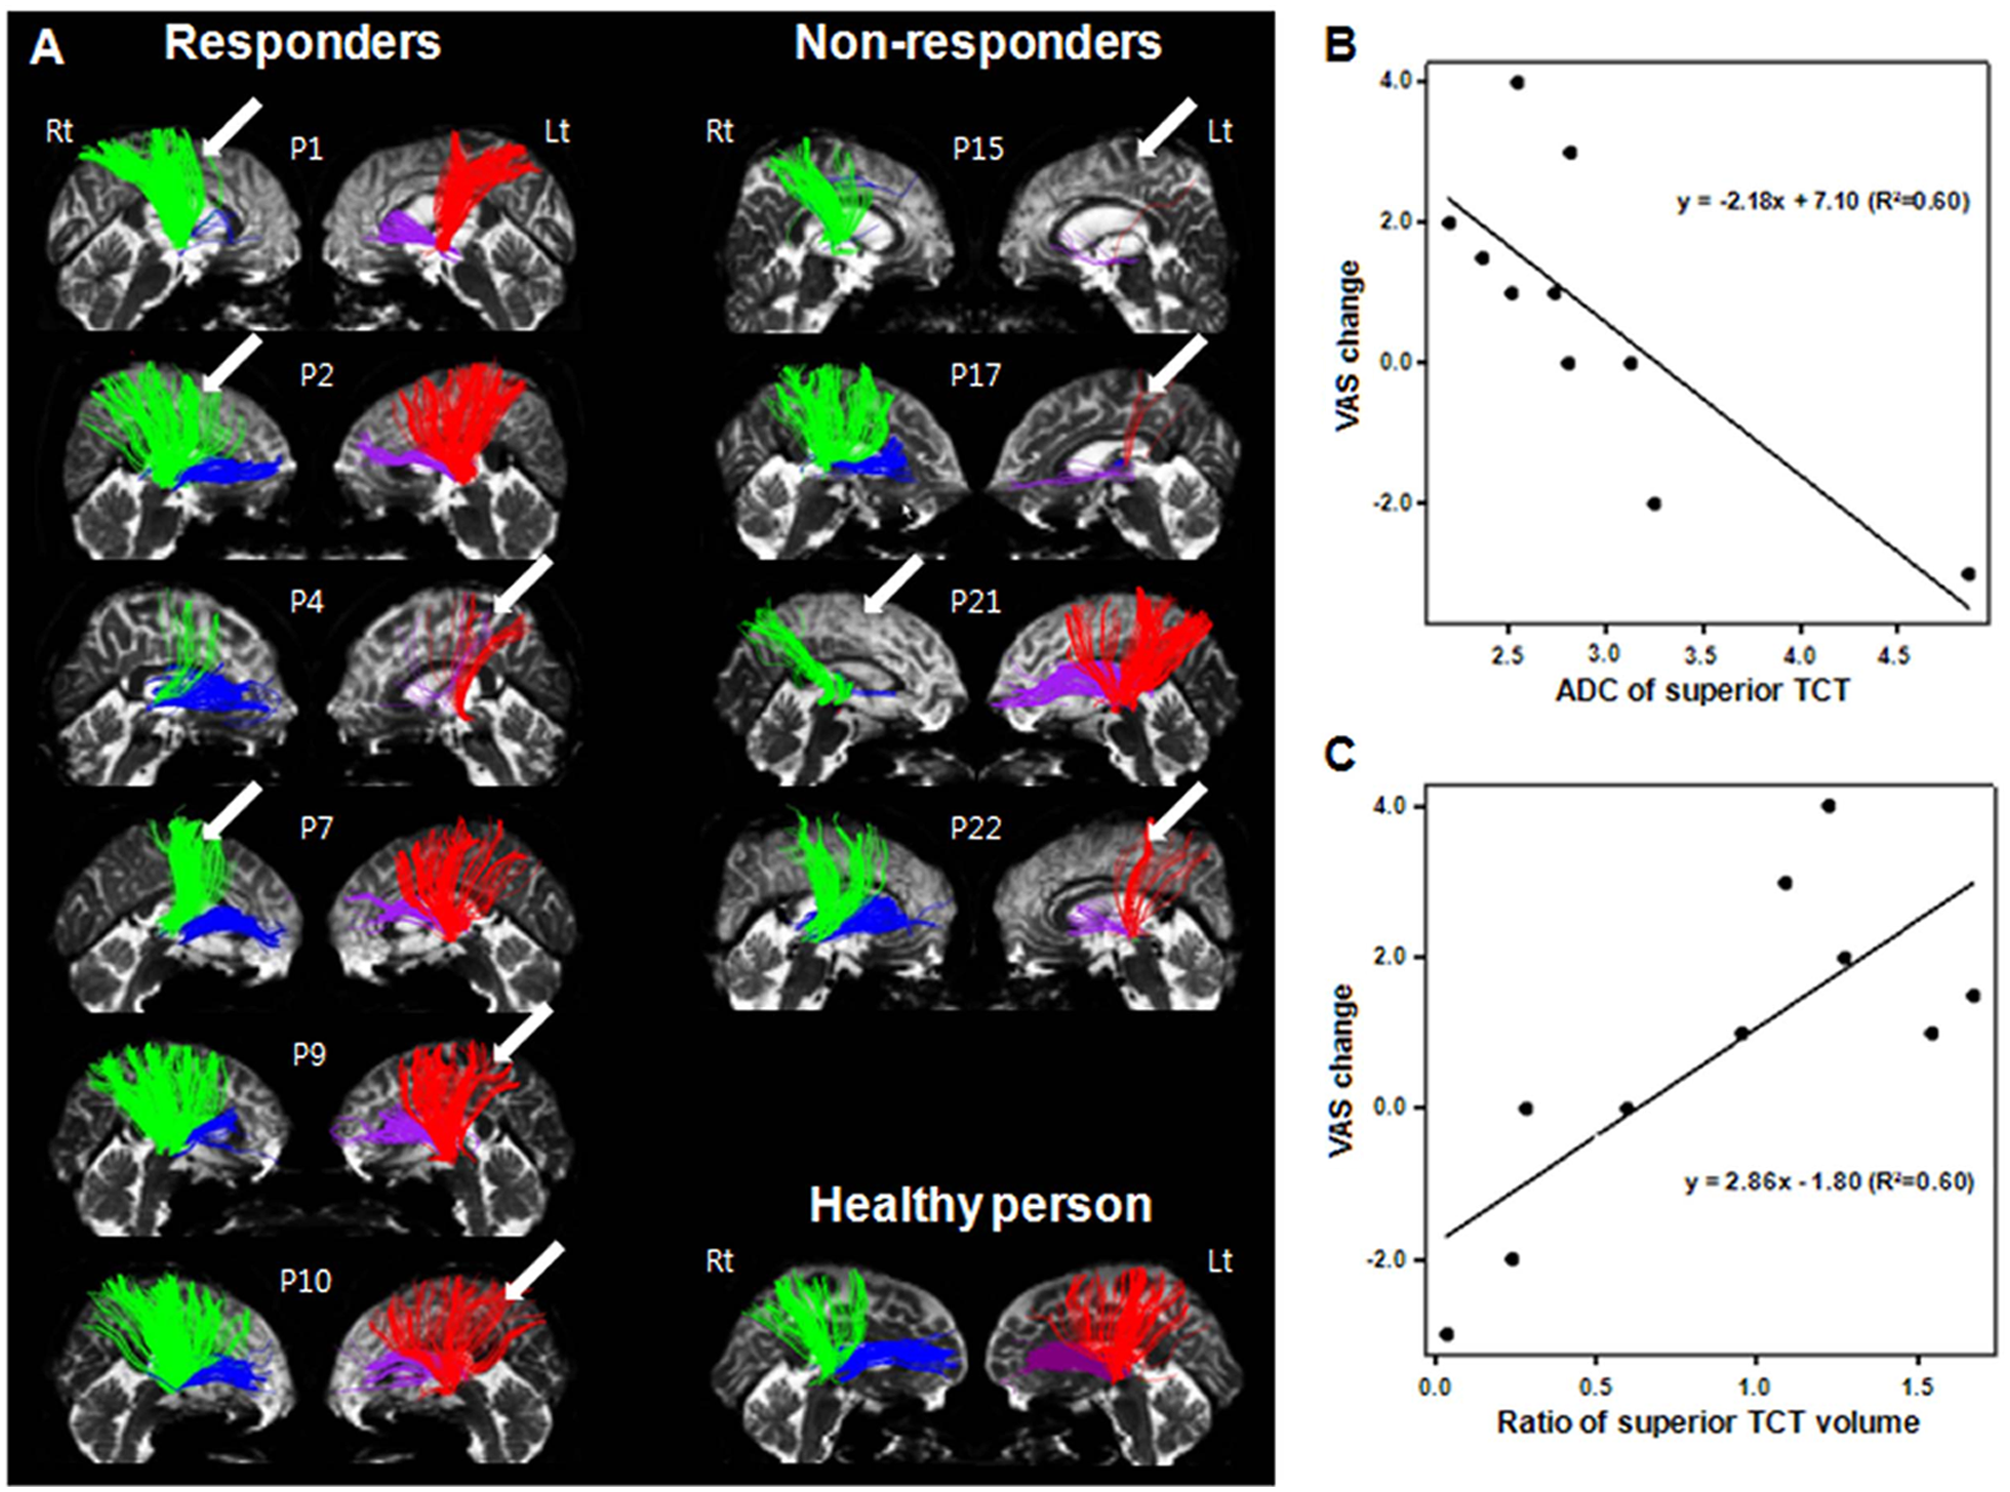
(A) Individual TCTs: the superior TCT (green in the right hemisphere and red in the left hemisphere) and anterior TCT (blue in the right hemisphere and purple in the left hemisphere) of the responder group are displayed on the left-hand side and those of the nonresponder group are displayed on the right-hand side. The superior TCTs of the responder group are well preserved, whereas those of the nonresponder group show extreme deterioration in the stroke hemisphere. Normal TCTs of 1 healthy person (58-year-old, female) who did not have a past history of previous stroke or other neurological disease are shown on the bottom of the right-hand side. Arrows indicate the lesion sides. (B, C) Correlation between integrity of the superior TCT and pain reponse to rTMS. B. VAS change correlated with ADC of the superior TCT (R2 = 0.60, P < .01). (C) VAS change correlated with the delineation ratio of the volume of the bilateral superior TCT (defined as the ratio of the volume of the superior TCT in the affected hemisphere to that of the unaffected hemisphere; R2 = 0.60, P < .01). Abbreviations: TCT, thalamocortical tract; rTMS, repetitive transcranial magnetic stimulation; VAS, Visual Analogue Scale; ADC, apparent diffusion coefficient.
VAS change showed negative correlation (Figures 2B and 2C) with ADC of the superior TCT of the ipsilesional hemisphere (R2 = 0.6, P < .01) and positive correlation with the delineation ratio of the superior TCT (R2 = 0.6, P < .01). The FA, ADC, and delineation ratio of volume of the anterior TCT did not show correlation with VAS change.
fMRI using noxious pain stimulation showed activation of sensory and pain neural networks, including the primary (SI) and secondary somatosensory cortex (SII) at the precentral gyrus, insula, prefrontal cortex, putamen, and cerebellum in both the responder and nonresponder groups (Figures 3A-1 and 3B-1). Comparison of fMRI data from pre-rTMS and post-rTMS showed remarkably decreased activity in the SII, insula, prefrontal cortex, putamen, and cerebellum in the responder group after rTMS (Figures 3A-2 and 3A-3), whereas no noticeable differences were found in the nonresponder group (Figures 3B-2 and 3B-3)—uncorrected P < .001.
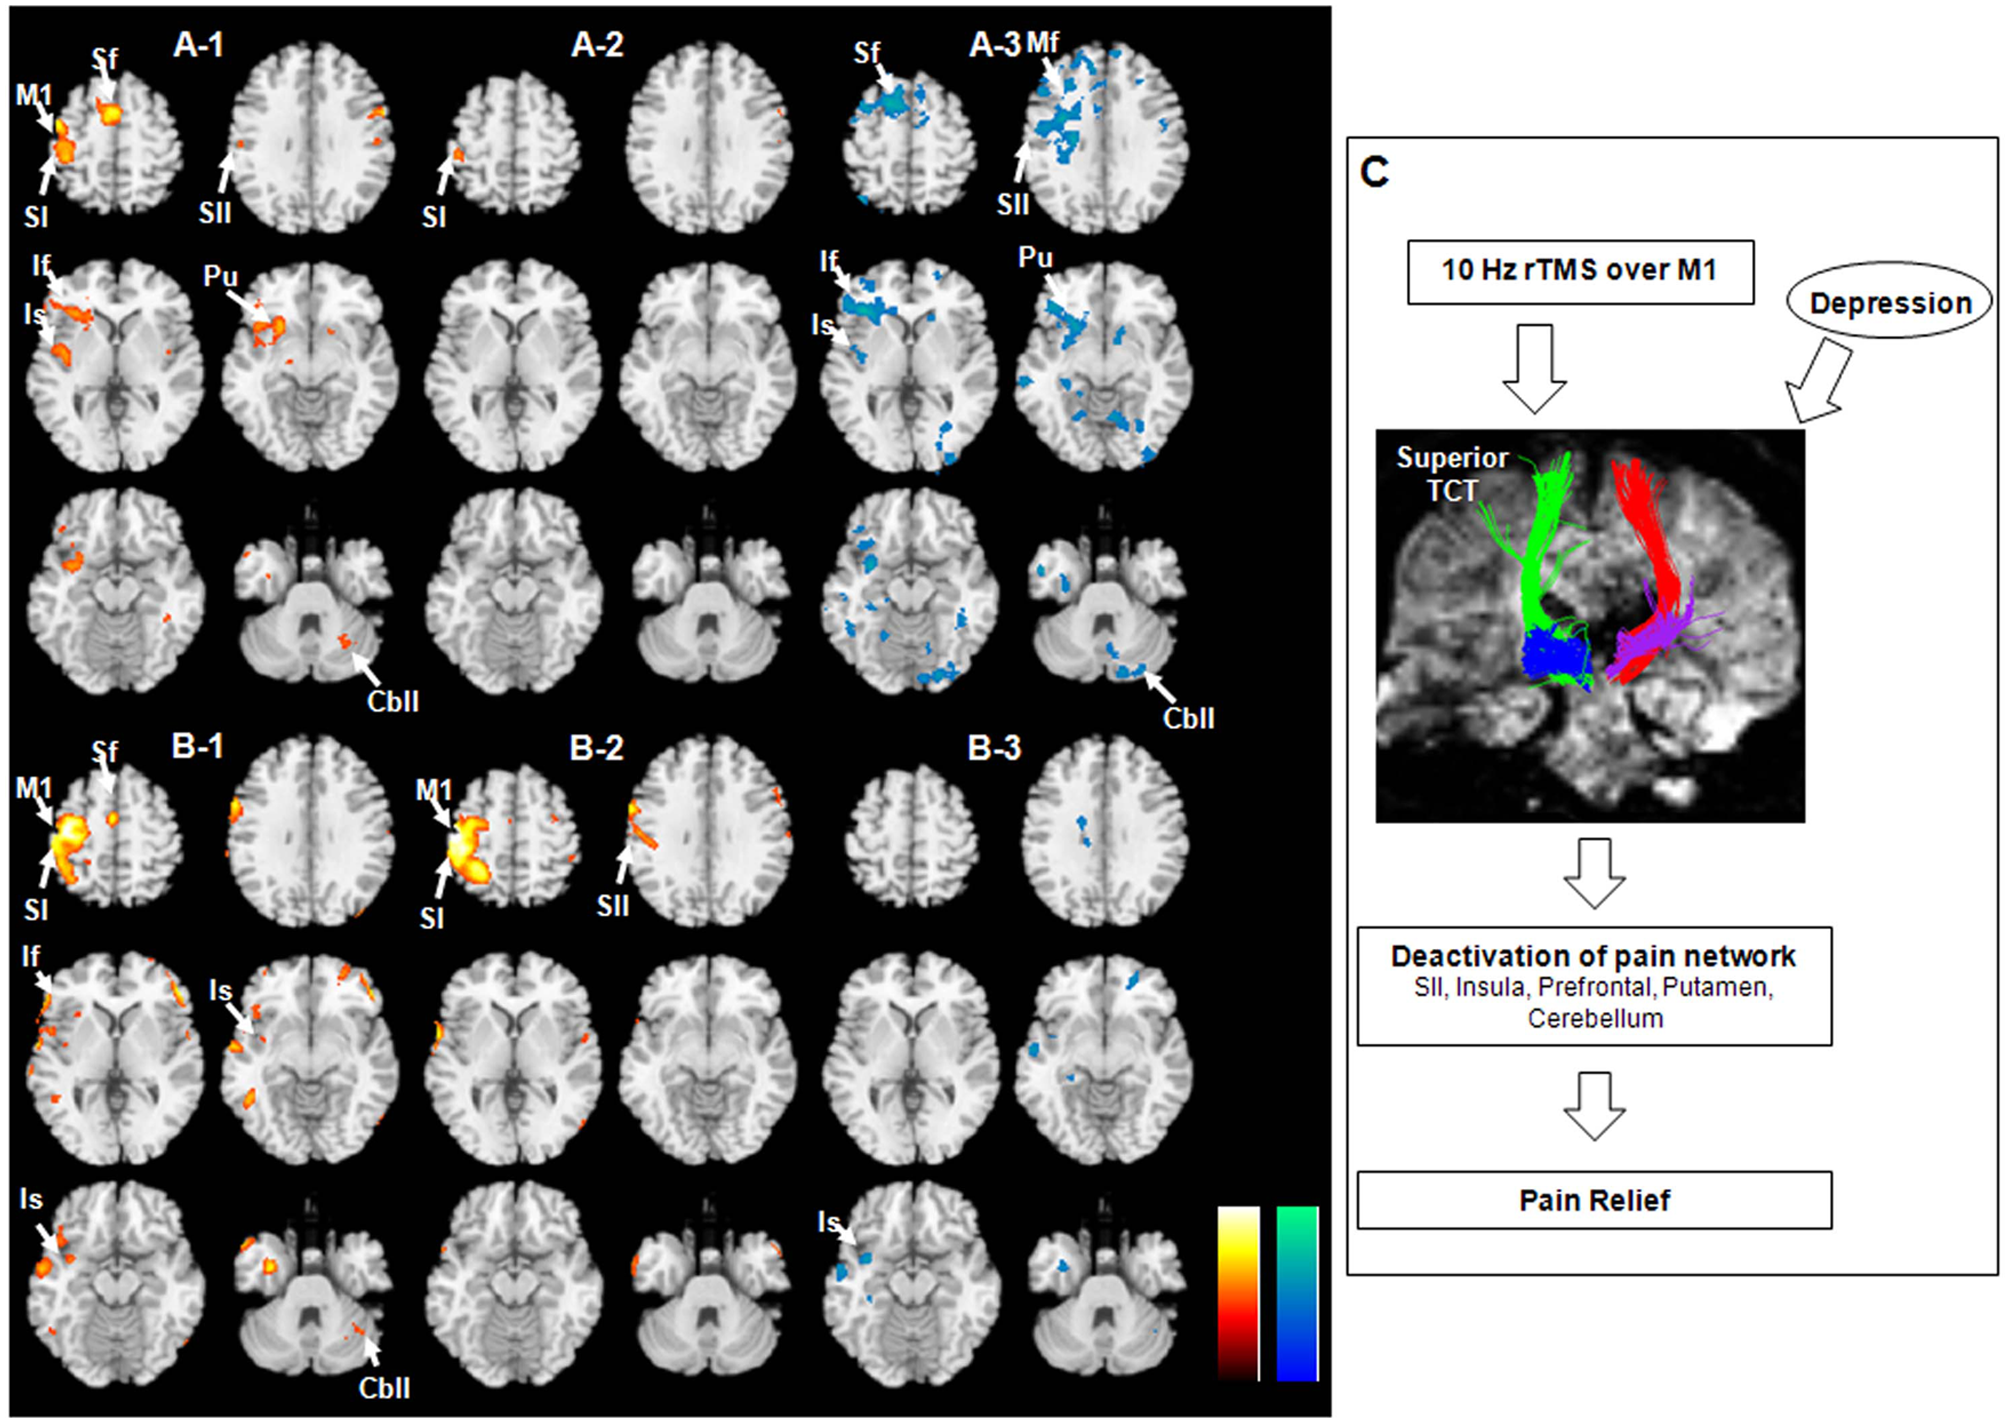
Brain areas activated by noxious tactile stimulation in the responder group (A) and the nonresponder group (B). fMRI results showed activation before rTMS on the left side (A-1, B-1), and activation after rTMS in the middle (A-2, B-2) are shown in yellow/red color. fMRI on the right side (A-3, B-3) showed decreased activation after rTMS (cyan/blue color, before/after rTMS). (C) The clinical-anatomic-functional relationship revealed in this study. Abbreviations: M1, primary motor cortex; SI, primary sensory cortex; SII, secondary sensory cortex; Sf, superior frontal gyrus; Mf, middle frontal gyrus; If, inferior frontal gyrus; Is, insula; Pu, putamen; Cbll, cerebellum; fMRI, functional MRI; rTMS, repetitive transcranial magnetic stimulation.
Discussion
By analyzing clinical and neuroimaging data, including DTI and fMRI results, we provided novel information on clinical and anatomic factors that contribute to an antalgic effect of rTMS on poststroke central pain and identified functional neural correlates associated with rTMS responses. The results of this study demonstrated that high-frequency rTMS applied over the M1 for 5 consecutive days can produce a partial antalgic effect on poststroke central pain. This effect can persist for 2 weeks after the completion of the rTMS intervention. The antalgic effect was more prominent in patients with less depression and preserved superior TCT in the targeted ipsilesional hemisphere.
Reports describing the influence of sensory function on the antalgic effects of rTMS have been inconsistent. Drouot et al 20 hypothesized that a preserved sensory neural network is critical for effective modulation of the pain neural network, using surgically implanted devices for epidural cortical stimulation. In contrast, Lefaucheur et al 6 found that the degree of sensory loss in the painful area did not influence the antalgic effects of rTMS. However, they also found that pain relief correlated with post-rTMS improvement of warm sensory thresholds in the painful zone of patients with chronic neuropathic pain. 21 We did not test for primary sensory appreciation, however.
Studies examining the site of stimulation found that facilitation of the M1 induces an antinociceptive effect on various types of neurogenic pain.9,11 Hirayama et al 10 reported an antalgic effect only with M1 stimulation—stimulation over the primary sensory cortex, premotor cortex, and supplementary motor area did not have any effect. rTMS over M1 may spread to other areas of the brain via corticosubcortical and corticocortical connections. 22 Although the mechanism of pain relief by rTMS is still unclear, such transsynaptic effects of rTMS along the motor cortex, corticospinal tract, and corticothalamic tracts are believed to play an important role.13,23 The neural network related to poststroke central pain appears to be similar to that of the pain network across several functional imaging studies24,25 and involves the cingulate cortex, insula, dorsolateral prefrontal cortex, SII, inferior parietal lobe, cerebellum, and lateral thalamus. 26 Kramer et al 27 also reported that the allodynia-associated network included the insula, anterior cingulate gyrus, orbitofrontal cortex, and putamen. In this study, all patients had both allodynia and hyperalgesia, and their baseline fMRI demonstrated a similar activation of the pain network in both the responder and nonresponder groups. However, in the responder group, fMRI activity in the SI and SII, insula, prefrontal cortex, putamen, and cerebellum before rTMS decreased after rTMS. In contrast, neural activity did not change in the nonresponder group. Therefore, we suggest that the antalgic effects of rTMS are mediated by modulation of neural activity in a distributed pain network that includes not only the targeted sensorimotor cortex, but the SII, insula, anterior cingulate gyrus, prefrontal cortex, and cerebellum.
Such distributed modulation of activity across a neural network by stimulation of a given cortical area may require preserved anatomic connectivity as revealed by our previous study in healthy participants. 28 Indeed, careful anatomic analysis in the cat shows that the transsynaptic impact of TMS is correlated with the strength of anatomic connections between the directly targeted brain region and distant, affected areas. 29 Two previous studies have pointed to the superior TCT as having a crucial role in poststroke central pain.13,30 Goto et al 13 analyzed the corticospinal tract and TCT in patients with poststroke central pain and reported that the effects of rTMS on the pain modulation effect were greater in patients with higher delineation of the corticospinal tract and TCT. Our study confirms and extends those results, in that the antalgic effect of rTMS is greater when the superior TCT is more preserved, presumably enabling greater thalamic impact mediated by modulation of the stimulated sensorimotor cortex.
Looking at the DTI data, there are 2 issues. The first is that a larger stroke lesion would result in additional dysfunction in the pain-related neural network; therefore, pain would be more refractory to rTMS. Stroke lesion volume analysis in the future would clarify this point. The second is a matter of stroke lesion location. Lefaucheur et al 6 found that the rTMS effect was least in patients with brainstem stroke and explained this finding as an injury of descending modulation within the brainstem, triggered by the motor corticothalamic output. In this study, we classified stroke lesions according to whether they affected the thalamus, brain stem, and other areas and found that stroke lesion location did not influence the rTMS effect. This may be a result of the small number of participants or lack of evaluation of the cortico-thalamo-spinal pathway.
This study had some limitations. We did not include a sham control group. Also, this study was not aimed at efficacy. We aimed to find novel information about changes in the pain network that may affect responsiveness to rTMS. The effect of rTMS on pain, however, was modest compared with previous studies.6,8 In clinical settings, patients are usually described as “improved” when their VAS score falls 1 point or more relative to their preintervention status. There was a statistically significant difference in the rTMS antalgic effects between the responder and nonresponder groups, so it is reasonable to evaluate the neural correlates of the antalgic effects by comparing these 2 groups. Unfortunately, only 10 patients agreed to DTI and pre-rTMS fMRI studies, so our results may not be generalized to patients with chronic poststroke central pain.
The clinical-anatomic-functional relationship found in this study suggests that depression may affect the pain modulation effect of rTMS; antalgic effects of rTMS occur in patients with preserved superior TCT, and pain relief by rTMS is associated with decreased activation of the pain network. By better defining the patients who are most likely to respond to forms of rTMS, more robust improvements in pain control may become feasible. 31
Footnotes
The author(s) declared no potential conflicts of interest with respect to the research, authorship, and/or publication of this article.
The author(s) disclosed receipt of the following financial support for the research, authorship, and/or publication of this article: This study was supported by a KOSEF grant funded by the Korean government (MOST) (No. M10644000022-06N4400-02210), a grant from the Korean Research Foundation (No. 2004-041-E002), and a grant from the Samsung Biomedical Research Institute (No. SBRI C-A7-407-1). APL was supported in part by Grant UL1 RR025758, Harvard Clinical and Translational Science Center, from the National Center for Research Resources and National Institutes of Health Grant K 24 RR018875.