
Abstract
Background. Functional connectivity is defined as the temporal correlation between spatially remote neurophysiological events. This method has become particularly useful for studying neuroplasticity to detect changes in the collaboration of brain areas during cortical reorganization. Methods. In this article, the authors longitudinally studied voxel-based morphometry and resting state functional magnetic resonance imaging 10 times in 1 patient during the course of Bell palsy (idiopathic facial nerve palsy) up to complete clinical recovery. Results. Morphometric analysis revealed a significant alteration in the face area of the primary motor cortex (M1) contralateral to the paretic face, with an initial increase in gray matter concentration. Functional connectivity analysis between the M1 and other parts of the facial motor network revealed acutely disrupted intrahemispheric connectivity but unaltered interhemispheric connectivity. The disrupted functional connectivity was most pronounced on the day of the onset of symptoms, with a subsequent return toward normal during the course of recovery. This time course was found to differ between the selected parts of the facial motor network. However, the increase in functional connectivity strength preceded clinical recovery in all areas and reached a stable level before the patient fully recovered. Conclusion. These results demonstrate that recovery from facial nerve palsy is complemented by cortical reorganization, with pronounced changes of functional connectivity that precede clinical recovery.
Introduction
We investigated the time course of functional and structural plasticity in 1 patient with Bell palsy (idiopathic unilateral facial nerve palsy). Studies concerning motor strokes have consistently reported an initially disrupted functional connectivity between affected motor areas.1,2 One recent study demonstrated changes in cortical activation during a motor task after the onset of Bell palsy. 3 Animal studies have demonstrated primary motor cortex (M1) map reorganization after the transection of the facial nerve.4,5 No prior study investigated structural or connectivity changes due to Bell palsy in the human brain. Using resting-state functional magnetic resonance imaging (fMRI) and voxel-based morphometry (VBM), we hypothesized that impaired motor function without sensory loss or a lesion in the brain might initially disrupt functional connectivity within the cortical facial motor network, with subsequent reorganization to support recovery of facial muscle control. We also examined whether structural changes within the M1 occurred in relation to the loss of facial nerve activity and would be reversed by rehabilitation training and motor recovery. 6 To address the time course of the hypothesized changes, we conducted a longitudinal study that included 10 scans over 6 months.
Material and Methods
Subject
A 23-year-old man complained of the paralysis of all muscles on the right side of his face since awakening that day. The evaluation suggested an idiopathic facial nerve palsy (Bell palsy). The patient was right-handed 7 and had no previous history of neurological disorders. This study was approved by the local ethics committee, and the patient gave his written informed consent. Motor evoked potentials, nerve conduction study, and blink reflex confirmed the diagnosis. The first MRI scan of the study was conducted on the day of the patient’s arrival and took place prior to any treatment. Subsequently, the patient was treated with prednisolone for 7 days (250 mg/d for the first 3 days, followed by 100 mg/d, 70 mg/d, 50 mg/d, and 20 mg/d).
Clinical Assessment of Facial Function
We used the House–Brackmann facial nerve grading system (HBS), which is the most widely applied scoring system 8 (1 = normal facial movement; 6 = no movement). The Stennert grading system was also used to assess the severity of facial palsy at rest and during voluntary facial movements. 9 This score ranges from 0 = HBS grade 1, 4 = gross facial asymmetry at rest, and 6 = HBS grade 6. The clinical grading was performed 10 times by the same examiner who was blind to any results of the MRI measurements.
MRI Recordings
All examinations were performed on the same 3.0-Tesla MR scanner (Trio, Siemens, Erlangen, Germany) to obtain echo-planar T2*-weighted image volumes (EPI) and transaxial T1-weighted structural images. Functional resting state data were acquired in 1 EPI session of 203 volumes. The patient was instructed to lie down with his eyes closed, to think of nothing in particular, and to not fall asleep. The first 3 volumes were subsequently discarded because of equilibration effects. A functional image volume was composed of 40 transaxial slices, including the whole cerebrum and cerebellum (voxel size = 3 mm × 3 mm × 3 mm; repetition time = 3 seconds; TE = 35 ms). After functional measurement, high-resolution T1-weighted structural images (voxel size = 1 mm × 1 mm × 1 mm) were acquired. This image acquisition paradigm was performed 10 times over a period of 178 days. The fifth measurement was extended to include an additional functional motor paradigm after the acquisition of resting state and structural data. For this measurement, the subject was visually instructed to move the left or right corner of his mouth up and down with a frequency of 1 Hz for 30 seconds, followed by a 30-second rest period. The movement effort is expected to be the same for both sides. The patient was trained on this motor task prior to MRI scanning. The paradigm consisted of 5 blocks each of left- and right-sided movements in a pseudorandomized order, resulting in 203 image volumes with the same parameters as those that were acquired during the resting state measurement.
VBM Analysis
Data analysis was performed with MATLAB (Mathworks, Natiek, Massachusetts) and VBM5 software (http://dbm.neuro.uni-jena.de/vbm/). We used VBM5 default settings, which apply the “optimized” protocol 10 and remove inhomogeneities in signal intensity between subsequent scans. The optimized parameters, which were initially estimated while normalizing extracted gray matter images to the customized gray matter template, were reapplied to the original whole brain images. Furthermore, a hidden Markov random field model 11 was applied to minimize the noise level by “removing” isolated voxels of a tissue class that were unlikely to belong to that tissue class. The 10 resulting unmodulated gray matter images were smoothed by convolving them with an isotropic Gaussian kernel of 6 mm. To account for the potential influence of physiologic factors that may affect the gray matter probability rating of the whole brain, we normalized the 10 image volumes by the individual total sum of all gray matter voxel values. From these image volumes, a region of interest (ROI) of facial M1 consisting of 27 voxels was extracted, and all voxel values within it were averaged and normalized to a mean value of 0. The location of this ROI was defined by the location of maximum activity within M1 during the functional motor paradigm. The following values were estimated from the resulting time course: (a) the deviation from the mean (absolute values were summed over all scans) and (b) the area under the curve (absolute area between the time course and the mean). To test whether these values were significantly altered during the course of Bell palsy, we compared them with all other clusters in the brain. The described procedure was repeated for all brain areas that contained gray matter. All clusters of the cerebellum, medulla, and pons were excluded because of known difficulties in their segmentation.12,13 Differences between M1 and other clusters were accepted to be significant at P < .05.
Preprocessing of Functional Data (Resting State and Motor Paradigm)
The realignment procedure was carried out in 2 steps. First, all image volumes from a single session were realigned to the first volume using a 6-parameter rigid-body transformation to correct for within-session motion artifacts. Second, all images from all sessions (10 resting state and 1 functional motor paradigm) were realigned to a mean image to account for intersession changes in head position. The resulting transformation parameters were then used to normalize the realigned functional images from all sessions to the Montreal Neurological Institute (MNI) standard brain 14 in order to report MNI coordinates. Normalized functional images were spatially smoothed using a 6-mm full-width at half-maximum Gaussian kernel.
fMRI Analysis of the Motor Task
A multiple regression analysis using a general linear model was performed to obtain statistical parametric maps calculated for both conditions (right-sided and left-sided facial movement). Functional MRI signal time courses were high-pass filtered (128 seconds) and modeled as an experimental stimulus onset function convolved by the canonical hemodynamic response function (low-pass filter). Individual results were projected onto the coregistered individual high-resolution T1-weighted 3D data set. The anatomic localization of activations was analyzed with reference to the standard stereotaxic atlas and by visual inspection of the individual T1-weighted structural data. The resulting statistical maps were thresholded by the family-wise error (FWE; P < .05).
Connectivity Analysis
Functional connectivity is a measurement of the temporal correlations of low-frequency (<0.1 Hz) blood oxygenation level dependent (BOLD) fMRI signal fluctuations between distinct brain areas.15,16 Most studies examine functional connectivity in the resting state where these BOLD fluctuations are presumed to relate to “spontaneous” neural activity and reflect information transfer and collaboration between brain areas.15,17 Changes in functional connectivity within the facial motor network during the course of Bell palsy were investigated in the resting state. To identify relevant areas of the facial motor network, we used the activation maps obtained from the motor task. The point of maximum activation strength, along with its 26 neighbors, was selected from each activated region, and these were further used as ROIs. The resting state data from these identified ROIs were extracted, and cluster-specific time series were estimated by averaging the time series of all voxels within a cluster. All signal-intensity time courses were band-pass filtered (0.01 < f < 0.1) to reduce the effect of low-frequency drift and high-frequency noise. Several sources of variance were then removed from the data by linear regression as follows: (a) 6 parameters obtained by rigid body correction of head motion, (b) the signal from a ventricular ROI, and (c) the signal from a region centered in the white matter. Pearson correlation coefficients were computed between the M1-cluster contralateral to the facial nerve palsy and all other clusters. We focused on the M1-cluster contralateral to the facial nerve palsy for several reasons. First, the contralateral M1 is more involved in the movement of the affected side of the face than the ipsilateral M1. Second, the contralateral M1 is the only region that showed a significant alteration of gray matter concentration, indicating that this region is strongly affected by cortical plasticity. Third, the M1 contralateral to the facial nerve lesion has been shown to undergo neuroplastic changes in animal studies 4 and in human experiments. 3 To test for acutely disrupted functional connectivity, we compared the correlation coefficients of the first scan with the coefficients of those scans that were performed after complete clinical recovery (the last 4 scans). Findings were considered significant at P < .05.
Results
Clinical Assessment of Facial Function
During the acute state of Bell palsy, the patient revealed a unilateral (right-sided) loss of facial function with a maximum HBS grade of 5 at the first 2 measurements (Table 1). A decrease in the severity of the facial palsy was seen from the second week after the onset of symptoms. The patient demonstrated a complete recovery in the eighth week (day 55/seventh scan; HBS grade 1, Stennert score 0) without synkinesis or contracture. The patient reported that he performed his rehabilitation training for half an hour every day during the first 3 weeks, after which he performed the training less often. He terminated the training after 5 weeks, when he felt that his facial function had returned to normal. He reported normal taste and hearing over the entire course of the palsy.
Grading of Facial Nerve Function a
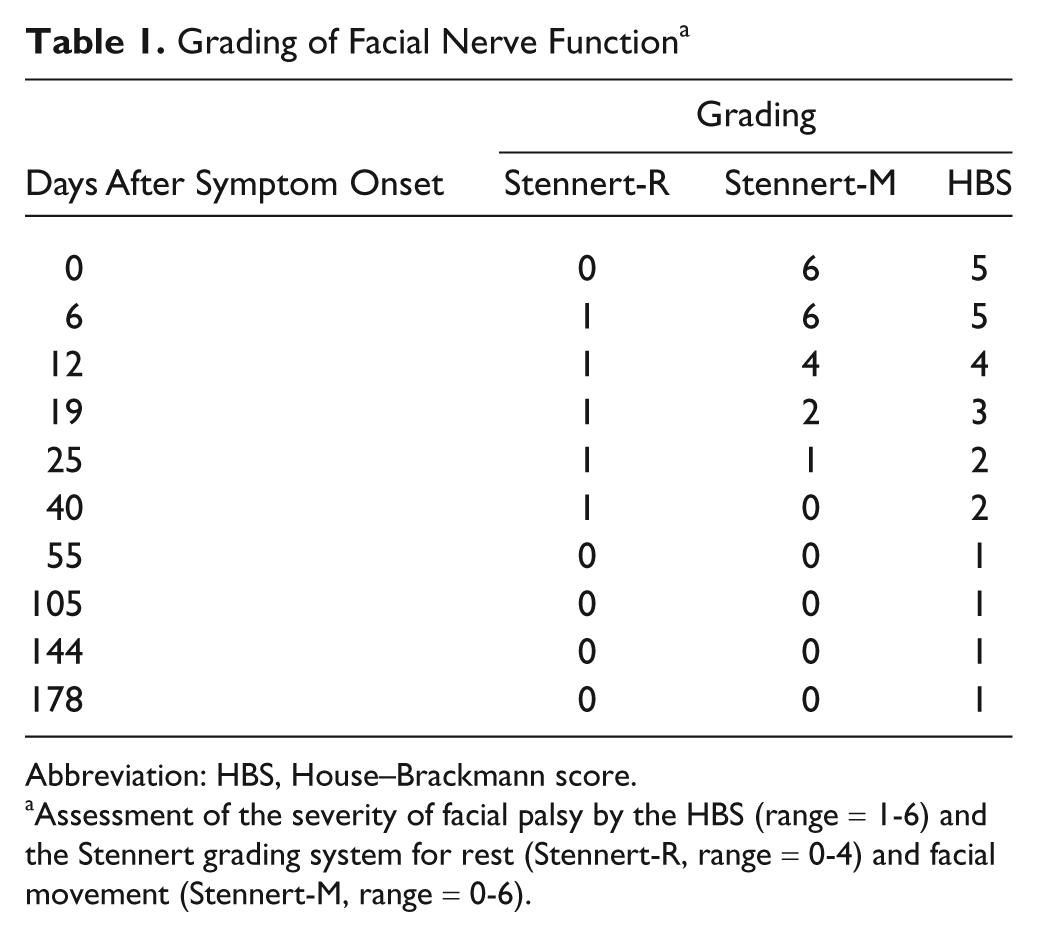
Abbreviation: HBS, House–Brackmann score.
Assessment of the severity of facial palsy by the HBS (range = 1-6) and the Stennert grading system for rest (Stennert-R, range = 0-4) and facial movement (Stennert-M, range = 0-6).
Functional Magnetic Resonance Imaging
The motor tasks evoked highly significant activations at the voxel level (P < .05, FWE corrected) of bilateral M1, the supplementary motor area (SMA), and the right inferior ventral precentral gyrus (ivPCG) for both the formerly paretic side and the unaffected side. The left ivPCG, the left insula, and the bilateral cerebellum were significantly activated during movements of the right (formerly paretic) side of the face, whereas these areas did not reach significance during movements of the left (unaffected) side (Figure 1, Table 2).
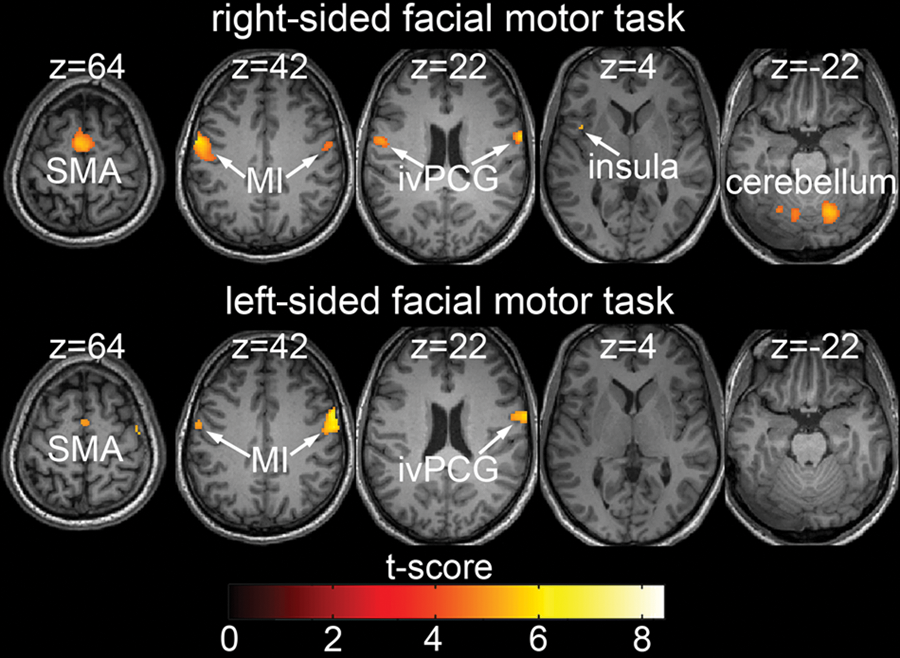
fMRI during a facial motor task. Activation pattern during facial movements performed at the fifth scan (HBS score = 2). Activations (P < .05, FWE corrected) in response to blocked (30 seconds) movement of the formerly paretic (upper row) or unaffected (lower row) side of the face are shown superimposed on the patient’s T1 image. Results are presented on axial slices with the corresponding z coordinate at the top (MNI standard space).
Cortical Activation During a Facial Motor Task a
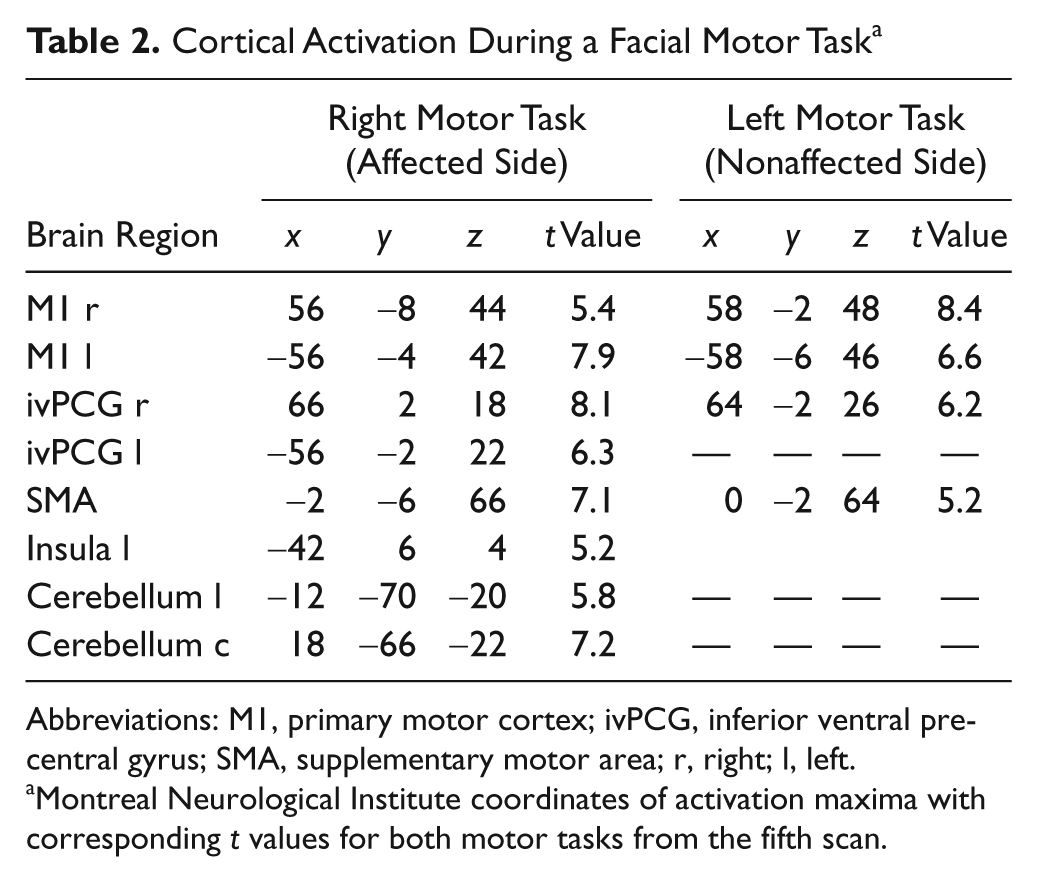
Abbreviations: M1, primary motor cortex; ivPCG, inferior ventral precentral gyrus; SMA, supplementary motor area; r, right; l, left.
Montreal Neurological Institute coordinates of activation maxima with corresponding t values for both motor tasks from the fifth scan.
Voxel-Based Morphometry
Changes in gray matter concentration during the course of Bell palsy were estimated for all clusters (27 voxels) of the cerebrum that contained gray matter. The time course of changes in those clusters that comprised the location of maximum activation during the functional motor paradigm is displayed in Figure 2 (left side). The deviation from the mean (Figure 2, middle) and the area under the curve (Figure 2, right side) were estimated for the time course of all clusters. Both these values were significantly increased (P < .05) for the cluster representing the left M1 (Figure 2). The same analysis was repeated in other parts of the functionally activated facial motor network (right M1, SMA, and bilateral ivPCG) but failed to show any significant results (Figure 2). Visual inspection of the time course in the left M1 suggested an initial relative increase in gray matter concentration during the course of Bell palsy, followed by a later decrease (Figure 2).
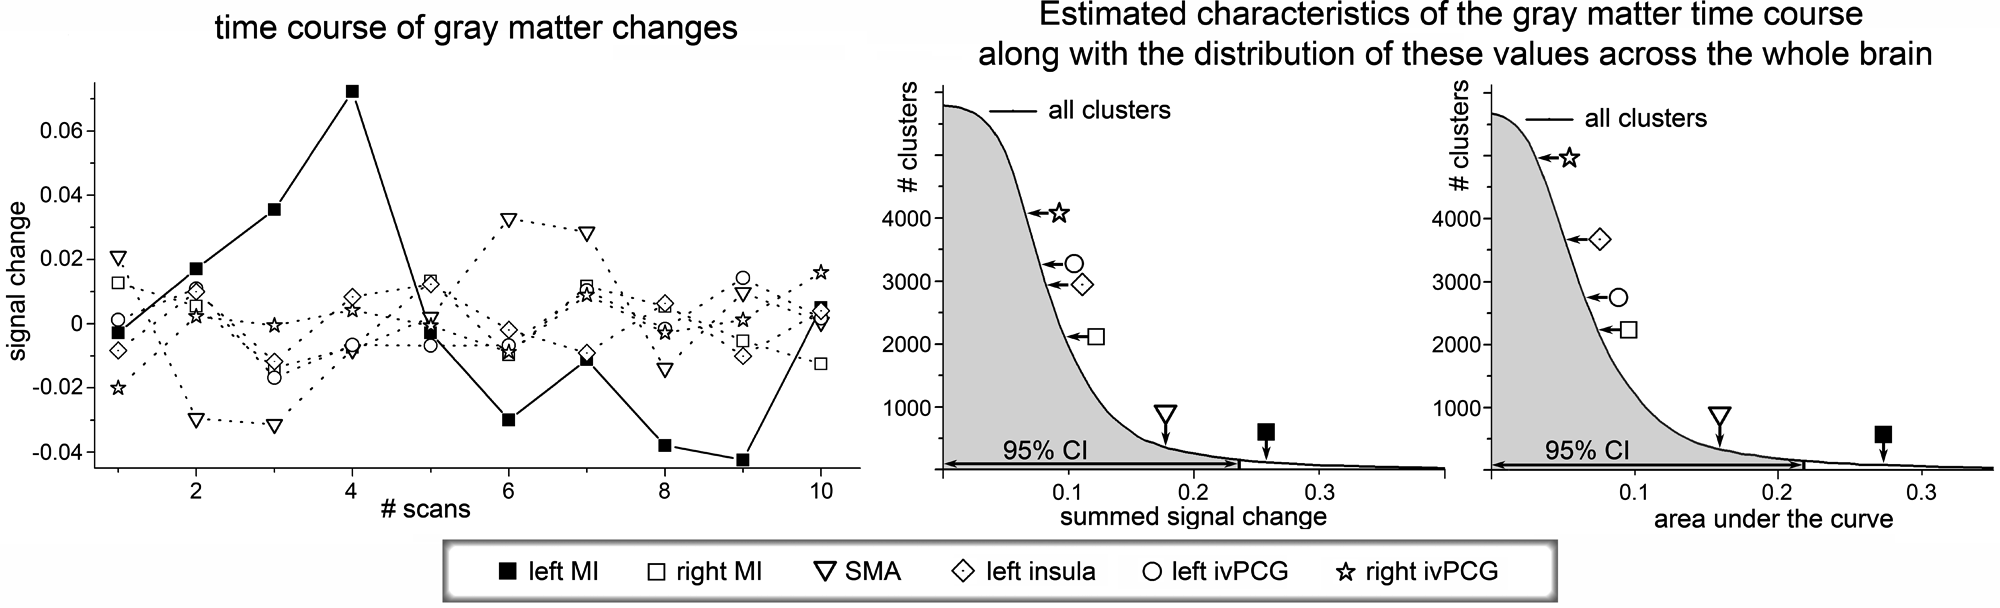
Time course of changes in gray matter concentration in Bell palsy. The time courses of clusters that comprise the most activated points in the facial motor task (bilateral M1, SMA, bilateral ivPCG, left insula) are displayed on the left side. The deviation from the specific cluster mean as well as the area under the curve was estimated for all clusters of the brain that comprise gray matter. The distributions of these parameters are shown in the middle and right parts of the figure. Here, the solid line indicates the number of clusters (y axis) with a parameter value greater than the corresponding value on the x axis. The shaded area below the curve indicates the 95% CI. The positions of the identified clusters of the facial motor network within these distributions are marked by arrows.
Connectivity Analysis
The time course of the strength of resting-state functional connectivity between the left M1 and other parts of the activated motor network is illustrated in Figure 3. Connectivity estimation between the left M1 and SMA, ivPCG, left insula, and bilateral cerebellum showed significantly (P < .05) lower values on the first day of Bell palsy (first scan), compared with the values derived from the last 4 scans (after clinical recovery). Thus, initial functional connectivity improved during the course of Bell palsy. However, the speed of this increase and the time needed to obtain stable functional connectivity values differed between these areas. The cerebellum showed the fastest increase, with significantly reduced functional connectivity only at the first scan. The increase in functional connectivity in ivPCG proceeded at a slightly slower pace, with significantly reduced values on the first 2 scans. The SMA and the left insula showed significantly decreased functional connectivity values on the first 3 scans. Moreover, the rapidly increasing functional connectivity to the cerebellum revealed a significant overshoot on the second and third measurements, with a later decrease to a relatively stable functional connectivity strength. Relating this development of functional connectivity to the clinical time course demonstrated that functional connectivity between M1 and all areas reached stable values before complete clinical recovery. We performed a paired t test to compare the functional connectivity value of 1 region (normalized to values between 0 and 1) with the normalized clinical score to test whether the increase in functional connectivity significantly preceded clinical recovery. We found significantly greater values of normalized functional connectivity for the left ivPCG, SMA, bilateral cerebellum, and left insula during the course of clinical recovery.
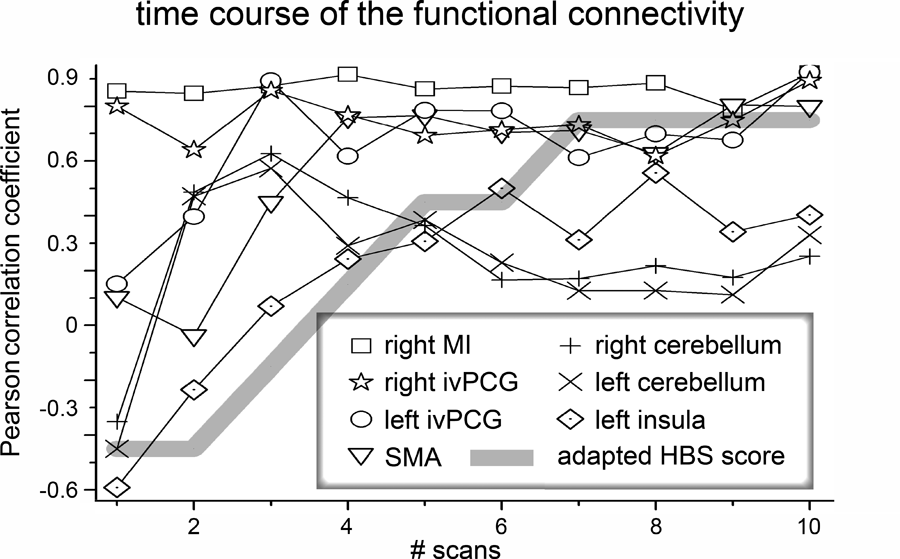
Connectivity analysis. The time course of functional connectivity between the left M1 and other parts of the facial motor network are shown. The strength of connectivity between 2 clusters was assessed by estimating Pearson correlation coefficient for both time courses. The bold, gray, solid line indicates the severity of the facial palsy as assessed by HBS. This score was adapted to provide a better comparability range (adapted HBS = [original HBS − 3.5] * −0.3).
Discussion
Alterations of brain structure and functional connectivity during the course of Bell palsy were measured by MRI to investigate the time course of cortical reorganization due to deefferentation. We found a significant morphometric alteration in the left M1 (contralateral to the paretic side) with an initial increase in gray matter concentration. Connectivity analysis revealed acutely disrupted functional connectivity within the affected facial motor network, followed by an increase in functional connectivity toward a stable level. The recovery of functional connectivity within the affected network preceded the clinical recovery of the patient.
Voxel-Based Morphometry
The spatial location of the morphometric alteration overlapped with the area displaying functional activation and was localized within the representation of the face on the left M1 (contralateral to the affected side of the face). A recent study demonstrated that the same region showed significant activity alterations due to a motor task in patients with Bell palsy. 3 Animal studies revealed reorganization in the contralateral M1 after facial nerve dissection. 18 Additionally, a rodent facial vibrissae study revealed reorganization in the contralateral M1 after facial nerve dissection. Interestingly, the persistent loss of vibrissae input did not change the M1 reorganization pattern during the first 48 hours after motor paralysis. This indicates that any aberrant, facial nerve lesion–induced sensory feedback does not provide the gating signal necessary to trigger M1 reorganization. 18
The gray matter concentration in the left M1 showed an increase over the first 3 weeks after the onset of Bell palsy. Facial function was most severely affected at this time. Clinical recovery began in the second week, with symptoms decreasing rapidly over the next few weeks. In the fourth week and thereafter, the remaining facial palsy was difficult to detect with an untrained eye. The patient performed rehabilitation training daily for the first 3 weeks, then tapered and finally stopped at 5 weeks. One hour of tongue-task training was associated with corticomotor excitability, which lasted 7 days. 19 Face M1 neuroplasticity due to orofacial motor skill training was also demonstrated in animal experiments.4,5,20 Thus, one possible explanation for the initial increase in gray matter concentration is the rehabilitation training. Multiple studies have shown that the motor cortex is engaged during imagined movements 21 and also during movements of phantom limbs. 22 The facial motor training should therefore engage the motor cortex even if the resulting motor command is blocked in the course of the facial nerve. An initial increase in gray matter concentration and volume due to actually performed motor training (eg, learning to juggle) is in line with the existing literature. 23 Alternatively, one might hypothesize that the initial increase in gray matter concentration is a phenomenon associated with the neuropraxia of the facial nerve. The later decrease in gray matter concentration may be due to the termination of the rehabilitation training. This hypothesis is supported by the study of Draganski et al, 23 which also reported that the expansion of gray matter decreased in the absence of motor training. Additionally, animal experiments have shown that face M1 neuroplasticity due to orofacial motor skill training is reversible in the absence of training. 4 The current investigation provided an impression of the time course of morphometric changes in very short intervals. One of the particularly interesting features of Bell palsy is that the sensory feedback from the paretic face is not impaired. Thus, the brain continues to receive precise sensory information and is therefore able to monitor and evaluate the success of the motor training performed.
Connectivity
The contralateral M1 was used as a seed region, and its functional connectivity to the other parts of the activated motor network was estimated. Although, in nonhuman primates, all selected nodes have been directly connected with the seed chosen in our study,24-27 these studies did not reveal whether the functional results reflected direct (anatomically connected) or indirect information transfer. The strength of functional connectivity reflects the degree of neuronal activity synchronization, which correlates with motor performance in healthy subjects28,29 and successful motor rehabilitation after stroke.30,31 The strength of the functional connectivity was therefore considered to reflect the strength of information transfer and collaboration between brain areas. Accordingly, our results indicate a reduced information transfer within the motor system due to the impaired motor performance after Bell palsy. Similar to the current results, disruption in functional connectivity of the motor network was found in the acute stage of cerebral stroke,1,2,32 including decreased interhemispheric connectivity.1,2 We found disruption primarily on the ipsilateral side, consistent with the absence of brain injury. Connectivity strength within the facial motor network subsequently increased during the course of recovery at different rates. The earliest increase in functional connectivity was observed in the cerebellum, followed by ivPCG and SMA; in contrast, the slowest increase was seen in the left insula. This sequence suggests that areas of comparatively higher brain function restored stable functional connectivity values more slowly, but all areas reached stable levels before the patient fully recovered. This indicates that functional connectivity values either preceded the clinical recovery or that functional connectivity values were less sensitive to minor changes in facial function. However, because our clinical assessment considered only gross voluntary facial movements, a slight deterioration of facial function would not have been detected. This is consistent with a longitudinal electromyographic study that demonstrated defective healing after Bell palsy in significantly more patients than when using clinical assessments of facial function. 33 An interesting question is whether different functional connectivity values causally relate to the initial severity of the symptoms and to the clinical recovery of function. In this context, the potential role of the interactions between the sensory and the motor networks for plastic processes need to be investigated. Additional longitudinal studies may also elucidate variations in VBM and connectivity in relation to neuropraxia with short-term motor loss, as in our subject, compared with longer duration paralysis with nerve regeneration or reinnervation to restore motor control. Rehabilitation therapy in the latter case can be tested to learn how it may promote recovery.
Footnotes
Acknowledgements
The authors wish to thank the reviewers and the editor for their helpful comments and insights.
Carsten M. Klingner and Gerd F. Volk contributed equally to this work.
The author(s) declared no potential conflicts of interest with respect to the research, authorship, and/or publication of this article.
The author(s) received no financial support for the research, authorship, and/or publication of this article.