
Abstract
Background. Muscle fatigue prevents repetitive use of paralyzed muscle after spinal cord injury (SCI). Objective. This study compared the effects of hybrid patterns of muscle stimulation in individuals with acute and chronic SCI. Methods. Individuals with chronic (n = 11) or acute paralysis (n = 3) underwent soleus muscle activation with a constant (CT) or doublet (DT) stimulation train before and at various times after a fatigue protocol. Results. The chronically paralyzed soleus was highly fatigable with a fatigue index (FI) of 19% ± 6%, whereas the acutely paralyzed soleus was fatigue resistant (FI = 89% ± 8%). For the chronically paralyzed group, the DT protocol caused less than 5% improvement in peak and mean force relative to the CT protocol before fatigue; however, after fatigue the DT protocol caused an increase in peak and mean force (>10%), compared with the CT protocol (P < .05). As the chronically paralyzed muscle developed low-frequency fatigue, the DT protocol became more effective than the CT protocol (P < .05). The DT protocol increased the rate of torque development before fatigue (42% ± 78%), after fatigue (62% ± 52%), and during recovery (87% ± 54% to 101% ± 56%; P < .05). The acutely paralyzed group showed minimal change in peak and mean torque with the DT protocol. Conclusions. Chronic reduced activity is associated with muscle adaptations (slow to fast) that render the muscle more amenable to force enhancement through doublet train activation after fatigue. These findings are applicable to patients using neuromuscular stimulation.
Introduction
Muscle fatigue is one of the primary limiting factors to functional neuromuscular stimulation in individuals with spinal cord injury (SCI). 1 The human paralyzed soleus, normally a slow and fatigue-resistant muscle, becomes fast and fatigable after long-standing paralysis. 2-6 Developing strategies to increase force when the muscle is fatigued is an important consideration in efficiently training paralyzed muscle. 5,7
A brief interpulse interval or “doublet” at the onset of a stimulus train greatly augments the force produced by whole muscle and single motor units. 8-12 Doublets occur during voluntary contractions of human and animal whole muscle 13-15 and become more prevalent during fatigue from sustained isometric contractions. 16 Previous studies found that a doublet at the start of a stimulus train effectively augmented quadriceps muscle force in humans with and without SCI, 8,10,17-21 but the influence of fatigue, potentiation, and time after paralysis was not examined. Two phenomena that are well documented in fast fatigable motor units and chronically paralyzed muscle are low-frequency fatigue and potentiation. 22-24 Low-frequency fatigue is the prolonged loss of force after exercise at a low frequency of stimulation that is partially reversible with higher stimulation frequencies. 23,25 Potentiation is the enhancement of skeletal muscle force during repetitive activation. 26,27 Both low-frequency fatigue and muscle potentiation are considered to be properties of fast (type II) muscle 22,24,28,29 and may affect doublet train stimulation. The mechanism for low-frequency fatigue is commonly associated with a reduced sensitivity and/or release of calcium. 30,31 Potentiation has been attributed to enhanced myosin light chain phosphorylation. 29,32-34 We have recently demonstrated that postfatigue potentiation of torque is extensive in the chronically paralyzed soleus but absent in acutely paralyzed soleus. 24
The purpose of this study, therefore, was to examine doublet train activation in paralyzed muscle at various times after fatigue, and while the muscle was at different levels of potentiation. We hypothesize that low-frequency fatigue and muscle potentiation will directly influence the magnitude of torque enhancement associated with doublet train activation.
Methods
A total of 14 subjects participated in this study. Eleven chronically paralyzed subjects (mean ± SD age = 32 ± 6 years) had complete paralysis for at least 3 years. Three acutely paralyzed subjects (mean ± SD = 28 ± 4 years) had complete paralysis for less than 2 weeks. All subjects had complete paralysis at or above the T-6 level (American Spinal Injury Association-A 35 ). These subjects were injured while playing sports (n = 2), diving (n = 4), doing construction (n = 3), in motor vehicle accidents (n = 4), or from a fall (n = 1). In all, 80% of the subjects (n = 11) were male, consistent with the higher incidence of SCI among males. 36 Each subject gave informed written consent to participate in these experiments. The university’s Human Subjects Institutional Review Board approved all of the experimental procedures.
Mechanical Recording
Measurements were made from the right lower extremity of all subjects. Subjects were seated comfortably with the knee flexed to 90° and the ankle in a neutral position. With the knee at 90° of flexion, the soleus muscle produces the majority of plantar flexion torque. 37 The foot was positioned on a rigid footplate instrumented with a force transducing load cell (Genisco AWU-250, Genisco Technology, Cambridge, Massachusetts) such that the foot was perpendicular to the transducer. The mechanical recording apparatus has been described previously. 6,7,24,38,39 Force was amplified 500 times, was monitored on an oscilloscope, and was simultaneously digitized using a 12-bit resolution analog to digital converter at a rate of 500 samples per second.
Electrical Recordings and Stimulation
Surface electromyography (EMG) signals (M-waves) were monitored with a bipolar silver-silver chloride electrode with 0.8-cm diameter and 2-cm fixed interelectrode distance. The recording electrode was positioned over the soleus muscle parallel to its fibers, approximately 2 cm medial to the midline of the distal calf and distal to the medial head of the gastrocnemius. A ground electrode was placed on the anterior tibia. EMG signals were on-site preamplified by a factor of 35, followed by mainframe differential amplification. The EMG amplifiers had an input impedance of 15 MΩ at 100 Hz, a frequency response of 15 to 1000 Hz, a common mode rejection ratio of 87 dB at 60 Hz, and a gain range of 1000 to 20 000 times. EMG signals were monitored on an oscilloscope and simultaneously digitized using a 12-bit resolution analog to digital converter and sampled at a rate of 5000 samples per second.
All contractions were elicited with transcutaneous electrical stimulation of the tibial nerve at the popliteal fossa. A double-pronged surface electrode (with the cathode distal to the anode) was secured over the nerve. A custom-designed constant-current stimulator with current range from 50 µA to 200 mA and total output capability of 400 V delivered square waves with pulse widths ranging from 100 to 1000 µs. Pulses from the computer digital to analog board triggered the stimulator. Current could be adjusted manually in discrete steps and was typically in the range of 125 to 175 mA with a pulse width at 500 µs for maximum M-waves. The M-wave was considered maximal when there was no increase in amplitude with an additional increase in current. Supramaximal M-waves were elicited by increasing the stimulation intensity 1.5 times the intensity that elicited the maximum M-wave.
Experimental Protocol
Subjects were required to perform the protocol on 2 occasions, with 10 days separating each session. Before the first experimental session, each subject visited the laboratory for familiarization with the equipment and for preliminary maximal plantar flexor activation. The protocol involved an assessment of force elicited by a constant frequency train of stimuli (CT) or by a constant frequency train preceded by a doublet with a 6-ms interpulse interval (DT). A series of pilot experiments verified that the 6-ms doublet effectively augmented force in paralyzed muscle. After initial activation with CT or DT, subjects received a repetitive activation protocol to fatigue the soleus, followed by another assessment of force using CT or DT. The CT or DT protocol was then repeated at 5, 10, 15, and 20 minutes after the cessation of the fatigue bout. Subjects underwent the CT protocol on one day and the DT protocol on a separate day (10 days apart).
CT/DT Protocol
Prior to beginning the CT or DT protocol, 5 trains (15 Hz) of supramaximal stimulation were delivered to the tibial nerve over 10 seconds. The CT or DT protocol commenced following 10 minutes of rest. The constant frequency (CT) protocol consisted of six 15-Hz, 12-pulse trains, each train separated by 2 seconds. The CT stimulation train was on for 733 ms and off for 1267 ms. The doublet frequency (DT) protocol also consisted of six 15-Hz, 12-pulse trains, each train separated by 2 seconds. However, the interpulse interval between the first and second pulses was 6 ms (666 ms on and 1334 off). The DT or CT protocol administered before and at various times after (0, 5, 10, 15, and 20 minutes after) a standard fatigue protocol were included to assess the effects of DT and CT during low-frequency fatigue in the chronic SCI subjects. Because acutely paralyzed muscle is fatigue resistant and therefore does not display low-frequency fatigue, 4,24,40 the subjects with acute paralysis were assessed before, immediately after, and at 5 minutes of recovery only.
Fatigue Protocol
The fatigue protocol consisted of 120 contractions elicited at a 20-Hz constant frequency with a duty cycle of 330 ms on and 670 ms off. Each stimulus train consisted of 12 pulses. This protocol had previously been shown to induce significant long duration fatigue (low-frequency fatigue) of the paralyzed soleus muscle. 23,24,38,40
Data Analysis
The force signal was converted to torque by taking the product of the external moment arm and the perpendicular force measured from the transducer. For clarity in presenting the data, the torque–time curves were also normalized to the maximum torque generated by each subject’s preexperiment 15-Hz contractions. The normalized peak torque (nPT) was the peak of the normalized torque–time curve. The normalized torque–time integral (nTTI) was calculated as the integrated amplitude of the torque–time curve from the start of the contraction to the 12th stimulus pulse, divided by the time. The normalized rate of torque development (nRTD) was calculated by taking 80% of the maximum torque in each normalized torque–time curve and dividing it by the time required to generate this torque.
When delivering the DT and CT protocols at various times postfatigue, torque varied among the 6 DT or CT contractions because of postfatigue potentiation. We wished to explore the efficacy of doublet stimulation when the muscle was in a more- or less-potentiated state. The effect of the DT and CT protocols was therefore determined for the contraction with the lowest force (least potentiated) and the contraction with the greatest force (most potentiated) to establish the influence of potentiation on doublet force enhancement. Generally, the first contraction was the least potentiated and showed the lowest nPT. The sixth (final) contraction in the CT and DT protocols generated the highest nPT and therefore demonstrated the most postfatigue potentiation. The average of the 6 contractions for each dependent variable (nPT, nTTI, nRTD) was determined for the DT and CT protocols. These represented general measures because they included all 6 contractions (6 DT contractions or 6 CT contractions) that were at different degrees of potentiation. The percentage difference between the DT and CT protocols was also determined by the following formula: [(DT − CT)/DT] × 100.
The fatigue index (FI) was calculated by dividing the force produced at the 120th contraction by the initial force generated during the fatigue protocol. Because we were comparing protocols between sessions we determined the between-session reliability of the FI and maximum torque in all subjects. The intraclass correlation coefficients were .96 and .87, respectively, indicating excellent between-session agreement.
Statistical Analysis
Data are reported as means (±SD) within the text and displayed as means (±SE) in the figures. Separate 2-factor (stimulation protocol × fatigue time) analyses of variance (ANOVAs) with repeated measures on fatigue test time (SAS, SAS Institute, Cary, North Carolina) were used to compare the dependent variables for the DT and CT. Separate 1-way ANOVAs (fatigue time) with repeated measures on time were used to determine if the percentage change between the DT and CT differed across fatigue states (pre, post, 5, 10, 15, and 20 minutes of recovery). Separate 2-factor (fatigue time × potentiation condition) ANOVAs with repeated measures on the potentiation condition were used to compare the percentage change between the DT and CT for the more or less-potentiated conditions across the various states of fatigue. Separate 2-factor (spinal cord injury vs fatigue time) ANOVAs with repeated measures on fatigue time were used to compare the percentage change between the DT and CT condition for the acute versus chronic spinal cord injury conditions. Post hoc analyses (Tukey–Kramer) were used to test for differences among pairs of means when appropriate. A significance level of P < .05 was used to identify statistically significant differences.
Results
The purpose of the study was to examine doublet train activation in paralyzed muscle at various times after fatigue and while the muscle was at different levels of potentiation. The fatigue index in the chronic group supported that the soleus was highly fatigable (19% ± 6%), while the FI in the acute group supported that the soleus was minimally fatigable (89% ± 8%). The sustained loss of nearly 50% of muscle force over 20 minutes following the fatigue protocol indicates the presence of low-frequency fatigue (Figure 1). Postfatigue potentiation is also evident during the DT and CT protocols (Figures 1D-1F).
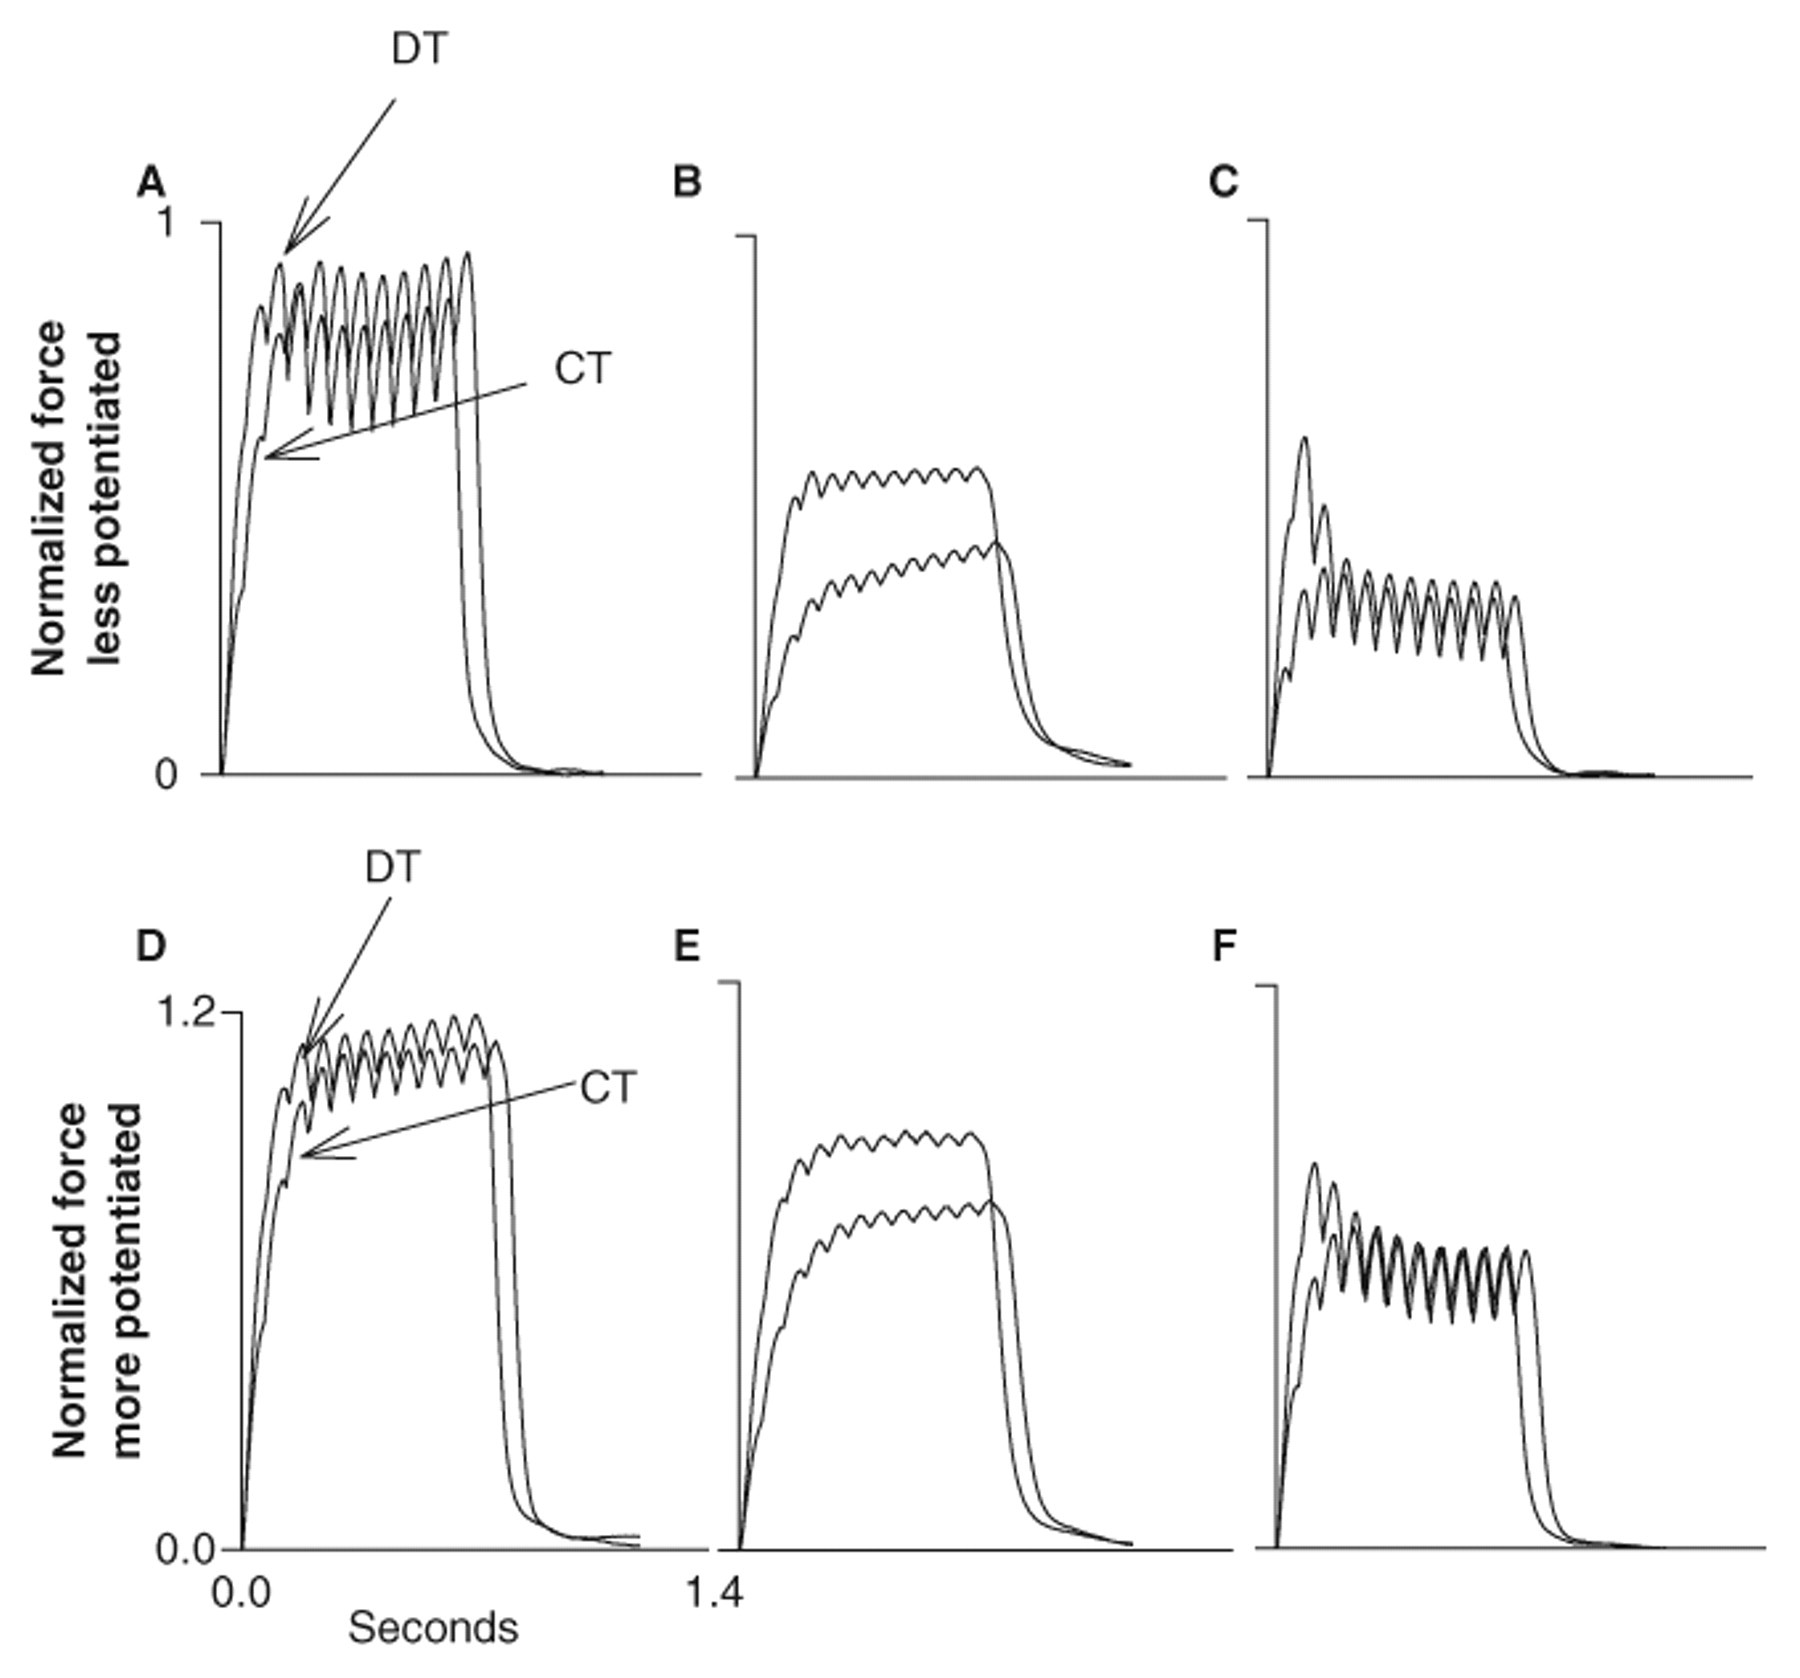
Representative example of the normalized torque–time curves for the doublet protocol (DT) and the constant frequency protocol (CT) before (A and D), 5 minutes after (B and E), and 20 minutes after (C and F) the fatigue protocol of the chronically paralyzed soleus.
Peak Torque
Maximum torque for the chronic group before, after, and at 5, 10, 15, and 20 minutes following the fatigue protocol was as follows: 66.3 ± 32.3, 22.7 ± 12.4, 38.8 ± 18.3, 42.1 ± 20.4, 42.3 ± 19.5, and 41.1 ± 19.0 N m, respectively, for the DT protocol; and 65.8 ± 28.2, 22.1 ± 11.5, 35.4 ± 14.0, 37.3 ± 15.7, 35.5 ± 15.5, and 32.8 ± 14.4 N m, respectively, for the CT protocol. The nPT did not differ between the DT and CT protocols before and immediately after fatigue (P > .05; Figure 2A). The DT protocol generated only 0.37% ± 6% and 5% ± 13% more torque than the CT protocol before and immediately after fatigue, respectively. Five to 20 minutes after fatigue, the DT protocol generated greater nPT than the CT protocol (P < .05; Figure 2A). The DT protocol generated 10% ± 14%, 12% ± 21%, 23% ± 21%, and 29% ± 24% more torque at the 5, 10, 15, and 20 minute postfatigue conditions, respectively. The increases in nPT at 15 and 20 minutes with the DT protocol (23% and 29%) were greater than the increases at 5 and 10 minutes (10% and 12%; P < .05; Figure 2B). Therefore, the DT protocol, as compared with the CT protocol, became more effective during low-frequency fatigue as time after fatigue increased.
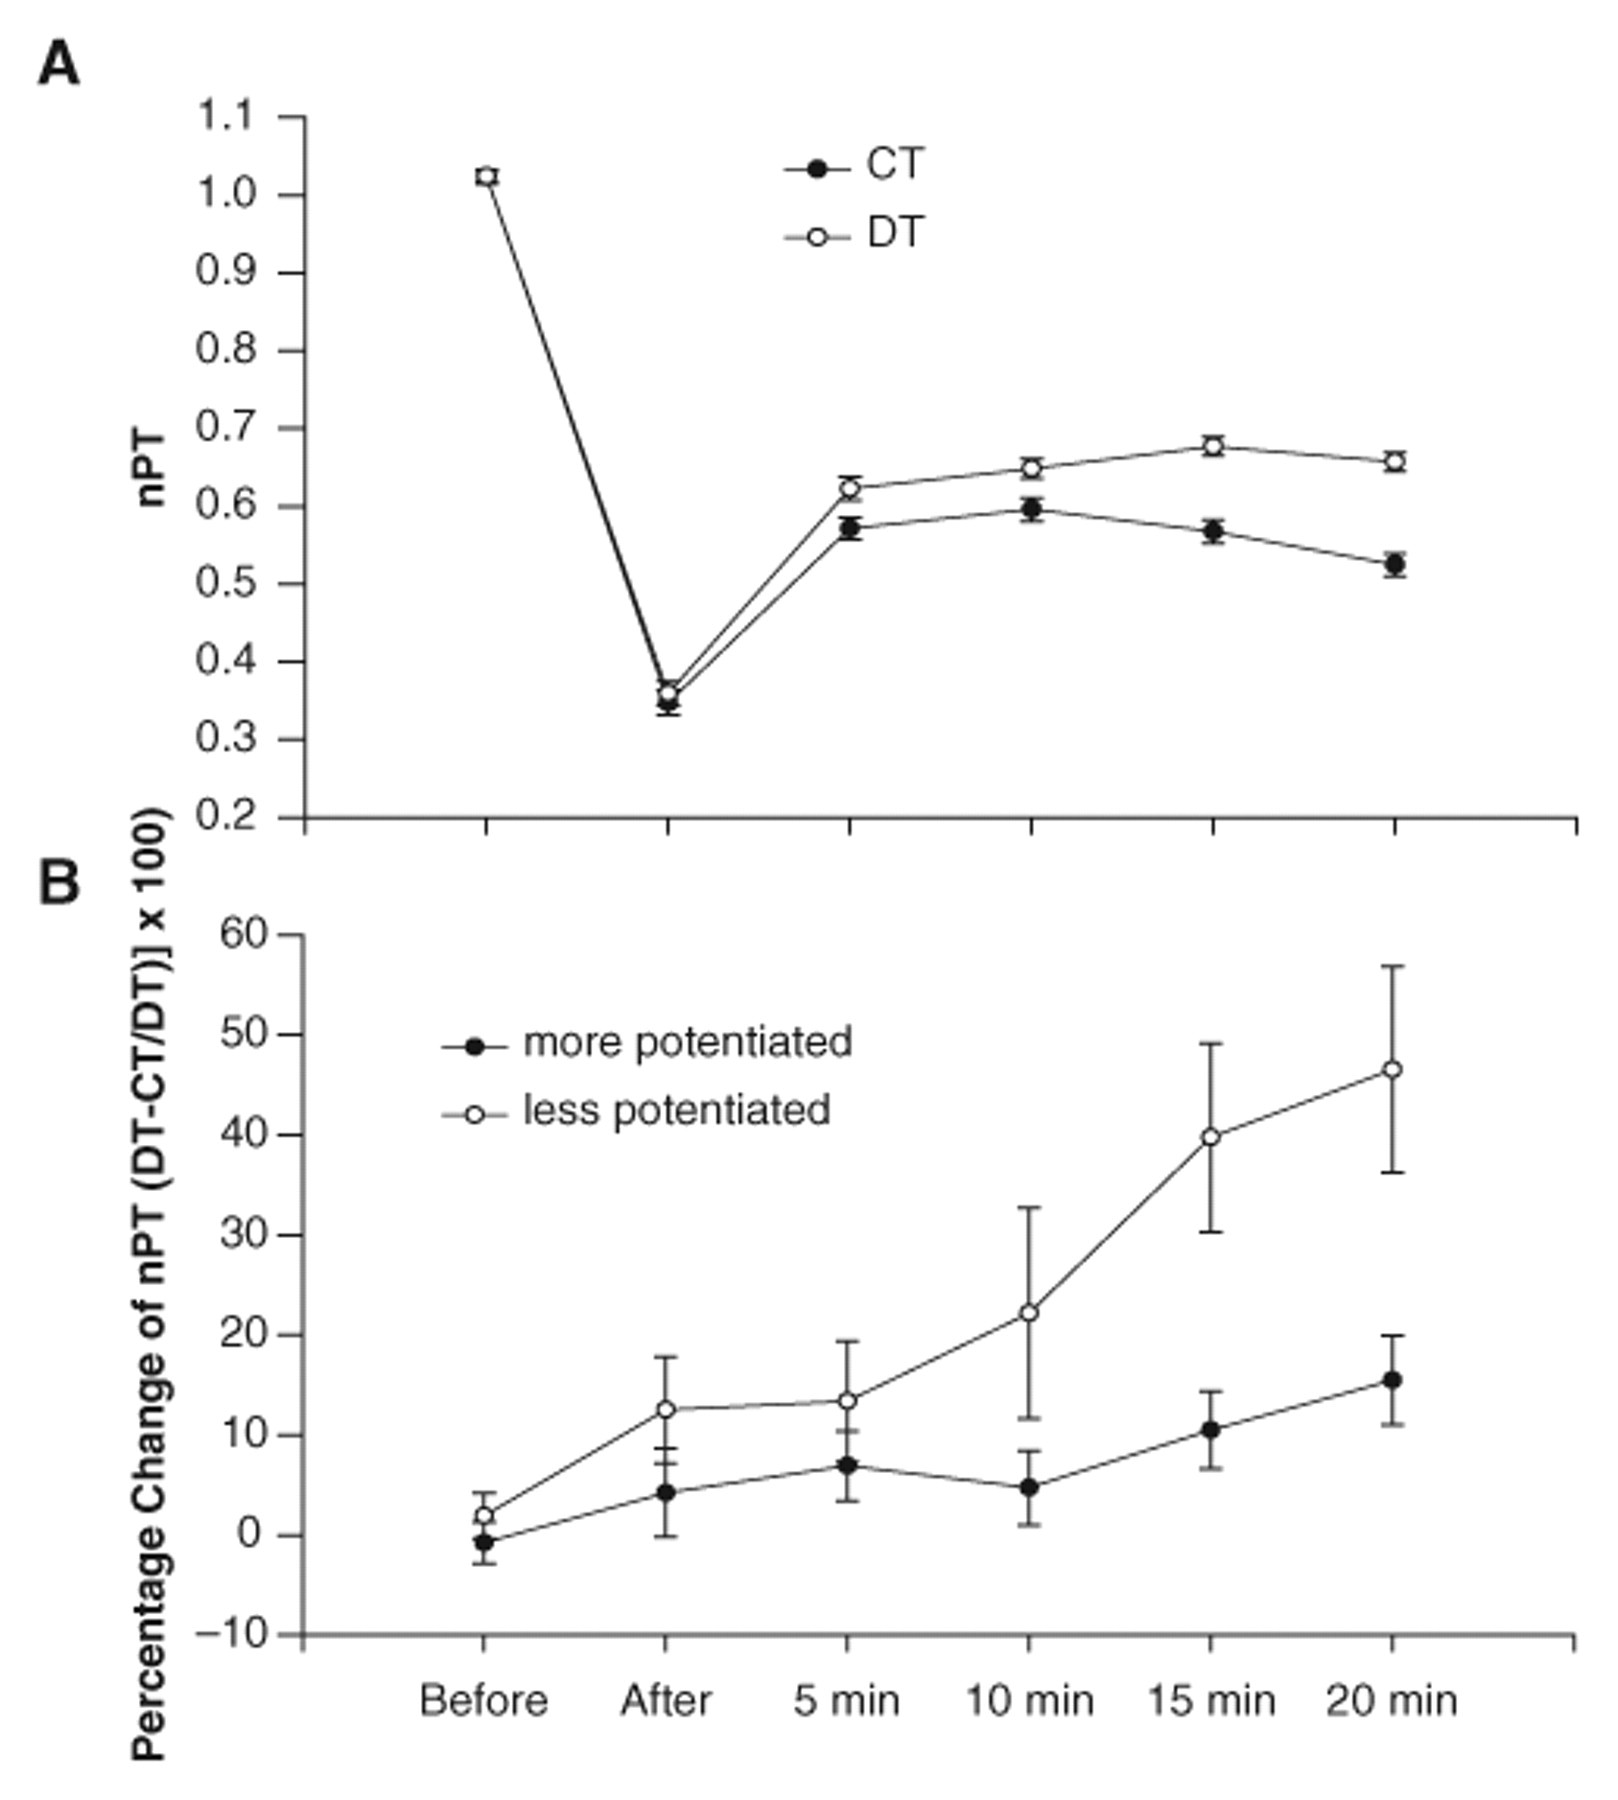
A, The mean (±SE) normalized peak torque (nPT) for the doublet (DT) and constant frequency (CT) protocols before and at various times after the stimulation protocol for all subjects’ 6 pooled contractions. The nPT for the DT protocol was greater than the CT protocol at 5, 10, 15, and 20 minutes (P < .05). The nPT for the CT protocol was less at 20 minutes than at the 5- and 10-minute times (P < .05). B, The mean (±SE) for the percentage change in nPT between the DT and CT protocols for the more potentiated and less potentiated contractions (of the 6). The positive percentages support that the DT protocol was generally more effective than the CT protocol in the more and less potentiated conditions. The DT protocol, when the muscle was less potentiated, generated more force than the DT protocol, when the muscle was more potentiated at 10, 15, and 20 minutes (P < .05).
Potentiation
To determine whether muscle potentiation influenced the percentage increase in force with the DT protocol, we analyzed separately the least potentiated and most potentiated contractions of the 6 delivered before and after fatigue. Before fatigue the soleus peak torque increased only 10% from the first to the sixth contraction; however, the peak torque potentiated 30% immediately after fatigue and 60% by 20 minutes after fatigue. These findings support that the soleus showed greater potentiation as time after the fatigue protocol progressed. The percentage increase in nPT with the DT protocol was greater when the muscle was less potentiated as compared with when the muscle was more potentiated (P < .05 main effect; Figure 2B). The 20%, 38%, and 45% increases with the DT protocol, when the muscles were not potentiated, were greater than the 4%, 9%, and 13% increases at the 10-, 15-, and 20-minute postfatigue conditions, respectively, when the muscles were potentiated (P < .05; Figure 2B).
Torque–Time Integral
We examined the mean torque–time integral to capture those conditions when the peak torque was not sustained over the duration of the contraction (Figures 1C and 1F). Mean torque–time integral before, after, and at 5, 10, 15, and 20 minutes after the fatigue protocol was as follows: 55.6 ± 26.6, 17.88 ± 9.71, 33.1 ± 15.4, 35.6 ± 17.72, 33.9 ± 16.4, and 31.2 ± 15.5 N m, respectively, for the DT protocol; and 54.4 ± 23.4, 16.2 ± 8.4, 28.4 ± 11.1, 30.85 ± 12.8, 29.1 ± 12.94, and 26.45 ± 12.1 N m, respectively, for the CT protocol.
The nTTI was not different between the DT and CT protocols before fatigue (Figure 3A). At all times after fatigue, the DT protocol generated greater nTTI than the CT protocol (P < .05; Figure 3A). The DT protocol generated 13% ± 17%, 17% ± 15%, 18% ± 18%, 19% ± 15%, and 21% ± 16% greater nTTI at the immediate, 5-, 10-, 15-, and 20-minute postfatigue conditions, respectively. The increases in nTTI at 5, 10, 15 and 20 minutes with the DT protocol were greater than the increases at the pre- and immediate postfatigue conditions (2.5% and 13%; P < .05). The DT protocol, as compared with the CT protocol, became slightly more effective at generating nTTI at 15 and 20 minutes after fatigue. As indicated in Figures 1B, 1C, 1E, and 1F and supported by the summary statistics, the nPT was increased to a greater extent than the mean force (nTTI) by 15 and 20 minutes following the fatigue protocol.
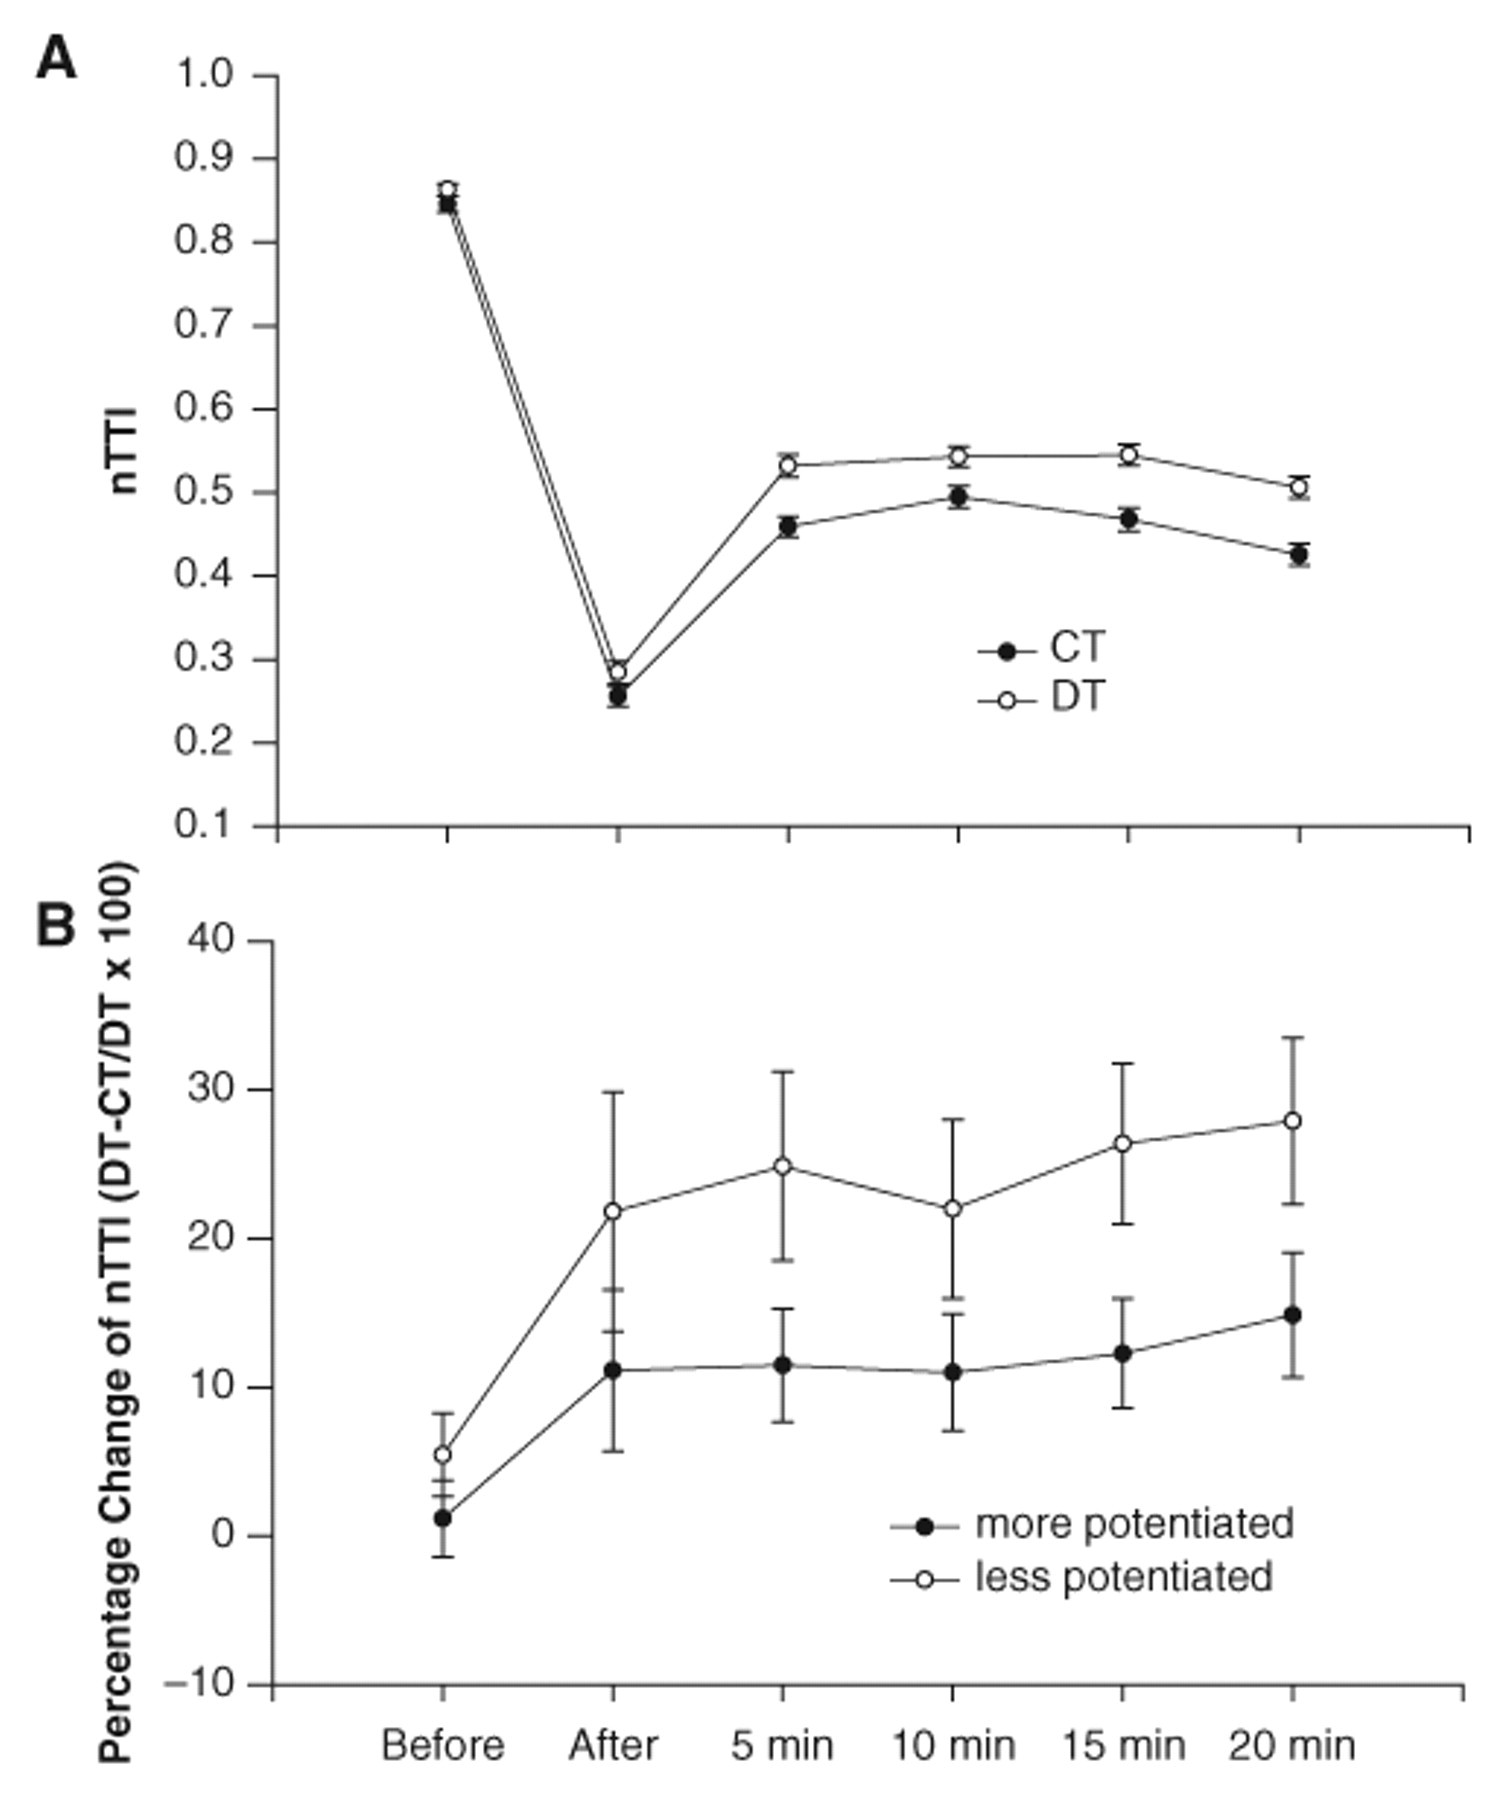
A, The mean (±SE) normalized torque–time integral (nTTI) for the doublet (DT) and constant frequency (CT) protocols before and at various times after the stimulation protocol for the pooled contractions (6 contractions). The nTTI for the DT protocol was greater than the CT protocol after fatigue and at 5, 10, 15, and 20 minutes (P < .05). The nTTI for the CT protocol was less at 20 minutes than at the 5, 10, and 15 minutes (P < .05). B, The mean (±SE) for the percentage change in nTTI between the DT and CT protocols for the more potentiated and less potentiated contractions (of the 6). The positive percentages support that the DT protocol was generally more effective than the CT protocol in the more and less potentiated conditions. The DT protocol, when the muscle was less potentiated, generated a greater mean torque than the DT protocol, when the muscle was more potentiated at 5, 10, 15, and 20 minutes (P < .05)
Potentiation
The percentage increase in nTTI with the DT protocol was greater when the muscle was less potentiated than when the muscle was more potentiated (P < .05 main effect). The 20% to 30% increases with the DT protocol when the muscles were less potentiated were greater than the 10% to 12% increases when the muscles were more potentiated (P < .05; Figure 3B). The percentage change in the nTTI was not different between the more and less potentiated conditions before and immediately after fatigue (Figure 3B).
Rate of Force Development
Maximum rate of torque development before, after, and at 5, 10, 15, and 20 minutes after the fatigue protocol was as follows: 383 ± 189, 93 ± 53, 254 ± 120, 344 ± 164, 375 ± 173, and 380 ± 178 N m/s, respectively, for the DT protocol; and 297 ± 140, 58 ± 30, 140 ± 54, 182 ± 70, 193 ± 87, and 178 ± 86 N m/s, respectively, for the CT protocol.
The nRTD was greater for the DT protocol than for the CT protocol before and at all times after fatigue (P < .05; Figure 4A). The DT protocol generated 42% ± 78%, 62% ± 52%, 87% ± 54%, 86% ± 55%, 101% ± 56%, and 128% ± 86% higher rates of torque development before, after, and 5, 10, 15, and 20 minutes postfatigue, respectively. The increases in nRTD at all times after fatigue with the DT protocol (60% to 128%) were greater than the increases before fatigue (42%; P < .05). The DT protocol, as compared with the CT protocol, became more effective during low-frequency fatigue at the longest time interval postfatigue (20 minutes greater than 5, 10, and 15 minutes; P < .05).
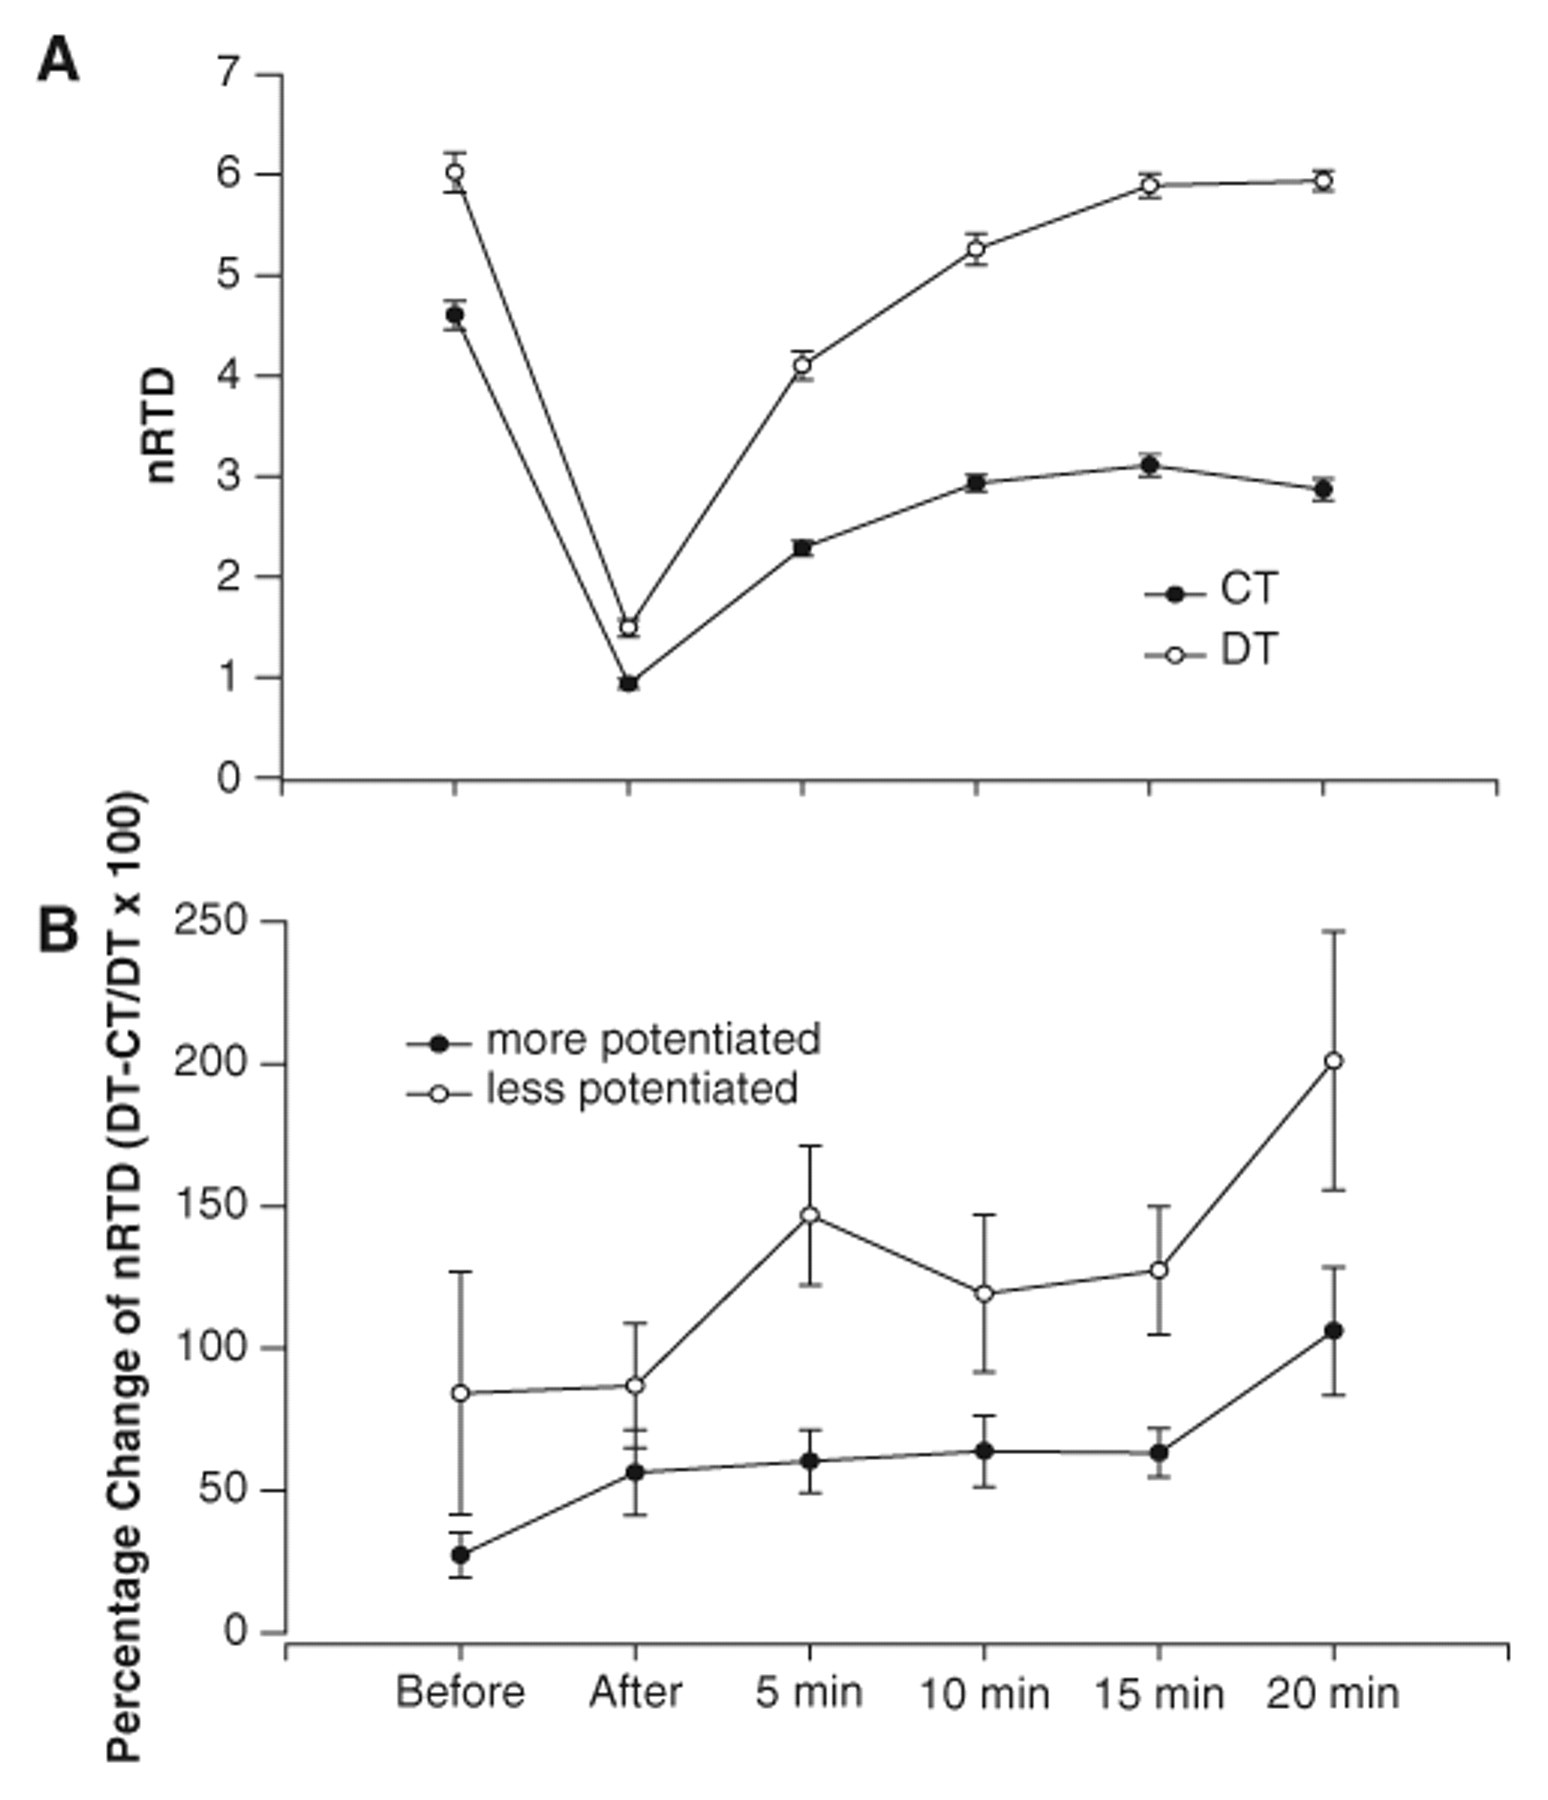
A, The mean (±SE) normalized rate of torque development (nRTD) for the doublet (DT) and constant frequency (CT) protocols before and at various times after the stimulation protocol for the pooled contractions (6 contractions). The nRTD for the DT protocol was greater than the CT protocol before and at all times after fatigue (P < .05). B, The mean (±SE) percentage change in nRTD between the DT and CT protocols for the more potentiated and less potentiated contractions (of the 6). The positive percentages support that the DT protocol was more effective than the CT protocol in both the more and less potentiated conditions. The DT protocol, when the muscle was less potentiated, generated torque faster than the DT protocol, when the muscle was more potentiated at before, 5, 10, 15, and 20 minutes (P < .05).
Potentiation
The percentage increase in nRTD with the DT protocol was greater when the muscle was less potentiated than when the muscle was more potentiated (P < .05 main effect). The 84% to 201% increases in nRTD with the DT protocol, when the muscles were less potentiated, were greater than the 27% to 106% increases in nRTD when the muscles were more potentiated (P < .05; Figure 4B). Thus, the nPT, nTTI, and nRTD all showed greater augmentation as time postfatigue proceeded (delayed onset fatigue) and if the muscle was in a less potentiated state.
Acute Versus Chronic
The percentage change between the doublet (DT) protocol and the constant (CT) protocol for all variables (nPT, nTTI, nRTD) was greater in the chronically paralyzed soleus than in the acutely paralyzed soleus before, immediately after, and after 5 minutes of recovery (P < .05; Figures 5A-5C). The percentage change progressively increased from before to after the stimulation protocol in the chronic group (before < after < 5 minutes; P < .05). In the acute subjects, the DT protocol caused no increase in nPT before (−0.8% ± 0.45%), after (−2.8% ± 0.2%), and 5 minutes following the stimulation protocol (−2.0 ± 0.4%; Figure 5A). The DT protocol also caused no increase in the nTTI before (−1.4% ± 0.13%), after (−1.9% ± 0.14%), and 5 minutes after the stimulation protocol (−1.3% ± 0.3%) in the acute subjects (Figure 5B). The DT protocol caused a significant increase in the nRTD before (13.8% ± 1.4%), after (22.2% ± 0.5%), and 5 minutes after the stimulation protocol (18.2% ± 1.2%) as compared with the CT protocol in the acutely paralyzed group (P < .05; Figure 5C). However, the increase in nRTD was still less in the acute group than in the chronically paralyzed group (P < .05; Figure 5C). The acutely paralyzed group showed no significant potentiation before or after the stimulation protocol. Conversely, the chronically paralyzed group showed an average of 5%, 6%, 40%, 58%, and 60% potentiation in nPT before, after, 5, 10, 15, and 20 minutes, respectively.
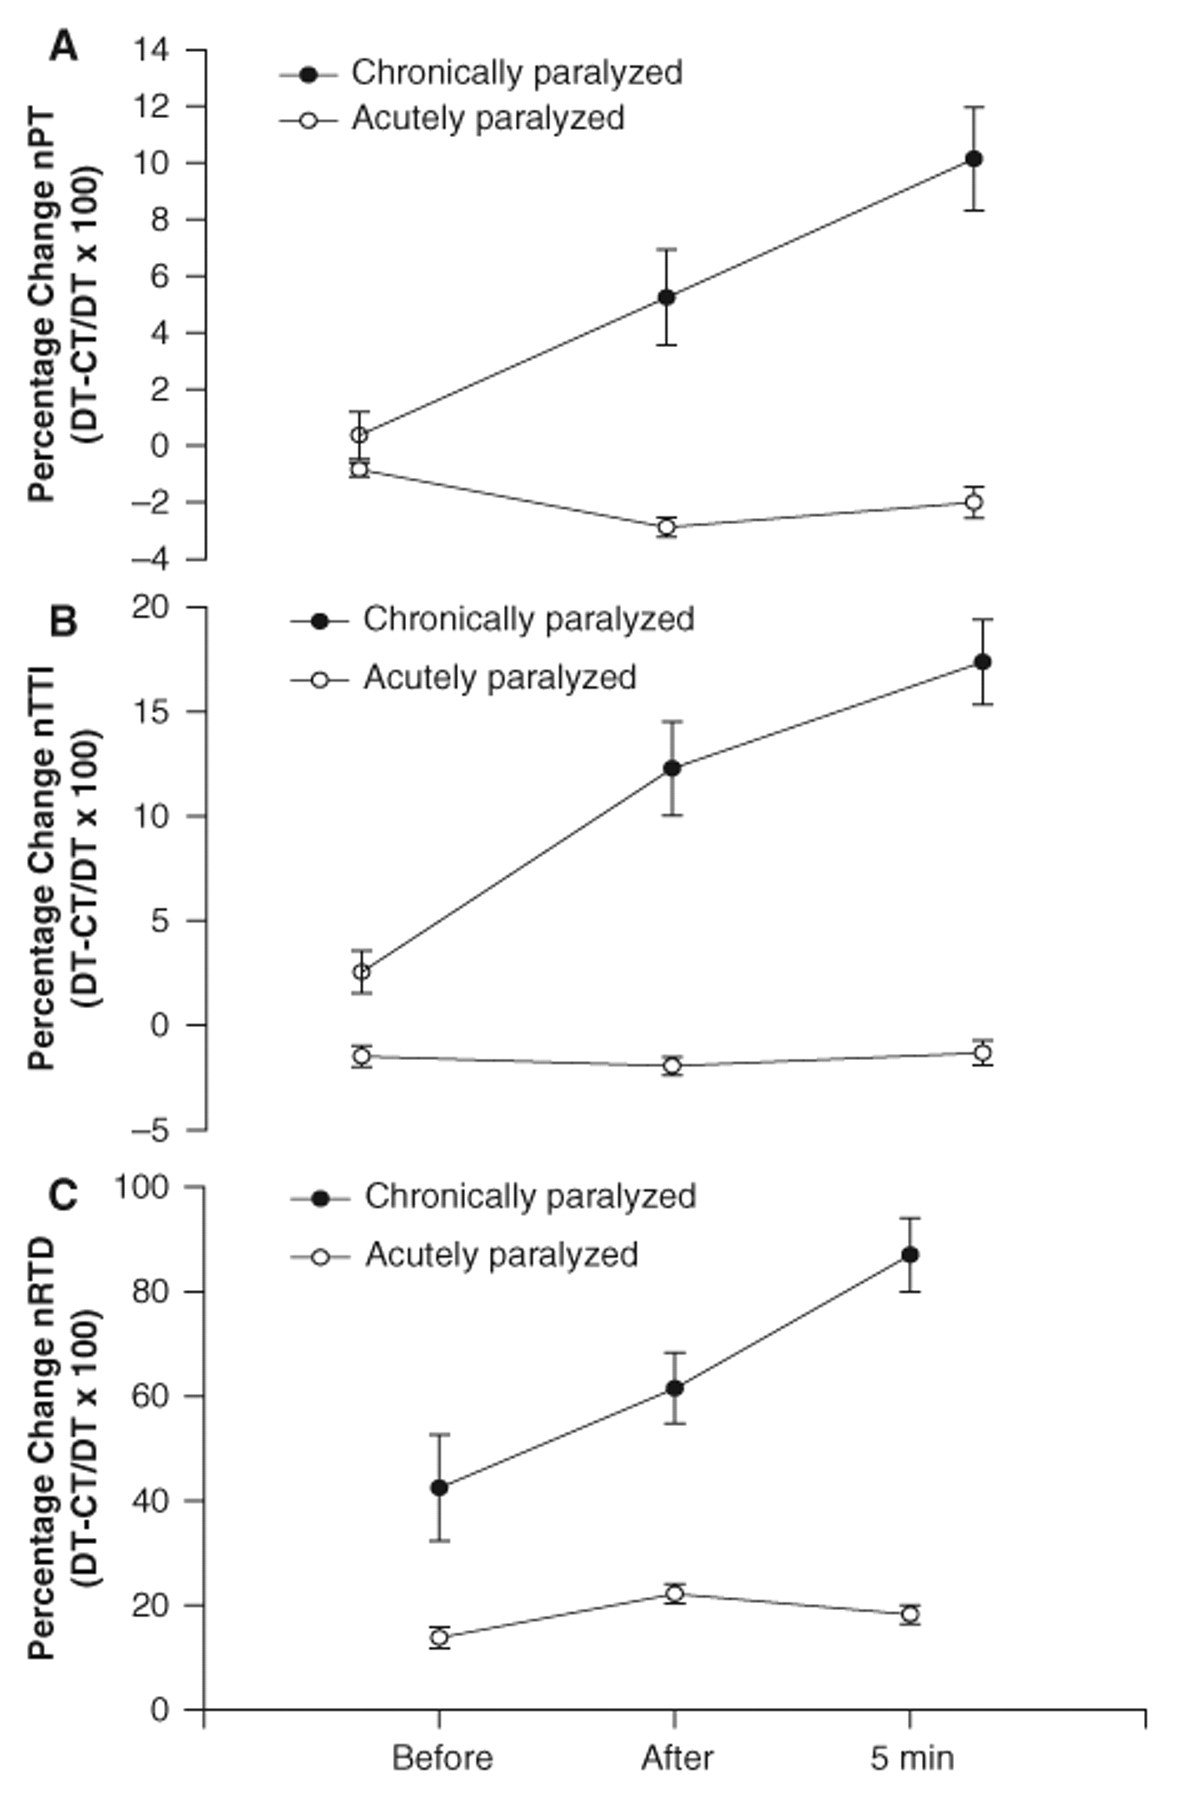
The mean (±SE) percentage change for (A) normalized peak torque (nPT); (B) normalized torque–time integral (nTTI); and (C) normalized rate of torque development (nRTD), for the acutely and chronically paralyzed soleus before, after, and 5 minutes postrepetitive stimulation. The data are pooled across all 6 contractions at each time. The percentage increase in the nPT, nTTI, and nRTD was greater with the doublet (DT) protocol for all times in the chronically paralyzed group compared with the acutely paralyzed group (P < .05). The percentage change for all measurements (nPT, nTTI, and nRTD) across time was progressively increased for the chronically paralyzed group such that 5 minutes post > immediately after > before the stimulation protocol (P < .05).
Discussion
The purpose of the study was to examine the effects of doublet train activation on paralyzed muscle before fatigue, at various times after fatigue, and while the muscles were at different levels of potentiation. The major findings of this study were that (a) the doublet protocol caused significant enhancement of the peak muscle torque, mean torque–time integral, and the rate of torque development in the chronically paralyzed soleus muscle; (b) the peak torque, mean torque–time integral, and rate enhancements were most prominent during later stages of recovery (low-frequency fatigue); (c) the torque and rate enhancements were greatest when the muscles were less potentiated; and (d) the acutely paralyzed muscles were less fatigable and showed less force and rate enhancement than the chronically paralyzed muscles.
The doublet torque enhancement observed in this study cannot be attributed to the recruitment of additional muscle fibers because the tibial nerve was activated supramaximally in this study. In addition, the limited torque enhancement immediately after fatigue is not attributed to neuromuscular transmission compromise 38,39 because the doublet effectively increased the rate of torque development immediately after fatigue and the M-wave indicated no deficit in transmission. Therefore, the effectiveness of the DT protocol is likely related to calcium-mediated systems. This concept is supported by our previous work, which established that the entire force–frequency curve shifts to the right during recovery (low-frequency fatigue) from the same fatiguing protocol used in this study. 23 Thus, a higher stimulation frequency is necessary to obtain the same relative torque from the paralyzed soleus muscle during low-frequency fatigue. The brief doublet used in this study may provide a means to shift the force–frequency curve back to the left during low-frequency fatigue. 41
Possible Physiological Mechanisms
The present results in chronically paralyzed muscle suggest that various forms of muscle activation evoke processes that exert their maximum effect at different times during fatigue and recovery. We propose that 3 processes, which are primary properties of fast fatigable muscle, 22 strongly influence doublet force enhancement in chronically paralyzed muscle: contractile filament fatigue, low-frequency fatigue, and potentiation.
The first process, contractile filament fatigue, relates to the buildup of metabolites during the repetitive stimulation protocol. Large changes in intramuscular concentrations of hydrogen and phosphate ions decrease calcium sensitivity and the maximum force output of the contractile filaments. 30,42 This process is thought to recover within minutes of the stimulation protocol. 43 In the present study, immediately after the fatiguing stimulation, the DT protocol was least effective at enhancing the peak torque, torque–time integral, or rate of torque development. Thus, it would appear that contractile filament fatigue rendered doublet activation less effective early after the protocol than during various times of recovery. However, it should also be noted that immediately after the fatiguing protocol, the contractile speeds are slowed, 4,39 which would cause the muscle to be “more fused” at the 15-Hz frequency. The more fused the tetanus, the smaller the relative increase in force by doublets. 44 Within a few minutes following the fatigue protocol the muscle speed properties recover but torque remains depressed 39 and the doublet begins to become more effective.
The acutely paralyzed soleus, with known slower resting contractile speeds and greater fatigue resistance, 4,6 showed no increase in torque with the DT protocol at any time before or after the stimulation protocol. Previous reports have noted a similar ineffectiveness of doublet stimulation in activated acutely paralyzed muscle. 20 Thus, both fatigue and the contractile speed (relative muscle fusion) appear to contribute to the effectiveness of doublet activation. In accord with previous reports in nonparalyzed muscle, 45,46 the efficacy of doublet stimulation was minimal until the onset of fatigue.
The second process influencing doublet enhancement is low-frequency fatigue. 25 By 5 to 10 minutes after fatigue, the metabolite buildup is known to normalize, but prolonged depression in muscle force remains. Excitation–contraction coupling compromise, which involves a decrease in the amount of calcium released per impulse, has been implicated, 31 but the underlying mechanism causing prolonged depression of calcium release is unknown. 47,48 The DT protocol caused progressively greater increments in all torque variables (nPT, nTTI, nRTD) from 5 to 20 minutes of recovery for the chronically paralyzed group. This finding suggests that as the extent of low-frequency fatigue increased and as excitation–contraction coupling compromise increased, the doublet activation became more effective. Because the acutely paralyzed muscle experiences virtually no low-frequency fatigue 24 and displayed greater within-train fusion, the DT protocol was no different from the CT protocol in augmenting torque at 5 minutes of recovery. The DT protocol was, however, effective at increasing the rate of torque development (18%) suggesting that the extra pulse enhanced the rate at which calcium was released. Previous investigators have noted a similar enhancement of rate of torque development because of doublet stimulation in able-bodied 45 and paralyzed muscle. 20
Potentiation, the third process influencing doublet enhancement, is characterized by the enhancement of muscle force following previous repetitive activation. The present report concurs with our previous findings 24 that chronically paralyzed muscle demonstrates robust postfatigue potentiation but acutely paralyzed muscle does not. One physiological mechanism commonly used to explain potentiation is myosin light chain phosphorylation, in which the number of attached cross bridges increases at submaximal calcium concentrations. 49,50 The fact that the force enhancing effects of phosphorylation are greatest at low calcium concentrations is consistent with our observation that the potentiation observed within 6 test contractions was always greatest at 20 minutes of recovery, when the chronically paralyzed soleus portrays the greatest low-frequency fatigue. 23 Before the fatigue protocol, the torque potentiated less than 10% within the 6 test contractions. However, by 20 minutes after fatigue (low-frequency fatigue), the torque potentiated nearly 60% and likely was not fully potentiated by the sixth contraction. Indeed, we have previously observed that as many as 15 contractions may be necessary for full potentiation of torque. 24 Accordingly, we are unable to ascertain the effectiveness of doublet activation when the soleus was completely potentiated. However, at 5 minutes the chronically paralyzed soleus was nearly always fully potentiated by the sixth contraction, yet showed enhancements in all 3 measurements (nPT, nTTI, nRTD). Although doublet torque enhancement is greatest when the muscle is less potentiated and likely shares several mechanisms with potentiation, the precise interaction among the physiological processes that contribute to doublet torque enhancement and muscle potentiation remains uncertain. 51 When subjects began a soleus stimulation program shortly after SCI and continued training for >2 years, the soleus fatigue and potentiation characteristics were held near acute SCI levels. 24 Trained paralyzed muscle responded to stimulation in a much more predictable fashion (less fatigue, less potentiation) than untrained muscle, which may have important ramifications for the use of functional electrical stimulation in rehabilitation.
Mechanisms Underlying Doublet Effects on Torque
Three processes have been suggested to contribute to torque changes with doublet activation: (a) increase in muscle stiffness, (b) effects on excitation–contraction coupling, and (c) cross bridge dynamics. Parmiggiani and Stein 12 suggested that the first stimulus of a doublet overcame series elasticity so that subsequent stimuli could facilitate the transmission of force. However, that cannot explain the enhanced torque that occurred after fatigue. Duchateau and Hainaut 52 showed that force enhancement from doublet activation of barnacle muscle was most pronounced under conditions of excitation-contraction coupling compromise, and that cytosolic calcium concentrations increased with the second pulse. The present results confirm previous reports and reinforce our hypothesis that chronic reduced activity of the soleus accentuates the effects of doublet activation, as would be expected in fast fatigable muscle.
Functional Implications
Contemporary rehabilitation strategies strive to maintain the musculoskeletal properties of the paralyzed extremities following SCI. 5,6,24,53 Skeletal muscle is ideally suited to provide repetitive forces to the paralyzed extremities; however, the dilemma facing rehabilitation specialists is that paralyzed muscle atrophies and becomes highly fatigable within the first year following paralysis. Electrical stimulation strategies (such as doublets) that overcome the various mechanisms of muscle fatigue will help challenge the paralyzed muscle during electrical stimulation training.
Summary
This study showed that the effects of doublet activation on peak torque, mean torque–time integral, and rate of torque development are influenced by low-frequency fatigue and muscle force potentiation in the soleus muscle of individuals with long-standing paralysis. These results support the theory that doublet activation has some capacity to overcome the compromising effects of repetitive low-frequency activation (15 Hz) in functionally fast chronically paralyzed muscle. These findings may assist clinicians in determining optimal methods to train the muscle properties associated with chronic reduced activity.
Footnotes
Acknowledgements
The authors thank Shauna Dudley-Javoroski for editorial comments on this article.
The author(s) declared no conflicts of interest with respect to the authorship and/or publication of this article.
The author(s) disclosed receipt of the following financial support for the research and/or authorship of this article: Awards from the NIH (R01-NR010285, R01-HD062507) and the Neilsen Foundation supported this work.