
Abstract
Background. After hemiparetic stroke, coordination of the shoulder flexor and elbow extensor muscles during a reaching movement is impaired and contributes to poor performance. Objective. The aim was to determine whether functional coupling between electromyographic signals of synergist muscles during reaching was weakened in stroke patients who had poor motor coordination. Methods. Surface electromyography (EMG) from the anterior deltoid, triceps brachii, biceps brachii, pectoralis major, supraspinatus, and latissimus dorsi of the affected upper limb in 11 stroke patients (mean Fugl-Meyer upper extremity score 27 ± 8) and in the dominant arm of 8 healthy controls were measured. Results. Coherence between the EMG of the anterior deltoid and triceps brachii, 2 synergists for reaching, was lower in patients compared with controls, in the 0- to 11-Hz range. Detailed segmented frequency-range analysis indicated significant differences in the coherence between groups in 0- to 3.9-Hz and 4- to 7.9-Hz ranges. Conclusions. This weakened functional coupling may contribute to poor reaching performance and could be a consequence of a loss of common drive at the frequency bands as a result of interruption of information flow in the corticospinal pathway.
Introduction
Coordination of movement reflects a complex interaction between behavioral goals, neural function, and musculo-skeletal apparatus. 1 This complexity is exemplified by a close association of function among a group of synergists. For example, a smooth reaching movement is a result of coordinating activities of shoulder flexors, elbow extensors, and posture-supporting muscles. Any loss of neural function from a stroke, may affect a patient’s ability to initiate movement, coordinate participating muscles, and use feedback information from sensory systems. Consequently, movement accuracy, especially that involving movements at multiple joints, is compromised. 2
In stroke patients, coordination of the shoulder flexor and elbow extensor muscles during reaching is impaired, which contributes to poor performance. 3 Factors that may contribute to poor coordination in reaching after stroke include abnormal muscle activation patterns, 4 disruption of recruitment/derecruitment of agonist/antagonist muscles, 5 reduced number of available upper limb synergies, 4 antagonist hyperactivity, 6 altered intersegmental dynamics, 7 impaired sensation, 8 spasticity, 9,10 muscle weakness, 11,12 altered organization of cortical representation after stroke, 13 and weakened functional coupling (FC) between the brain and muscle or among the synergists. 14 Whereas weakened corticomuscular FC has been found in stroke, 14 FC between synergist muscles has not been reported in the patient population. Based on the frequent observations of poor synergist coordination in stroke 9 and reduction of common motoneuronal drive, 15,16 we hypothesized that FC between the shoulder flexor and elbow extensor, 2 primary synergists in upper extremity reaching, would be weakened after stroke. FC in this context was defined as synchronization between 2 electromyography (EMG) signals in frequency domain and measured by coherence between the 2 signals. We tested this hypothesis by computing EMG–EMG coherence of the synergists in frequency domain. We expected that the findings of this study would facilitate current understanding of the common drive to synergist muscles in controlling a motor task and the effect of stroke on the drive.
Methods
Subjects
A total of 11 stroke patients (mean age ± SD = 62.7.6 ± 11.2 years; time since stroke = 39.4 ± 27.7 months; mean Fugl-Meyer score, 27.3 ± 7.9, 2 women; Table 1) and 8 healthy controls (mean age ± SD = 60.6 ± 6.3 years, 3 women) with no known neurological disorders or other conditions that would influence sensorimotor performance participated in the study. The study was approved by the Institutional Review Board of the Cleveland VA Medical Center and conducted according to the Declaration of Helsinki. All subjects gave informed consent prior to participation.
Demographic and Clinical Data of the Stroke Participants
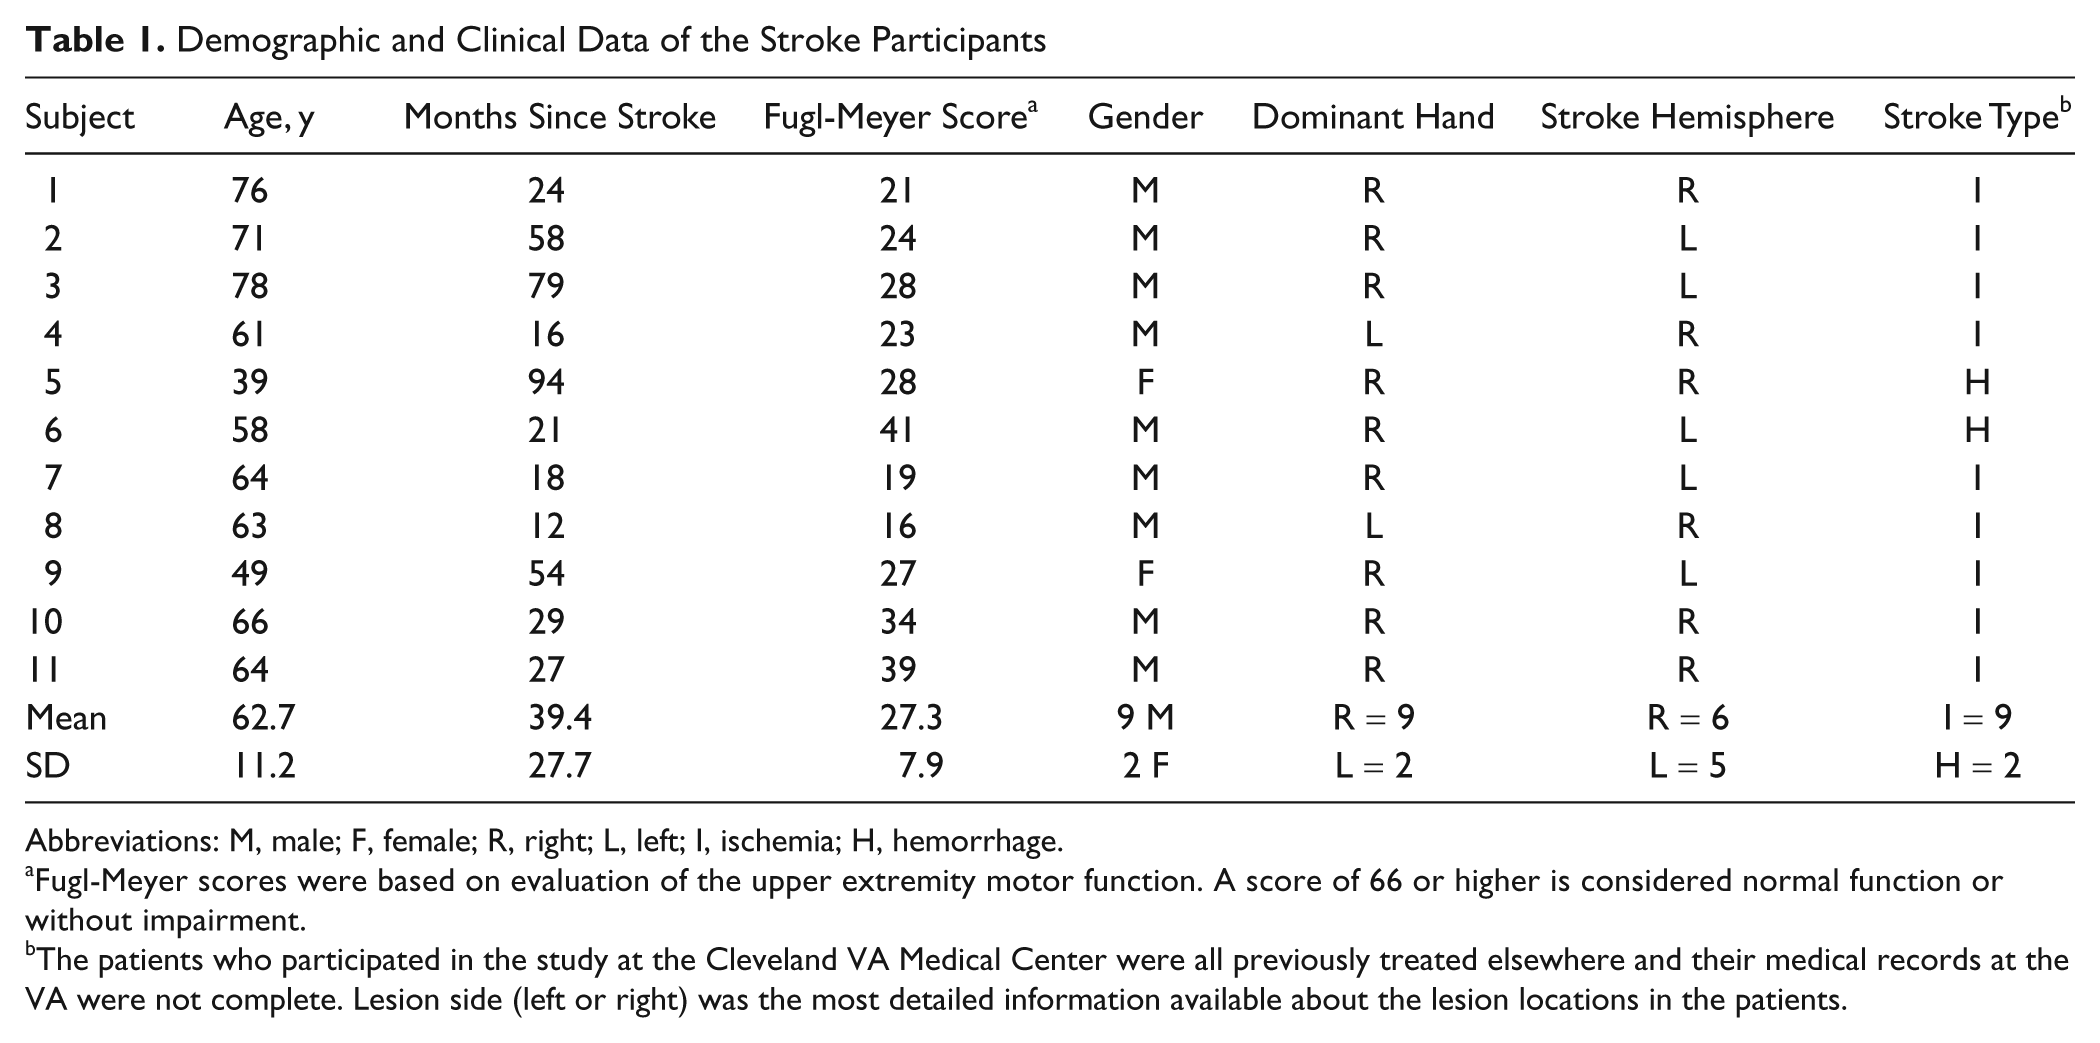
Abbreviations: M, male; F, female; R, right; L, left; I, ischemia; H, hemorrhage.
Fugl-Meyer scores were based on evaluation of the upper extremity motor function. A score of 66 or higher is considered normal function or without impairment.
The patients who participated in the study at the Cleveland VA Medical Center were all previously treated elsewhere and their medical records at the VA were not complete. Lesion side (left or right) was the most detailed information available about the lesion locations in the patients.
Apparatus and Experimental Procedure
A deactivated shoulder/elbow robot (ie, no assistance or resistance was offered; InMotion2, Interactive Motion Technologies, Inc, Cambridge, Massachusetts) was used to support the subject’s forearm and hand, standardize the shoulder/elbow reaching task on a horizontal plane and acquire kinematics data (Figure 1). 17 The apparatus restrained movements of the fingers and wrist joints to allow only shoulder and elbow joint movements. The subject’s forearm was fixed onto a supporting apparatus attached to the robotic arm so that the movement could be made without requiring active gripping of the handle with the fingers (Figure 1). The subject’s hand rested on the handle and was placed at the center of the workspace (CWS, fixed for every subject, Figure 1). A target was displayed on a 15-in. LCD screen; reaching the target by the subjects hand required a 14-cm accurate movement in the horizontal plane. Subjects moved the affected (patients) or dominant (controls) hand from the CWS to the target directly away from the subject by flexing the shoulder and extending the elbow joints (reaching phase). Subjects maintained the target position (holding phase) for 1 second before being moved back to the CWS. Before the experiment began, all subjects were instructed to move the hand from the CWS to the target in a straight path in ~1.5 seconds to avoid potential speed effect on the outcome measurement and hold for 1 second at the target position. They had opportunities to practice the movement before data collection. During the experiment, visual feedback of performance during each trial was provided (Figure 1). An experimenter helped patients move the hand back to the CWS after the holding phase in each trial. All stroke subjects were able to reach the target. Five sets of 10 repetitions were performed with a 2-minute rest between sets (each intertrial interval was about 20 seconds). The major reason to perform 50 trials was to obtain movement-related cortical potentials using triggered averaging of the multitrial electroencephalographic (EEG) signals. 18
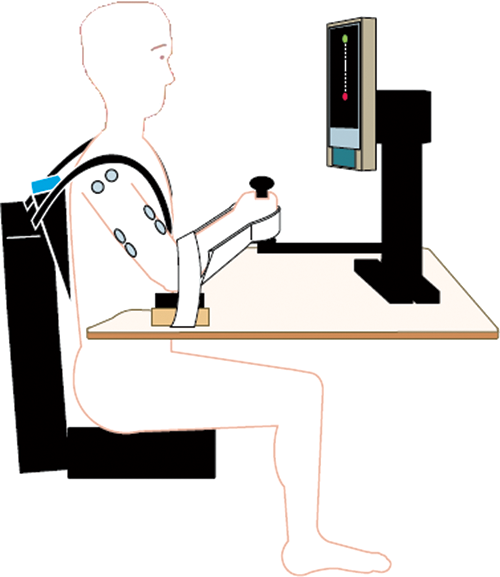
Illustration of the experimental setup, in which the subject sat and was ready to make a reach movement. The upper limb was attached to a robotic arm and the movement destination (target) was displayed on a monitor in front of the subject. Surface electromyogram of the relevant muscles, exerted force in the forward–backward direction, and positions of the elbow joint were measured.
EMG Recording
EMG electrodes were located on the muscle belly oriented parallel to the length of the fibers. EMG electrodes were placed on the lateral head of the triceps brachii (TB), biceps brachii (BB), anterior deltoid (ATD), pectoralis major (PM), supraspinatus (SS), and latissimus dorsi (LD) of the affected limb in patients (regardless of whether the lesion was on the left or right side) and dominant limb in controls. Two Ag/AgCl electrodes (8 mm recording area) were placed on the skin overlying each of the muscles with an interelectrode space of ~3 cm. A reference electrode was applied on top of the lateral epicondyle near the elbow. The EMG signals were amplified (1000×), filtered (1-500 Hz) using Grass Neurodata amplifiers (Astro-Med, Inc, West Warwick, Rhode Island), and digitized (1000 samples/s) using Spike2 data acquisition system (CED, Cambridge, UK). EMG signals were rectified before further processing for greater accuracy of coherence measurements. 19 Rectification of EMG changes power spectrum of the signal but does not alter the coherence value with another signal. 19 Compared with conditions without rectification, the rectification only makes the coherence peak(s) clearer with fewer artifacts. 19
Motor Performance
The robotic system acquired force and position data (200 samples/s) during the reaching and holding phases. The position (of the robotic arm on which the subject’s arm was attached) was measured by a built-in, precision potentiometer (0.9 kΩ/rad). Position data were used to determine subjects’ ability to maintain desired movement trajectory to target. The movement trajectory maintenance was defined as the mean lateral deviation from the desired movement path as
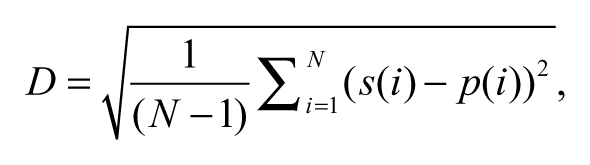
where D is the lateral deviation, N is the total number of samples, s(i) is the coordinate of the hand position of the subject at the ith sample, p(i) is the orthogonal projection of s(i) onto the desired movement trajectory (Figure 2). 18 The precision of following the desired movement path results in smaller lateral deviation. The force applied by subject during reaching was measured in the forward/backward direction by a built-in load cell within the system. Force variability was also evaluated to assess the quality of the force profile. It was quantified by calculating coefficient of variation (SD of the exerted force/mean force). The peak force and mean force were quantified as well.
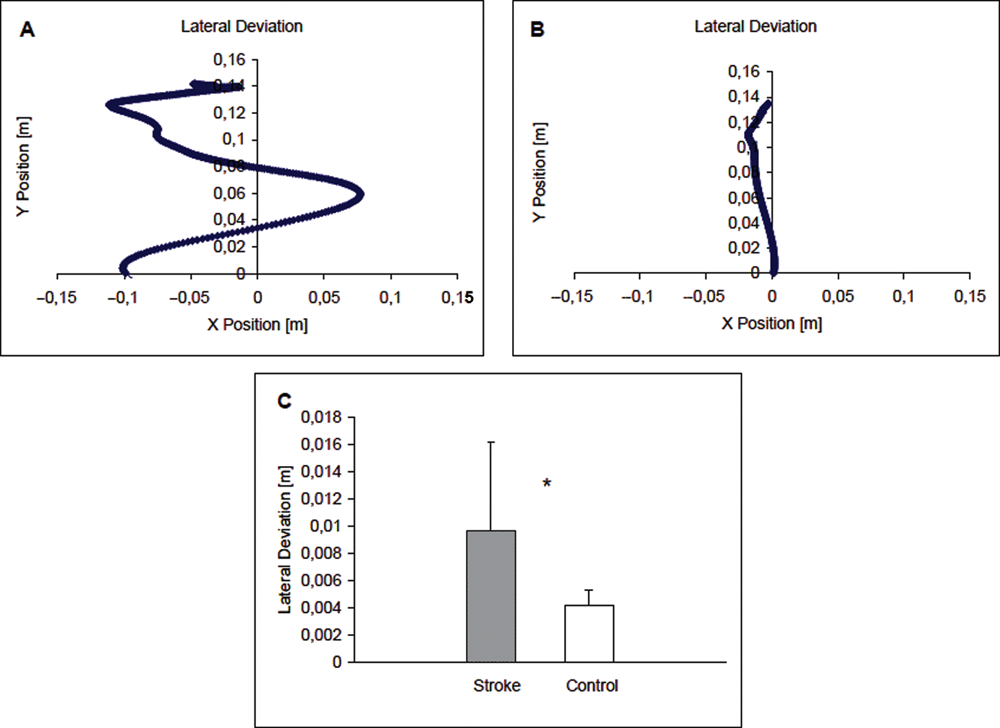
Reaching path of a stroke patient who exhibited large lateral deviation (A) and a control subject (B). Group results of lateral deviation (mean ± standard deviation) are presented in C. The patient group exhibited significantly greater lateral deviation (P ≤ .05) than the controls during the reaching movement. The movement started at (0, 0) point and the reaching task was performed along the Y-axis direction. The patient reaching path (A) did not start at the original (0, 0) location because the path drawing began with the first data point showing movement on the Y-axis. The patient’s hand involuntarily moved to the left (−0.1, 0) immediately after the experimenter released his hand.
Data Processing
Coherence was calculated between EMGs of these muscle pairs: ATD and TB, ATD and PM, ATD and SS, ATD and LD, TB and BB, PM and SS, and PM and TB in the frequency range 0 to 250 Hz. Because muscle pairs other than the anterior deltoid–triceps pair are not directly involved in reaching, we expected only the anterior deltoid–triceps pair to show impairment in functional coupling (coherence) during reaching. We analyzed the other 6 muscle pairs as internal controls in each group. The EMG recordings from each of these muscles were cropped into a 10-second window for each trial, 5 seconds before and 5 seconds after the movement onset (the time when the change of elbow joint angle was detected by the potentiometer). The 10-second window included reaching and holding phases.
A bivariate autoregressive model was applied to the EMG signals, and coefficients were derived by ARfit Matlab software. 20 An order of 4 was chosen for the model based on Schwarz Bayesian criterion. 8 Autospectrum and cross-spectrum of EMG signals from each muscle pair were calculated from the model coefficients in each trial and then averaged across trials. The coherence was obtained from the normalization of the cross-spectrum:
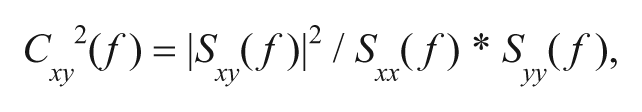
where Sxx (f) and Syy (f) are autospectrums of the EMG signals (x, y) of the 2 muscles, for a given frequency f, and Sxy (f) is the cross-spectrum between them. A short-term moving average Boxcar window was applied during the calculation with a window length of 512 points and overlap of 128 points. Dynamic coherence was calculated in time–frequency domain in frequency ranges of 0 to 25 Hz (frequency resolution = 0.098 Hz; time resolution = 400 ms) and 25 to 250 Hz (frequency resolution = 0.88 Hz; time resolution = 400 ms). Subsequently, coherence was analyzed for all trials in each subject during the reaching and holding phases. The beginning of the reaching phase for each subject was movement onset. The end of the reaching phase was defined as the time when the hand arrived to the target. The holding phase, during which subjects maintained the hand on target, was from the time when the subject’s hand rested on the target to the point when the hand was moved back to the CWS. No changes of elbow joint angle were detected during the holding phase. Subjects performed reaching movements, which could introduce artifacts into the EMG signals; coherence between ATD and TB EMGs was analyzed during the holding phase after significant EMG coherence in this muscle pair was detected (see below).
Amplitude and Timing Analyses of the EMG
Two time-domain EMG analyses were performed. The first focused on timing of the 2 prime mover muscles (ATD and TB) and the second determined EMG amplitude (root mean square, RMS) of the 2 muscles during reaching phase. RMS of the ATD and TB EMGs during reaching was calculated, and an average value of 5 trials in each subject was taken. Absolute RMS values were used because EMG during maximal voluntary contraction in stroke is often not an accurate reflection of the maximal volitional muscle activation. 21 Raw EMG signals were visually inspected and the prereaching baseline as well as steady portion of EMG during reaching were identified. EMG onset was visually defined as the first appearance of motor unit action potentials, 22 and the time was marked by a vertical cursor (with 1-ms resolution). 23 The onset times were averaged across the 5 trials for each subject and group. Muscle onset time was expressed relative to movement onset time.
Statistical Analysis
The bootstrap critical value of coherence was calculated at the significance level of .05. 8 Each pixel (representing a coherence value in 400 ms and 0.098 Hz at the 0-25 Hz range and in 400 ms and 0.88 Hz at the 25-250 Hz range) on the time–frequency coherence map with the coherence value higher than the critical value was marked as 1 and lower than the critical value as 0.
Results from a 2-sample t test indicated that significant differences between patient and control groups were observed only in the ATD-TB coherence at frequency band of 0 to 25 Hz. To determine whether the coherence was frequency dependent within this range, more detailed analysis between the EMG signals (Coh ATD-TB) was performed in 4 nonoverlapping frequency bands of 0 to 3.9 Hz (delta band), 4 to 7.9 Hz (theta band), 8 to 12.9 Hz (alpha band), and 13 to 25 Hz (beta band) during the reaching and holding phases.
A repeated-measure general linear model was adopted for the Coh ATD-TB comparisons between frequency bands and time segments during reaching and holding phases between groups using SPSS. Independent t tests were employed to compare between-group differences in the amplitude and onset time of EMG for the ATD and TB muscles, the lateral deviation of movement trajectory, force variability, and mean and peak forces. The data are reported as mean ± SD. Pearson correlation between the coherence showing a significant group difference (0-7.9 Hz) and motor performance was analyzed to determine the relationship between the EMG–EMG coherence and performance parameters of the motor task.
Results
Motor Performance
Stroke patients exhibited poor motor performance compared with healthy controls, based on the measurement of lateral deviation of the movement trajectory. Figure 2 shows a movement profile during reaching of a patient (A) and control subject (B). The value of lateral deviation was significantly greater for patients compared with controls (P < .05, Figure 2C). The stroke patients took 1.53 ± 0.30 seconds (from movement initiation to hitting the target) to complete reaching whereas the controls required 1.25 ± 0.44 seconds (P > .10). There was no significant difference (P > .05) for patients (0.10 ± 0.02 m/s) versus control (0.12 ± 0.04 m/s, P = .061) in speed of reaching.
No significant differences were observed for force measures between groups. The mean force was 0.46 ± 0.27 N in patients and 0.32 ± 0.09 N in controls (P > .05). Peak forces in patients and controls were 1.63 ± 0.81 and 1.89 ± 0.51 N, respectively (P > .05), and the force variability (coefficient of variation of the mean force) was 2.73 ± 2.64 N in patients and 1.95 ± 0.64 N in controls (P > .05).
Coherence Between Muscle EMG Signals
EMG coherences among all muscle pairs were analyzed, and it indicated that only the ATD and TB, the 2 synergist muscles for the reaching movement, exhibited a significant difference in EMG coherence between groups at frequency band of 0 to 25 Hz (P < .05). Figure 3 shows the Coh ATD-TB in time–frequency domain for stroke patients (A) and control subjects (B). The color bar on the right indicates the level of coherence. Because the time used to reach the target was different among the subjects, time (X-axis) is expressed as relative values (percentage reaching time) for the reaching phase in Figure 3. The figure shows, in general, the level of coherence was lower in patients with stroke than in controls. Specifically, patients had significantly lower Coh ATD-TB in the frequency ranges of 6.15 to 10.55 Hz at ~30% of the reaching time (P < .05), and 0 to 1.17 Hz at ~50% of the reaching (P < .05). At ~70% of the reaching time, patients had significantly lower Coh ATD-TB at the frequency band of 3.81 to 10.64 Hz (P < .05). At the end of the reaching phase, a significant Coh ATD-TB difference between patients and controls was observed in the frequency range from 0 to 5.57 Hz (P < .05). During the holding phase, patients had significantly lower Coh ATD-TB in the frequency range of 0 to 11.43 Hz (Figure 3). The data suggest that weakening of FC between ATD and TB electrical activities are time and frequency dependent (Figure 3).
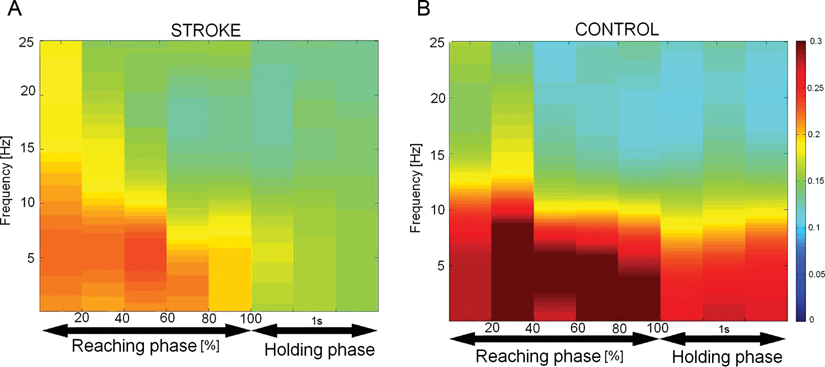
EMG–EMG coherence of the anterior deltoid and triceps brachii in time–frequency domain for the stroke group (A) and control subjects (B). The color bar on the right indicates the level of the coherence. Relative times (%) of the reaching phase and 1-second holding phase are indicated on the X-axis and frequencies are illustrated on the Y-axis. The coherence value of a given pixel (400 ms and 0.98 Hz) was considered statistically significant when the coherence coefficient was >0.0786 (P ≤ .05). Time 0 in A and B shows beginning of the reaching. The level of coherence between EMGs of the 2 synergist muscles was significantly higher in both the reaching and holding phases in the frequency range of 0 to 11 Hz.
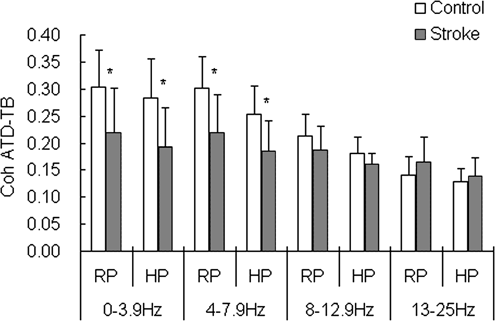
When the matrix of coherence coefficients was divided into nonoverlapping frequency segments (0-3.9, 4-7.9, 8-12.9, and 13-25 Hz), there were significant differences between the groups in Coh ATD-TB at frequency bands 0 to 3.9 and 4.0 to 7.9 Hz (P < .05) from 40% reaching time but not at 8 to 12.9 and 13 to 25 Hz (P > .05; Figure 4). Again, coherence weakening in stroke between the muscles was time and frequency dependent (Figure 4). The difference in Coh ATD-TB was greater at the frequency bands of 0 to 3.9 and 4 to 7.9 Hz versus 8 to 12.9 and 13 to 25 Hz at some time points versus others (eg, 40% vs 20%) during reaching and holding phases between the groups (P < .05; Figure 4).
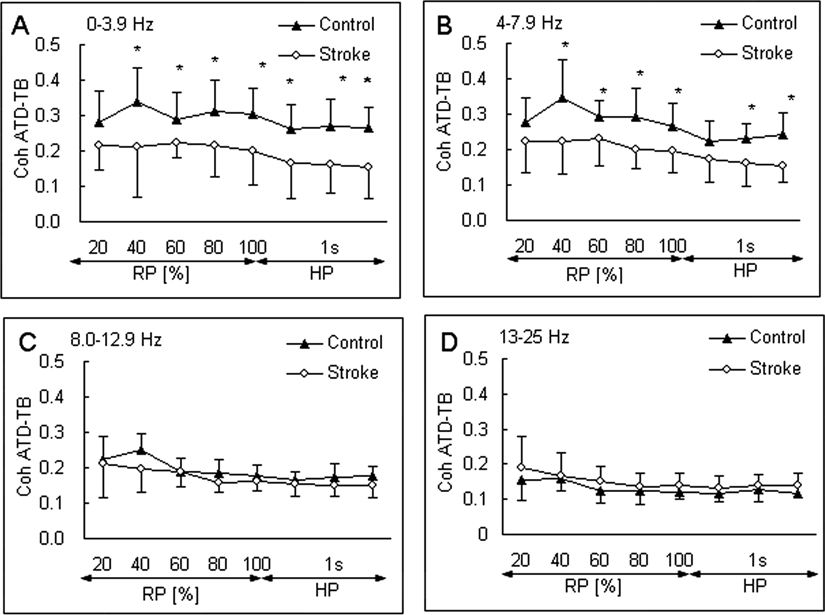
Mean and standard deviation of the EMG–EMG coherence of the anterior deltoid and triceps brachii (Coh ATD-TB) during reaching phase (RP) and holding phase (HP) at 4 segmented frequency ranges: 0.0 to 3.9 Hz (A), 4.0 to 7.9 Hz (B), 8.0 to 12.9 Hz (C), and 13.0 to 25.0 Hz (D) for stroke patients (open circles) and control subjects (filled triangles). Asterisk indicates significant differences between the stroke and control groups at P ≤ .05. The coherence was lower in stroke than controls at all time points except the 20% time during reaching in frequency range of 0 to 3.9 Hz, and 20% time during reaching and beginning time during holding in the 4- to 7.9-Hz range. No group differences in the coherence were detected in the frequency ranges of 8 to 12.9 and 13 to 25 Hz.
Relationship Between Performance Parameters and Coh ATD-TB
Significant negative correlation was observed between lateral deviation and Coh ATD-TB in controls at frequency bands of 0 to 3.9 Hz and 4 to 7.9 Hz. No such correlation was seen in patients (Table 2). The Coh ATD-TB correlation with speed of movement, mean and peak forces, and force variation was not significant in either group at the frequency bands (Table 2).
Correlation Coefficients Between the Coh ATD-TB in Frequency Ranges of 0.0 to 3.9 and 4.0 to 7.9 Hz in Which Significant Between-Group Coherence Differences Were Detected and Performance Parameters
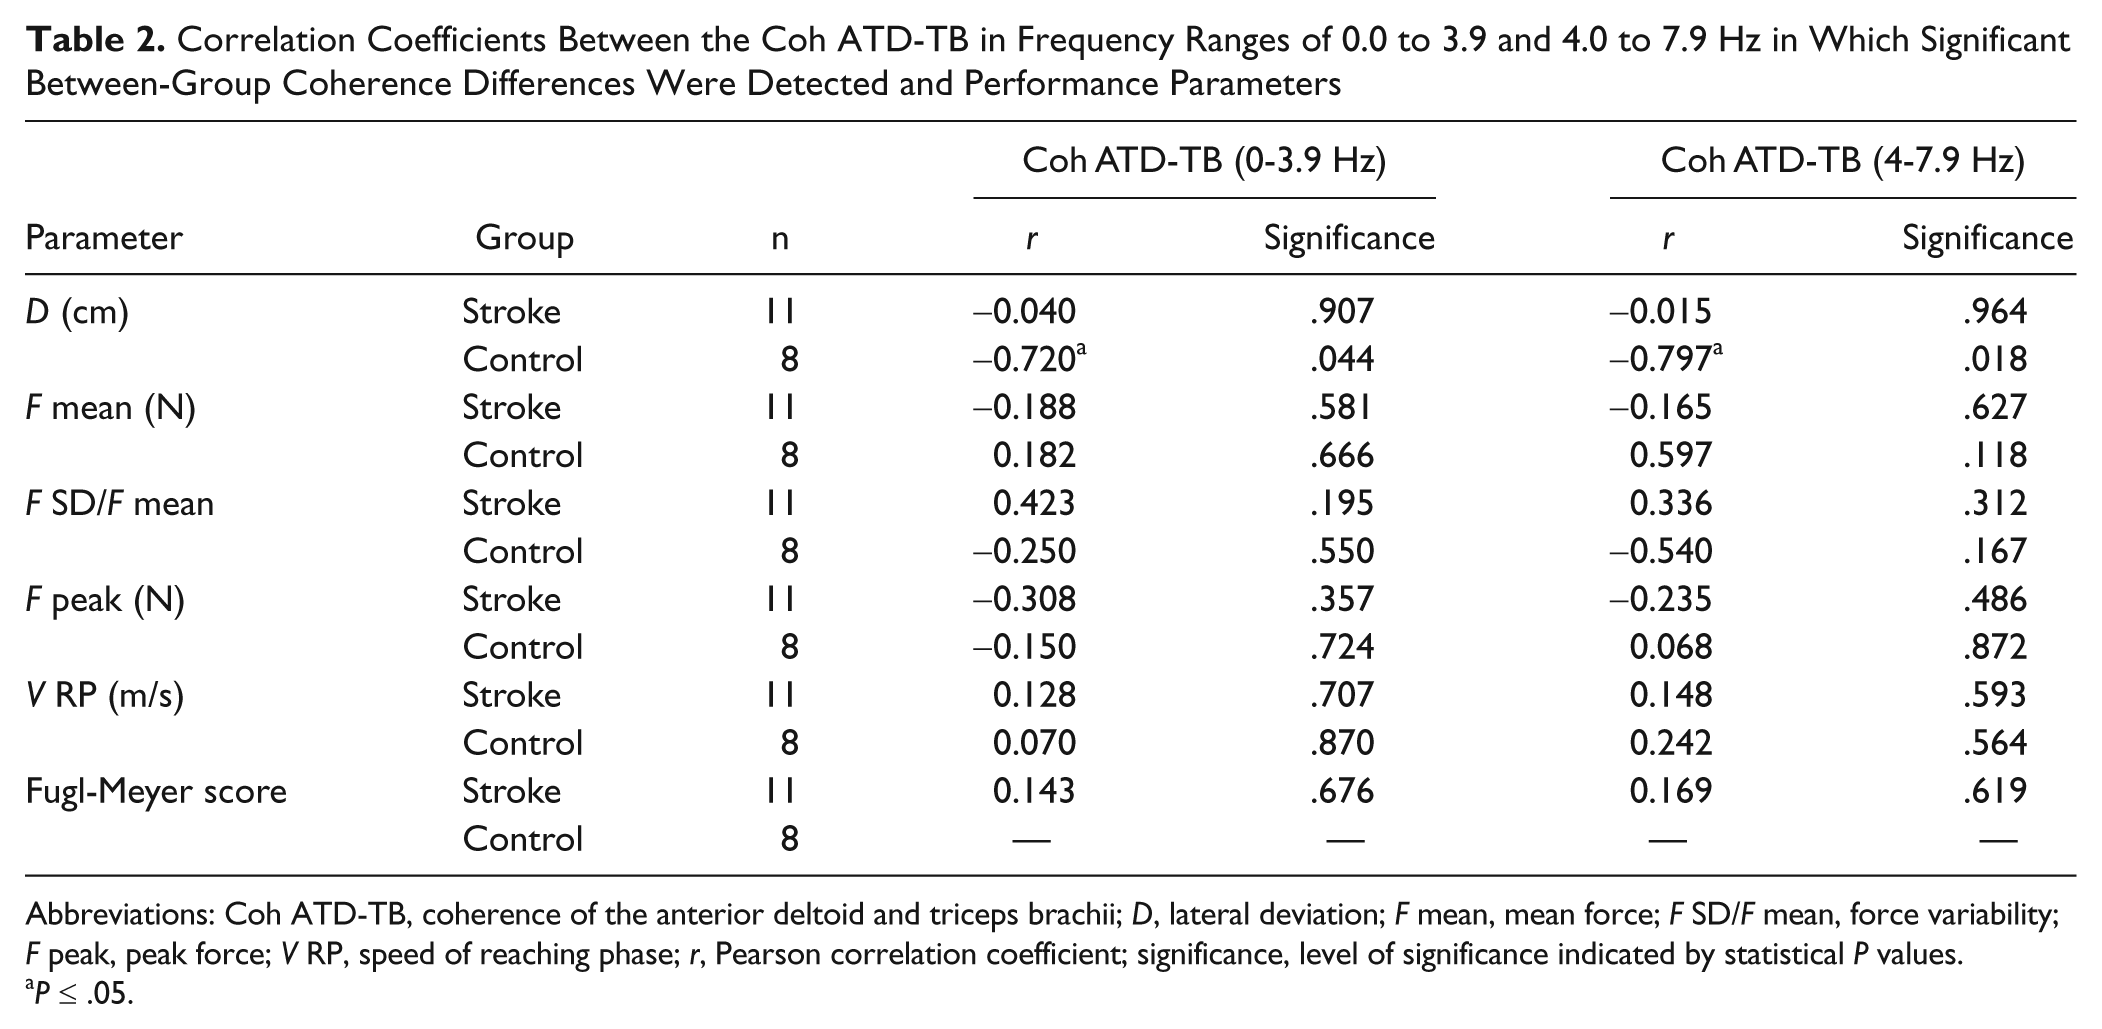
Abbreviations: Coh ATD-TB, coherence of the anterior deltoid and triceps brachii; D, lateral deviation; F mean, mean force; F SD/F mean, force variability; F peak, peak force; V RP, speed of reaching phase; r, Pearson correlation coefficient; significance, level of significance indicated by statistical P values.
P ≤ .05.
Amplitude and Timing Analyses of the EMG
Time-domain analysis of the EMG showed no significant (P > .05) difference between the groups in the RMS values during reaching for the ATD and TB muscles. For both groups, ATD and TB onset occurred prior to movement onset. The ATD onset for the stroke group (0.56 ± 0.33 seconds) was earlier (P < .05) than for the control group (0.29 ± 0.12 seconds). There was no significant difference (P > .05) between the stroke group (0.33 ± 0.24 seconds) and the control group (0.19 ± 0.14 seconds) in the TB onset time. However, the TB onset was later than that of the ATD in patients (P < .05).
Possible Effects of Movement Artifacts
Reaching movements may cause movement artifacts in EMG signals and influence the coherence measurement. To address this issue, Coh ATD-TB during dynamic reaching was compared with static holding phase after the target had been reached. Figure 5 shows clearly that the differences in Coh ATD-TB between the groups were similar in the reaching phase (RP) and the static holding phase (HP). The Coh ATD-TB was significantly lower in patients than controls at frequency bands of 0 to 3.9 and 4 to 7.9 Hz not only during reaching but also during holding (Figure 5). It was expected that if the between-group coherence difference was contributed primarily by movement artifacts, then the difference should not be observed during the holding phase. These data suggest minimal influence of movement artifacts on the lowered EMG coherence in stroke patients during reaching.
Comparisons of the coherence of the anterior deltoid and triceps brachii (Coh ATD-TB; mean ± standard deviation) between the 2 groups during the reaching phase (RP) and holding phase (HP) at 4 segmented frequency ranges: 0.0 to 3.9, 4.0 to 7.9, 8.01 to 12.90, and 13.0 to 25 Hz for stroke patients and control subjects. Asterisk indicates significant differences between the stroke and control groups at P ≤ .05. The Coh ATD-TB was lower in stroke compared with controls for both the RP and HP in the frequency ranges of 0 to 3.9 and 4 to 7.9 Hz. No such differences were observed in the 8 to 12.9 and 13- to 25-Hz ranges. The similarity in the coherence differences between the groups in the moving and holding phases suggests minimal influence of movement artifacts on the coherence results.
Discussion
Compromised Movement Path Trajectory Maintenance After Stroke
Compared with healthy controls, the reaching movement in stroke patients exhibited greater lateral deviation away from the straight path. Our results provided additional evidence showing that patients exhibit poor control of movement trajectory. 2,24 Maintaining a smooth and appropriate movement trajectory is one of the most important characteristics of coordinated human movement. As expected, there was no significant group difference in mean/peak force, since the motor task was performed on a horizontal plane against no added resistance. Although the force variability did not reach statistical significance, a clear tendency of greater coefficient of variation during reaching was observed in patients (2.73) versus controls (1.95), suggesting difficulties in producing smooth forces during movement. 2,24 It is worth noting that force in the lateral direction was not measured and thus, the analysis of forces in our study was not complete.
Proper central nervous system planning is important for formulating optimal motor command and critical control parameters to achieve accurate and smooth movements. 25 Poor reaching performance in stroke patients could be related to impaired motor planning function at the cortical level, where central nervous system injury occurs. 18 This has been illustrated by a longer cortical planning time and elevated effort (greater central command) for a complex shoulder/elbow motor coordination task in stroke. The elevated effort level was associated with poor motor performance, suggesting a strong link between cortical command and movement smoothness of the arm. 18 Inaccurate movement profile during reaching can be attributed to the disruption in descending neural pathways and to altered representations of the peripheral systems in the brain, 13 leading to motor unit/muscle recruitment changes 26 and abnormal muscle activation patterns. 4,6,10 Finding the reduced EMG coherence between the shoulder flexor and elbow extensor in the current study suggests that impairment in motor planning and motor command after stroke can weaken functional coupling between these 2 synergists and worsen performance.
Weak Functional Coupling Between 2 Prime Mover Muscles in Stroke
The lower coherence between EMGs of the anterior deltoid and triceps brachii muscles (Coh ATD-TB) at the 0- to 11-Hz frequency band, especially in the 0- to 8-Hz range (Figure 4) during reaching, suggests that FC between the 2 synergists is weakened in stroke in these low-frequency ranges. However, the significantly weakened coupling in patients was observed only between these prime mover muscles and not between other muscle pairs analyzed. This muscle-specific abnormality in FC could be a reflection of inability to compensate for the lost or reduced corticospinal input with compensatory mechanisms or maladaptive plasticity. 27 Impairment in motor planning and motor control after stroke can reduce FC between synergists. Under normal conditions, the corticospinal system plays a primary role in controlling independent, coordinated movements of the digits 28,29 or fine movements at other joints. 29 However, a loss of corticospinal projection could provoke an increased reliance on residual undamaged descending pathways, such as rubrospinal, vestibulospinal, and reticulospinal pathways. 4 These parallel pathways have extensive branching at the level of the spinal cord 30 and an increased reliance on them may produce anomalous co-activation of muscles normally not activated together 4 or deviation from normal activation patterns among the participating muscles. 31 Indeed, the onset of TB was delayed relative to onset of ATD, and onset of ATD was earlier relative to movement onset in our stroke group.
De Luca and Erim 32,33 suggested that the common drive received by motor neurons of synergists has central and peripheral components. EMG oscillations at 6 to 12 Hz have been suggested as evidence of control mechanism for slow movements, 34 and the olivary–cerebellar system has been proposed as a generator. 35 Motor units are usually active at 5 to 12 Hz, 36 which suggests association between the centrally originated oscillations and motor unit firing rate. In stroke, motor unit firing rate 37 and discharge variability 38 change. Most studies examining corticomuscular coherence have shown that low-frequency oscillations of the neuromuscular signal are of a central origin (inferior olive, thalamocortical loop, 39-41 motor cortex 42 ). In stroke, Mima et al 43 found lower corticomuscular coherence for the affected upper limb (~30 Hz). During reaching, stroke exhibited lower corticomuscular coherence in the gamma band compared with controls. 14 It is not clear what the cause of the difference between frequency range of the corticomuscular coupling (35-50 Hz) 14 and that of the coupling between synergists (0-8 Hz) in this study. A potential explanation is that spinal motoneurons projecting to muscles receive inputs not only from cortical control centers through direct corticospinal pathways but also from subcortical and peripheral sources. Alternatively, the observed decline in EMG–EMG coherence at 0- to 8-Hz band in stroke may not be associated closely with weakening of corticomuscular coherence at the gamma band (35-50 Hz). Rather, the reduced low-frequency EMG–EMG coherence may have been driven by abnormality in the subcortical motor pathways. In summary, the evidence available in the literature does not yet support a direct link between the cortical adaptation/descending command and EMG–EMG coherence in stroke.
The analysis of the matrix of coherence coefficients, divided into nonoverlapping segments and averaged across frequency bands from beginning to end of reaching, revealed that the differences in the coherence between groups were frequency and time dependent. The significant differences in coherence occurred primarily in the range of 0 to 8 Hz after passing 30% movement time (Figure 4). As described above, weakening of FC between the 2 muscles in stroke patients in the 0- to 8-Hz range may reflect stroke-related communication interruption in the corticospinal network. The relatively small reduction in coherence at the beginning of the task may be an indication of strong effort to start reaching, as patients have difficulties in initiating a voluntary movement. 44
A significant negative correlation between the Coh ATD-TB and lateral deviation of reaching in the frequency ranges of 0 to 3.9 and 4 to 7.9 Hz was found in controls. The finding suggests that the coherence measurement is functionally relevant. However the lack of significant negative correlation between the 2 variables at the same frequency bands in patients was unexpected. Our explanation for the unexpected correlations between the EMG–EMG coherence and lateral deviation of movement in patients is that lateral movements of the arm (represented by the lateral deviation measurement) were generated by muscles that move the arm sideways (such as the pectoralis major [moving the arm toward midline of the body] and supraspinatus [moving the arm away from midline of the body]). Because the coherence measure was made on muscles that completed the reaching movement and the abnormal lateral movements in patients were made by other muscles, the correlation between the 2 variables could not be high in the correct direction.
A potential confounder is that artifact signals are often introduced to surface EMG during movements, especially if the range and rate (speed) of movement are high. However, the movement range was small (14 cm) and the speed was relatively slow for both groups. Thus, these conditions do not support the argument of a significant contribution of movement artifact to the difference in the coherence level across the 2 synergists between groups. Results of the comparison between groups during holding (without movement) and reaching (with movement) phases also suggest insignificant contribution of movement artifacts to the coherence results.
Summary
In conclusion, the lower coherence between EMG signals of the anterior deltoid and triceps muscles during reaching suggests that functional coupling between the 2 synergists is weakened in stroke and the weakened coupling is both time and frequency dependent. Weakening of synergist muscle coupling could be caused by a loss of common drive at the frequency band of 0 to 8 Hz as a result of stroke-induced communication interruption in the corticospinal network. Analysis of intermuscular coordination using between-synergist EMG coherence may be a helpful tool to understand the nature of movement deficits in stroke patients.
Footnotes
The author(s) declared no conflicts of interest with respect to the authorship and/or publication of this article.
The author(s) disclosed receipt of the following financial support for the research and/or authorship of this article: This study was supported by the Department of Veterans Affairs, Office of Rehabilitation Research and Development grants B5080S and B3709R; and by a National Institutes of Health grant HD050123.