
Abstract
Background. Studies with real-time functional magnetic resonance imaging (fMRI) demonstrate that humans volitionally regulate hemodynamic signals from circumscribed regions of the brain, leading to area-specific behavioral consequences. Methods to better determine the nature of dynamic functional interactions between different brain regions and plasticity due to self-regulation training are still in development. Objective. The authors investigated changes in brain states while training 6 healthy participants to self-regulate insular cortex by real-time fMRI feedback. Methods. The authors used multivariate pattern analysis to observe spatial pattern changes and a multivariate Granger causality model to show changes in temporal interactions in multiple brain areas over the course of 5 repeated scans per subject during positive and negative emotional imagery with feedback about the level of insular activation. Results. Feedback training leads to more spatially focused recruitment of areas relevant for learning and emotion. Effective connectivity analysis reveals that initial training is associated with an increase in network density; further training “prunes” presumably redundant connections and “strengthens” relevant connections. Conclusions. The authors demonstrate the application of multivariate methods for assessing cerebral reorganization during the learning of volitional control of local brain activity. The findings provide insight into mechanisms of training-induced learning techniques for rehabilitation. The authors anticipate that future studies, specifically designed with this hypothesis in mind, may be able to construct a universal index of cerebral reorganization during skill learning based on multiple similar criteria across various skilled tasks. These techniques may be able to discern recovery from compensation, dose–response curves related to training, and ways to determine whether rehabilitation training is actively engaging necessary networks.
Keywords
Introduction
Advances in magnetic resonance data acquisition and processing techniques have enabled the implementation of real-time functional magnetic resonance imaging (rtfMRI) by online processing of fMRI signals. 1 With rtfMRI the blood oxygen level dependent (BOLD) signal can be used to provide participants with information about the actual level of activity in circumscribed brain regions. 1-3 Studies have reported that healthy participants as well as patients are able to learn to control activity in different brain areas 4-8 and such modulation may lead to behavioral changes, 9,10 thus anticipating the development of treatment methods for neurological disorders. In spite of these exciting developments, it is still not clear how cortical and subcortical regions reorganize during self-regulation training.
Studies have shown that the activity of the insular cortex is correlated with participants’ perception of emotional states. 11-13 In a meta-analysis of positron emission tomography and fMRI studies of emotional tasks, Phan et al 14 revealed that anterior cingulate and insula are positively correlated with emotional recall and emotional tasks with high cognitive demand. With consideration of the above, in a previous study, we trained participants with rtfMRI neurofeedback to modulate their BOLD activity in the right anterior insula 4 and then focused more on the task-related increases and decreases in brain activation in selected regions of interest (ROIs), such as the left and right anterior insula.
Related to the recent studies 4-8 on self-regulation learning with the aid of neurofeedback information, studies on skill learning 15-18 with neuroimaging techniques are of particular interest. In these studies, 2 main ideas were proposed in the extant literature to explain the mechanism behind skill acquisition. 15 The first proposes that learning can take place through the efficient use of specific neuronal circuits (eg, Hebbian learning). The second idea emphasizes that skill acquisition goes through stages, 16,17 that is, different processes are associated with the different levels of skill and complexity of the task. 18 It is then proposed that different stages of skill acquisition may use different neural substrates. Petersen et al 15 maintained that although these 2 mechanisms may appear different, they may not necessarily be exclusive, emphasizing further that changes in neural circuit efficiency and differences in processing are part of skill acquisition in almost all situations and that changes in activation across brain areas may be a common theme in learning paradigms. With this reasoning, more recent studies have investigated skill acquisition on a range of motor, visuomotor, perceptual, and cognitive tasks. 15,19-21 In the majority of these studies, effects were reported as increases or decreases of activation in brain areas related to task performance, but it has not been shown how the interaction between spatially distributed brain regions can change as a system due to learning and how the brain optimizes the function. Based on the aforementioned considerations, we hypothesized that if learning takes place in stages and each stage of learning leads to more efficient use of neuronal circuits, then transition from one stage of learning to the next could be observed as changes in network connectivity, in addition to the changes in the activations of brain regions being connected.
To this end, we applied 2 different multivariate methods to fMRI data to reveal changes in the brain activity during self-regulation training. First, we used the effect mapping method 22 based on support vector machines (SVMs) to observe changes in the spatial activation patterns in the brain across the training sessions. Second, we implemented multivariate Granger causality modeling (GCM) to compute directed causal influences between spatially distributed voxels of the brain. From this model, we calculated the causal density (CD 23 ; the density of network connection) and the average of causal strength (ACS; the average strength of causal connections in the network) to reveal temporal changes in the network across learning sessions. We expected that certain measures of the 2 methods, namely, quantification of changes of spatial activation patterns and CD and ACS, could together indicate the changes in network connectivity during learning to self-regulate insula.
Materials and Methods
Participants and Experimental Protocol
Our study was performed on fMRI data collected from 6 healthy participants who underwent 5 fMRI scanning sessions in a day in the previous study. 4 The first session required participants to perform insula regulation without feedback. Subsequent feedback sessions consisted of 4 regulation blocks (22.5 seconds each) during which participants had to learn to increase insular activity, alternating with 5 baseline blocks (22.5 seconds each) during which they were instructed to return to baseline-level activity. During feedback sessions, the normalized average BOLD signal from the right anterior insula was presented to the participants in real time as changing bars of a graphical thermometer. For more details about the experimental protocol and information about participants, see Caria et al. 4
Data Acquisition
Functional images were acquired on a 3.0-T whole body scanner, and a standard 12-channel coil was used as a head coil (Siemens Magnetom Trio Tim, Siemens, Erlangen, Germany). A standard echo-planar imaging sequence was used (TR = 1.5 seconds, matrix size = 64 × 64, effective echo time TE = 30 ms, flip angle α = 70°, bandwidth = 1.954 kHz/pixel). Sixteen oblique axial slices (voxel size = 3.3 × 3.3 × 5.0 mm3, slice gap = 1 mm) were acquired.
Preprocessing and Classification
Preprocessing was performed with SPM5 (Wellcome Department of Imaging Neuroscience, London, England), and classification was performed using MATLAB (The Mathworks, Natick, MA) scripts.
We performed realignment, coregistration, and normalization onto the Montreal Neurological Institute space. Finally, the data were smoothed spatially with a Gaussian kernel of 8 mm full width at half maximum. For the preprocessed data, a mask of nonbrain areas was created by removing voxels below a specified intensity value in a mean image of whole scans. The aforementioned mask was applied to all the functional images of all the participants, and z normalizations (z value: (x − mean(x))/standard deviation(x), x: samples) were applied across all the time series on each single-participant data separately because variance of BOLD signals of different participants should be considered. All brain voxels from each single scan are collected into an input vector, whose design label is given based on its condition (1 for the regulation condition and −1 for the rest condition). To account for the hemodynamic delay, the design label was shifted by 4 scans (6 s), and then the data from the completed 8 blocks (4 blocks from the regulation + 4 blocks from the baseline) of all the 6 participants were used to construct the input vectors of classifiers. To classify the data of the 2 given conditions (ie, regulation vs baseline) across sessions, SVM (linear SVM with the regularization parameter C = 1, using SVMlight 24 ) were used in each separate session. Classification performance from data within a session was evaluated through 6-fold cross-validation. 25 In each fold, the data of 5 participants were used to train an SVM classifier, and then the data of 1 remaining participant were used to test the classifier. This process was repeated across all the folds without the testing sets overlap- ping across folds (ie, leave-one-subject-out cross-validation).
Multivariate Spatial Analysis
To analyze spatial patterns of brain activity, we used a multivariate method called effect mapping (EM). 22 It reveals changes in the spatial patterns of activity across training sessions. EM was shown to be stronger when compared with other methods in both theoretical and empirical points of view in our previous study. 22
To identify informative voxels from the SVM model, which separates 2 conditions by finding the separating hyperplane, the EM measures the effect of each voxel in multivoxel space to the SVM output by considering both the factors (ie, the input vectors and the weight vector; y =
Hence, the effect value (EV) Ek of a voxel k is defined as (see Lee et al 22 for more details):
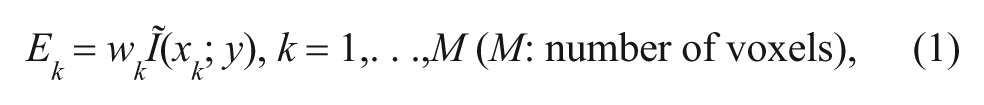
where Ĩ(xk ; y) is the NMI between the voxel and the output, wk and xk are the SVM weight value and activation in voxel k, respectively.
After normalizing the absolute value of Ek from Equation (1), we obtain the following relation:

where sgn(·) is a sign function and std (|E|) is the standard deviation of all Ek . In the present study, Equation (2) (nEk ) was used to compute the EV at each voxel to make E(ffect)-maps from different sessions comparable. Hereafter, the EV indicates nEk .
To compare quantitatively the effect of learning on changes in the recruitment of spatially distributed brain areas, we applied thresholds of EV ≥ Th × E max and EV ≤ Th × E min in each session separately. Here, Th (where Th = 0.1, . . ., 0.7) is the threshold values, and E max, E min, and EV are a maximum and minimum value of effect values and an effect value at a single voxel, respectively. The application of these thresholds is equivalent to the situation of removing voxels that are not significantly important for the learning and retaining those that are directly involved in it.
BOLD Signal Difference
To evaluate BOLD signal changes of the selected brain region in all the sessions, the BOLD signal difference was defined as (BOLDreg − BOLDbase)/BOLDbase * 100.
Effective Connectivity Analysis
In our temporal analysis, Granger causality (GC) models were computed for all sessions based on vector autoregressive models (VARs).
27
When ROIs were selected from the E-map generated from multivariate SVM analysis, the time-series vector

where p is the maximum number of past values considered for estimating the current vector,
Based on our hypothesis that self-regulation learning leads to more efficient use of neuronal circuits, the areas having higher EVs in the last session could be regarded as part of a core network related to regulating activation of the insular cortex, and hence assessment of the connectivity of this network over time would allow us to understand the changes in the network during the learning. To this end, local maxima having the highest effect values were selected from the E-map of the last session of the group analysis.
Then, preprocessing steps (realignment, time reslicing, normalization, and smoothing) were performed. The time series of BOLD values from 27 voxels forming a cube of 3 × 3 × 3 voxels, comprising the local maximum and 26 adjacent voxels, were obtained based on our observation that a single cluster may have multiple local maxima, each one of these maxima potentially showing different temporal dynamics. Given this, time series of a single voxel might not be robust against noise or other artifacts.
In the Granger connectivity analysis, the greater the number of samples the greater is the reliability of the results. From this it follows that a small number of brain images from a session of a single participant do not allow the effective connectivity analysis with many selected ROIs. Therefore, in our analysis, rather than performing the connectivity analysis in a single participant, data from a session of all the participants were used together in the analysis. Although this approach might have limitation in the provision of strong evidences with statistical significance, it could nevertheless be an alternative method to overcome the problem of limited number of samples commonly available in fMRI time series.
To determine effective connectivity in the regulation periods, only signals corresponding to the regulation conditions from the group data were used in the analysis. To correct for intersubject variations in BOLD values, the mean value in each subject was subtracted, and then the data from each subject were concatenated to form a set of group data. The GC analysis was carried out by adopting the Causal Connectivity Toolbox
23
to work with fMRI signals. In the estimation process of
To find the model order p in Equation (3), Bayesian information criteria 23,25 were used. After estimating the parameters, the F test was used to evaluate the connection strength between ROIs. To reveal changes in the temporal interactions among different brain areas due to feedback training, CD and ACS were computed for all the training sessions. For our analysis, CD and ACS should reflect the global trend of temporal dynamics at the system level. For this purpose, GCM is a more appropriate method than dynamical causal model 28 or psychophysiologic interaction, 29 as GCM can be used to analyze changes in the effective connectivity of multiple brain regions. 23
The CD 23 reflects the degree of interaction among the ROIs as defined by the following equation:
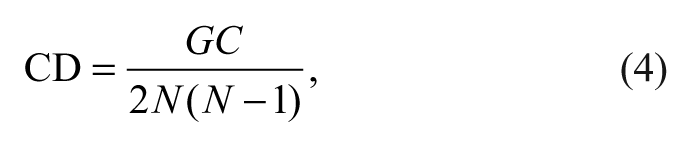
where GC is the total number of significant causal connections observed and N the number the ROIs. In addition, to investigate the change of connection strength across sessions, the ACS in each causal network is newly defined as follows:
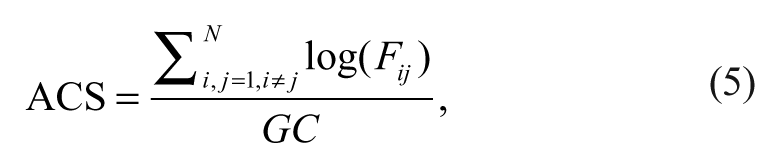
where Fij is the F value corresponding to connection from ROI j to ROI i.
Results
SVM Classification
To investigate our hypotheses, we first evaluated whether SVM could consistently classify the fMRI signals between regulation and baseline conditions. Our analysis indicated that SVM could discriminate between regulation and baseline conditions in the feedback sessions (T[23] = 20.9, P < 10−10) with an average accuracy of more than 80% in most of the cases, whereas the average accuracy of classification in the first session without feedback (T[5] = 3.4, P < .02) was lower than with feedback, indicating the importance of contingent feedback in successful regulation of brain activity (see Figure 1). In addition, the high classification accuracies during the sessions with feedback represent that the E-maps from all the sessions are reliable for subsequent analysis and interpretation.
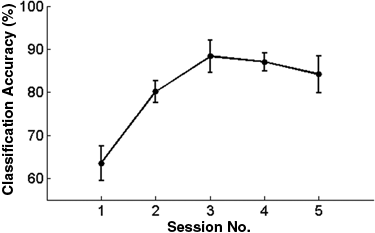
Classification accuracy of group data in the 6-fold cross validation (leave-one-subject-out approach; mean accuracy [%] ± standard error of the mean [%])
Cerebral Reorganization During Learning of Self-Regulation
Spatial interaction of brain activity
Spatial distribution of brain activity was investigated by applying EM in a group analysis by using fMRI signals from 6 participants as input to the pattern classifier (see Figure 2). When Th = 0.2, Figure 2A and B show characteristics of the E-maps across sessions. Application of the threshold to the first session (performed without feedback) resulted in smaller clusters of voxels with higher and intermediate EVs spread over the whole brain, suggesting the involvement of a large number of brain areas. However, application of the threshold in the feedback sessions resulted in focused activations in a few brain regions, indicating probably the gradual disengagement of unnecessary connections. Particularly, in session 5, the distribution is more focused and localized in comparatively fewer areas, such as the lingual gyrus, middle occipital gyrus, supplementary motor area, anterior cingulate, right anterior insula, putamen, and dorsolateral prefrontal cortex (see Figure 2A and Table 1). In comparing clusters composed of the discriminating voxels of each session, the number of clusters and the average of the minimum distances between clusters in all the sessions were computed. As the learning proceeds, the number of clusters decreases, and the average of the minimum distance between local maxima increases, indicating focused activation (see Figure 2B). In addition, the application of several thresholds shows more general characteristics of distribution of EVs across sessions. As the feedback training proceeds, more voxels acquire low EVs with a number of voxels keeping high EVs (see Figure 2C).
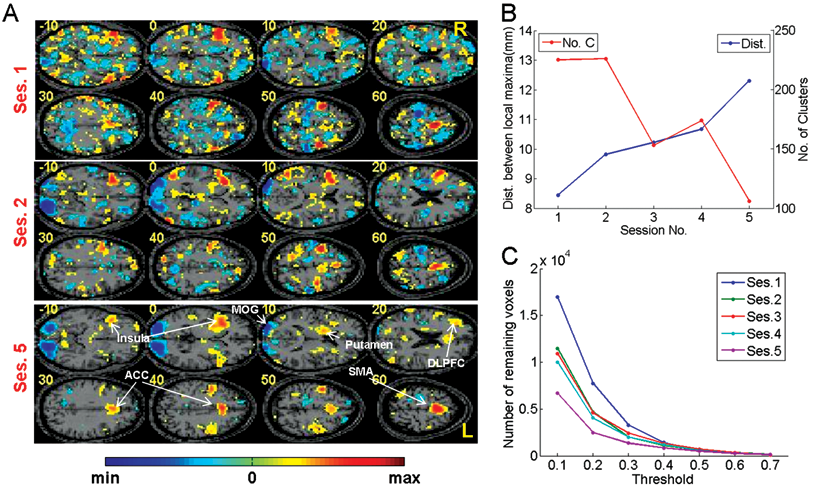
Multivariate analyses of group data over training sessions. (A) E-maps in session 1 (without feedback), and sessions 2 and 5. E-maps are shown after applying a threshold given by the relation: EV (effect value) ≥ 0.2E max and EV ≤ 0.2E min. Application of this threshold removes voxels that are not significantly important for regulation and retains those that are directly involved. In the functional maps, clusters with positive EVs (red) correspond to the positive support vector machine (SVM) weight values, whereas clusters with negative EVs (blue) correspond to the negative SVM weight values. When compared with sessions 1 and 2, the E(ffect)-map of session 5 shows more focused activations, indicating the effect of learning on functional reorganization of the brain. (B) From the aforementioned voxels selected in each session, mean values of minimum distances between local maxima and numbers of clusters are plotted. (C) Numbers of remaining voxels after thresholding EVs with EV ≥ Th E max and EV ≤ Th E min (Th = 0.1, 0.2, . . ., 0.7; eg, “A” and “B” are obtained with Th = 0.2) in all the sessions. This method shows the distributions of EVs across sessions. The E-maps of the 5 sessions have similar number of voxels having high EVs (eg, threshold > 0.5). Whereas the E-map from session 5 shows many voxels having low EVs, the E-map from session 1 shows many voxels having intermediate EVs. The E-maps from sessions 2, 3, and 4 show similar characteristics, but the number of the voxels having lower EVs increases gradually as the feedback training proceeds. This suggests that, as the feedback training proceeds, more voxels acquire low EVs (ie, voxels irrelevant to the task performance), indicating that fewer voxels are involved in the task
Maxima and Minima in the Final Session in a Group Analysis
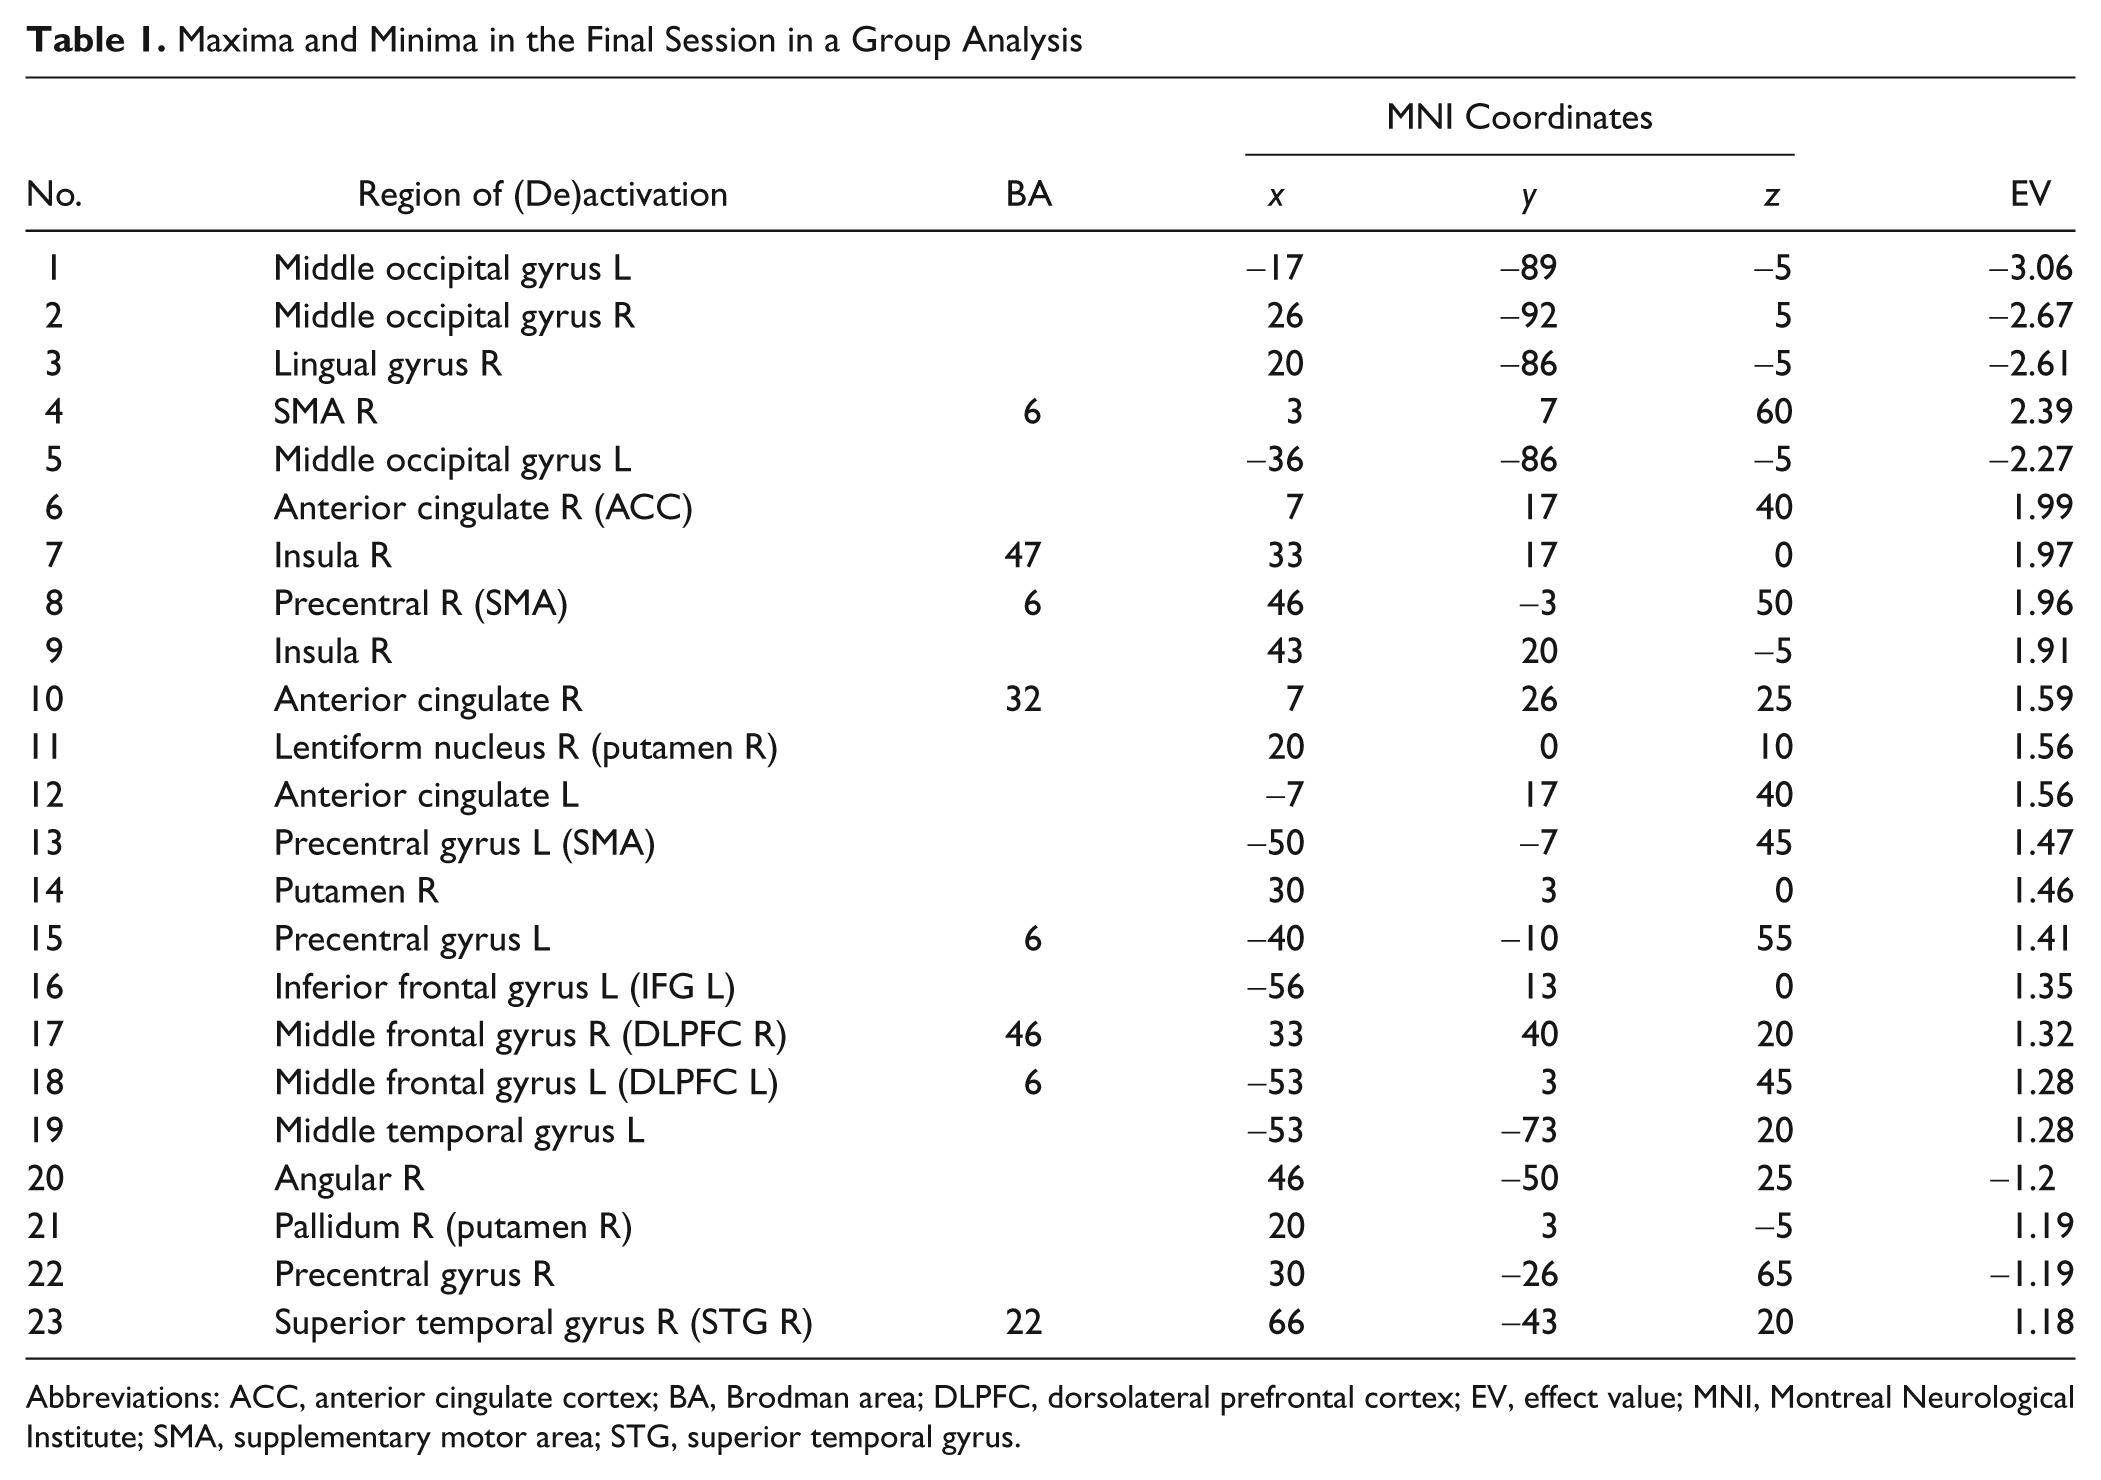
Abbreviations: ACC, anterior cingulate cortex; BA, Brodman area; DLPFC, dorsolateral prefrontal cortex; EV, effect value; MNI, Montreal Neurological Institute; SMA, supplementary motor area; STG, superior temporal gyrus.
In addition, BOLD signal changes of areas having higher EVs in session 5, that is, right dorsolateral prefrontal cortex (DLPFC), left inferior frontal gyrus (IFG), right Putamen, and anterior cingulate cortex (ACC), were investigated in a further analysis (see Figure 3). In this analysis, the BOLD signals of the areas during the feedback sessions are higher than in the nonfeedback session. However, the signals gradually decrease with learning in the feedback sessions but are still higher in the last session than in the first session (no feedback session), suggesting “inverted-U curves” of BOLD signal control.
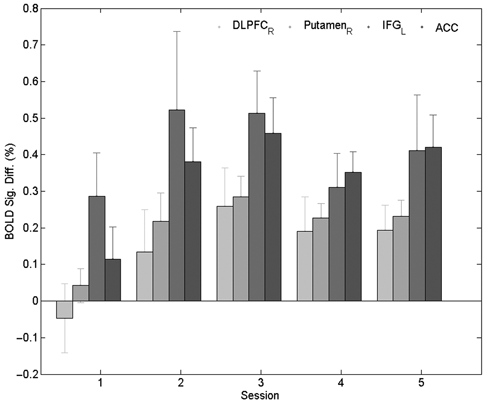
Blood oxygen level dependent (BOLD) signal differences in selected brain regions in the first (nonfeedback) feedback sessions in right dorsolateral prefrontal cortex (DLPFC), right Putamen, left inferior frontal gyrus (IFG), anterior cingulate cortex (ACC) suggest “inverted-U” curves of activation patterns. Each bar shows mean difference (%) ± standard error of the mean (%)
Temporal interaction in brain activity
To extend the evidence for the cerebral spatial distribution of brain activity, temporal interaction was also investigated. After selecting ROIs based on the aforementioned spatial analysis (see Table 1), temporal interactions between time series of BOLD signals in the ROIs were investigated using the multivariate Granger causality analysis from the estimation of vector autoregressive models. 27 To evaluate how temporal recruitment of brain regions in all sessions changes, the CD, 23 a measure of the number of connections between selected ROIs in a functional network, was used after finding significant connections between the ROIs. The investigation was done with F test for the connections between the ROIs (ie, the estimated model parameters) with P < .05 (see Figure 4A). Session 1 shows the lowest CD of the functional network. As the training proceeds with feedback, the causal density reaches a peak value in session 3 and decreases in sessions 4 and 5, indicating that the shape of temporal recruitment follows an “inverted-U” curve. After performing an F test for the connections between the ROIs with P < .0001, ACSs between connections during all the sessions were investigated (see Figure 4B). An investigation of ACSs between ROIs indicates that the strength of temporal recruitment in some ROIs increases monotonically from session to session.
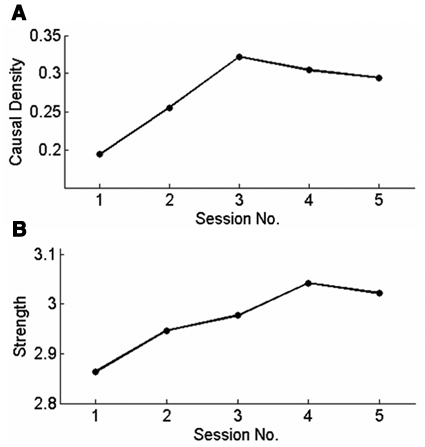
Functional interaction of brain regions in the group data. The analyses were done after F test for the connections between the regions of interest (ROIs) with P < .05 in (A) and P < .0001 in (B). (A) Causal density in all the sessions. (B) Average connection strength between connections. The causal density of the functional network decreases in session 5 indicating substantial “pruning” (A) yet “strengthening” (B) of the connections between ROIs
Discussion
The performances in classification accuracy (see Figure 1) and BOLD signal activations in right anterior insula (paired samples T test between session 5 and session 1, t = 4.86, P < .005; see Figure 5) with and without contingent feedback confirmed that the participants were able to perform the given task successfully.
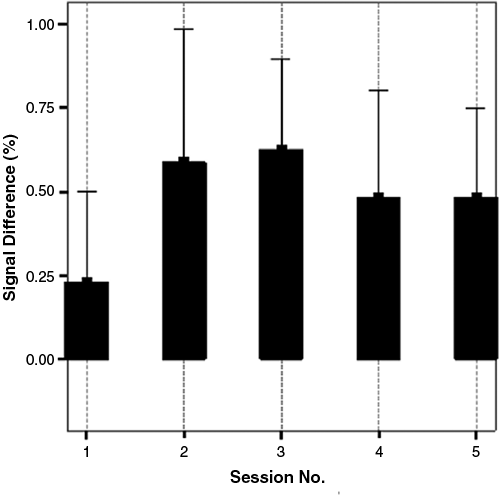
Blood oxygen level dependent (BOLD) signal difference in right anterior insular cortex. BOLD signal differences in all the feedback sessions are higher than in the nonfeedback session. Each bar shows mean difference (%) ± standard error of the mean (%)
From Figures 1 and 2A, one might argue that the visual activations could solely improve the classification during the feedback sessions compared with the nonfeedback sessions. However, higher classification in session 3 than in session 2 clearly indicates that something more than just visual activation is helping increase the classification. Furthermore, there are other brain areas (see Figure 3) to show greater differences between regulation and baseline in the feedback sessions than in the nonfeedback session. In particular, since activations in the target area (insula) are significantly different in the feedback sessions compared with the nonfeedback sessions, the classification accuracy would reflect these differences.
In the multivariate spatial analysis with the E-mapping method, decrease of redundancy and more focused brain activation might indicate that training results in more economic use of brain resources during volitional regulation of the region. Since the aim of our multivariate spatial analysis is to show how the brain reorganizes across training sessions as a system rather than to identify the brain areas related to the task at a significant statistical level, we have decided to show the characteristics of spatial patterns over a broad range of thresholds. Figure 2C clearly shows that the number of voxels having lower EVs (ie, indicating probably voxels not so important to the task) increases gradually as the training proceeds. In addition, due to the present limitations of the statistical significance tests (eg, difficulty to determine what level is the best to assess a given hypothesis), we believe that showing the spatial characteristics over a wide range of threshold values would be comprehensive and complete. The changes of BOLD signal difference of the selected regions (see Figure 3), particularly the BOLD signal increase in the early part of training and the decrease in the late part of training, would further support our hypothesis.
In the effective connectivity analysis, the CD and the ACS might indicate global trends of neural processing during learning. Since the formation and maintenance of neural activation and communication among multiple, distant brain areas in such a mental task requires blood and oxygen supply to the sites, 30,31 denser networks might expend more energy. With more training in the presence of contingent feedback, participants reported only 1 or 2 of the most effective imagery strategies that consistently affected the thermometer bars. This focusing of strategies to a few effective ones might explain the gradual reduction in the causal density of the functional network with the high levels of the average connection strength. Even though our connectivity analysis could not provide any summary statistics in the group level due to limitation in the time samples of brain images, the general trends of both of CDs over sessions (see Figure 4A) and the BOLD signal changes in the multiple areas (see Figure 3) might be in line with previous research on skill learning, which tends to show evidence for an inverted-U-shaped learning curve due to reallocation of cognitive resources in language expertise, 32 motor skill learning, 33 and attentional expertise in meditation. 34
The self-regulation mainly involves the prefrontal cortex, especially the DLPFC, presumably responsible for retrieval of emotional memories 35,36 ; the ACC, implicated in attentional processing 14 ; the right insula as a site for the meta-representation of interoceptive signals 37,38 ; the left IFG for verbalization of emotional episodes 39 ; and the putamen, engaged in reinforcement learning and feedback/reward processing. 40,41 The repeated appearance of SMA may indicate motor response elements in the images. 42-45 We hypothesize that if the imagery of positive or negative emotions is effective (as seen in the last session of the feedback training), it may elicit activations in the SMA, indicating neural disposition toward action (eg, approach, withdrawal).
Our results provide supporting evidence for the “scaffolding-storage” theory. 15 In this framework, a set of supporting brain regions form a scaffold to manage a novel demand in unskilled performance. After sufficient practice, neural processes are performed more efficiently, decreasing activation in the scaffolding regions but increasing activation in those areas underlying the critical task-specific processes. Based on this framework, in our study, right DLPFC, left IFG, right Putamen, and ACC increasing in BOLD activation levels (see Figure 3) during early feedback sessions and decreasing in later feedback sessions may represent the scaffolds. However, it is not entirely clear which areas and connections are directly involved in emotion processing per se and which are related to supporting elements in task learning.
To investigate the learning effects of rtfMRI feedback training, positive or negative imagery of emotion were used in the present study. A limitation of the current work is that different strategies to induce emotion were not systematically classified, and thus the indirect measure used here does not indicate to what extent different strategies affect the brain through practice.
Based on the fundamental assumption that the brain operates as a system where spatially distributed brain areas interact with one another, the present study provides evidence for brain reorganization at the system level in terms of transitions in different measures of network connectivity. However, it is to be noted that the present study is a reanalysis of the previously collected data of self-regulation training. 4 Consequently, due to the limitations of the experimental design and analysis technique, and the absence of behavioral measures of learning, we could not completely establish the different stages of reorganization pertaining to different stages of learning. Nevertheless, we believe that the multivariate network measures proposed and demonstrated here, such as, changes in the spatial patterns of activity (including number of clusters, distance between local maxima, and number of voxels having lower EVs), causal density, and average causal strength, would be valuable in assessing and understanding cerebral reorganization at different stages of learning. We anticipate that future studies, specifically designed with this hypothesis in mind, may be able to construct a universal index of cerebral reorganization during skill learning based on the measurement of multiple criteria (changes of spatial patterns, causal density, causal strength, etc) in multiple types of skilled tasks.
Footnotes
Sangkyun Lee and Ranganatha Sitaram contributed equally to this work.
The author(s) declared no potential conflicts of interests with respect to the authorship and/or publication of this article.
The author(s) disclosed receipt of the following financial support for the research and/or authorship of this article: This work was supported by DFG (the Deutsche Forschungsgemeinschaft) grants BI 195/56-1 and BI 195/59-1 to NB and RS, respectively. SL is grateful to DAAD (German Academic Exchange Service) for supporting this research.