
Abstract
Objective. Brain–computer interfaces (BCIs) are devices that enable severely disabled people to communicate and interact with their environments using their brain waves. Most studies investigating BCI in humans have used scalp EEG as the source of electrical signals and focused on motor control of prostheses or computer cursors on a screen. The authors hypothesize that the use of brain signals obtained directly from the cortical surface will more effectively control a communication/spelling task compared to scalp EEG. Methods. A total of 6 patients with medically intractable epilepsy were tested for the ability to control a visual keyboard using electrocorticographic (ECOG) signals. ECOG data collected during a P300 visual task paradigm were preprocessed and used to train a linear classifier to subsequently predict the intended target letters. Results. The classifier was able to predict the intended target character at or near 100% accuracy using fewer than 15 stimulation sequences in 5 of the 6 people tested. ECOG data from electrodes outside the language cortex contributed to the classifier and enabled participants to write words on a visual keyboard. Conclusions. This is a novel finding because previous invasive BCI research in humans used signals exclusively from the motor cortex to control a computer cursor or prosthetic device. These results demonstrate that ECOG signals from electrodes both overlying and outside the language cortex can reliably control a visual keyboard to generate language output without voice or limb movements.
Introduction
Nearly 2 million people in the United States and far more worldwide suffer from neuromuscular disorders that impair muscle control, such as amyotrophic lateral sclerosis (ALS), brainstem stroke, cerebral palsy, and spinal cord injury. Conventional assistive devices require some level of voluntary muscle control and thus are not appropriate for severely affected patients. Brain signals such as electroencephalographic activity (EEG) and electrocorticographic (ECOG) activity can provide alternate, nonmuscular channels for communication and control. A brain–computer interface (BCI) exploits these brain signals for communication directly from the brain to an output device, independent of peripheral nerves and muscles. 1
Some of the most promising signals for controlling a BCI are event-related potentials (ERPs) such as the P300. The P300 ERP is an evoked response to an external stimulus that has been traditionally observed in scalp-recorded EEG. The scalp-recorded P300 response has proven to be a reliable signal for controlling a BCI using the P300 Speller paradigm. 2 Based on multiple studies in healthy volunteers 3-5 and initial results in persons with physical disabilities, 6,7 the P300 Speller has the potential to serve as an effective communication device for persons who have lost or are losing the ability to write and speak. However, scalp-recorded ERPs tend to suffer from a relatively low signal-to-noise ratio and require signal averaging for response verification and reliable BCI classification. This required averaging is the limiting factor for the communication rate achieved with this paradigm.
ECOG has been shown to have superior signal-to-noise ratio, immunity to artifacts such as EMG, and spatial and spectral characteristics compared with EEG. 8-10 ECOG has recently been demonstrated to be superior to EEG for BCIs implementing 1- and 2-dimensional continuous cursor control paradigms using motor or speech imagery. 11-13 The current scalp-recorded EEG signals used to operate the P300 Speller have not been characterized in ECOG. Several studies have also attempted to characterize various ERPs, 14-17 but none have explored the responses to the P300 Speller or attempted to use them for BCI control.
Based on the success with the EEG-based P300 Speller and the superior signal characteristics of ECOG, we examined whether ECOG signals from a small region of the brain can control a communication device and improve the communication rate of the P300 Speller. We also studied whether brain signals recorded from electrodes outside the traditional language cortex could provide useful information to drive the communication device.
Methods
Patients
A total of 6 consecutive patients with medically intractable epilepsy who underwent phase 2 evaluation for epilepsy surgery with temporary placement of intracranial grid or strip electrode arrays and/or depth electrodes to localize seizure foci prior to surgical resection were tested for the ability to control a visual keyboard using ECOG signals. All 6 patients were presented at Mayo Clinic Florida’s multidisciplinary Surgical Epilepsy Conference where the consensus clinical recommendation was for the participant to undergo invasive monitoring primarily to localize the epileptogenic zone and also to map out language and sensorimotor cortex if appropriate. The study was approved by the institutional review boards of both Mayo Clinic and the University of North Florida. All participants gave their informed consent. Clinical data on each participant are provided in Table 1.
Participant Clinical Information
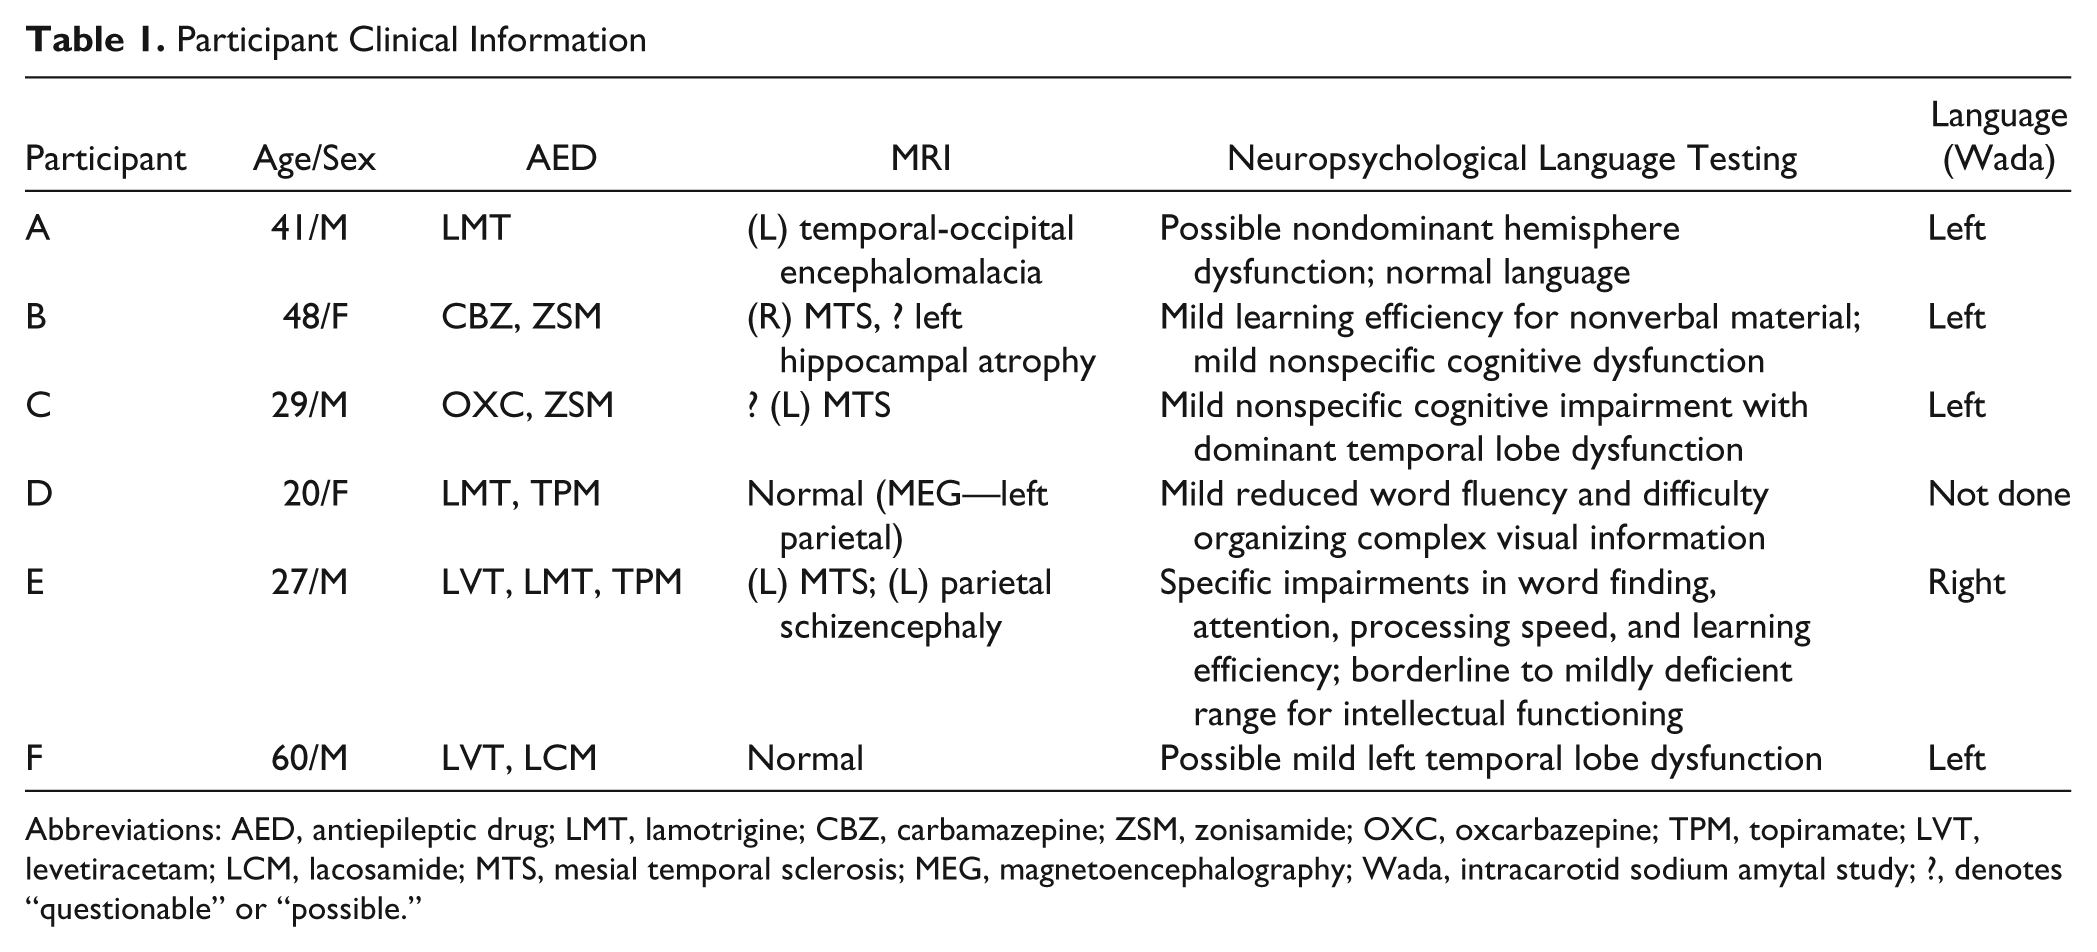
Abbreviations: AED, antiepileptic drug; LMT, lamotrigine; CBZ, carbamazepine; ZSM, zonisamide; OXC, oxcarbazepine; TPM, topiramate; LVT, levetiracetam; LCM, lacosamide; MTS, mesial temporal sclerosis; MEG, magnetoencephalography; Wada, intracarotid sodium amytal study; ?, denotes “questionable” or “possible.”
Electrode Locations and Clinical Recordings
Electrode (AD-Tech Medical Instrument Corporation, Wisconsin) placements and duration of ECOG monitoring were based solely on the requirements of the clinical evaluation without any consideration of this study. All electrode placements were guided intraoperatively by Stealth MRI neuronavigational system (Medtronics, Inc, Minnesota). Each participant had postoperative anterior–posterior and lateral radiographs to verify electrode locations. After electrode implantation, all participants were admitted to an ICU room with epilepsy monitoring capability. Clinical ECOG data were gathered with a 64-channel clinical video EEG acquisition system (Natus Medical, Inc, California). Electrode locations are detailed in Table 2.
Electrode Locations and Communication Rates a
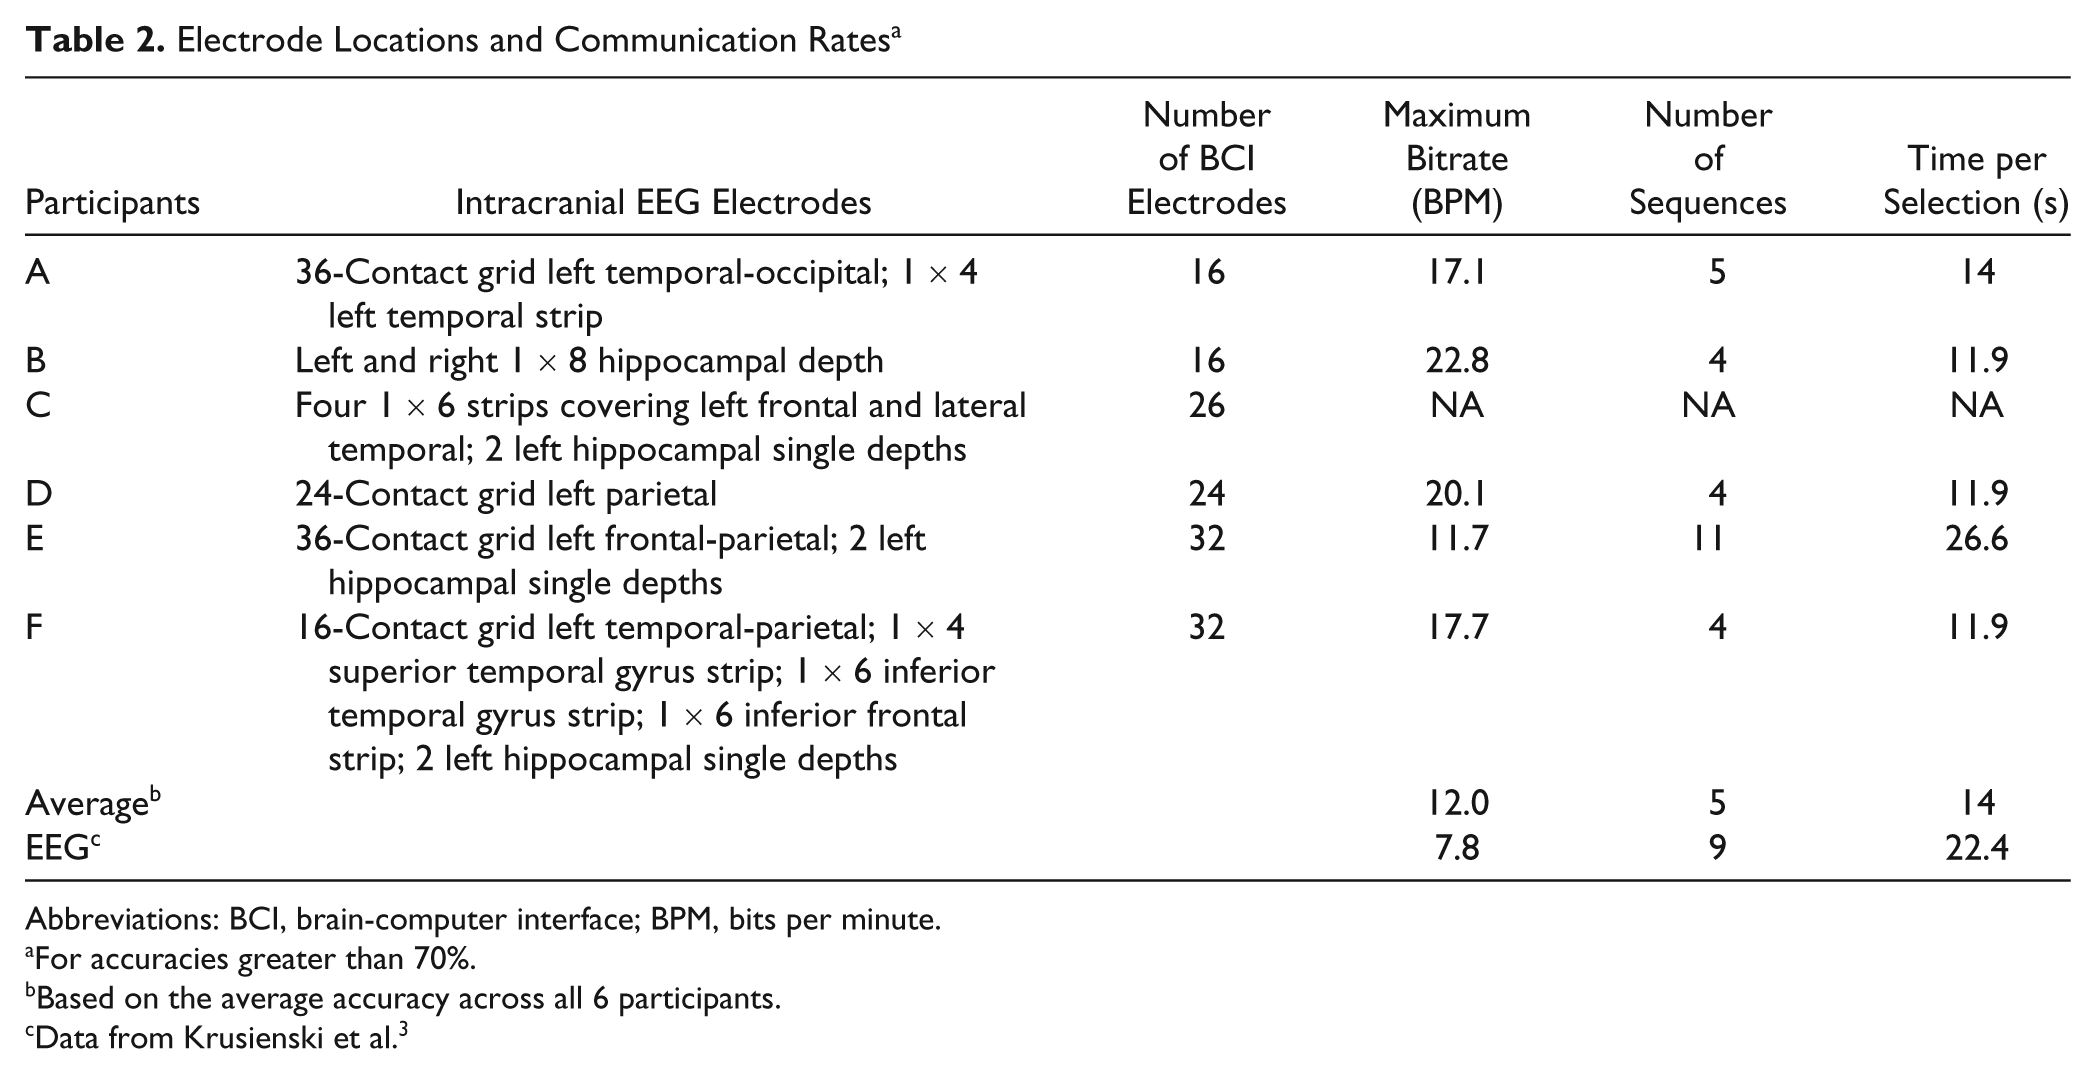
Abbreviations: BCI, brain-computer interface; BPM, bits per minute.
For accuracies greater than 70%.
Based on the average accuracy across all 6 participants.
Data from Krusienski et al. 3
BCI Data Acquisition
All participants performed BCI testing between 24 and 48 hours after electrode implantation. Testing was performed only when the participant was clinically judged to be at cognitive baseline and free of physical discomfort that would affect attention and concentration. Testing was performed at least 6 hours after a clinical seizure. Stimuli were presented, and the ECOG data were recorded using the general-purpose BCI system BCI2000. 18 All electrodes were referenced to a scalp vertex electrode, amplified, band-pass filtered (0.5-500 Hz), digitized at 1200 Hz using 16-channel g.USB amplifiers (Guger Technologies, Graz, Austria), and stored. A laptop with a 2.66 GHz Intel Core 2 Duo CPU, 3.5 GB of RAM, and Windows XP was used to execute BCI2000. The signals for the BCI experiments were acquired concurrent with the clinical monitoring via a 32-channel electrode splitter box (AD-Tech Medical Instrument Corporation, Wisconsin).
Task, Procedure, and Design
The experimental protocol was based on the protocol used in an EEG-based P300 Speller study. 3 Each participant sat in a hospital bed about 75 cm from a video monitor and viewed the matrix display. The task was to focus attention on a specified letter of the matrix and silently count the number of times the target character flashed, until a new character was specified for selection. All data were collected in the copy speller mode: words were presented on the top left of the video monitor, and the character currently specified for selection was listed in parentheses at the end of the letter string as shown in Figure 1. Each session consisted of 8 to 11 experimental runs of the P300 Speller paradigm; each run was composed of a word or series of characters chosen by the investigator. This set of characters spanned the set of characters contained in the matrix and was consistent for each participant and session. Each session consisted of between 32 and 39 character epochs. A single session lasted approximately 1 hour. Data from 1 to 3 sessions were collected for each participant, depending on his or her physical state and willingness to continue.
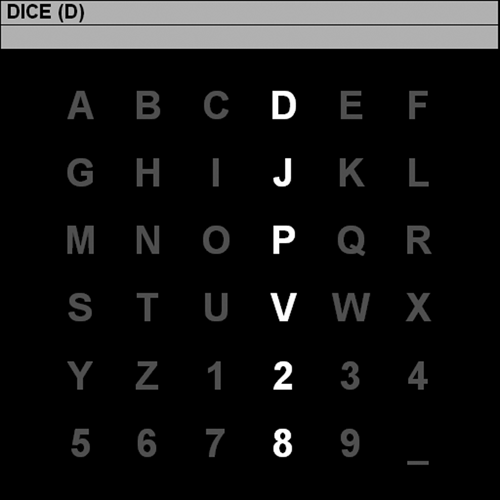
The 6 × 6 matrix used in the current study: a row or column flashes for 100 ms every 175 ms. The letter in parentheses at the top of the window is the current target character “D.” A P300 should be elicited when the fourth column or first row is flashed. After 15 flash sequences (ie, each row and each column has been flashed 15 times), the collected brain responses are processed and classified, and online feedback is provided directly below the character to be copied. The process is then repeated for the next target character “I” and so forth until all characters in the word “DICE” have been presented as targets.
Response Classification
For each channel used in the analysis, 800-ms segments of data following each flash were extracted for the offline analysis. The data segments were low-pass filtered and decimated to 20 Hz and concatenated by channel for each flash, creating a single feature vector corresponding to each stimulus. The features from the first 4 runs (16 characters) from the first uncorrupted session were used to generate a linear classifier for each participant using stepwise linear regression. 19 A combination of forward and backward stepwise regression analysis was implemented. Starting with no initial model terms, the most statistically significant predictor variable having a P value <.1, is added to the model. After each new entry to the model, a backward stepwise regression is performed to remove the least-significant variables having P values >.15. This process is repeated until the model includes a predetermined number of terms or until no additional terms satisfy the entry/removal criteria. The classifier score for each feature vector is determined as the inner product of the feature vector with the resulting regression coefficients.
Assuming that the response elicited by the flashing stimuli is invariant to the row/column location, the predicted row and column for each character epoch are determined as the maximum of the sum of classifier scores for the individual rows and columns, respectively:


and the predicted character is located at the intersection of the predicted row and column in the matrix. The response processing and classification are based on the methods previously described. 3 The performance of the classifier for selecting the attended character was tested on the 4 subsequent runs (16 characters) from the same session.
Response Visualization
Nearly all electrodes were included in the linear regression model for each participant, although it is evident that only select electrodes contribute the bulk of the discriminable information for the task, whereas the others merely serve as suppressor variables, 20 which are not correlated with the task but are correlated with one or more of the independent variables of a regression model. Therefore, the 5 most significant electrodes in terms of BCI classification for each participant were selected for illustration purposes according to the P value from the stepwise regression (Figure 2). The electrodes highlighted in black were not used for BCI recording because of hardware channel limitations for some participants. The waveforms from the 5 most significant electrodes and their r2 correlations (ie, the proportion of the variance of the instantaneous signal amplitude accounted for by the stimulus type, ie, target or standard) with the task are presented. The waveforms were generated using the average of all training and test data used for classification for each participant. The averaged waveforms were smoothed for visualization using a 0- to 30-Hz low-pass filter. The bottom scale in Figure 2 corresponds to the electrode coloring and indicates the maximum −log(P value) over the 800 ms interval for the particular electrode, where the P value in this case tests the hypothesis that the correlation between the amplitude and the task is 0. This P value is related but not identical to the P value from the stepwise regression model. The negative log transform is commonly used to scale P values to emphasize differences between small numbers for visualization purposes. The larger the −log(P value), the more likely that there is significant correlation between the amplitude and the task.
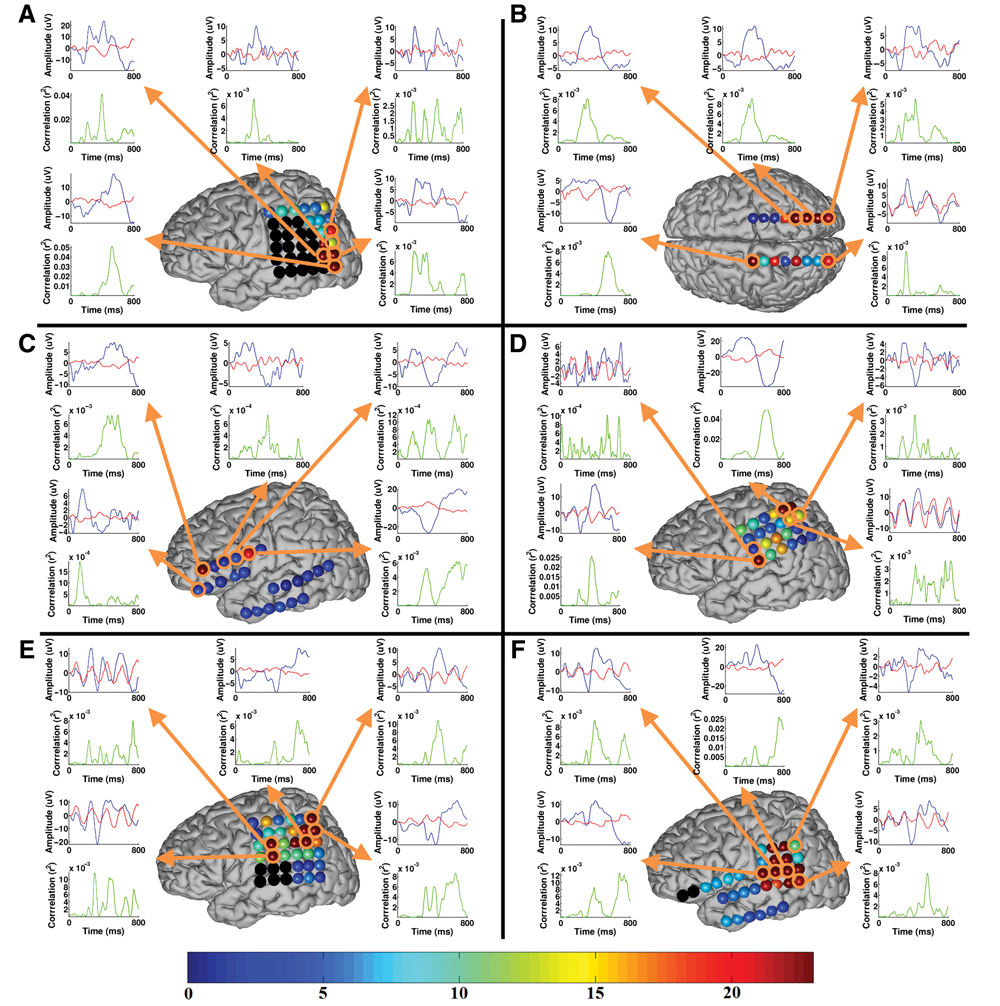
The approximate electrode positions for each participant on a generic brain model (the relative electrode size in the figure is enlarged for visualization purposes): note that participant B’s positions represent bilateral hippocampal depth electrodes, whereas the others represent surface grids and strips. The black electrodes were not used for BCI recording because of hardware channel limitations for some participants. The bottom scale corresponds to the electrode coloring and indicates the maximum −log(P value) over the 800-ms interval for the particular electrode, where the P value tests the hypothesis that the correlation between the amplitude and the task is zero. Select waveforms from the most relevant electrodes in terms of classification and their r 2 correlations with the task are presented. These waveforms represent the average responses to the target (blue trace) and standard (red trace) stimuli. The waveforms were generated using the average of all training and test data used for classification for each participant.
Calculation of Bitrate
The bitrate, given in bits per minute (BPM) is an alternative performance metric for communication systems that accounts for the amount of time (number of flash sequences) needed to attain a given level of accuracy 21 :

where N represents the number of symbols in the matrix (36 in this case), and P represents the probability that a symbol is correctly selected (ie, the accuracy). The time per selection in minutes is determined according to the number of flash sequences and the flash presentation timing. Higher bitrates denote more effective communication.
Language and Motor Cortex Mapping
Three patients (A, C, and D) underwent direct mapping of motor and language cortex according to routine clinical procedures 22 ; 2 patients did not undergo functional cortex mapping because their seizures originated in the hippocampus, and cortical mapping was not clinically indicated. One patient’s seizure onset localized to the anterior portion of the left inferior temporal gyrus, and cortical mapping was deemed unnecessary by the patient’s treating epileptologist. Our mapping protocol used constant current electrical stimulation between pairs of adjacent electrodes using an Ojemann OCS2 cortical stimulator (Integra LifeSciences, New Jersey) with 2- to 5-s trains of 50-Hz, 0.3-ms, alternating polarity square-wave pulses, starting with a stimulus intensity of 1 mA and increasing in 1 mA increments up to a maximum of 12 mA. Stimulus intensity at each electrode pair was individualized according to the highest amperage below 12 mA that did not produce after-discharges. 23 Patients reported any paresthesias or involuntary movements associated with electrical stimulus. Once a maximum stimulus intensity was reached, disruption of motor function was detected by observing the patient during voluntary movements in terms of the tongue and bilateral hand and feet. Cortical mapping of language was performed with a battery of tasks probing expressive and receptive language function, including picture naming, sentence comprehension, paragraph reading, and spontaneous speech. Picture naming was performed using pictures of objects from the Boston Naming Test. 24 Stimulus current was initiated immediately before stimulus onset and lasted 2 to 5 s. Functional impairment by electrical stimulation was noted only if similar errors were seen with at least 2 stimulus trains and if the errors during electrical stimulation were different from stimulus-off foils.
Results
Participant Performance Using ECOG Signals to Control Visual Keyboard
All 6 participants were able to accurately spell words on an output monitor through ECOG signals, and 5 of 6 achieved near 100% accuracy using fewer than 15 flash sequences (Figure 3A). Two thirds of participants achieved near 100% accuracy by 10 flash sequences. The maximum bitrate corresponding to the average accuracy using ECOG was greater than the equivalent maximum bitrate using scalp EEG. The online classification results correspond to the accuracy at 15 flash sequences, which is clearly suboptimal in terms of bitrate. For the controlled experiments, online classification was performed after 15 flash sequences because accuracy tends to asymptote prior to 15 flash sequences, and the precise accuracy using fewer flash sequences can be determined and optimized via offline analysis. The maximum bitrates presented in Table 2 are constrained to those corresponding to accuracies greater than 70%, which is a common threshold used for practical communication. 25 The maximum bitrate corresponding to the accuracy averaged across our 6 participants is 12 BPM at 5 flash sequences (14 s per selection). Using a 6 × 6 character matrix, this bitrate corresponds to approximately 2.3 character selections per minute. Participant B achieved the highest bitrate overall with 22.8 BPM at 4 flash sequences (11.9 s per selection), which corresponds to approximately 4.4 character selections per minute using a 6 × 6 character matrix.
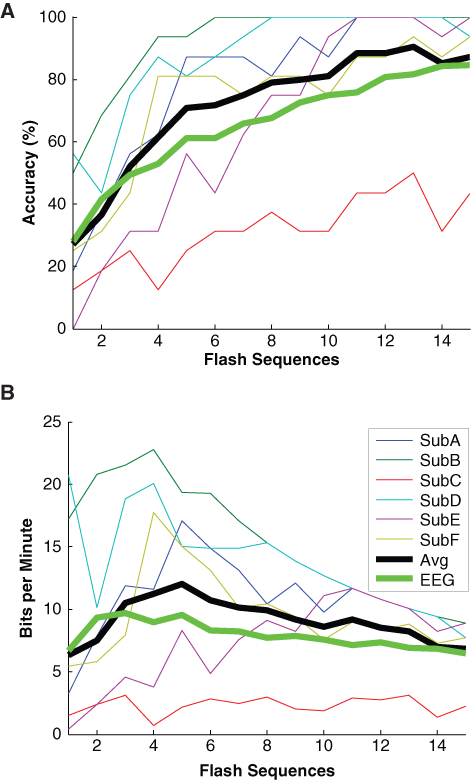
The offline classification accuracy (A) and bitrate (B) with respect to the number of flash sequences: all bitrates in B were computed directly from the accuracies in A, including the accuracy averaged across all 6 participants (Avg). The averaged results are compared with the results averaged across the 5 online participants using the same experimental protocol with scalp-recorded EEG from Krusienski et al 3 (EEG). Note that participant C’s comparatively low performance may be secondary to significant hospital distractions during the experiments. In several runs devoid of these distractions, participant C’s accuracy was found to be close to 100%.
Participant C was the only one unable to achieve an accuracy greater than 50% during the presented session. Shortly after this participant’s standard testing was initiated, a patient-related issue in an adjoining ICU room resulted in considerable personnel activity and noise distractions, which persisted during the entire experimental session. However, in several runs after the standard session that were devoid of these distractions (not presented), participant C’s accuracy was found to be close to 100%. The electrode grid was removed from participant C shortly thereafter, which prevented additional data collection.
Significant Electrodes for BCI and Their Relation to Language Cortex and Seizure Onset Zone
Figure 2 shows the approximate electrode positions for each participant on a generic brain model. Note that participant B’s positions represent bilateral hippocampal depth electrodes, whereas the others represent surface grids and strips. Participants A, C, and D had extraoperative language and sensorimotor mapping performed (Figure 4). For participant A, 2 of the 5 most significant electrodes for the BCI classifier were located in the language cortex. The other 3 electrodes were located adjacent to the language cortex. Participant B had bilateral 8-contact depth electrodes, and the most important 5 electrodes were not located close to the language cortex. For participant C, 3 of the 5 most significant BCI classifier electrodes were located over the cortex that was not associated with language or sensorimotor dysfunction with direct cortical stimulation. Also, 2 of the 5 most significant electrodes for participant D were over the motor cortex; no electrode was over the language cortex. Participant E did not have any direct electrical stimulation of the cortex because seizure onsets localized to the left hippocampus. However, intracarotid sodium amytal testing for participant E showed language function lateralized to the right hemisphere, presumably secondary to early cortical reorganization associated with his left parietal schizencephaly. Therefore, it is highly likely that all the 5 electrodes contributing significantly to the BCI classifier were not positioned over the language cortex. In regard to seizure onset zones, the important BCI classifier electrodes overlapped with the seizure onset zone in participants A (2 overlapping electrodes) and D (1 overlapping electrode). No overlap occurred with the other 4 participants.
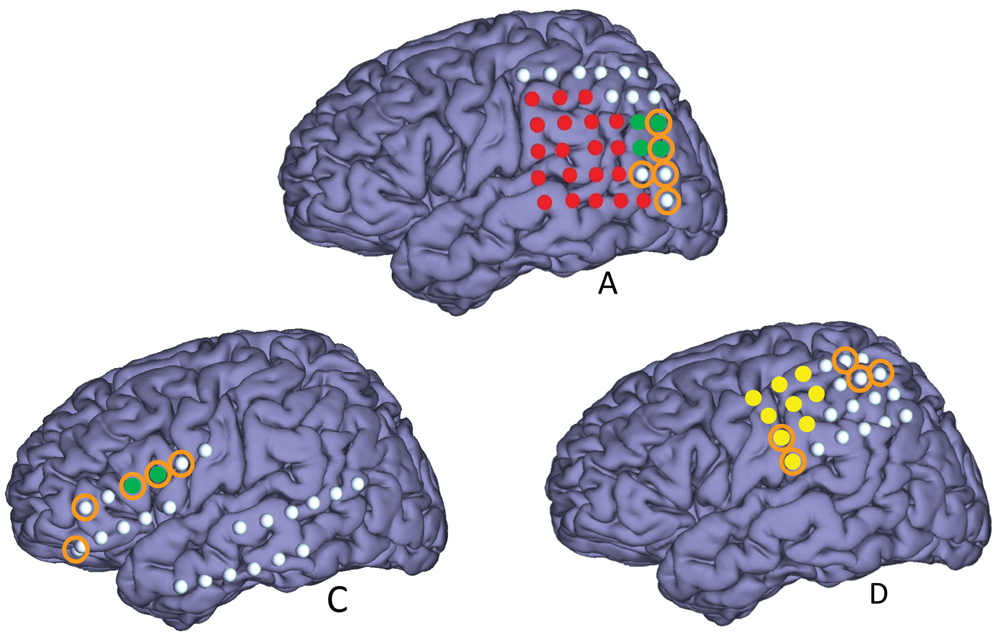
The approximate electrode positions for the participants who underwent language mapping or sensorimotor mapping: electrodes representing language and sensorimotor areas are highlighted in green and yellow, respectively. The 5 most significant electrodes for classification are denoted with the orange circles. The red electrodes were not used for BCI recording for participant A but were mapped for language (not shown).
Discussion
To our knowledge, this study is the first to demonstrate the use of human ECOG signals to control a visual keyboard through BCI. Multiple investigators have used BCI-based methods with scalp EEG and ECOG in humans to control movements through a prosthetic device 26 or to make cursors move 12-13,27-32 on a computer monitor. However, previous BCI-related language research has mainly used scalp EEG. 25,33-35 Several EEG-based BCI systems have been developed with sophisticated paradigms to translate neuroelectric signals for the purpose of communication. The performance of these scalp-based translational systems has been hampered by the fact that electrical signals are degraded and attenuated while traveling through skull and scalp layers. Muscle-related and electrode interface artifacts produce additional distortions to the neuroelectric signals ultimately recorded and analyzed by BCI translational programs. These factors result in suboptimal signal-to-noise characteristics and lower information transfer rates and likely contribute to slower speed and decreased accuracy in performing language tasks. In all, 55% of normal volunteers achieved 100% online accuracy for spelling a 5-character word during a P300-based test paradigm 36 ; 6 patients with ALS achieved a mean online accuracy of 62% for a P300 speller system similar to that used in the present study. 6 A single case of chronic intracortical electrode array implanted in the speech motor area of a locked-in patient demonstrated another potential application of BCI. 37 The patient was able to perform a vowel production task using a BCI-driven voice synthesizer with 70% correct production on average after approximately 15 to 20 practice attempts per session.
Our study shows that electrical recordings from the human cortex can be translated by P300-based BCI systems to produce accurate and reliable language output at least equal to and probably superior to recordings obtained from scalp EEG. We achieved an average of greater than 70% accuracy within 5 flash sequences on 5 of 6 epilepsy patients 1 to 2 days after a neurosurgical procedure to implant electrodes. At this average accuracy for 5 flash sequences, the corresponding bitrate was 12 BPM. These participants all had headaches of varying degrees, and all were on narcotic analgesics. Although not quantified for this study, their sleep patterns were likely fragmented in an epilepsy monitoring setting. Despite all these factors, which may degrade test performance, our participants attained higher accuracy in fewer trials compared with results from normal volunteers whose scalp EEG was recorded. These results compare favorably with the results averaged across the 5 online participants using the same experimental protocol with scalp-recorded EEG. 3 In that study, the maximum bitrate corresponding to an average accuracy greater than 70% is 7.8 BPM at 9 flash sequences. Our results attest to the possible superiority of the ECOG signal over the EEG signal in controlling a BCI-based language communication system. Further improvements in ECOG-based bitrate could potentially be achieved with optimization of classification parameters for each individual. In addition, our results suggest that control of a visual keyboard can be achieved by directly monitoring a small area of the brain as opposed to monitoring the entire scalp. These findings open a new avenue for research on improving communication devices for patients with ALS, spinal cord injuries, stroke, and severe inflammatory polyradiculopathies. As the risks associated with implantation of chronic intracranial electrodes continue to decrease, with advances in electrode design and surgical techniques, the ECOG-based P300 Speller may become a viable option for severely disabled individuals with no reliable means of communication.
Footnotes
The author(s) declared no potential conflicts of interest with respect to the authorship and/or publication of this article.
The author(s) disclosed receipt of the following financial support for the research and/or authorship of this article: This work was funded in part by the National Science Foundation (0905468) and the National Institutes of Health (NIBIB/NINDS EB00856).